 Chenfei Hu1,2,3
 Melissa Santi3
 Oluwatobi Adelaja4
 Andre Kajdacsy-Balla4
 Gabriel Popescu1,2,3
 William Kobak5*
- 1Quantitative Light Imaging Laboratory, University of Illinois at Urbana-Champaign, Urbana, IL, United States
- 2Electrical and Computer Engineering, University of Illinois at Urbana-Champaign, Urbana, IL, United States
- 3Beckman Institute for Advanced Science and Technology, University of Illinois at Urbana-Champaign, Urbana, IL, United States
- 4Department of Pathology, University of Illinois at Chicago, Chicago, IL, United States
- 5Department of Obstetrics and Gynecology, University of Illinois at Chicago, Chicago, IL, United States
We studied collagen fiber organization in tissue affected by pelvic organ prolapse (POP) and compared it to asymptomatic controls. Both the control and POP tissue biopsies were prepared and measured by a highly sensitive quantitative phase imaging (QPI) system, called spatial light interference microscopy (SLIM). Combined with automatic image processing, this modality provides quantitative, high-throughput assessment of fiber morphology. We found the fiber orientation in prolapsed specimens is less homogeneous, indicating an abnormal organization of collagen in the extracellular matrix (ECM).
Introduction
Pelvic organ prolapse (POP) is a common disorder in women, characterized by a loss of support for pelvic organs: uterus, bladder, vaginal, and rectum. [1]. According to a study conducted at Ohio State University, approximately 200,000 women per year were found to have undergone surgery for prolapse related symptoms in the United States alone [2]. While the types of POP are described primarily by the location of the most affected organ, the underlying changes to pelvic organ support structures and to the composition of the extracellular matrix (ECM) proteins that provide much of the fibrillar support for those structures is believed to be similar. With the progress made in rejuvantive medical therapies (e.g., stem cell derived therapy), a proper understanding of the characteristics of pelvic floor connective tissue will potentially change POP from a surgically managed condition into a condition that can be treated in a less invasive manner.
The uterosacral ligament (USL) is one of the main components of uterine support [3]. While its overall composition is pleomorphic, it maintains a consistent relationship with the uterine cervix at its distal end. The composition of the distal USL has been documented to be rich in collagen and elastin with a relative paucity of muscle fibers [3]. This makes the distal USL an interesting target to study the changes in collagen and elastin fibrillar composition in women with POP compared to asymptomatic controls. Moreover, the USL can be obtained consistently at its insertion onto the cervix during vaginal hysterectomy, ensuring that tissue composition will not be impacted by sampling error.
In the past, immunohistochemical studies have shown a change in collagen and elastin content with a higher percentage of immature collagen fibrils in POP patients. However, there is a paucity of data on fibril organization. Conventional techniques, although provide high specificity, generally require repeated antibody labeling and background quenching [4]. Moreover, these imaging methods requires grinding up the specimen and breaking the tissue down into components to be separated, which potentially masks the important changes in organization.
Quantitative phase imaging (QPI) is an emerging imaging modality, proven valuable in studying various cells and tissues [5, 6]. QPI measures the optical pathlength (OPL) map associated with a sample as an intrinsic contrast mechanism, and, as a result, transparent biospecimens, such as cells and tissues, can be clearly visualized without concerns regarding exogenous staining. In the past decade, this label-free imaging field has quickly expanded and shown remarkable performance in many fields of research, such as cell biology [7–10], neuroscience [11, 12], immunology [13], and more recently, clinical studies [14–18]. Since the OPL is essentially the product of refractive index difference and local thickness, the pixel values of a QPI image are not subject to settings of the instrument (e.g., camera exposure time and illumination intensity), nor the staining intensity. On the other side, the OPL directly reports on biophysical properties of a specimen, which adds additional value to histopathology [19]. More specifically, local phase fluctuations inform on morphological alterations with nanoscale sensitivity in the studied object, which could be used as a marker for diagnosis.
Spatial light interference microscopy (SLIM) [20] is one successful QPI implementation. By attaching an external module to an existing microscope, SLIM carries all the merits of QPI, and it is also compatible with other imaging modalities (e.g., fluorescent imaging) with high temporal stability. In addition, using a broadband light as the illumination source, SLIM significantly reduces the speckles commonly seen in laser QPI systems, which substantially enhances the spatial sensitivity [21, 22].
In this study, we combine SLIM and image processing algorithms to investigate properties of USL biopsies. A total of 12 USL, with 8 prolapsed samples, were scanned by a SLIM tissue scanner. The patients are diagnosed with severe prolapse (stage 3 or 4) using POP-Q staging system [23]. Next, an automated image processing algorithm was adapted to extract collagen fibers and several fiber metrics were then calculated for each segmented fiber. We sought to compare collagen fibril organization in women with prolapse compared to non-prolapsed controls. Our aim was to describe any discrete changes to fibril characteristics which may give insight into the development and progression of POP.
Results
We analyzed, 4 normal USL specimens and 8 USL from subjects with stage 3 or greater prolapse from the University of Illinois Hospital IRB approved study. The specimens were processed in the UIC tissue bank and stored in liquid nitrogen at −80°C, which does not expect to have an impact on optical properties of tissue [24]. These specimens were scanned by spatial light interference microscopy (SLIM). The schematic of the QPI tissue scanner is displayed in Figure 1. This imaging platform is equipped with a translating XY stage to perform QPI measurement on unstained tissue slides. SLIM is an upgrade to an existing phase-contrast microscope and attaches to its side port. The principle of the modality is described in Methods. To present a phase map of an entire USL, segmented SLIM images were collected under a 40x objective (NA = 0.75), and digitally mosaiced afterward. By a systematic design and GPU computation, the system generated phase images at approximately 6 frames/s [25]. Figure 2 shows a representative tissue slice image, where the black arrows indicate the scanning path. The spatial and temporal stability of SLIM provides uniform background across the specimen, such that anatomical features of the tissue were clearly delineated with high contrast and transverse resolution (inset in Figure 2). These biopsy slides were next stained with picrosirius red (PSR) and measured again by polarized light microscopy [26, 27], a conventional technique to visualize collagen fibers.
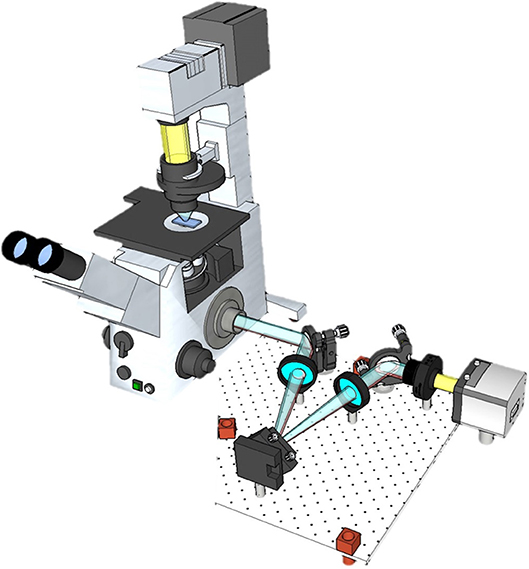
Figure 1. SLIM upgrades the performance of a conventional phase contrast microscopy by attaching an external module.
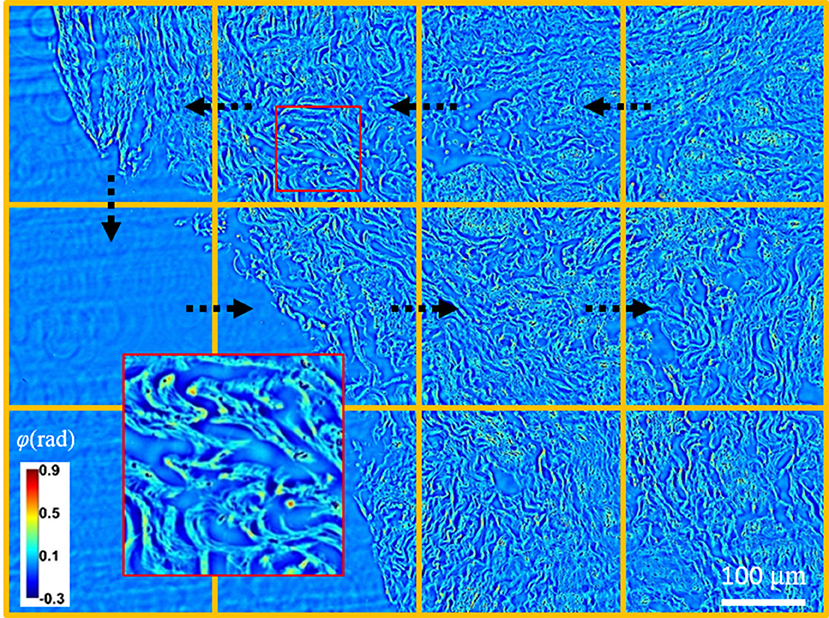
Figure 2. By employing a translating stage, an unstained tissue slide can be scanned in real-time with great detail.
Next, to study the alterations in collagen, an automatic segmentation method was necessary to pick up the fiber components from the raw phase measurements. To achieve this goal, we adapted CT-FIRE (curvelet transform- fiber extraction) method (see Methods for details about the algorithm). Developed by Liu et al., this method was applied to study the collagen fiber alterations in breast cancer tissue measured by second harmonic generation (SHG) microscopy [28, 29]. After loading a 2D image of the tissue (Figure 3A), the program generates a detailed map of extracted fibers overlaid with the input (Figure 3B), and each fiber's length, thickness, straightness, and orientation are then calculated (Figure 3C). Due to SLIM's high spatial sensitivity, the imperfection in the background (e.g., uneven layer of mounting media) would affect the final image quality. These image artifacts confuse CT-FRIE, and as a result, produces segmentation error, which mostly presents in the form of short line segments in no fiber zones, as shown in the overlaid image (Figure 3B). Certainly, these inaccurate and short broken fibers yield errors in data analysis. To diminish this effect, only fibers whose length above 10 μm are included in our analysis. For every scanned USL, approximately 50 tiles were selected and run by CT-FIRE. The tiles were evenly chosen across the tissue area to include all fiber textures. After this, the fiber extraction results from each tile are assembled to represent the fiber organization of this biopsy. In addition, we digitally shifted the angle of the fibers, such that the orientation histogram of each tissue slice is aligned at 90 degrees. Furthermore, the fiber metrics from different tissue slices are combined to compare the difference between normal and prolapsed specimens.
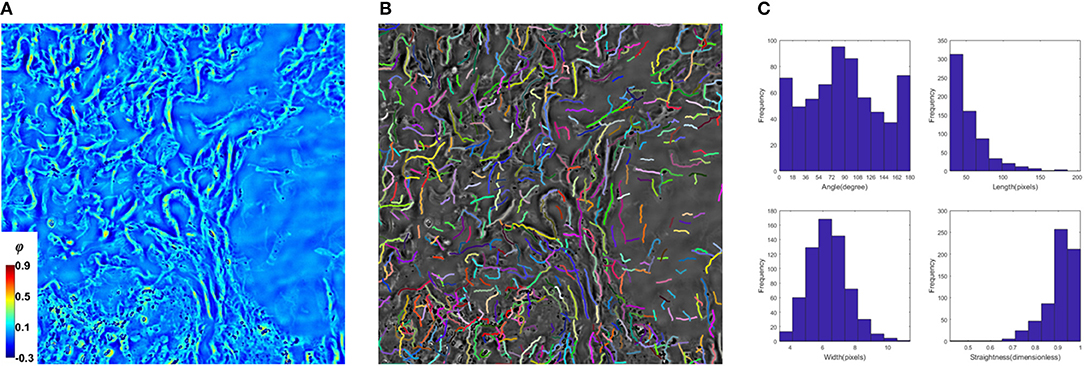
Figure 3. Procedure of fiber extraction. CT-FRIE reads a 2D phase image (A) and generates a network of fibers, each rendered a different color and overlaid with the input image (B), and 4 structural metrics are calculated for individual segmented result (C).
Using the segmentation results from SLIM images, we compared the histograms of the fiber metrics for both normal and prolapsed specimens. The noticeable difference occurred in fiber orientation, whose histogram is shown in Figure 4A. This change, though subtle, is proven to be statistically significant by running a Kolmogorov-Smirnov test at 1% significance level (p < 0.001). As one can see in Figure 4A, the profile of fiber orientation with POP is approximately a Gaussian distribution, indicating fibers are more likely aligning along a certain direction, while this appears skewed distributed in normal tissue with more angles. The difference was found consistent in the PSR stained images (Figure 4B). Next, the standard deviation of the fiber orientation was calculated for each tissue slice, and we found, for both SLIM and PSR images, the prolapsed group shows 3% narrower in angle distribution (Figure 4C). Due to the small sample size and tiny separation, the statistical test did not show a significant difference. The collagen extraction of PSR images and comparison of the other fiber metrics are included in the Supplemental Materials.
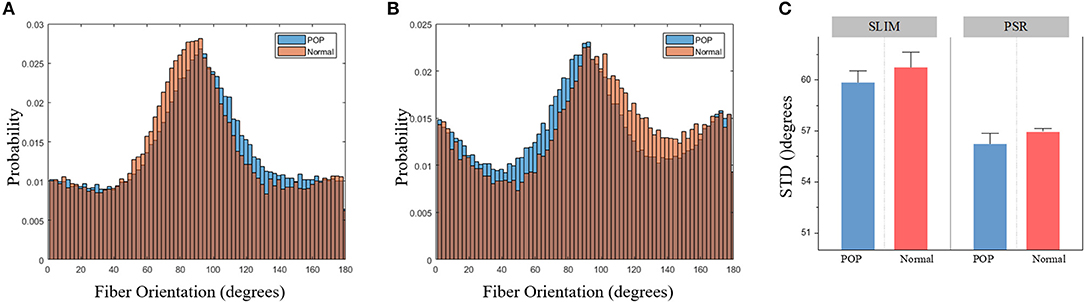
Figure 4. (A) The histogram of fiber orientation segmentation from SLIM images. (B) The histogram of fiber orientation segmentation from PSR images. (C) Standard deviation of fiber orientation for each tissue slide.
Summary and Discussion
In summary, SLIM provides a rapid and cost-effective way to evaluate fibril organization. We measured the collagen fibrils of the USL of both prolapse and asymptomatic controls. We used SLIM to perform measurements of fiber organization, and the CT-FIRE method to extract information about individual fibers. We found that the collagen fibers in sample diagnosed with POP were more aligned, as compared to the relatively more homogeneous distribution in the normal tissue samples. Similar statistical features were found on the same specimen measured by a conventional histological method. For comparison between SLIM and picrosirius red stain images, after SLIM imaging, the tissue slice is removed from the microscope stage, stained and then placed back. For a large tissue slice, this operation makes it difficult to register the same field of view in SLIM and PSR image and perform a parallel comparison of tissue morphology. Potentially, the issue can be addressed by scanning a stained tissue with a color independent QPI system, which was recently demonstrated in our laboratory [30]. Thus, in the future, we will be able to investigate the alterations in both collagen and non-collagen components under the same field of view. In addition, our phase measurement directly provides protein mass density and scattering properties of the investigated sample [31, 32], which might be valuable for understanding the mechanism of tissue organization in women with POP. An evaluation of elastin fibrils would be very useful to understand these results. We are currently studying elastin fibril organization and hope to present our work in the near future.
Methods
Sample Preparation
The USL was harvested approximately 1 cm from its insertion at the cervico-uterine junction. This ensures that a similar location in the USL was obtained from each subject and limited aberrant results from USL heterogeneity. A 1 × 1 cm specimen was obtained from each USL and sent to the tissue bank in the University of Illinois Hospital for tissue banking.
Imaging System
SLIM is a phase-shifting common-path QPI system. The optical system is realized by attaching a SLIM module (CellVista SLIM pro, Phi Optics) to the output port of an existing inverted phase-contrast microscope. At the output of a phase contrast microscope, two Fourier lenses compose a 4-f system and relay the image plane to the detector plane. A liquid crystal spatial light modulator (SLM) is placed at the back focal plane of the 1st Fourier lens to provide additional phase shifts between the scattered (sample) and unscattered (reference) field, in increments of π/2. The projected pattern on the SLM is precisely calculated to match the size and position of the phase ring in the objective pupil. Four intensity images are sequentially collected, each with a different phase delay, and a quantitative phase map is then uniquely determined.
To convert SLIM into a polarized light microscope, we inserted two polarizers in the optical path, one in the illumination path and the other in front of the camera. The PSR stained sample was imaged through a bright-field objective.
CT-FIRE
Introduced by Eliceiri and colleagues, CT-FIRE provides a means to automatically extract individual collagen fibers from intensity images, and reports descriptive parameters of the segmented fibers to study tissue organization. After loading it into the program, a 2D image first goes through a curvelet transform (CT), a preprocessing step to reduce noise and enhance features of lines and edges. Next, a fiber extraction (FIRE) algorithm is implemented to reconstruct a map of collagen fibers, whose principle is summarized as follow. After applying a threshold to differentiate between pixels that are potential fibers and background, nucleation points are chosen by finding the foreground pixels which have a maximum distance to the nearest background pixels. Therefore, a network of fibers is obtained by connecting nucleation points which have only foreground pixels in between. Finally, the resulting map of fibers is generated by removing short and dangling fibers, and structural metrics (length, thickness, orientation, and straightness) are calculated for each segmented fiber as output.
Data Availability
All datasets generated for this study are included in the manuscript and/or the Supplementary Files.
Author Contributions
GP, AK-B, and WK conceived the project. OA, WK, and AK-B prepared the sample. CH performed the SLIM measurement. CH and MS conducted the data analysis. CH wrote the manuscript with input from all authors.
Funding
This work is supported by National Science Foundation (NSF) STC CBET 0939511.
Conflict of Interest Statement
The authors declare that the research was conducted in the absence of any commercial or financial relationships that could be construed as a potential conflict of interest.
Supplementary Material
The Supplementary Material for this article can be found online at: https://www.frontiersin.org/articles/10.3389/fphy.2019.00072/full#supplementary-material
References
1. Chen B, Yeh J. Alterations in connective tissue metabolism in stress incontinence and prolapse. J Urol. (2011) 186:1768–72. doi: 10.1016/j.juro.2011.06.054
2. Jelovsek JE, Maher C, Barber MD. Pelvic organ prolapse. Lancet. (2007) 369:1027–38. doi: 10.1016/S0140-6736(07)60462-0
3. Vu D, Haylen BT, Tse K, Farnsworth A. Surgical anatomy of the uterosacral ligament. Int Urogynecol J. (2010) 21:1123–8. doi: 10.1007/s00192-010-1147-8
4. Ramos-Vara JA. Technical aspects of immunohistochemistry. Vet Pathol. (2005) 42:405–26. doi: 10.1354/vp.42-4-405
5. Shan M, Kandel ME, Popescu G. Quantitative Phase Imaging of Cells and Tissues. McGraw Hill Professional (2011).
6. Park Y, Depeursinge C, Popescu G. Quantitative phase imaging in biomedicine. Nat Photon. (2018) 12:578–89. doi: 10.1038/s41566-018-0253-x
7. Hu C, Sam R, Shan M, Nastasa V, Wang M, Kim T, et al. Optical excitation and detection of neuronal activity. J Biophotonics. (2018) 12:e201800269. doi: 10.1002/jbio.201800269
8. Kemper B, Carl D, Schnekenburger J, Bredebusch I, Schäfer M, Domschke W, et al. Investigation of living pancreas tumor cells by digital holographic microscopy. J Biomed Opt. (2006) 11:34005. doi: 10.1117/1.2204609
9. Javidi B, Markman A, Rawat S, O'Connor T, Anand A, Andemariam B. Sickle cell disease diagnosis based on spatio-temporal cell dynamics analysis using 3D printed shearing digital holographic microscopy. Optics Express. (2018) 26:13614–27. doi: 10.1364/OE.26.013614
10. Li Y, Fanous MJ, Kilian KA, Popescu G. Quantitative phase imaging reveals matrix stiffness-dependent growth and migration of cancer cells. Sci Rep. (2019) 9:248. doi: 10.1038/s41598-018-36551-5
11. Hu C, Popescu G. Quantitative phase imaging (QPI) in neuroscience. IEEE J Sel Top Quantum Electron. (2019) 25:1–9. doi: 10.1109/JSTQE.2018.2869613
12. Marquet P, Depeursinge C, Magistretti PJ. Review of quantitative phase-digital holographic microscopy: promising novel imaging technique to resolve neuronal network activity and identify cellular biomarkers of psychiatric disorders. Neurophotonics. (2014) 1:020901. doi: 10.1117/1.NPh.1.2.020901
13. Yoon J, Jo Y, Kim MH, Kim K, Lee S, Kang SJ, et al. Identification of non-activated lymphocytes using three-dimensional refractive index tomography and machine learning. Sci Rep. (2017) 7:6654. doi: 10.1038/s41598-017-06311-y
14. Lee M, Lee E, Jung J, Yu H, Kim K, Yoon J, et al. Label-free optical quantification of structural alterations in Alzheimer's disease. Sci Rep. (2016) 6:31034. doi: 10.1038/srep31034
15. Shaked NT, Satterwhite LL, Telen MJ, Truskey GA, Wax A. Quantitative microscopy and nanoscopy of sickle red blood cells performed by wide field digital interferometry. J Biomed Opt. (2011) 16:030506. doi: 10.1117/1.3556717
16. Majeed H, Nguyen TH, Kandel ME, Kajdacsy-Balla A, Popescu G. Label-free quantitative evaluation of breast tissue using Spatial Light Interference Microscopy (SLIM). Sci Rep. (2018) 8:6875. doi: 10.1038/s41598-018-25261-7
17. Park HS, Rinehart MT, Walzer KA, Chi JT, Wax A. Automated detection of P. falciparum using machine learning algorithms with quantitative phase images of unstained cells. PLoS ONE. (2016) 11:e0163045. doi: 10.1371/journal.pone.0163045
18. Hu C, Zhu S, Gao L, Popescu G. Endoscopic diffraction phase microscopy. Opt Lett. (2018) 43:3373–6. doi: 10.1364/OL.43.003373
19. Majeed H, Sridharan S, Mir M, Ma L, Min E, Jung W, et al. Quantitative phase imaging for medical diagnosis. J Biophotonics. (2017) 10:177–205. doi: 10.1002/jbio.201600113
20. Wang Z, Millet L, Mir M, Ding H, Unarunotai S, Rogers J, et al. Spatial light interference microscopy (SLIM). Opt Express. (2011) 19:1016–26. doi: 10.1364/OE.19.001016
21. Mir M, Kim T, Majumder A, Xiang M, Wang R, Liu SC, et al. Label-free characterization of emerging human neuronal networks. Sci Rep. (2014) 4:4434. doi: 10.1038/srep04434
22. Kim T, Zhou R, Mir M, Derin Babacan S, Scott Carney P, Goddard L, et al. White-light diffraction tomography of unlabelled live cells. Nat Photon. (2014) 8:256–63. doi: 10.1038/nphoton.2013.350
23. Bump RC, Mattiasson A, Bø K, Brubaker LP, DeLancey JO, Klarskov P, et al. The standardization of terminology of female pelvic organ prolapse and pelvic floor dysfunction. Am J Obstet Gynecol. (1996) 175:10–7. doi: 10.1016/S0002-9378(96)70243-0
24. Kim T, Sridharan I, Ma Y, Zhu B, Chi N, Kobak W, et al. Identifying distinct nanoscopic features of native collagen fibrils towards early diagnosis of pelvic organ prolapse. Nanomedicine. (2016) 12:667–75. doi: 10.1016/j.nano.2015.11.006
25. Kandel ME, Sridharan S, Liang J, Luo Z, Han K, Macias V, et al. Label-free tissue scanner for colorectal cancer screening. J Biomed Opt. (2017) 22:66016. doi: 10.1117/1.JBO.22.6.066016
26. Lattouf R, Younes R, Lutomski D, Naaman N, Godeau G, Senni K, et al. Picrosirius red staining: a useful tool to appraise collagen networks in normal and pathological tissues. J Histochem Cytochem. (2014) 62:751–8. doi: 10.1369/0022155414545787
27. Arun Gopinathan P, Kokila G, Jyothi M, Ananjan C, Pradeep L, Humaira Nazir S. Study of collagen birefringence in different grades of oral squamous cell carcinoma using picrosirius red and polarized light microscopy. Scientifica. (2015) 2015:802980. doi: 10.1155/2015/802980
28. Bredfeldt JS, Liu Y, Pehlke CA, Conklin MW, Szulczewski JM, Inman DR, et al. Computational segmentation of collagen fibers from second-harmonic generation images of breast cancer. J Biomed Opt. (2014) 19:16007. doi: 10.1117/1.JBO.19.1.016007
29. Bredfeldt JS, Liu Y, Conklin MW, Keely PJ, Mackie TR, Eliceiri KW. Automated quantification of aligned collagen for human breast carcinoma prognosis. J Pathol Inform. (2014) 5:28. doi: 10.4103/2153-3539.139707
30. Majeed H, Keikhosravi A, Kandel ME, Nguyen TH, Liu Y, Kajdacsy-Balla A, et al. Quantitative histopathology of stained tissues using color spatial light interference microscopy (cSLIM). arXiv:1806.04136. [preprint]. (2018).
31. Shan M, Kandel ME, Popescu G. Refractive index variance of cells and tissues measured by quantitative phase imaging. Opt Express. (2017) 25:1573–81. doi: 10.1364/OE.25.001573
Keywords: Quantitative Phase Imaging (QPI), SLIM, pelvic organ prolapse, tissue, fiber extraction, imaging processing
Citation: Hu C, Santi M, Adelaja O, Kajdacsy-Balla A, Popescu G and Kobak W (2019) Imaging Collagen Properties in the Uterosacral Ligaments of Women With Pelvic Organ Prolapse Using Spatial Light Interference Microscopy (SLIM). Front. Phys. 7:72. doi: 10.3389/fphy.2019.00072
Received: 19 February 2019; Accepted: 23 April 2019;
Published: 14 May 2019.
Edited by:
Qiyin Fang, McMaster University, CanadaReviewed by:
Adam Wax, Duke University, United StatesKarissa Beth Tilbury, University of Maine, United States
Copyright © 2019 Hu, Santi, Adelaja, Kajdacsy-Balla, Popescu and Kobak. This is an open-access article distributed under the terms of the Creative Commons Attribution License (CC BY). The use, distribution or reproduction in other forums is permitted, provided the original author(s) and the copyright owner(s) are credited and that the original publication in this journal is cited, in accordance with accepted academic practice. No use, distribution or reproduction is permitted which does not comply with these terms.
*Correspondence: William Kobak, d2tvYmFrQHVpYy5lZHU=