 Changcheng Sheng
 Qun Zhao1
 Zheng Jiao
- 1Department of Pharmacy, Huashan Hospital, Fudan University, Shanghai, China
- 2Department of Nephropathy, Huashan Hospital, Fudan University, Shanghai, China
Objectives: The population pharmacokinetic (popPK) characteristics of total mycophenolic acid (tMPA) have been investigated in various ethnic populations. However, investigations of popPK of unbound MPA (uMPA) are few. Thus, a popPK analysis was performed to: (1) characterize the PK of uMPA and tMPA and its 7-O-mycophenolic acid glucuronide (MPAG) metabolite in kidney transplant patients cotreated with cyclosporine (CsA), and (2) identify the clinically significant covariates that explain variability in the dose–exposure relationship.
Methods: A total of 740 uMPA, 741 tMPA, and 734 total MPAG (tMPAG) concentration–time data from 58 Chinese kidney transplant patients receiving MPA in combination with CsA were analyzed using NONMEM® software with the stochastic approximation expectation maximization (SAEM) followed by the important sampling (IMP) method. The influence of covariates was tested using a stepwise procedure.
Results: The PK of uMPA and unbound MPAG (uMPAG) were characterized by a two- and one-compartment model with first-order elimination, respectively. A linear protein binding model was used to link uMPA and tMPA. Apparent clearance (CL/F) and central volume of distribution (VC/F) of uMPA (CLuMPA/F and VCuMPA/F, respectively) and protein binding rate constant (kB) were estimated to be 851 L/h [relative standard error (RSE), 7.1%], 718 L (18.5%) and 53.4/h (2.3%), respectively. For uMPAG, the population values (RSE) of CL/F (CLuMPAG) and VC/F (VCuMPAG/F) were 5.71 L/h (4.4%) and 29.9 L (7.7%), respectively. Between-subject variability (BSVs) on CLuMPA/F, VCuMPA/F, CLuMPAG/F, and VCuMPAG/F were 51.0, 80.0, 31.8 and 48.4%, respectively, whereas residual unexplained variability (RUVs) for uMPA, tMPA, and uMPAG were 47.0, 45.9, and 22.0%, respectively. Significant relationships were found between kB and serum albumin (ALB) and between CLuMPAG/F and glomerular filtration rate (GFR). Additionally, model-based simulation showed that changes in ALB concentrations substantially affected tMPA but not uMPA exposure.
Conclusions: The established model adequately described the popPK characteristics of the uMPA, tMPA, and MPAG. The estimated CLuMPA/F and unbound fraction of MPA (FUMPA) in Chinese kidney transplant recipients cotreated with CsA were comparable to those published previously in Caucasians. We recommend monitoring uMPA instead of tMPA to optimize mycophenolate mofetil (MMF) dosing for patients with lower ALB levels.
Introduction
Mycophenolate mofetil (MMF), a prodrug of mycophenolic acid (MPA), is the predominant antimetabolite immunosuppressant used as a cotherapy with tacrolimus (TAC) or cyclosporine (CsA) to prevent graft rejection after solid organ transplantation (Hart et al., 2018; Hart et al., 2019). MMF is extensively absorbed and rapidly hydrolyzed to the active component MPA after oral administration. The majority of MPA is metabolized to the pharmacologically inactive 7-O-mycophenolic acid glucuronide (MPAG), whereas a lower fraction is metabolized to the active acyl-glucuronide mycophenolic acid (AcMPAG) (Bullingham et al., 1998; Kiang and Ensom, 2016). MPA and MPAG are reported to be 97 and 82% bound to serum albumin (ALB), respectively at clinically relevant concentrations (Bullingham et al., 1998). MPAG also undergoes enterohepatic circulation (EHC) through biliary excretion, followed by intestinal deglucuronidation and reabsorption as MPA in the colon. This process contributes to approximately 40% (range: 10–60%) of the area under the concentration–time curve (AUC) of MPA and causes multiple peaks in the concentration–time profile (Staatz and Tett, 2007). Most absorbed MMF is eliminated through the kidney as MPAG (Staatz and Tett, 2007).
MPA has a narrow therapeutic window and it is recommended to maintain a 12-h dosing interval exposure (AUC0–12h) between 30 and 60 mg·h/L during the early posttransplantation period (Shaw et al., 2001; van Gelder et al., 2006; Kuypers et al., 2010; Le Meur et al., 2011). Under-exposure is associated with an increased risk for acute rejection, whereas a higher AUC0–12h may lead to over-immunosuppression. Large between-subject variability (BSV) and time-dependent variation within-subjects are characteristics of MPA pharmacokinetics (PK) (Shaw et al., 2003; Le Meur et al., 2007; van Hest et al., 2007). A 10-fold variation of MPA exposure was observed even in subjects administered the same dose during the first 2 weeks following kidney transplantation. Moreover, the MPA exposure in the early phase posttransplantation was 30–50% lower than that in the stable period when administered the same MMF dose (Shaw et al., 2003).
The narrow therapeutic window and large PK variability make it necessary to individualize MMF therapy based on therapeutic drug monitoring. Currently, the maximum a posterior Bayesian method using population PK (popPK) in combination with Bayesian estimation is recommended for facilitating the optimal pharmacotherapy (Tobler and Muhlebach, 2013; Wright and Duffull, 2013; Zhao et al., 2016; Mao et al., 2018). This approach is based on a comprehensive understanding of prior information, i.e., the popPK characteristics.
The popPK characteristics of total MPA (tMPA) in kidney transplant recipients have been extensively investigated in various ethnic populations. Regarding unbound MPA (uMPA), the pharmacologically active component, only a few investigations have used the population approach (de Winter et al., 2009; van Hest et al., 2009; Colom et al., 2018; Okour et al., 2018) because of the technical complexity of measurements. Furthermore, the information in Chinese kidney transplant recipients is limited. Therefore, the objectives of this study were to develop a popPK model to: (1) characterize the PK of uMPA, tMPA, and the main metabolite MPAG in Chinese kidney transplant patients cotreated with CsA, and (2) identify the clinically significant covariates that explain the variability in the dose–exposure relationship.
Methods
Study Design and Patients
The data were obtained from two clinical studies (Jiao et al., 2007; Geng et al., 2012). The inclusion criteria were as follows: patients 1) receiving first-time kidney transplantation; 2) administered triple immunosuppressive therapy comprising MMF (CellCept®, Roche Pharma Ltd., Shanghai, China), CsA, and corticosteroids; 3) and aged over 18 years. The exclusion criteria were: 1) pregnant or lactating women; patients 2) with severe gastrointestinal disorders; 3) cotreated with cholestyramine; 4) and receiving combined organ transplantation.
The first study was an evaluation of the PK of MPA and MPAG during the early posttransplantation period conducted at Huashan Hospital, Fudan University (Jiao et al., 2007). MMF was initiated at 1,500 mg/day from the day of surgery. The second study was an open-label, multicenter, two-phase, sequential, bioequivalence study conducted in stable kidney transplantation patients (Geng et al., 2012). MMF dose was 1,000 or 1,500 mg/day in most patients. All protocols were approved by the independent Clinical Research Ethics Committee of Huashan Hospital, Fudan University, and all participants provided written informed consent before enrolment.
After the morning dose, whole blood samples were collected at 0, 0.5, 1, 1.5, 2, 3, 4, 6, 8, 10, and 12 h in study 1 and 0, 0.5, 1, 1.5, 2, 2.5, 3, 4, 6, 9, 10, and 12 h in study 2. Low-fat meals were provided after the scheduled 4 and 10 h samplings in study 1 and the 3 and 9 h samplings in study 2. The relevant data were collected to explore the relationships between demographic characteristics, biochemical measurements, and PK parameters.
All samples were analyzed at Huashan Hospital using a validated high-performance liquid chromatography method (Jiao et al., 2005; Jiao et al., 2007). The calibration ranges were 0.002–1.0, 0.1–40, and 10–200 mg/L for uMPA, tMPA, and total MPAG (tMPAG), respectively. The relative bias at lower limit of quantification (LLOQ) were within ±17% for uMPA, within ±8.3% for tMPA, and tMPAG. The relative bias of other quality control concentrations for uMPA, tMPA, and tMPAG was within ±6.1%. The intra- and interday precision, as coefficient of variation values, were <14% for uMPA, < 9.2% for tMPA, and <9.8% for tMPAG.
PopPK Analyses
Software and Model Selection Criteria
Nonlinear mixed-effect modeling was performed using NONMEM® software (version 7.4; ICON Development Solutions, Ellicott City, MD, USA) compiled with gfortran 4.6.0. Perl-speaks-NONMEM (PsN, version 4.7.0; http://uupharmacometrics.github.io/PsN) and Pirana (version 2.9.7; http://www.certara.com/pirana) were used to link NONMEM, model development, and model evaluation. The stochastic approximation expectation maximization (SAEM), followed by important sampling (IMP) method (Bauer, 2017) were used throughout the model development. Graphical diagnostics were performed using R software (version 3.4.4, http://www.r-project.org).
MMF doses and uMPA, tMPA, and tMPAG concentrations were transformed into molar equivalents by dividing them with the molecular weight (MMF, MPA, and MPAG: 433.498, 320.339, and 496.462 g/mol, respectively; http://chem.nlm.nih.gov/chemidplus/) and then reconverted to milligram per liter in the figures and results. Model selection was based on goodness-of-fit (GOF) plots (Ette and Ludden, 1995) in addition to the three commonly used criteria of statistical significance, plausibility, and stability. The difference in objective function values (OFV) between two nested models was used for statistical comparison. Akaike information criteria (AIC) (Vaida and Blanchard, 2005) and Bayesian information criteria (BIC) (Delattre et al., 2012) were used to discriminate nonnested models.Additionally, relative standard errors (RSEs) of parameter estimates, shrinkages, and changes of BSV and residual unexplained variability (RUV) estimates were considered. During the model developing process, the condition numbers were calculated and no more than 1,000 were kept to avoid overparameterization (Owen and Fiedler-Kelly, 2014).
Model Development
PopPK modeling of MPA and MPAG was conducted using a sequential approach and eventually led to simultaneous modeling of both the parent compound and metabolite. One- or two-compartments models with first-order elimination were tested for uMPA and unbound MPAG (uMPAG). We further investigated whether MPA absorption was best described by a first- or zero-order process, with or without a lagged absorption time (Tlag). The concentrations of uMPAG were not determined in our study but were estimated from tMPAG by multiplying the unbound fraction of MPAG (FUMPAG), which was fixed at 18% according to the U.S. Food and Drug Administration (FDA) package insert for CellCept® (FDA, 2019).
The tMPA data was first modeled by adding a linear protein binding compartment as equation 1:
where CtMPA and CuMPA represent total and unbound MPA concentrations, respectively, and kB is the protein binding rate constant. In this case, the unbound fraction of MPA (FUMPA) could be expressed as equation 2:
The nonlinear saturable protein binding model published previously (Picard-Hagen et al., 2001; Colom et al., 2018) was also evaluated using equation 3:
where CbMPA represents the bound MPA concentration, Bmax is the maximal number of protein binding sites, and kD is the dissociation constant representing the uMPA concentration corresponding to half-saturation of protein binding. To describe the physiological EHC process, the previously published intermittent EHC model (Jiao et al., 2008; Ling et al., 2015) was used with some modifications, in which a gallbladder compartment was introduced to connect MPAG and gut compartments. The percentage of MPAG recycled into the systemic circulation (%EHC) was described using equation 4:
where, kGG is the transfer rate constant from the MPAG central compartment to the gallbladder and ke0 is the elimination rate constant of MPAG.
Several assumptions were made to ensure the model was structurally identifiable (Jiao et al., 2008): (1) MMF is quickly absorbed and completely hydrolyzed to MPA, (2) the conversion ratio from MPA to MPAG is fixed at 87% (FDA, 2019), (3) MPAG secreted from the gallbladder to the intestines is completely deconjugated to MPA and reabsorbed, (4) the rate constants associated with each compartment are all first-order and unaffected by the recycling, and (5) gallbladder emptying is triggered by meals. Additionally, the gallbladder emptying rate constant (kGB) was fixed at 3.708/h based on previous study (Guiastrennec et al., 2016). The duration (DGB) of gallbladder release was fixed at 0.5 h to ensure that over 90% gallbladder contents would be released after each trigger.
An exponential model was used to describe BSVs for each PK parameter while exponential, additive, and combined models were compared to describe RUVs. Furthermore, the covariance of BSVs was estimated using OMEGA BLOCK statement in NONMEM. Because uMPA, tMPA, and tMPAG concentrations were derived from the same sample for each subject, their RUVs were likely correlated. An L2 data item was introduced and the covariance of RUVs was also evaluated using SIGMA BLOCK statement (Bauer, 2017).
After the base model was established, the following physiologically meaningful covariates were investigated: sex, age, body weight (BW), postoperative time (POT), hemoglobin, ALB, alanine aminotransferase, aspartate aminotransferase, serum creatinine (SCr), glomerular filtration rate (GFR), CsA daily dose, and coadministration of antacids. GFR was estimated from SCr using the Chronic Kidney Disease Epidemiology Collaboration formula (Levey et al., 2009).
First, relationships between individual PK parameters and covariates were examined by graphical inspection to identify the potential covariates. Then, the identified covariates were tested using a stepwise procedure. During the forward inclusion and backward elimination steps, significance levels were set at a decrease in OFV > 3.84 (χ2, df = 1, p < 0.05) and an increase in OFV > 10.83 (χ2, df = 1, p < 0.001), respectively. The continuous covariates were assessed using a linear and non-linear model, and categorical covariates were modeled proportionally. To demonstrate clinical significance, covariates were only retained if the effect on the corresponding parameter was >15% for a categorical covariate, or >15% at the highest or lowest observed covariate value for a continuous covariate (Mo et al., 2018). In addition, the included covariates were expected to have interpretations of physiological or pharmacological mechanisms.
Model Evaluation
The established model was evaluated by graphical diagnosis. GOF plots included scatterplots of population predictions (PRED) and individual predictions (IPRED) versus observed concentrations (OBS), as well as conditional weighted residuals (CWRES) versus PRED and time after previous dose (TAD). Observations over ±4 CWRES based on final model were excluded from the original dataset, and the sensitivity analysis was performed to verify the model. Additionally, 500 bootstraps (Ette et al., 2003) were applied to assess the reliability and stability of the final model. The medians and 2.5–97.5% intervals from the bootstrap replicates were compared with estimates of the final model.
The final model was further examined using a prediction-corrected visual predictive check (pc-VPC) (Bergstrand et al., 2011) and posterior predictive check (PPC) (Yano et al., 2001). Furthermore, 2,000 datasets were simulated using the final model from the original dataset. For pc-VPC, the observed and simulated concentrations were dose-normalized to 750 mg MMF every 12 h. The median, 5th and 95th percentiles of simulated concentrations and corresponding 95% confidence intervals (CIs) were calculated and graphically compared with the observations. PPC was further performed to assess if the model appropriately predicted the AUC0–12h of uMPA, tMPA, and tMPAG. Simulated and observed AUC0–12h were calculated using the linear trapezoidal rule. Distributions of the simulated and observed AUC0–12h were then graphically compared.
Simulation Analyses of Effects of Significant Covariates
The established final model was used to investigate the effect of the identified covariates on the PK of MPA and MPAG. Specifically, 2,000 stochastic simulations were performed for virtual subjects administered 750 mg MMF every 12 h with different covariate levels. The AUC0–12h values of uMPA, tMPA, and tMPAG were estimated using the linear trapezoidal rule, and changes in AUC0–12h and FUMPA were assessed.
Results
Patient Characteristics and Data Descriptions
A total of 27 full concentration–time profiles containing uMPA, tMPA, and tMPAG data were obtained from 20 patients in study 1, including 23 profiles collected within 3 months posttransplantation. Sixteen patients had one profile, one had two profiles, and the other three each had three profiles. In study 2, we obtained 38 full concentration–time profiles from 38 patients, including 37 collected beyond 3 months posttransplantation. The patient characteristics are shown in Table 1. Of these subjects, male patients accounted for approximately 78%. The concomitant antacids in study 1 were proton pump inhibitors, whereas sodium hydrogen carbonate and compound aluminum hydroxide were coadministered in study 2. Significant differences in BW, POT, hemoglobin, and ALB as well as doses of MMF, CsA, and corticosteroids were observed between the two studies.
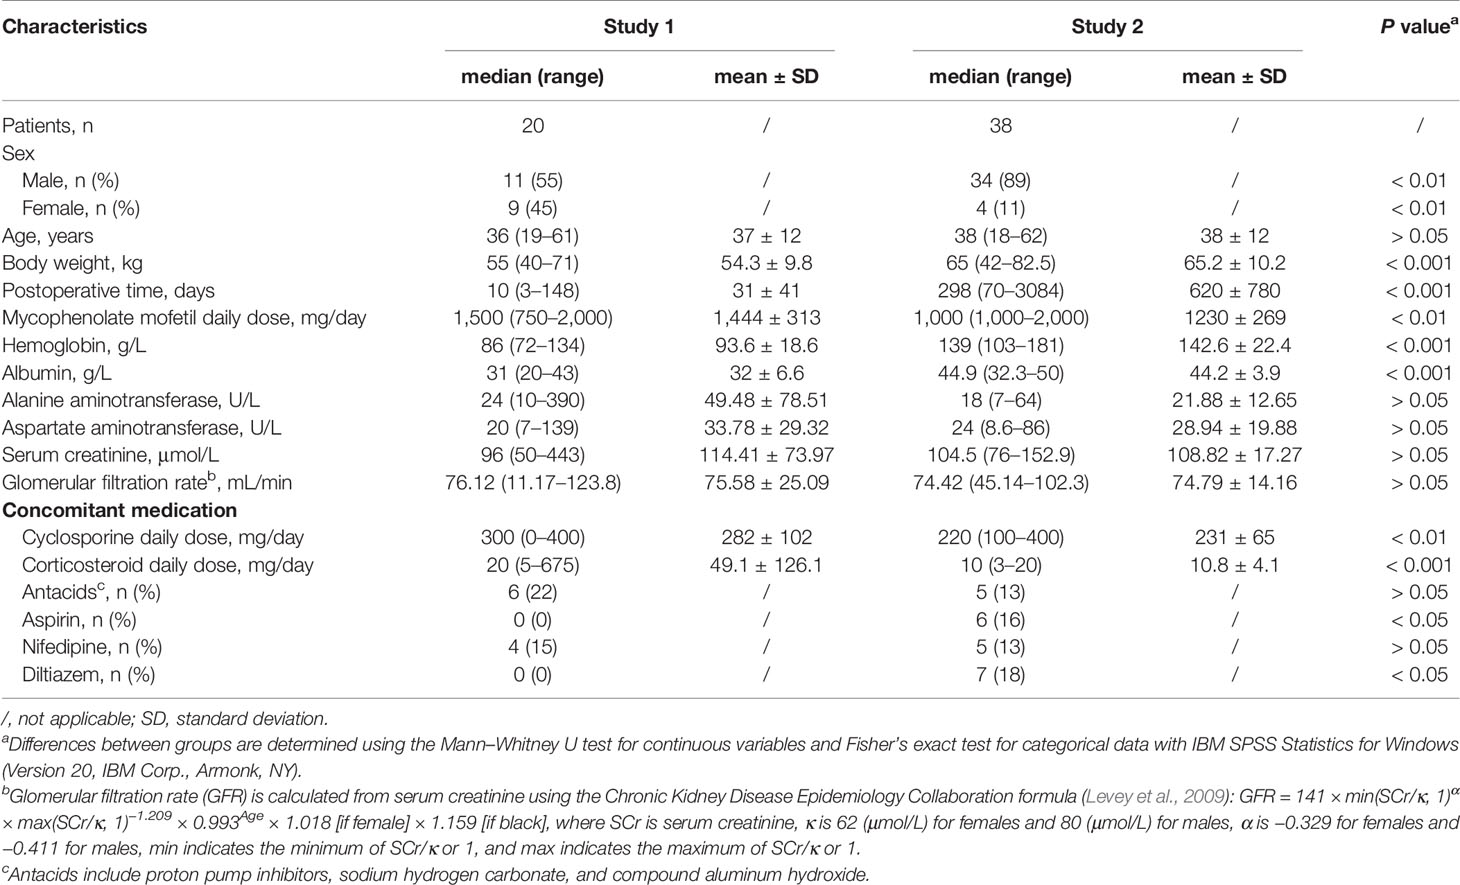
Table 1 Patient characteristics and clinical covariates.
Of the 2,229 samples, < 1% (3 uMPA, 1 tMPA, and 10 tMPAG) were below the LLOQ and were discarded. In total, 740 uMPA, 741 tMPA, and 734 tMPAG concentration measurements were used for the popPK analysis. Multiple uMPA and tMPA peaks attributed to EHC were observed at 4–6 and 8–12 h postdosing in some subjects, whereas no obvious multiple peaks were observed for tMPAG. After being normalized to MMF 1,500 mg/day, the median AUC0–12h of uMPA in study 2 was significantly higher than that in study 1 (38.60 vs. 27.21 mg·h/L). No significant differences in the AUC0–12h of tMPA and tMPAG were found between the two studies.
PopPK Model
Model Development
As shown in Figure 1, a five-compartment model with first-order absorption and elimination adequately described the uMPA, tMPA, and uMPAG data. The two-compartment (2CMT) structural model was superior to the one-compartment (1CMT) (AIC, −2904.957 vs. −2585.189; BIC, −2785.184 vs. −2506.876) for uMPA. Moreover, the 1CMT structural model showed a better fit for uMPAG than the 2CMT did (AIC, −81.269 vs. −59.793; BIC, 188.813 vs. 379.753). Incorporation of Tlag further led to a significant reduction of 383.714 units in the OFV. Simultaneous estimation of both Bmax and kD was not feasible; therefore, Bmax was fixed at the reported value of 35,100 μmol (de Winter et al., 2009). The nonlinear saturable binding from the central compartment did not improve the fit (AIC, 1531.731 vs. 1530.953; BIC, 2010.784 vs. 2010.006) more than the linear protein binding model did. Furthermore, incorporation of the EHC process decreased the AIC and BIC by 129.985 and 21.628 units, respectively.
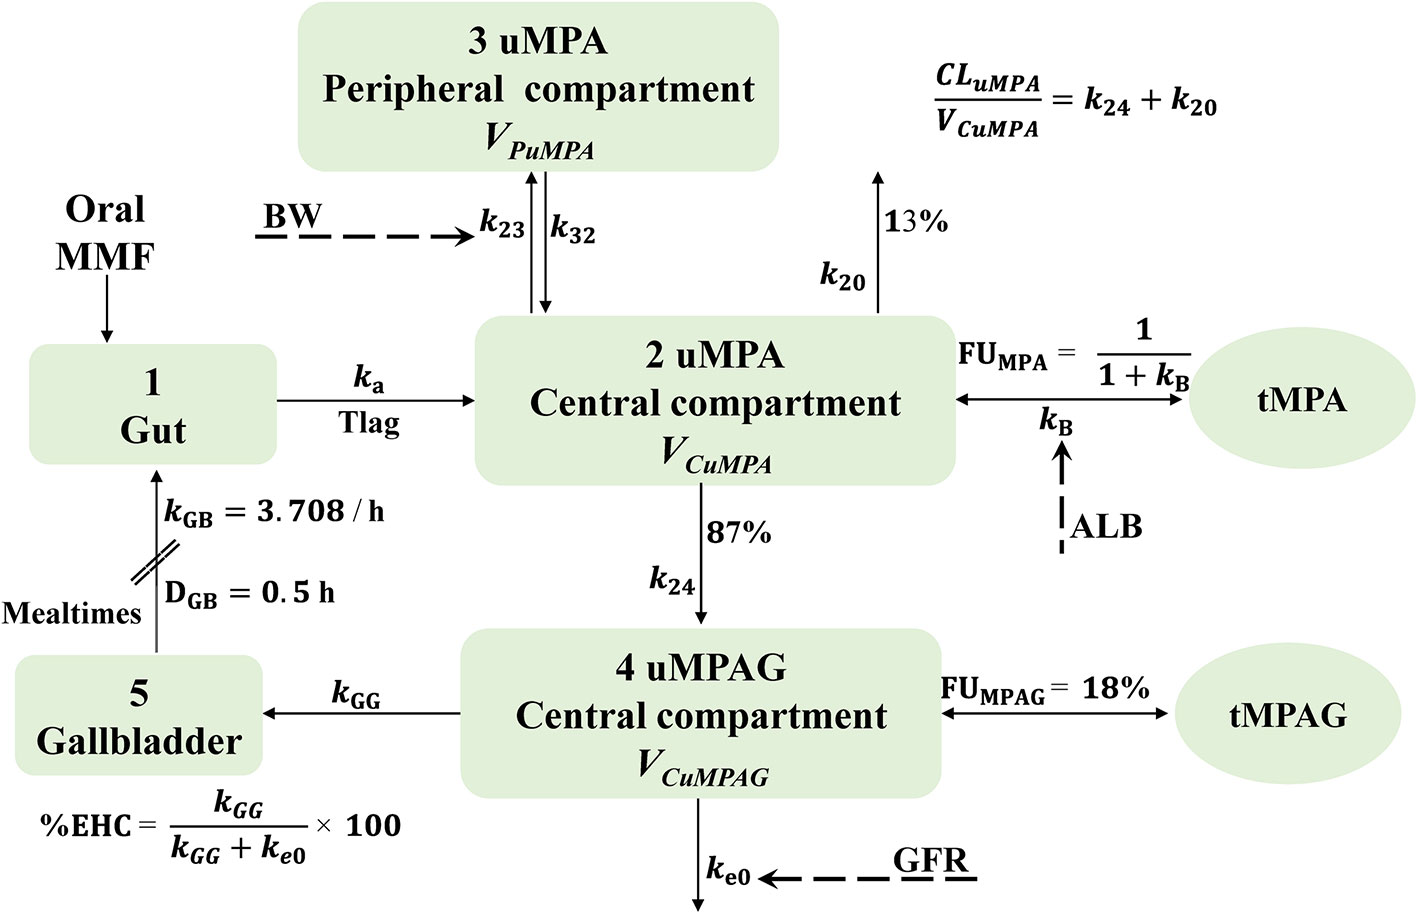
Figure 1 Schematic representation of the final structural model characterizing the linear protein binding and intermittent EHC processes. In this model, mealtimes are used as an index of gallbladder emptying. This process is assumed to occur at specific time points (mealtimes) with a first-order rate constant and a certain duration. The fraction of MPA metabolized to MPAG is fixed at 87%. MMF, mycophenolate mofetil; MPA, mycophenolic acid; MPAG, 7-O-mycophenolic acid glucuronide; tMPA, total MPA; tMPAG, total MPAG; uMPA, unbound MPA; uMPAG, unbound MPAG; ALB, serum albumin; BW, body weight; CLuMPA/F, apparent clearance of uMPA; DGB, duration of gallbladder emptying; EHC, enterohepatic circulation; %EHC, percentage of MPAG recycled into the systemic circulation; FUMPA, unbound fraction of MPA; FUMPAG, unbound fraction of MPAG; GFR, glomerular filtration rate; k20, elimination rate constant of uMPA; k23, transfer rate constant from uMPA central compartment to peripheral compartment; k24, rate constant of uMPA transformed to uMPAG; k32, transfer rate constant from uMPA peripheral compartment to central compartment; ka, absorption rate constant; kB, protein binding rate constant; ke0, elimination rate constant of uMPAG; kGB, gallbladder emptying rate constant; kGG, transfer rate constant from uMPAG central compartment to gallbladder; Tlag, lagged absorption time; VCuMPA/F and VCuMPAG/F, apparent central volume of distribution of uMPA and uMPAG, respectively; VPuMPA/F, apparent peripheral volume of distribution of uMPA.
The PK parameters estimated were absorption rate constant (ka), Tlag, apparent clearance (CL/F) of uMPA and uMPAG (CLuMPA/F and CLuMPAG/F, respectively), apparent intercompartmental clearance of uMPA (QuMPA/F), apparent central volume of distribution (VC/F) of uMPA and uMPAG (VCuMPA/F and VCuMPAG/F, respectively), kB, and %EHC. Apparent peripheral volume of distribution of uMPA (VPuMPA/F) could not be estimated appropriately and was fixed at the reported literature value of 34,300 L (de Winter et al., 2009).
Considering that the expectation maximization (EM) algorithm is much more robust and adept at handling the large full OMEGA block (Bauer, 2017), we initially attempted to assign BSVs to all PK parameters. However, our data did not support the estimation of BSV on kB. To maximally enhance the EM efficiency, the BSV was assigned to kB, and its variance was fixed at 0.01 (Bauer, 2017). Various RUV models were tested to describe the residual errors. Incorporation of the additive residual error resulted in boundary issues and therefore, an exponential RUV model was used.
Based on the visual inspections and clinical plausibility, the effects of BW and sex on CLuMPA/F, QuMPA/F, VCuMPA/F, CLuMPAG/F, and VCuMPAG/F; GFR on kB, CLuMPA/F, QuMPA/F, and CLuMPAG/F; ALB on kB, VCuMPA/F, and VCuMPAG/F; coadministration of antacids on CLuMPA/F and ka; and tMPAG concentrations on kB were further tested using the stepwise method. Of these, the effects of ALB on kB, GFR on CLuMPAG/F, and BW and sex on QuMPA/F were included in the forward procedure, whereas the effect of sex on QuMPA/F showed no significance in the backward step and, thus, was not retained in the final model. The forward inclusion and backward elimination steps are summarized in Supplementary Table 1. Because the estimated value of the exponent for the effect of ALB on kB was quite close to 1, it was fixed at 1 to simplify the model and maintain the model stability.
Although introduction of full variance–covariance matrices for BSVs and RUVs substantially decreased the OFV by 262.265 units, the high condition number (7.5 × 10¹⁰) indicated that the model might be ill-conditioned because of overparameterization. Finally, the covariance between BSVs for VCuMPAG/F and CLuMPAG/F and between RUVs for uMPA and tMPA was included. This further decreased the OFV by 163.434 units with an acceptable condition number (< 150). The parameter estimates of the final model are provided in Table 2. No significant covariate was detected to influence CLuMPA/F, whereas significant relationships were found between kB and ALB and between CLuMPAG/F and GFR. RSEs of the parameter estimates were <30 and 45% for fixed and random effects except for %EHC, respectively. Shrinkage values of BSVs and RUVs were <30% except for %EHC.

Table 2 Pharmacokinetic parameter estimates for the final model and Bootstrap results.
Model Evaluation
The basic GOF plots of the final model are shown in Figure 2 where PRED and IPRED did not show obvious bias when plotted against OBS. Over 99.8% (2,211/2,215) of the observations were within ±4 CWRES. Alterations of all parameter estimates were < ± 15% when observations with CWRES of > ± 4 were excluded (Supplementary Table 2). The GOFs and sensitivity analysis results showed that the model adequately described the data despite the fact that a slightly positive bias could be found in the residual plots.
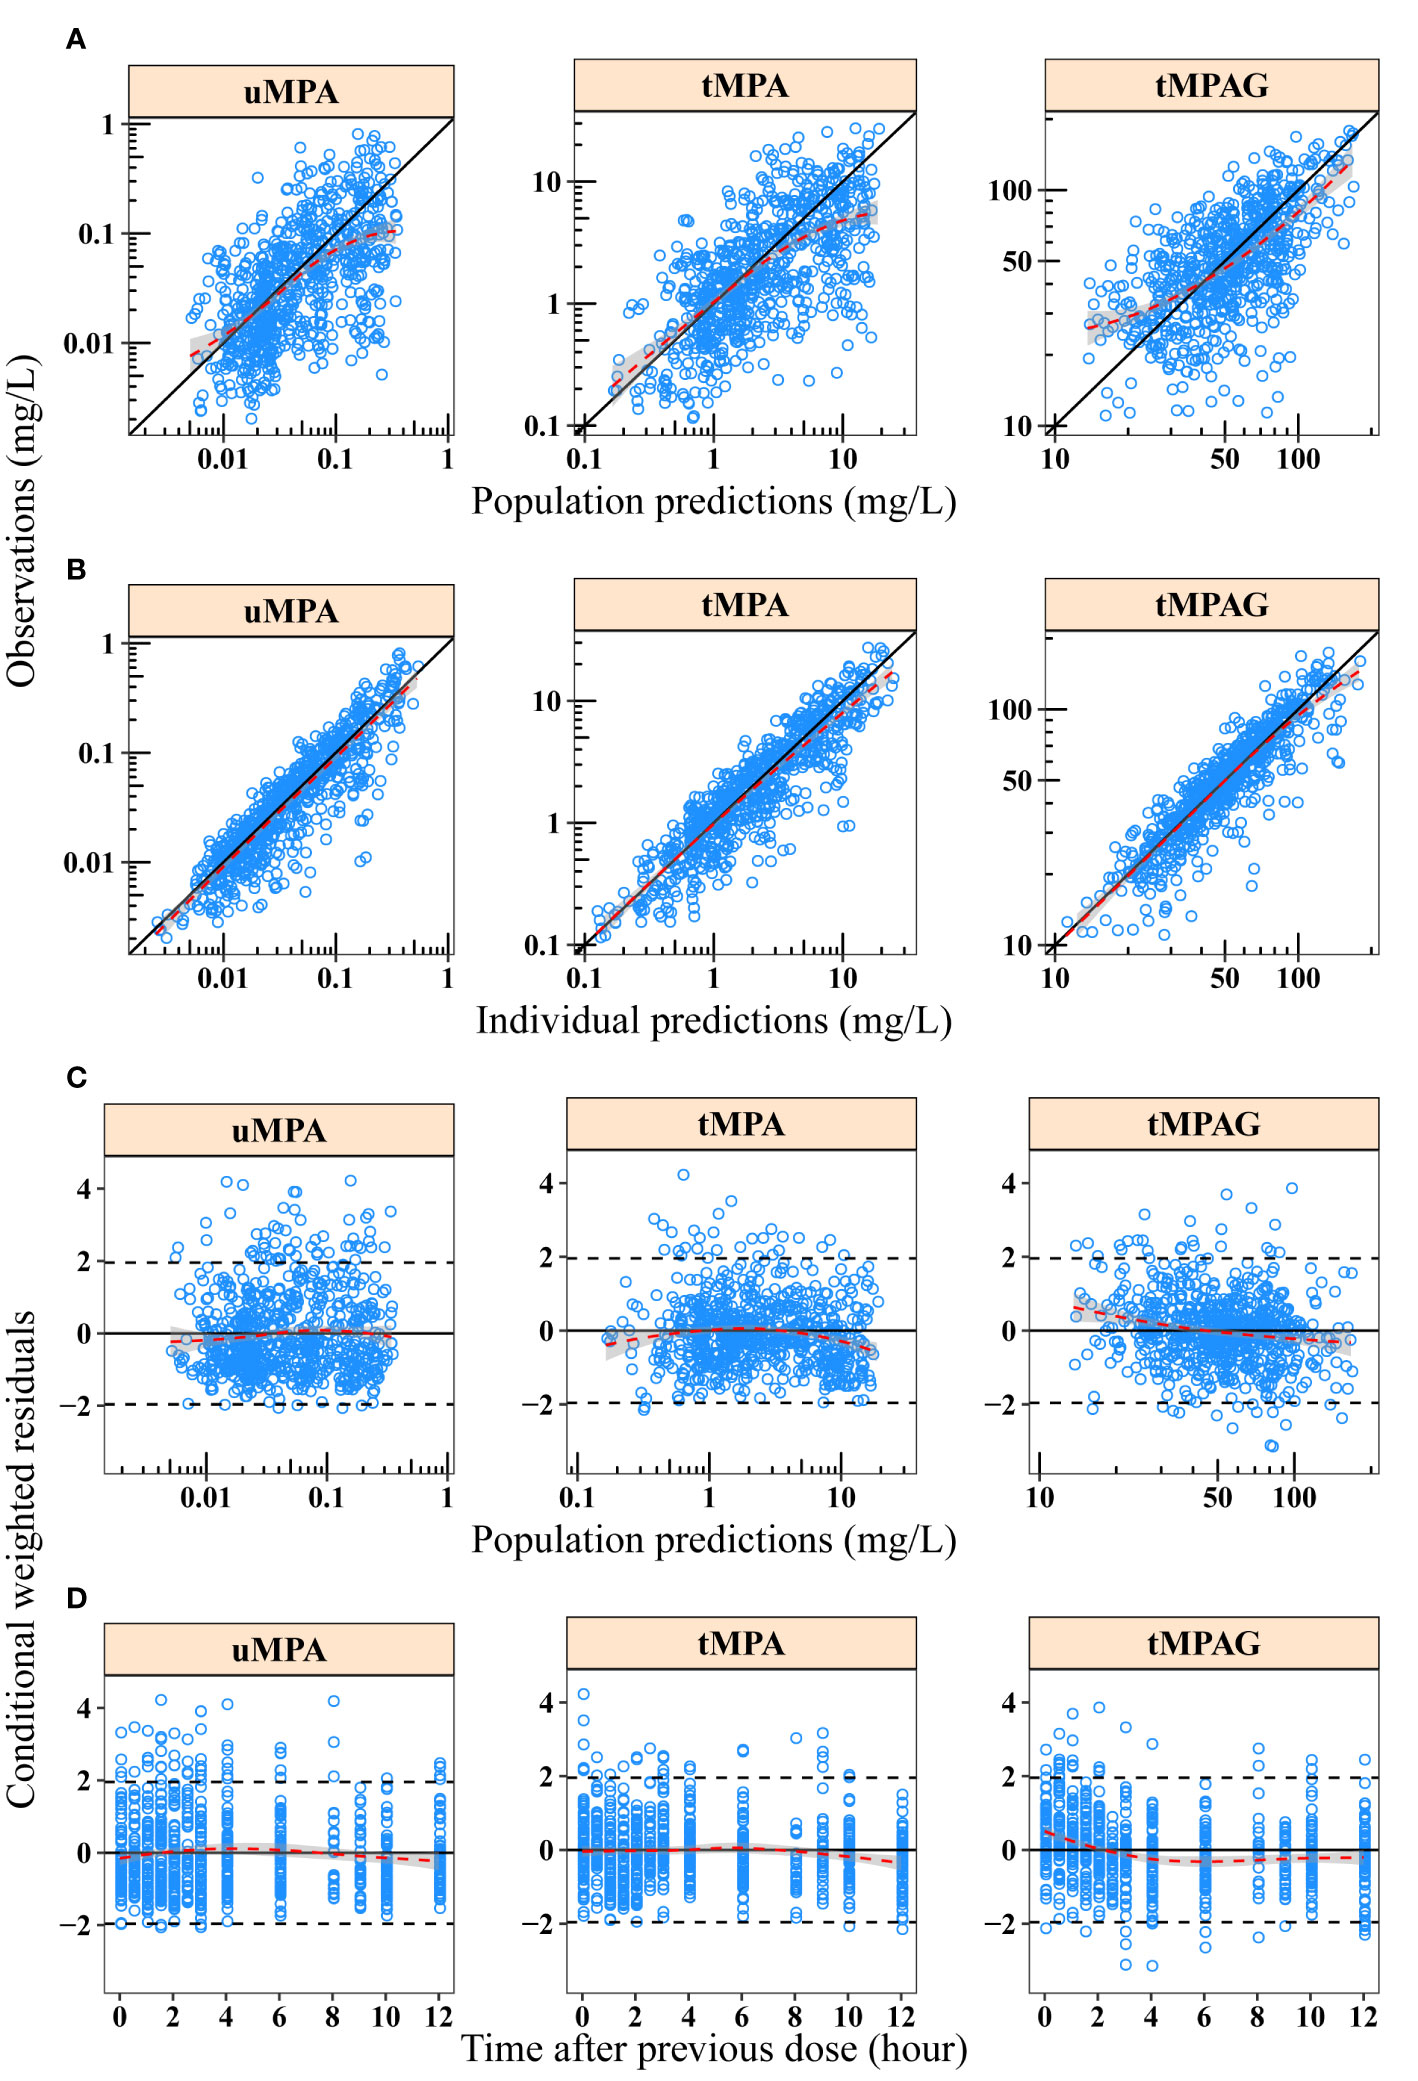
Figure 2 Goodness-of-fit plots of final model for uMPA, tMPA and tMPAG. (A) Population predictions versus observations; (B) individual predictions versus observations; (C) population predictions versus conditional weighted residuals; (D) time after previous dose versus conditional weighted residuals. Red dashed lines and gray-shaded areas represent the locally weighted regression line and 95% confidence interval, respectively. In plots A and B, black solid lines represent the line of unity. In plots C and D, black solid and dashed lines represent the y = 0 and y = ± 1.96 reference lines, respectively. tMPA, total mycophenolic acid (MPA); tMPAG, total 7-O-mycophenolic acid glucuronide; uMPA, unbound MPA.
Out of 500 replicates in the bootstrap analysis, all runs converged successfully. The estimated parameters based on original dataset were in good agreement with the median bootstrap replicates and were within the 2.5–97.5% intervals obtained from the bootstrap analysis (Table 2), indicating the reliability and stability of the final model. Figure 3 shows the results of the pc-VPC of the final model. Most observed concentrations fell within the 90% prediction interval, and no obvious discrepancy between observations and simulations was found. The PPC suggested that the simulated AUC0–12h values also showed good consistency with the observations (Figure 4). The pc-VPC and PPC results showed that the final model was reasonably good at predicting the observations.
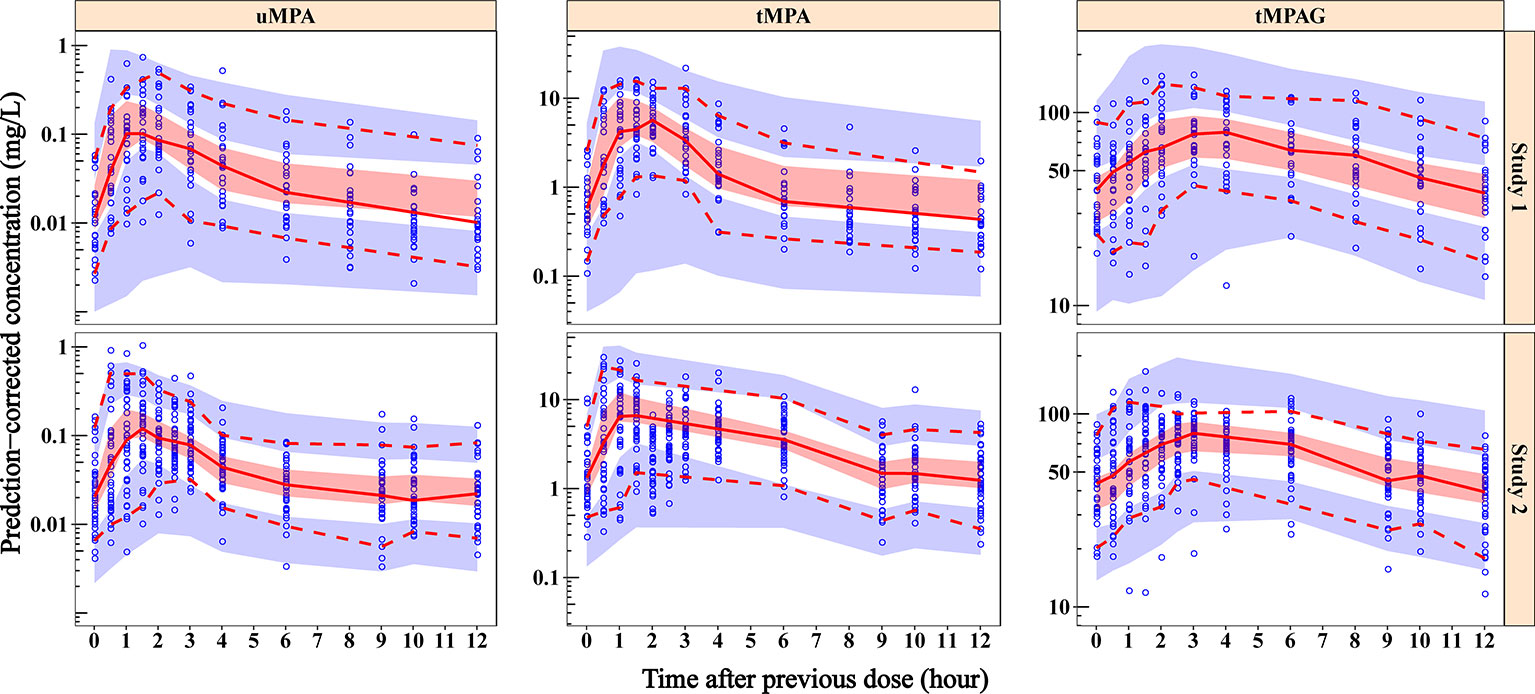
Figure 3 Prediction-corrected visual predictive check plots of final model for uMPA, tMPA and tMPAG. Blue dots represent the observed concentrations. Red solid lines represent the median of observations, and the semitransparent red fields represent the simulation-based 95% CIs for the median. The observed 5th and 95th percentiles are presented with red dashed lines, and the simulation-based 95% CIs for corresponding percentiles are shown as semitransparent blue fields. In general, the median, and 5th and 95th percentile lines of observations fall inside the area of the corresponding 95% CIs. Additionally, the majority of observed concentrations fall within the 90% prediction interval, which demonstrates that the predicted variability does not exceed the observed variability. CIs, confidence intervals; tMPA, total mycophenolic acid (MPA); tMPAG, total 7-O-mycophenolic acid glucuronide; uMPA, unbound MPA.
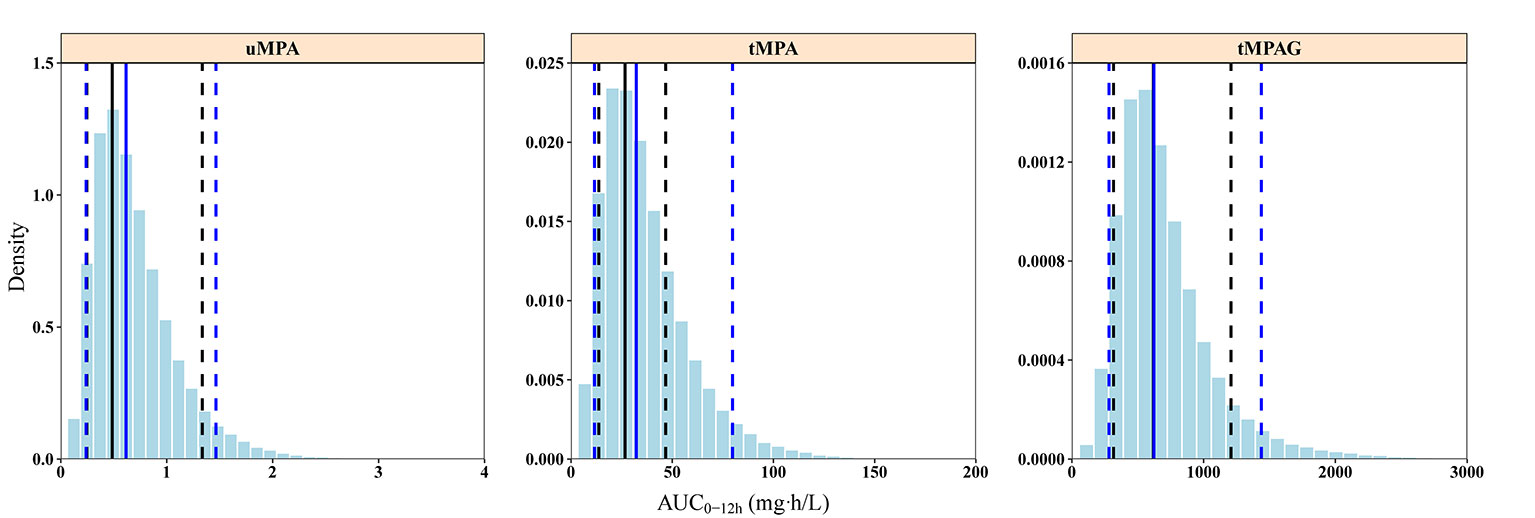
Figure 4 Posterior predictive check graphics of final model for uMPA, tMPA, and tMPAG. The histograms represent the distribution of simulations. Black and blue solid lines represent the medians of observations and simulations, respectively. The observed 5th and 95th percentiles are presented by black dashed lines, and the simulated 5th and 95th percentiles are presented by blue dashed lines. The simulated AUC0–12h values present good consistency with observations. In particular, the 5th percentiles of simulations and observations for uMPA, as well as the medians of simulations and observations for tMPAG, are completely overlapped in the graphics. AUC0–12h, area under the concentration–time curve within 12-h dose-interval; tMPA, total mycophenolic acid (MPA); tMPAG, total 7-O-mycophenolic acid glucuronide; uMPA, unbound MPA.
Simulations Illustrating Effect of Covariates
Typical subjects administered 750 mg MMF every 12 h were simulated with different ALB and GFR levels. ALB values were set from 20 to 50 g/L with a step of 5 g/L. At each ALB level, the GFR was set at 15, 30, 60, 90, and 120 mL/min according to the Kidney Disease Improving Global Outcomes (KIDGO) chronic kidney disease classification (Kidney Disease: Improving Global Outcomes CKD Work Group, 2013). Generally, ALB and GFR showed large effects on tMPA and tMPAG, respectively, but little effect on uMPA (Figure 5).
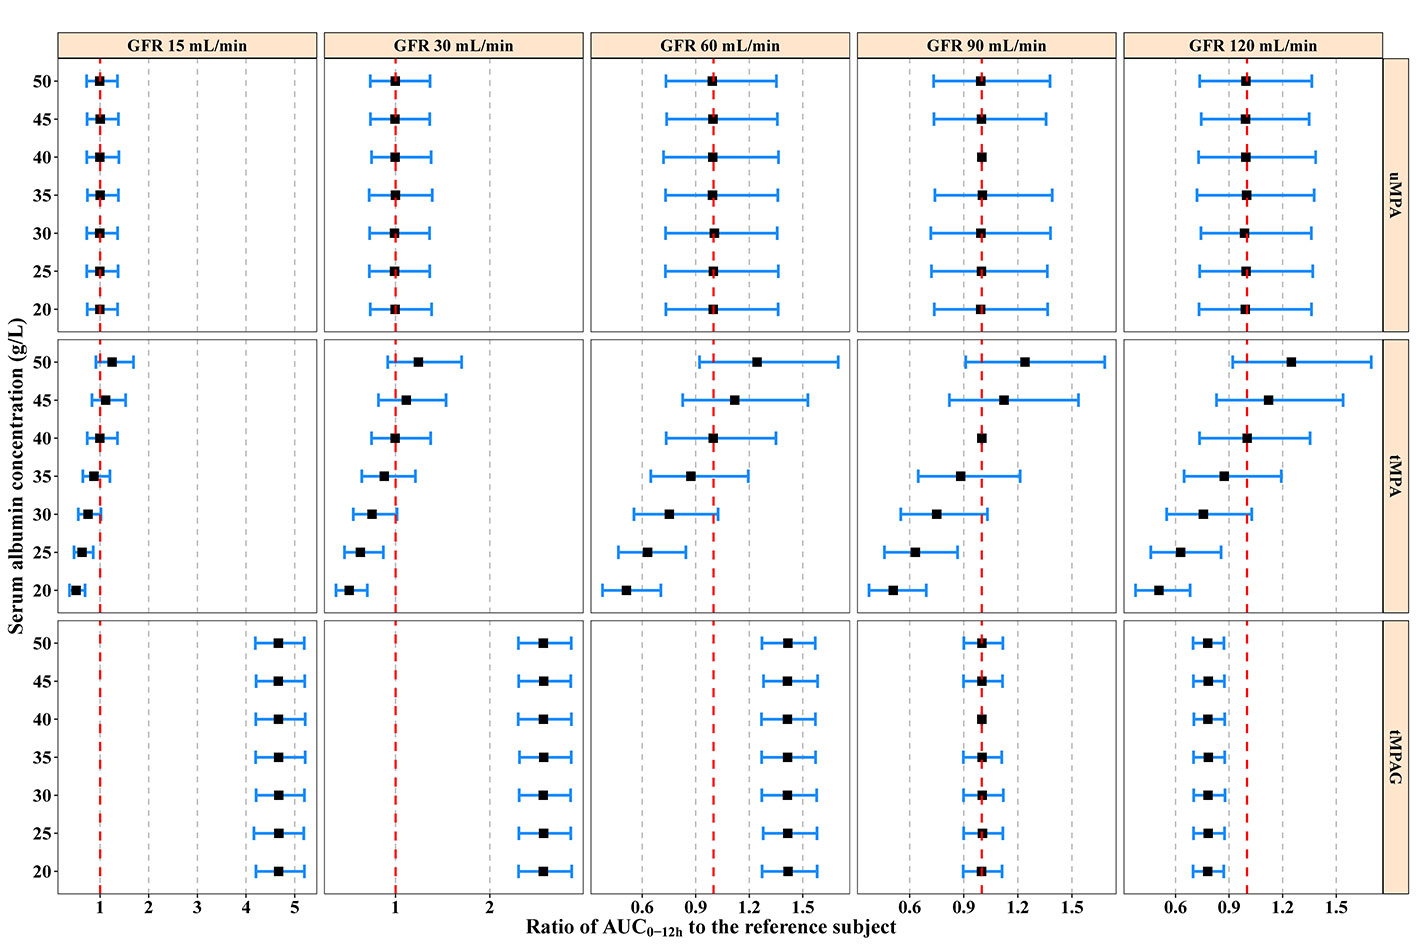
Figure 5 Model-predicted covariate effects on AUC0–12h of uMPA, tMPA, and tMPAG. Black squares represent median values and error bars represent 95% confidence intervals of the normalized exposure ratios relative to the typical reference subject (ALB 40 g/L, GFR 90 mL/min) across 2,000 simulation replicates. The vertical red dashed lines show an exposure ratio of 1 relative to the reference subject. ALB, serum albumin; AUC0–12h, area under the concentration–time curve within 12-h dose-interval; GFR, glomerular filtration rate; tMPA, total mycophenolic acid (MPA); tMPAG, total 7-O-mycophenolic acid glucuronide; uMPA, unbound MPA.
A substantial decrease in tMPA AUC0–12h and increase in FUMPA were observed with decreasing ALB concentrations. For subjects with a GFR of 90 mL/min administered 750 mg MMF every 12 h, the median tMPA AUC0–12h decreased from 42.92 to 21.59 mg·h/L when ALB concentrations decreased from 40 to 20 g/L, whereas the exposure of uMPA and tMPAG remained almost unchanged (< 5%). A decrease in ALB concentrations from 40 to 20 g/L increased FUMPA from 1.86% (95% CI, 1.35–2.58%) to 3.62% (95% CI, 2.62–5.02%) (Supplementary Figure 1).
Additionally, a substantial increase in tMPAG AUC0–12h was observed with decreasing GFR. For subjects with an ALB concentration of 40 g/L administered 750 mg MMF every 12 h, a reduction in GFR from 90 to 15 mL/min led to a 3.67-fold (95% CI, 3.13–4.30) increase in tMPAG AUC0–12h, while FUMPA and the exposure of both uMPA and tMPA were unchanged (Figure 5 and Supplementary Figure 1).
The simulations showed that neither ALB nor GFR significantly affected uMPA exposure. For patients with lower ALB levels, dose adjustment based on monitoring tMPA would lead to higher risk of leucopoenia and infections, because of overexposure to uMPA.
Discussion
The present study extensively investigated the popPK characteristics of uMPA, tMPA, and MPAG in Chinese adult kidney transplant recipients cotreated with CsA during both the early and stable periods posttransplantation. A two-compartment model with first-order absorption and elimination adequately described the uMPA data. Furthermore, the uMPA and tMPA were connected using a linear protein binding model.
It is still controversial whether ethnic differences exist in MPA PK. Some studies have reported higher dose-normalized AUCs of MPA in Asian subjects than in Caucasians (Lu et al., 2005; Zicheng et al., 2006; Yau et al., 2007; Zhou et al., 2007; Miura et al., 2009). Li et al. (2014) reported that Asians had lower MPA CL/F and required lower MMF doses than Caucasians did. This could be partly explained by the significantly lower BW of Asian subjects.
After correcting for BW, the average tMPA CL/F (CLtMPA/F) of Asians and Caucasians was close (POT ≤ 6 months: 0.35 vs. 0.36 L/h/kg; POT > 6 months: 0.22 vs. 0.25 L/h/kg) following coadministration of CsA (Li et al., 2014). In contrast, several studies showed that MPA PK in Asians was similar to that in Caucasians (Funaki, 1999; Cho et al., 2004; Jiao et al., 2007; Ling et al., 2015). In addition, our previous study suggested that the lower dose required in Chinese patients than in Caucasians could result in comparable inhibitory rates of inosine-5′-monophosphate dehydrogenase (24–42%) (Liu et al., 2018). The difference in dose requirement might not be attributable to PK but to pharmacodynamics.
The current study showed no obvious ethnic difference in exposure of uMPA. As shown in Table 3, the population estimate of BW corrected-CLuMPA/F (13.95 L/h/kg) was comparable to most of previously reported values in Caucasians (9.21–12.93 L/h/kg) (de Winter et al., 2009; van Hest et al., 2009; Colom et al., 2018). Moreover, the typical value of BW corrected-CLtMPA/F (0.26 L/h/kg) was also similar to most of previously reported values in Asians (0.21–0.32 L/h/kg) (Yau et al., 2009; Yu et al., 2017; Chen et al., 2019) and Caucasians (0.18–0.32 L/h/kg) (Le Guellec et al., 2004; Cremers et al., 2005; Staatz et al., 2005; van Hest et al., 2007; de Winter et al., 2008; Musuamba et al., 2009; Guillet et al., 2010; de Winter et al., 2012; Colom et al., 2014). Furthermore, the population estimate of FUMPA in our study (1.84%) was also similar to previously reported values (van Hest et al., 2009; Colom et al., 2018).
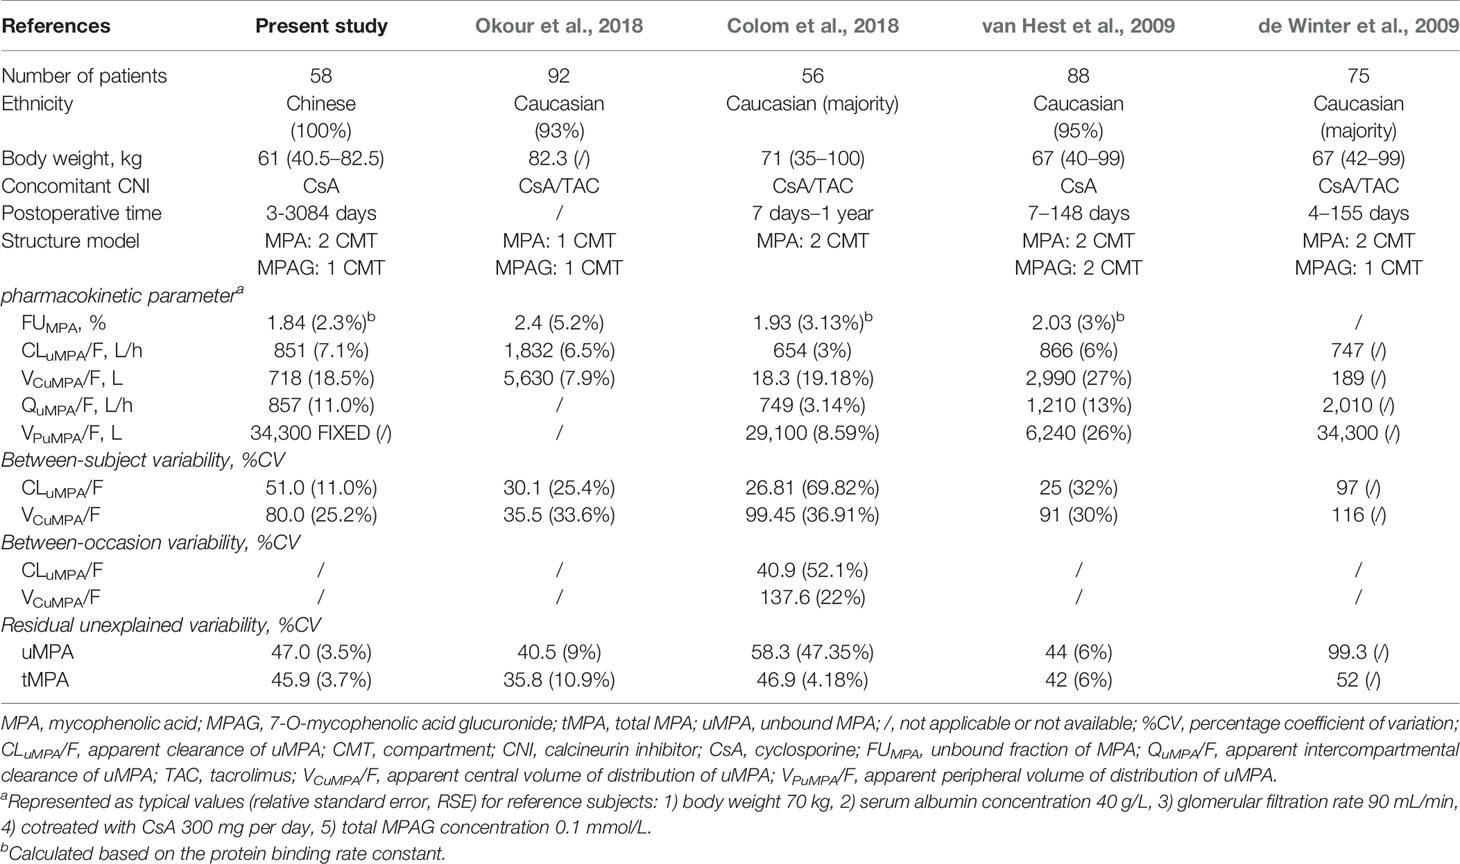
Table 3 Previously published population pharmacokinetic analysis of unbound and total mycophenolic acid.
The stepwise covariate analyses suggested that ALB had significant effects on kB and FUMPA. MPA is extensively bound to human ALB, which has more than one binding site on each molecule with equivalent binding characteristics (Nowak and Shaw, 1995). A reduction in ALB decreases the binding sites, which increases the FUMPA. The simulations showed that changes in ALB concentrations substantially affected FUMPA and tMPA exposure, but had little effect on uMPA exposure, which was consistent with previous findings (de Winter et al., 2009; van Hest et al., 2009). This could be attributed to the low hepatic extraction ratio of MPA. FUMPA tended to increase with decreasing ALB (Supplementary Figure 1) and the increase in FUMPA caused relatively more uMPA to be metabolized and eliminated from the body, thereby decreasing tMPA exposure. In contrast, MPA is characterized by a low hepatic extraction ratio of 0.2 (Bowalgaha and Miners, 2001), and the unbound exposure of drugs with low extraction ratio is unaffected by changes in the unbound fraction (Benet and Hoener, 2002).
These results suggested that dose adjustment based on tMPA exposure might not be appropriate under lower ALB conditions. A reduction in median tMPA AUC0–12h from approximately 42.9 to 21.6 mg·h/L was observed when ALB concentration decreased from 40 to 20 g/L for patients administered 750 mg MMF every 12 h. However, this observation does not indicate an MMF dose increment is necessary because of the unchanged uMPA exposure. Although a relationship between uMPA exposure and acute rejection risk has not been fully identified, uMPA has been recognized as the pharmacologically active component. Moreover, uMPA exposure has been demonstrated to be associated with the risk of leucopoenia and infections (Kaplan et al., 1998; Weber et al., 2002; Mudge et al., 2004; Atcheson et al., 2005). An increased MMF dose would also increase uMPA exposure, placing patients at a higher risk of overimmunosuppression with manifestations such as leucopoenia and infections. In such situations, monitoring uMPA exposure might be preferable to monitoring tMPA for adjusting the MMF dose.
Moreover, it has been reported that tMPA exposure in the early phase post-transplantation was 30–50% lower than that in the stable period when the same MMF dose was administered (Shaw et al., 2003). This time-dependent clearance could be largely attributed to changes in protein binding, resulted by increasing GFR, ALB, and hemoglobin levels with extension of time after transplantation (van Hest et al., 2007). In the present study, the influence of POT was reflected in corresponding changes in ALB concentrations, which significantly impacted FUMPA. Alterations of protein binding had little effect on uMPA PK because of the low extraction ratio (Bowalgaha and Miners, 2001; Benet and Hoener, 2002). In addition, the significant positive association between QuMPA/F and BW was observed in the present study. This relationship is consistent with the known physiological properties.
Additionally, a gallbladder compartment was introduced to characterize the intermittent EHC process in the current popPK analysis. Generally, the intermittent gallbladder emptying process is considered to be triggered by ingestion of food (Ghibellini et al., 2006). The EHC process is mediated by multidrug resistance-associated protein 2, which is inhibited by CsA (Hesselink et al., 2005). All subjects in our study were cotreated with CsA. Meal time was set at 10 (study 1) and 9 (study 2) h postdosing, and the samplings before and after food intake were considered in the study protocol. The EHC triggered by food intake was applied during modeling. Nevertheless, the secondary peaks were not pronounced due to the inhibitory effect of CsA. Therefore, inhibition of EHC by CsA might likely explain why the final model estimated an extremely low %EHC with a high shrinkage (> 50%).
Regarding the metabolite MPAG, a statistically significant relationship was found between CLuMPAG/F and kidney function, which was consistent with findings of previous studies (de Winter et al., 2009; Musuamba et al., 2009; van Hest et al., 2009; Colom et al., 2014). A reduction in GFR from 90 to 15 mL/min led to a 3.67-fold increase in MPAG exposure. This could be because MPAG is primarily eliminated by the kidney through passive glomerular filtration and active tubular secretion (Bullingham et al., 1998).
Nevertheless, the previously reported competitive protein binding relationship between MPA and MPAG (de Winter et al., 2009; van Hest et al., 2009) was not observed, which might be associated with the relatively lower MPAG concentrations (median, 49.79 mg/L). Only 7.6% (56/734) of the tMPAG concentrations were >100 mg/L with a maximum of 177.9 mg/L in our study. At high concentrations, MPAG could displace MPA from its protein binding sites. It has been reported in vitro that FUMPA increased threefold as the MPAG concentration increased from 0 to 800 mg/L (Nowak and Shaw, 1995).
There are some limitations in the present study. Firstly, uMPAG concentrations were not determined and FUMPAG was fixed at 18%. The effect of ALB alteration on MPAG binding could not be investigated. MPAG is pharmacologically inactive and did not show significant influence on MPA PK in our analysis because of the relatively lower MPAG concentrations. Secondly, only one dose level of MMF was administered to most patients, which prevented us from investigating the reported nonlinear relationship between MMF dose and MPA exposure (de Winter et al., 2011). Lastly, all patients in our study were coadministered MMF and CsA, whereas TAC and CsA are well known to influence the EHC process differently. Therefore, our results might only be applicable to patients cotreated with CsA.
Conclusions
In summary, the established model adequately described the popPK characteristics of uMPA, tMPA, and MPAG. Large BSVs and RUVs were still observed, suggesting therapeutic drug monitoring would be necessary for optimization of MMF therapy. The estimated CLuMPA/F and FUMPA in Chinese kidney transplant recipients were comparable to those published previously in Caucasians. In addition, tMPA exposure reduced with decreasing ALB, which had little effect on uMPA exposure. Therefore, under lower ALB conditions, dose adjustment based on tMPA exposure might place patients at higher risk of overimmunosuppression. We recommend monitoring uMPA instead of tMPA to optimize MMF dosing for patients with lower ALB concentrations.
Data Availability Statement
The datasets for this article are not publicly available because of privacy and ethical restrictions. Requests to access the datasets should be directed to corresponding author (ZJ, zjiao@fudan.edu.cn).
Ethics Statement
The studies involving human participants were reviewed and approved by the Clinical Research Ethics Committee of Huashan Hospital, Fudan University. The patients/participants provided their written informed consent to participate in this study.
Author Contributions
ZJ, XQ, and MZ participated in the research design. CS, QZ, WN, XQ, and MZ contributed to the implementation of the research. ZJ, CS, QZ, and WN analyzed and interpreted the data. CS and ZJ drafted the manuscript. The final submitted version of the manuscript was reviewed and approved by all the authors.
Funding
This work was supported by the National Natural Science Foundation of China (No. 81573505), Weak Discipline Construction Project of Shanghai Municipal Commission of Health and Family Planning (No. 2016ZB0301-01), and 2016 Key Clinical Program of Clinical pharmacy of Shanghai Municipal Commission of Health and Family Planning.
Conflict of Interest
The authors declare that the research was conducted in the absence of any commercial or financial relationships that could be construed as a potential conflict of interest.
Acknowledgments
The authors would like to sincerely thank all patients participating in the research, and the following persons for their technical assistance in sample collection and bio-analysis: Mr. Yijun Dao, Mr. Jie Shen, Ms. Huiqi Liang, and Ms. Yan Zhong. The authors would also like to thank Editage [www.editage.cn] for English language editing.
Supplementary Material
The Supplementary Material for this article can be found online at: https://www.frontiersin.org/articles/10.3389/fphar.2020.00340/full#supplementary-material
Supplementary Table 1 | Key covariate model development steps
Supplementary Table 2 | Sensitivity analysis of observations over ±4 CWRES
Supplementary Figure 1 | Model-predicted covariate effect on unbound fraction of MPA. Black squares represent median values and error bars represent 95% confidence intervals of unbound fraction of MPA across 2000 simulation replicates. GFR, glomerular filtration rate; MPA, mycophenolic acid.
References
Atcheson, B. A., Taylor, P. J., Mudge, D. W., Johnson, D. W., Hawley, C. M., Campbell, S. B., et al. (2005). Mycophenolic acid pharmacokinetics and related outcomes early after renal transplant. Br. J. Clin. Pharmacol. 59, 271–280. doi: 10.1111/j.1365-2125.2004.02235.x
Bauer, R. J. (2017). NONMEM Users Guide: Introduction to NONMEM 7.4.1, (Gaithersburg, MD: ICON Plc), Available at: https://nonmem.iconplc.com/nonmem741 [Accessed September 12, 2018].
Benet, L. Z., Hoener, B. A. (2002). Changes in plasma protein binding have little clinical relevance. Clin. Pharmacol. Ther. 71, 115–121. doi: 10.1067/mcp.2002.121829
Bergstrand, M., Hooker, A. C., Wallin, J. E., Karlsson, M. O. (2011). Prediction-corrected visual predictive checks for diagnosing nonlinear mixed-effects models. AAPS J. 13, 143–151. doi: 10.1208/s12248-011-9255-z
Bowalgaha, K., Miners, J. O. (2001). The glucuronidation of mycophenolic acid by human liver, kidney and jejunum microsomes. Br. J. Clin. Pharmacol. 52, 605–609. doi: 10.1046/j.0306-5251.2001.01487.x
Bullingham, R. E., Nicholls, A. J., Kamm, B. R. (1998). Clinical pharmacokinetics of mycophenolate mofetil. Clin. Pharmacokinet. 34, 429–455. doi: 10.2165/00003088-199834060-00002
Chen, B., Shao, K., An, H. M., Shi, H. Q., Lu, J. Q., Zhai, X. H., et al. (2019). Population Pharmacokinetics and Bayesian Estimation of Mycophenolic Acid Exposure in Chinese Renal Allograft Recipients After Administration of EC-MPS. J. Clin. Pharmacol. 59, 578–589. doi: 10.1002/jcph.1352
Cho, E. K., Han, D. J., Kim, S. C., Burckart, G. J., Venkataramanan, R., Oh, J. M. (2004). Pharmacokinetic study of mycophenolic acid in Korean kidney transplant patients. J. Clin. Pharmacol. 44, 743–750. doi: 10.1177/0091270004266634
Colom, H., Lloberas, N., Andreu, F., Caldés, A., Torras, J., Oppenheimer, F., et al. (2014). Pharmacokinetic modeling of enterohepatic circulation of mycophenolic acid in renal transplant recipients. Kidney Int. 85, 1434–1443. doi: 10.1038/ki.2013.517
Colom, H., Andreu, F., van Gelder, T., Hesselink, D. A., de Winter, B. C. M., Bestard, O., et al. (2018). Prediction of Free from Total Mycophenolic Acid Concentrations in Stable Renal Transplant Patients: A Population-Based Approach. Clin. Pharmacokinet. 57, 877–893. doi: 10.1007/s40262-017-0603-8
Cremers, S., Schoemaker, R., Scholten, E., den Hartigh, J., Konig-Quartel, J., van Kan, E., et al. (2005). Characterizing the role of enterohepatic recycling in the interactions between mycophenolate mofetil and calcineurin inhibitors in renal transplant patients by pharmacokinetic modelling. Br. J. Clin. Pharmacol. 60, 249–256. doi: 10.1111/j.1365-2125.2005.02398.x
de Winter, B. C., van Gelder, T., Glander, P., Cattaneo, D., Tedesco-Silva, H., Neumann, I., et al. (2008). Population pharmacokinetics of mycophenolic acid : a comparison between enteric-coated mycophenolate sodium and mycophenolate mofetil in renal transplant recipients. Clin. Pharmacokinet. 47, 827–838. doi: 10.2165/0003088-200847120-00007
de Winter, B. C., van Gelder, T., Sombogaard, F., Shaw, L. M., van Hest, R. M., Mathot, R. A. (2009). Pharmacokinetic role of protein binding of mycophenolic acid and its glucuronide metabolite in renal transplant recipients. J. Pharmacokinet. Pharmacodyn. 36, 541–564. doi: 10.1007/s10928-009-9136-6
de Winter, B. C., Mathot, R. A., Sombogaard, F., Vulto, A. G., van Gelder, T. (2011). Nonlinear relationship between mycophenolate mofetil dose and mycophenolic acid exposure: implications for therapeutic drug monitoring. Clin. J. Am. Soc. Nephrol. 6, 656–663. doi: 10.2215/CJN.05440610
de Winter, B. C., Monchaud, C., Premaud, A., Pison, C., Kessler, R., Reynaud-Gaubert, M., et al. (2012). Bayesian estimation of mycophenolate mofetil in lung transplantation, using a population pharmacokinetic model developed in kidney and lung transplant recipients. Clin. Pharmacokinet. 51, 29–39. doi: 10.2165/11594050-000000000-00000
Delattre, M., Lavielle, M., Poursat, M.-A. (2012). BIC selection procedures in mixed effects models, (Inria: Domaine de Voluceau - Rocquencourt) Available at: https://hal.inria.fr/hal-00696435 [Accessed January 28, 2019].
Ette, E. I., Ludden, T. M. (1995). Population pharmacokinetic modeling: the importance of informative graphics. Pharm. Res. 12, 1845–1855. doi: 10.1023/a:1016215116835
Ette, E. I., Williams, P. J., Kim, Y. H., Lane, J. R., Liu, M. J., Capparelli, E. V. (2003). Model appropriateness and population pharmacokinetic modeling. J. Clin. Pharmacol. 43, 610–623. doi: 10.1177/0091270003253624
Food and Drug Administration (FDA). (2019). CellCept label Prescribing Information for CellCept®, Available at: https://www.accessdata.fda.gov/drugsatfda_docs/label/2019/050722s040,050723s041,050758s037,050759s045lbl.pdf [Accessed February 5, 2020].
Funaki, T. (1999). Enterohepatic circulation model for population pharmacokinetic analysis. J. Pharm. Pharmacol. 51, 1143–1148. doi: 10.1211/0022357991776831
Geng, F., Jiao, Z., Dao, Y. J., Qiu, X. Y., Ding, J. J., Shi, X. J., et al. (2012). The association of the UGT1A8, SLCO1B3 and ABCC2/ABCG2 genetic polymorphisms with the pharmacokinetics of mycophenolic acid and its phenolic glucuronide metabolite in Chinese individuals. Clin. Chim. Acta 413, 683–690. doi: 10.1016/j.cca.2011.12.003
Ghibellini, G., Leslie, E. M., Brouwer, K. L. (2006). Methods to evaluate biliary excretion of drugs in humans: an updated review. Mol. Pharm. 3, 198–211. doi: 10.1021/mp060011k
Guiastrennec, B., Sonne, D. P., Hansen, M., Bagger, J. I., Lund, A., Rehfeld, J. F., et al. (2016). Mechanism-Based Modeling of Gastric Emptying Rate and Gallbladder Emptying in Response to Caloric Intake. CPT Pharmacometrics Syst. Pharmacol. 5, 692–700. doi: 10.1002/psp4.12152
Guillet, B. A., Simon, N. S., Purgus, R., Botta, C., Morange, S., Berland, Y., et al. (2010). Population pharmacokinetics analysis of mycophenolic acid in adult kidney transplant patients with chronic graft dysfunction. Ther. Drug Monit. 32, 427–432. doi: 10.1097/FTD.0b013e3181e6b54d
Hart, A., Smith, J. M., Skeans, M. A., Gustafson, S. K., Wilk, A. R., Robinson, A., et al. (2018). OPTN/SRTR 2016 Annual Data Report: Kidney. Am. J. Transpl. 18, 18–113. doi: 10.1111/ajt.14557
Hart, A., Smith, J. M., Skeans, M. A., Gustafson, S. K., Wilk, A. R., Castro, S., et al. (2019). OPTN/SRTR 2017 Annual Data Report: Kidney. Am. J. Transpl. 19, 19–123. doi: 10.1111/ajt.15274
Hesselink, D. A., van Hest, R. M., Mathot, R. A., Bonthuis, F., Weimar, W., de Bruin, R. W., et al. (2005). Cyclosporine interacts with mycophenolic acid by inhibiting the multidrug resistance-associated protein 2. Am. J. Transpl. 5, 987–994. doi: 10.1046/j.1600-6143.2005.00779.x
Jiao, Z., Zhong, Y., Shen, J., Yu, Y.-q. (2005). Simple High-Performance Liquid Chromatographic Assay, with Post-Column Derivatization, for Simultaneous Determination of Mycophenolic Acid and its Glucuronide Metabolite in Human Plasma and Urine. Chromatographia 62, 363–371. doi: 10.1365/s10337-005-0635-3
Jiao, Z., Zhong, J. Y., Zhang, M., Shi, X. J., Yu, Y. Q., Lu, W. Y. (2007). Total and free mycophenolic acid and its 7-O-glucuronide metabolite in Chinese adult renal transplant patients: pharmacokinetics and application of limited sampling strategies. Eur. J. Clin. Pharmacol. 63, 27–37. doi: 10.1007/s00228-006-0215-y
Jiao, Z., Ding, J.-j., Shen, J., Liang, H.-q., Zhong, L.-j., Wang, Y., et al. (2008). Population pharmacokinetic modelling for enterohepatic circulation of mycophenolic acid in healthy Chinese and the influence of polymorphisms in UGT1A9. Br. J. Clin. Pharmacol. 65, 893–907. doi: 10.1111/j.1365-2125.2008.03109.x
Kaplan, B., Gruber, S. A., Nallamathou, R., Katz, S. M., Shaw, L. M. (1998). Decreased protein binding of mycophenolic acid associated with leukopenia in a pancreas transplant recipient with renal failure. Transplantation 65, 1127–1129. doi: 10.1097/00007890-199804270-00019
Kiang, T. K., Ensom, M. H. (2016). Therapeutic drug monitoring of mycophenolate in adult solid organ transplant patients: an update. Expert Opin. Drug Metab. Toxicol. 12, 545–553. doi: 10.1517/17425255.2016.1170806
Kidney Disease: Improving Global Outcomes CKD Work Group (2013). KDIGO 2012 Clinical Practice Guideline for the Evaluation and Management of Chronic Kidney Disease. Kidney Int. Suppl. 3, 19–62. doi: 10.1038/kisup.2012.64
Kuypers, D. R., Le Meur, Y., Cantarovich, M., Tredger, M. J., Tett, S. E., Cattaneo, D., et al. (2010). Consensus report on therapeutic drug monitoring of mycophenolic acid in solid organ transplantation. Clin. J. Am. Soc. Nephrol. 5, 341–358. doi: 10.2215/CJN.07111009
Le Guellec, C., Bourgoin, H., Buchler, M., Le Meur, Y., Lebranchu, Y., Marquet, P., et al. (2004). Population pharmacokinetics and Bayesian estimation of mycophenolic acid concentrations in stable renal transplant patients. Clin. Pharmacokinet. 43, 253–266. doi: 10.2165/00003088-200443040-00004
Le Meur, Y., Buchler, M., Thierry, A., Caillard, S., Villemain, F., Lavaud, S., et al. (2007). Individualized mycophenolate mofetil dosing based on drug exposure significantly improves patient outcomes after renal transplantation. Am. J. Transpl. 7, 2496–2503. doi: 10.1111/j.1600-6143.2007.01983.x
Le Meur, Y., Borrows, R., Pescovitz, M. D., Budde, K., Grinyo, J., Bloom, R., et al. (2011). Therapeutic drug monitoring of mycophenolates in kidney transplantation: report of The Transplantation Society consensus meeting. Transplant. Rev. (Orlando) 25, 58–64. doi: 10.1016/j.trre.2011.01.002
Levey, A. S., Stevens, L. A., Schmid, C. H., Zhang, Y. L., Castro, A. F., 3rd, Feldman, H. I., et al. (2009). A new equation to estimate glomerular filtration rate. Ann. Int. Med. 150, 604–612. doi: 10.7326/0003-4819-150-9-200905050-00006
Li, P., Shuker, N., Hesselink, D. A., van Schaik, R. H., Zhang, X., van Gelder, T. (2014). Do Asian renal transplant patients need another mycophenolate mofetil dose compared with Caucasian or African American patients? Transpl. Int. 27, 994–1004. doi: 10.1111/tri.12382
Ling, J., Shi, J., Jiang, Q., Jiao, Z. (2015). Population pharmacokinetics of mycophenolic acid and its main glucuronide metabolite: a comparison between healthy Chinese and Caucasian subjects receiving mycophenolate mofetil. Eur. J. Clin. Pharmacol. 71, 95–106. doi: 10.1007/s00228-014-1771-1
Liu, F., Xu, L., Sheng, C., Xu, X., Zhang, M., Jiao, Z. (2018). Optimization and application of an HPLC method for quantification of inosine-5’-monophosphate dehydrogenase activity as a pharmacodynamic biomarker of mycophenolic acid in Chinese renal transplant patients. Clin. Chim. Acta 485, 333–339. doi: 10.1016/j.cca.2018.06.042
Lu, X. Y., Huang, H. F., Sheng-Tu, J. Z., Liu, J. (2005). Pharmacokinetics of mycophenolic acid in Chinese kidney transplant patients. J. Zhejiang Univ. Sci. B. 6, 885–891. doi: 10.1631/jzus.2005.B0885
Mao, J. J., Jiao, Z., Yun, H. Y., Zhao, C. Y., Chen, H. C., Qiu, X. Y., et al. (2018). External Evaluation of Population Pharmacokinetic Models for Cyclosporine in Adult Renal Transplant Recipients. Br. J. Clin. Pharmacol. 84, 153–171. doi: 10.1111/bcp.13431
Miura, M., Satoh, S., Niioka, T., Kagaya, H., Saito, M., Hayakari, M., et al. (2009). Early phase limited sampling strategy characterizing tacrolimus and mycophenolic acid pharmacokinetics adapted to the maintenance phase of renal transplant patients. Ther. Drug Monit. 31, 467–474. doi: 10.1097/FTD.0b013e3181ae44b9
Mo, G., Baldwin, J. R., Luffer-Atlas, D., Ilaria, R. L., Jr., Conti, I., Heathman, M., et al. (2018). Population Pharmacokinetic Modeling of Olaratumab, an Anti-PDGFRalpha Human Monoclonal Antibody, in Patients with Advanced and/or Metastatic Cancer. Clin. Pharmacokinet. 57, 355–365. doi: 10.1007/s40262-017-0562-0
Mudge, D. W., Atcheson, B. A., Taylor, P. J., Pillans, P. I., Johnson, D. W. (2004). Severe toxicity associated with a markedly elevated mycophenolic acid free fraction in a renal transplant recipient. Ther. Drug Monit. 26, 453–455. doi: 10.1097/00007691-200408000-00017
Musuamba, F. T., Rousseau, A., Bosmans, J. L., Senessael, J. J., Cumps, J., Marquet, P., et al. (2009). Limited sampling models and Bayesian estimation for mycophenolic acid area under the curve prediction in stable renal transplant patients co-medicated with ciclosporin or sirolimus. Clin. Pharmacokinet. 48, 745–758. doi: 10.2165/11318060-000000000-00000
Nowak, I., Shaw, L. M. (1995). Mycophenolic acid binding to human serum albumin: characterization and relation to pharmacodynamics. Clin. Chem. 41, 1011–1017. doi: 10.1093/clinchem/41.7.1011
Okour, M., Jacobson, P. A., Ahmed, M. A., Israni, A. K., Brundage, R. C. (2018). Mycophenolic Acid and Its Metabolites in Kidney Transplant Recipients: A Semimechanistic Enterohepatic Circulation Model to Improve Estimating Exposure. J. Clin. Pharmacol. 58, 628–639. doi: 10.1002/jcph.1064
Owen, J. S., Fiedler-Kelly, J. (2014). Introduction to population pharmacokinetic/pharmacodynamic analysis with nonlinear mixed effects models (Hoboken: John Wiley & Sons, Inc.).
Picard-Hagen, N., Gayrard, V., Alvinerie, M., Smeyers, H., Ricou, R., Bousquet-Melou, A., et al. (2001). A nonlabeled method to evaluate cortisol production rate by modeling plasma CBG-free cortisol disposition. Am. J. Physiol. Endocrinol. Metab. 281, E946–E956. doi: 10.1152/ajpendo.2001.281.5.E946
Shaw, L. M., Holt, D. W., Oellerich, M., Meiser, B., van Gelder, T. (2001). Current issues in therapeutic drug monitoring of mycophenolic acid: report of a roundtable discussion. Ther. Drug Monit. 23, 305–315. doi: 10.1097/00007691-200108000-00001
Shaw, L. M., Korecka, M., Venkataramanan, R., Goldberg, L., Bloom, R., Brayman, K. L. (2003). Mycophenolic acid pharmacodynamics and pharmacokinetics provide a basis for rational monitoring strategies. Am. J. Transpl. 3, 534–542. doi: 10.1034/j.1600-6143.2003.00079.x
Staatz, C. E., Tett, S. E. (2007). Clinical pharmacokinetics and pharmacodynamics of mycophenolate in solid organ transplant recipients. Clin. Pharmacokinet. 46, 13–58. doi: 10.2165/00003088-200746010-00002
Staatz, C. E., Duffull, S. B., Kiberd, B., Fraser, A. D., Tett, S. E. (2005). Population pharmacokinetics of mycophenolic acid during the first week after renal transplantation. Eur. J. Clin. Pharmacol. 61, 507–516. doi: 10.1007/s00228-005-0927-4
Tobler, A., Muhlebach, S. (2013). Intravenous phenytoin: a retrospective analysis of Bayesian forecasting versus conventional dosing in patients. Int. J. Clin. Pharm. 35, 790–797. doi: 10.1007/s11096-013-9809-5
Vaida, F., Blanchard, S. (2005). Conditional Akaike information for mixed-effects models. Biometrika 92, 351–370. doi: 10.1093/biomet/92.2.351
van Gelder, T., Le Meur, Y., Shaw, L. M., Oellerich, M., DeNofrio, D., Holt, C., et al. (2006). Therapeutic drug monitoring of mycophenolate mofetil in transplantation. Ther. Drug Monit. 28, 145–154. doi: 10.1097/01.ftd.0000199358.80013.bd
van Hest, R. M., van Gelder, T., Bouw, R., Goggin, T., Gordon, R., Mamelok, R. D., et al. (2007). Time-dependent clearance of mycophenolic acid in renal transplant recipients. Br. J. Clin. Pharmacol. 63, 741–752. doi: 10.1111/j.1365-2125.2006.02841.x
van Hest, R. M., van Gelder, T., Vulto, A. G., Shaw, L. M., Mathot, R. A. (2009). Pharmacokinetic modelling of the plasma protein binding of mycophenolic acid in renal transplant recipients. Clin. Pharmacokinet. 48, 463–476. doi: 10.2165/11312600-000000000-00000
Weber, L. T., Shipkova, M., Armstrong, V. W., Wagner, N., Schutz, E., Mehls, O., et al. (2002). The pharmacokinetic-pharmacodynamic relationship for total and free mycophenolic Acid in pediatric renal transplant recipients: a report of the german study group on mycophenolate mofetil therapy. J. Am. Soc. Nephrol. 13, 759–768.
Wright, D. F., Duffull, S. B. (2013). A Bayesian dose-individualization method for warfarin. Clin. Pharmacokinet. 52, 59–68. doi: 10.1007/s40262-012-0017-6
Yano, Y., Beal, S. L., Sheiner, L. B. (2001). Evaluating pharmacokinetic/pharmacodynamic models using the posterior predictive check. J. Pharmacokinet. Pharmacodyn. 28, 171–192. doi: 10.1023/a:1011555016423
Yau, W. P., Vathsala, A., Lou, H. X., Chan, E. (2007). Is a standard fixed dose of mycophenolate mofetil ideal for all patients? Nephrol. Dial. Transpl. 22, 3638–3645. doi: 10.1093/ndt/gfm468
Yau, W.-P., Vathsala, A., Lou, H.-X., Zhou, S., Chan, E. (2009). Mechanism-Based Enterohepatic Circulation Model of Mycophenolic Acid and Its Glucuronide Metabolite: Assessment of Impact of Cyclosporine Dose in Asian Renal Transplant Patients. J. Clin. Pharmacol. 49, 684–699. doi: 10.1177/0091270009332813
Yu, Z. C., Zhou, P. J., Wang, X. H., Francoise, B., Xu, D., Zhang, W. X., et al. (2017). Population pharmacokinetics and Bayesian estimation of mycophenolic acid concentrations in Chinese adult renal transplant recipients. Acta Pharmacol. Sin. 38, 1566–1579. doi: 10.1038/aps.2017.115
Zhao, C. Y., Jiao, Z., Mao, J. J., Qiu, X. Y. (2016). External evaluation of published population pharmacokinetic models of tacrolimus in adult renal transplant recipients. Br. J. Clin. Pharmacol. 81, 891–907. doi: 10.1111/bcp.12830
Zhou, P. J., Xu, D., Yu, Z. C., Wang, X. H., Shao, K., Zhao, J. P. (2007). Pharmacokinetics of mycophenolic acid and estimation of exposure using multiple linear regression equations in Chinese renal allograft recipients. Clin. Pharmacokinet. 46, 389–401. doi: 10.2165/00003088-200746050-00002
Keywords: population pharmacokinetics, nonlinear mixed-effect modeling, unbound mycophenolic acid, linear protein binding, adult kidney transplant recipients
Citation: Sheng C, Zhao Q, Niu W, Qiu X, Zhang M and Jiao Z (2020) Effect of Protein Binding on Exposure of Unbound and Total Mycophenolic Acid: A Population Pharmacokinetic Analysis in Chinese Adult Kidney Transplant Recipients. Front. Pharmacol. 11:340. doi: 10.3389/fphar.2020.00340
Received: 18 December 2019; Accepted: 09 March 2020;
Published: 20 March 2020.
Edited by:
Sabina Passamonti, University of Trieste, ItalyReviewed by:
Tony K.L. Kiang, University of Alberta, CanadaSnehal Samant, University of Florida, United States
Copyright © 2020 Sheng, Zhao, Niu, Qiu, Zhang and Jiao. This is an open-access article distributed under the terms of the Creative Commons Attribution License (CC BY). The use, distribution or reproduction in other forums is permitted, provided the original author(s) and the copyright owner(s) are credited and that the original publication in this journal is cited, in accordance with accepted academic practice. No use, distribution or reproduction is permitted which does not comply with these terms.
*Correspondence: Zheng Jiao, zjiao@fudan.edu.cn
†ORCID: Changcheng Sheng, orcid.org/0000-0001-5844-0154; Zheng Jiao, orcid.org/0000-0001-7999-7162