- School of Chinese Medicine, Hong Kong Baptist University, Kowloon, Hong Kong
Polygoni Multiflori Radix (PMR, Heshouwu in Chinese), derived from the tuberous roots of Polygonum multiflorum Thunb., is a widely-used Chinese medicinal material. For traditional clinical use, raw PMR (RPMR) is processed by nine cycles of steaming and drying to generate processed PMR (PPMR); RPMR and PPMR have distinct medicinal purposes based on the theory of traditional Chinese medicine. While PMR has been processed for hundreds of years, including the present, the chemistry of that processing has not been well studied. In this study, targeted and untargeted metabolomics analyses using ultra-performance liquid chromatography-quadrupole/time-of-flight mass spectrometry (UPLC-QTOF-MS/MS) and ultra-performance liquid chromatography-quadrupole/triple quadrupole mass spectrometry (UPLC-QqQ-MS/MS) were integrated to investigate the processing chemistry of PMR. The results demonstrate that processing by nine cycles of steaming and drying qualitatively and quantitatively alters the chemical profile of PMR. Several mechanisms, namely hydrolysis, dehydration, isomerization, and Maillard reaction appear to be involved in the chemical transformation that occurs. The qualitative and quantitative data further suggest that nine cycles might be necessary for the preparation of PPMR, as PPMR that has been processed nine times shows significant differences in its chemical profile.
Introduction
Polygoni Multiflori Radix (PMR, heshouwu in Chinese), derived from the tuberous roots of Polygonum multiflorum Thunb., is a widely-used Chinese medicinal material (CMM) (Chinese Pharmacopoeia Commission, 2015). For traditional clinical use, raw PMR (RPMR) is processed by nice cycles of steaming and sun-drying to generate processed PMR (PPMR) (Li, 2008). According to the theory of Chinese medicine, RPMR and PPMR are prescribed for distinct medicinal purposes (Han et al., 2009; Chinese Pharmacopoeia Commission, 2015). RPMR is used to resolve toxin and free the stool, while PPMR is regarded as a traditional tonic for its rejuvenation effects, with the function of supplying the liver and kidney, as well as strengthening the sinews and bones (Chinese Pharmacopoeia Commission, 2015). Modern pharmacological research has revealed that RPMR and PPMR have different bioactivities (Ye, 1987; Zhao et al., 2008). Nevertheless, the scientific basis involved in the processing of PMR is not yet well understood. The alternate steaming and sun-drying appears to transform certain bioactive components, changing the herb's therapeutic properties. While those transformations are taken as theoretically true, in modern pharmaceutical processing, these steps are being abbreviated such that most PPMR in the market today has been processed through only one cycle (Chinese Pharmacopoeia Commission, 2015). The resulting product is being used, but no one has evaluated it in terms of its chemistry to determine if it resembles PMR processed through the prescribed nine cycles. Research on processing chemistry to elucidate how processing alters the chemical components is the first step to establishing a scientific basis for PMR processing.
It has been well demonstrated that several types of secondary metabolites are the major chemical components of PMR; of these, stilbene glucosides, anthraquinones and polyphenols, are most representative (Yao et al., 2006; Han et al., 2013; Lin et al., 2015b). By quantifying these secondary metabolites using liquid chromatography coupled with diode-array detectors or mass spectrometry (LC-DAD/MS), some previous studies investigated the processing chemistry of PMR. The results showed that processing indeed changed the contents of certain chemicals in PMR (Liang et al., 2010; Liu et al., 2011; Chen et al., 2016; Wang et al., 2016). For example, we previously found that the contents of two anthraquinones (emodin and physicon) in PMR were increased by the processing, while one stilbene glucoside named 2,3,5,4′-tetrahydroxystilbene-2-O-β-D-glucoside (THSG) was decreased (Liang et al., 2010). However, these studies are deficient in the following two aspects. Firstly, they selected several typical chemical components for the determination, and did not characterize the entire chemical profile of PMR. Secondly, and more importantly, these studies analyzed PPMR that had been processed by only one cycle of steaming and drying (Liang et al., 2010; Liu et al., 2011; Chen et al., 2016; Wang et al., 2016), which is different from the traditional processing technology of PMR which stipulates nine cycles of steaming and sun-drying (Li, 2008). Given these facts, further research is needed to fully elucidate the processing chemistry of PMR.
In recent years, metabolomics, both targeted and untargeted, has been widely applied to comprehensively investigate chemical variation in CMMs including processing. Untargeted metabolomics aims to qualitatively determine all measurable analytes in a sample, including chemical unknowns, while targeted metabolomics further absolutely quantifies a group of defined chemicals. The integration of targeted and untargeted metabolomics can offer deeper insights into the processing chemistry of CMMs by providing comprehensive qualitative and quantitative information of total secondary metabolites. Actually, metabolomics has been preliminarily attempted for investigating the processing chemistry of PMR (Yu et al., 2017). However, absolute quantification was not involved in this study. Moreover, the study only observed impacts of processing time, rather than processing cycles, on PMR chemical profiles. Thus, here we integrated targeted and untargeted metabolomics to further investigate the processing chemistry of PMR. The study was designed in the following steps. Step 1, PPMR was prepared from RPMR by nine cycles of steaming and sun-drying. Step 2, the secondary metabolite profiles of RPMR and PPMR were characterized and compared by untargeted metabolomics using ultra-performance liquid chromatography-quadrupole/time-of-flight mass spectrometry (UPLC-QTOF-MS/MS), in which the chemicals that were most significantly altered by the processing were statistically explored by multivariate statistical analysis. Step 3, 12 typical chemical components were quantitatively determined by targeted metabolomics using ultra-high-performance liquid chromatograph with triple quadrupole mass spectrometry (UHPLC-QqQ-MS/MS) to further observe their content variations in each processing cycle. Steps 4, based on the qualitative and quantitative results, the potential mechanisms involved in the processing-induced chemical transformations were proposed.
Materials and Methods
Plant Materials, Chemicals, and Reagents
RPMR materials were collected from Kaili City (Guizhou, China), the geo-authentic producing area of PMR, and were authenticated as the tuberous roots of Polygonum multiflorum Thunb. by Prof. Zhongzhen Zhao. The voucher specimens were deposited in the Chinese Medicines Centre, Hong Kong Baptist University.
Chemical standards including gallic acid, proanthocyanidin B1, proanthocyanidin B2, trans-2,3,5,4′-tetrahydroxylstilbene-2-O-β-D-glucoside (trans-THSG), emodin, physcion were ordered from Chengdu Must Bio-Technology Co., Ltd. (Chengdu, China); epicatechin, epicatechin-gallate, emodin-8-O-β-D-glucoside, physcion-8-O-β-D-glucoside were supplied by Chengdu Xunchen Biological Technology Co., Ltd. (Chengdu, China). Acetonitrile (HPLC grade) and methanol (HPLC grade) were supplied by E. Merck (Darmstadt, Germany); ammounium acetate (Sigma-aldrich, USA) was purchased; formic acid (HPLC grade) was purchased from Tedia (USA); ultra-pure water was prepared by a Mili-Q water purification system (Millipore, MA, USA).
Sample Preparation
Processing
RPMR (20 kg) was randomly divided into 8 groups. One tenth of each group were reserved as materials of RPMR; the rest was subsequently processed. To fix the specific factors involved in the processing, reports in the literature (Li, 2008; Liang et al., 2010; Liu et al., 2011; Chen et al., 2016; Wang et al., 2016) and the Chinese pharmacopeia (2015 edition) (Chinese Pharmacopoeia Commission, 2015) were referenced. Finally, 4 h steaming with black bean (put one layer of water-soaked black beans and one layer of RPMR slices in a pot, repeat the layers, and then steam over boiling water) and then 24 h sun-drying, repeated for a total of 9 cycles, were used as processing conditions. Samples were retained after each cycle, thus generating nine PPMR samples (PPMR1-PPMR9). The color of PPMR samples became darker after each processing cycle (Figure S1).
Extraction
For the extraction, our previous study was referenced (Liang et al., 2018). Each RPMR and PPMR sample was powdered, accurately weighed (0.1 g), and put into a 50-mL centrifugal tube with 20 mL 70% methanol. The mixture was then ultra-sonicated for 45 min at 60°C. After that, the solution was centrifuged at 3,000 rpm for 10 min to obtain the supernatant. The extraction procedure was repeated one more time. Then 5 mL 70% methanol was used to wash the residue. The three resultant solutions were combined and made up to 50 mL, which was then filtered through a 0.22 μm filter for further analysis.
Untargeted Metabolomics Analysis
UHPLC-QTOF-MS/MS Conditions
Untargeted metabolomics analysis was performed on an Agilent 6540 UHPLC-QTOF-MS/MS system (Agilent Technologies, USA). The chromatographic separation was achieved on a UHPLC C18 analytical column (2.1 × 100 mm, I.D. 1.7 μm, BEH) coupled with a C18 pre-column (2.1 × 5 mm, I.D.1.7 μm, ACQUITY UPLC BEH, Waters, USA). The elution was conducted under the following conditions: the mobile phase consisted of (A) water containing 0.1% formic acid and (B) acetonitrile containing 0.1% formic acid, and the gradient program was: 2–5% B (0–2 min); 5–70% B (2–16 min); 70–100% B (16–23 min); 100% B (23–26 min), with 4 min of balance back to 2% B. The injection volume was 3 μL, and the flow rate was 0.4 mL/min. The mass spectra were acquired in both negative and positive modes, m/z ranging from 100 to 1,700, ESI ion source. The dry gas (N2) flow rate was 8 L/min with the temperature at 300°C. The capillary voltage, nozzle voltage, and fragment voltage were set at 4500 V, 500 V and 150 V, respectively; while nebulizer pressure was 45 psi, and column temperature was set at 40°C.
Establishment of In-house Database and Peak Characterization
Previously reported chemical components derived from RPMR and PPMR were collected and summarized in a Microsoft Office Excel table, and the table was applied to establish a compound database using Agilent Mass Hunter PCDL Manager software (Agilent Technologies, B.04.00, 2011). The database included compound name, chemical structure, molecular formula, weight and related references. Agilent Mass Hunter Work station software-Qualitative Analysis (version B.06.00, Agilent Technologies 2012) was used. Base Peak Chromatogram (BPC with m/z ranging from 100 to 1,000) was selected to show the results. The empirical molecular formulas were deduced by a comparison of the accurately measured mass values and the theoretical exact mass values of protonated and deprotonated molecular ions and/or fragment ions with a mass accuracy <10 ppm, and then matched with known compounds in the database using the “Find” function. For those compounds which were not listed in the PCDL database, possible formulas were deduced according to the molecular mass, fragment ions and mass accuracy.
Multivariate Statistical Analysis
The raw data of UPLC-QTOF-MS/MS were processed by DA Reprocessor (version B.06.00, Agilent Technologies, Inc. 2012), and the parameters were set as follows: retention time range from 0 to 30 min, mass range 100–1,000 Da, minimum absolute height 5,000 counts, mass tolerance 10 ppm, peak spacing tolerance within 0.0025 m/z and the limit assigned charge states to a maximum of 5. The generated data was then processed for principal component analysis (PCA) and Volcano Plot analysis by Mass Profiler Professional (2.0 vision, Agilent Technologies, Inc. 2009). The Volcano Plot was used to provide information regarding the differential abundance between raw and nine cycles processing samples based on p-value (<0.05) and fold-change at 3.
Targeted Metabolomics Analysis
UHPLC-QqQ-MS/MS Conditions
The targeted metabolomics analysis was conducted on an Agilent 6460 UHPLC-QqQ-MS/MS (Agilent Technologies, USA) with ESI ion source. The UHPLC-QqQ-MS/MS conditions were optimized based on our previous study (Liang et al., 2018). The chromatographic separations was achieved on a UHPLC C18 analytical column (2.1 × 100 mm, I.D. 1.7 μm, BEH) coupled with a C18 pre-column (2.1 × 5 mm, I.D.1.7 μm, ACQUITY UPLC BEH, Waters, USA) by two different conditions: (1) the mobile phase consisted of (A) water containing 0.1% formic acid and (B) acetonitrile containing 0.1%, and the gradient program was: 2% B (0–0.5 min); 5–15% B, (0.5–2 min); 15–40% B (2–8 min); 40–100% B (8–12 min); 100% B, (12–15 min), with 3 min of balance back to 2% B. The flow rate was 0.35 mL/min, and the injection volume was 2 μL. The mass spectra were acquired in negative mode, and the parameters were as follows: dry gas (N2) flowrate 8 L/min with the temperature at 350°C; sheath gas flow 8 L/min with heater at 350°C; nebulizer pressure, 45 psi; capillary voltage 3,500 V for ESI, 500 V charging, and with a dwell time of 20 ms for each ion pair. Other details are shown in Table 2; (2) the mobile phase consisted of 3 mM ammonium acetate in water (A) and methanol (B), and the gradient program was: 0–7 min, 35–100% B; 7–9 min, 100% B), with 3 min of balance back to 35% B. The flow rate was 0.35 mL/min; the injection volume was 2 μL; the column temperature was 60°C. Negative mode was selected for the mass spectra, and the details of parameters were set as: dry gas (N2) flowrate 7 L/min with temperature at 300°C; sheath gas flow 8 L/min with the sheath gas heater 350°C; nebulizer pressure, 45 psi; 500 V charging, capillary voltage 3,500 V for ESI, and with a dwell time of 40 ms for each ion pair. Other details are shown in Table 2.
Quantitative Method Validation
The UPLC-QqQ-MS/MS methods for quantitative determination of the 12 chemical compounds were validated with regard to linearity, sensitivity, precision, repeatability, stability and recovery.
The stock solutions of reference compounds were diluted with methanol to yield a series of appropriate concentration solutions for the construction of the calibration curves. The limits of detection (LODs) and limits of quantification (LOQs) were determined with signal-to-noise (S/N) ratios of 3 and 10, respectively.
The intra-day and inter-day variations were selected to determine the precision of the assay method. To assess intra-day variation, PPMR1 sample was extracted and analyzed for six replicates within 1 day; and to assess inter-day variation, the same sample was analyzed in triplicates in for two successive days. For repeatability, PPMR1 was extracted six times; the six extracts were analyzed, and the variation was used for repeatability evaluation. Stability test was performed by analyzing the extract of PPMR1 at 0, 2, 4, 8, 12, 24, and 72 h, respectively.
As for the recovery validation, 0.1 g of each of PPMR1 with known contents of the target analyses were accurately weighed. Then each was spiked with different amounts (low, middle and high level) of reference standards (gallic acid: 56.00, 70.00, and 84.00 μg; proanthocyanidin B1: 16.00, 21.00, and 25.00 μg; proanthocyanidin B2: 4.00, 5.00, and 6.00 μg; trans-THSG: 3.30, 4.10, and 4.90 mg; epicatechin: 29.00, 36.00, and 43.00 μg; epicatechin-3-gallate: 19.00, 24.00, and 28.00 μg; emodin-8-O-β-D-glucoside: 132.00, 166.00, and 199.00 μg; physcion-8-O-β-D-glucoside: 75.00, 93.00, and 112.00 μg; emodin: 29.00, 36.00, and 43.00 μg; physcion: 12.00, 15.00, and 18.00 μg, in solutions), then extracted according to the sample preparation procedure listed in section Extraction and analyzed in triplicate.
Quantitative Data Analysis
Three samples were taken from each processing cycle in order to assess the variation at each processing cycle; each sample was then analyzed three times, and the results of all nine analyses were averaged. Data were processed by Agilent Mass Hunter Work station software-Quantitative Analysis (version B.06.00, Build 6.0.388.1, Agilent Technologies, Inc. 2008). The charts of results were produced by GraphPad Prism 5 software (GraphPad, USA).
Results and Discussion
Untargeted Metabolomics Analysis
Optimization of UHPLC-QTOF- MS/MS Analytical Conditions
LC-QTOF-MS/MS is one of the most frequently used techniques for untargeted metabolomics analysis of CMMs. In a QTOF-MS/MS analysis, each precursor ion selected by the quadrupole mass analyzer is dissociated in the collision cell, and the generated fragment ions are then successively detected by the TOF analyzer. The principle of QTOF-MS/MS allows it to effectively detect a wide range of chemicals in a few minutes. Furthermore, it can provide accurate mass measurement and sufficient fragment information for secondary metabolite identification (Chernushevich et al., 2001). In this study, untargeted metabolomics analysis was therefore performed by UHPLC-QTOF-MS/MS. To achieve more fragment information for chemical components identification, both negative and positive ion modes were used. For chromatographic separation, different mobile phases were compared, including two organic phases: acetonitrile and methanol, as well as two additives: formic acid and 3 mM ammonium acetate. Finally, 0.1% formic acid–water and 0.1% formic acid–acetonitrile was selected because they can elute more chemical compounds with better separation, as well as it generated higher value of the total ion abundances (Figure S2).
Compounds Identification
A total of 87 compounds were definitely or tentatively identified in RPMR and PPMR by chemical standards and/or the established in-house database (Table 1; Qiu et al., 2013; Lin et al., 2015a; Wang et al., 2017). The representative LC-MS base peak chromatograms (BPCs) for RPMR and PPMR are shown in Figure 1. Three types of chemicals, namely stilbenes, anthraquinones, and catechin, were identified as the major secondary metabolites of RPMR and PPMR, and typical compounds of these three types of chemicals are used as examples here to explain the mass fragmentation pathways.
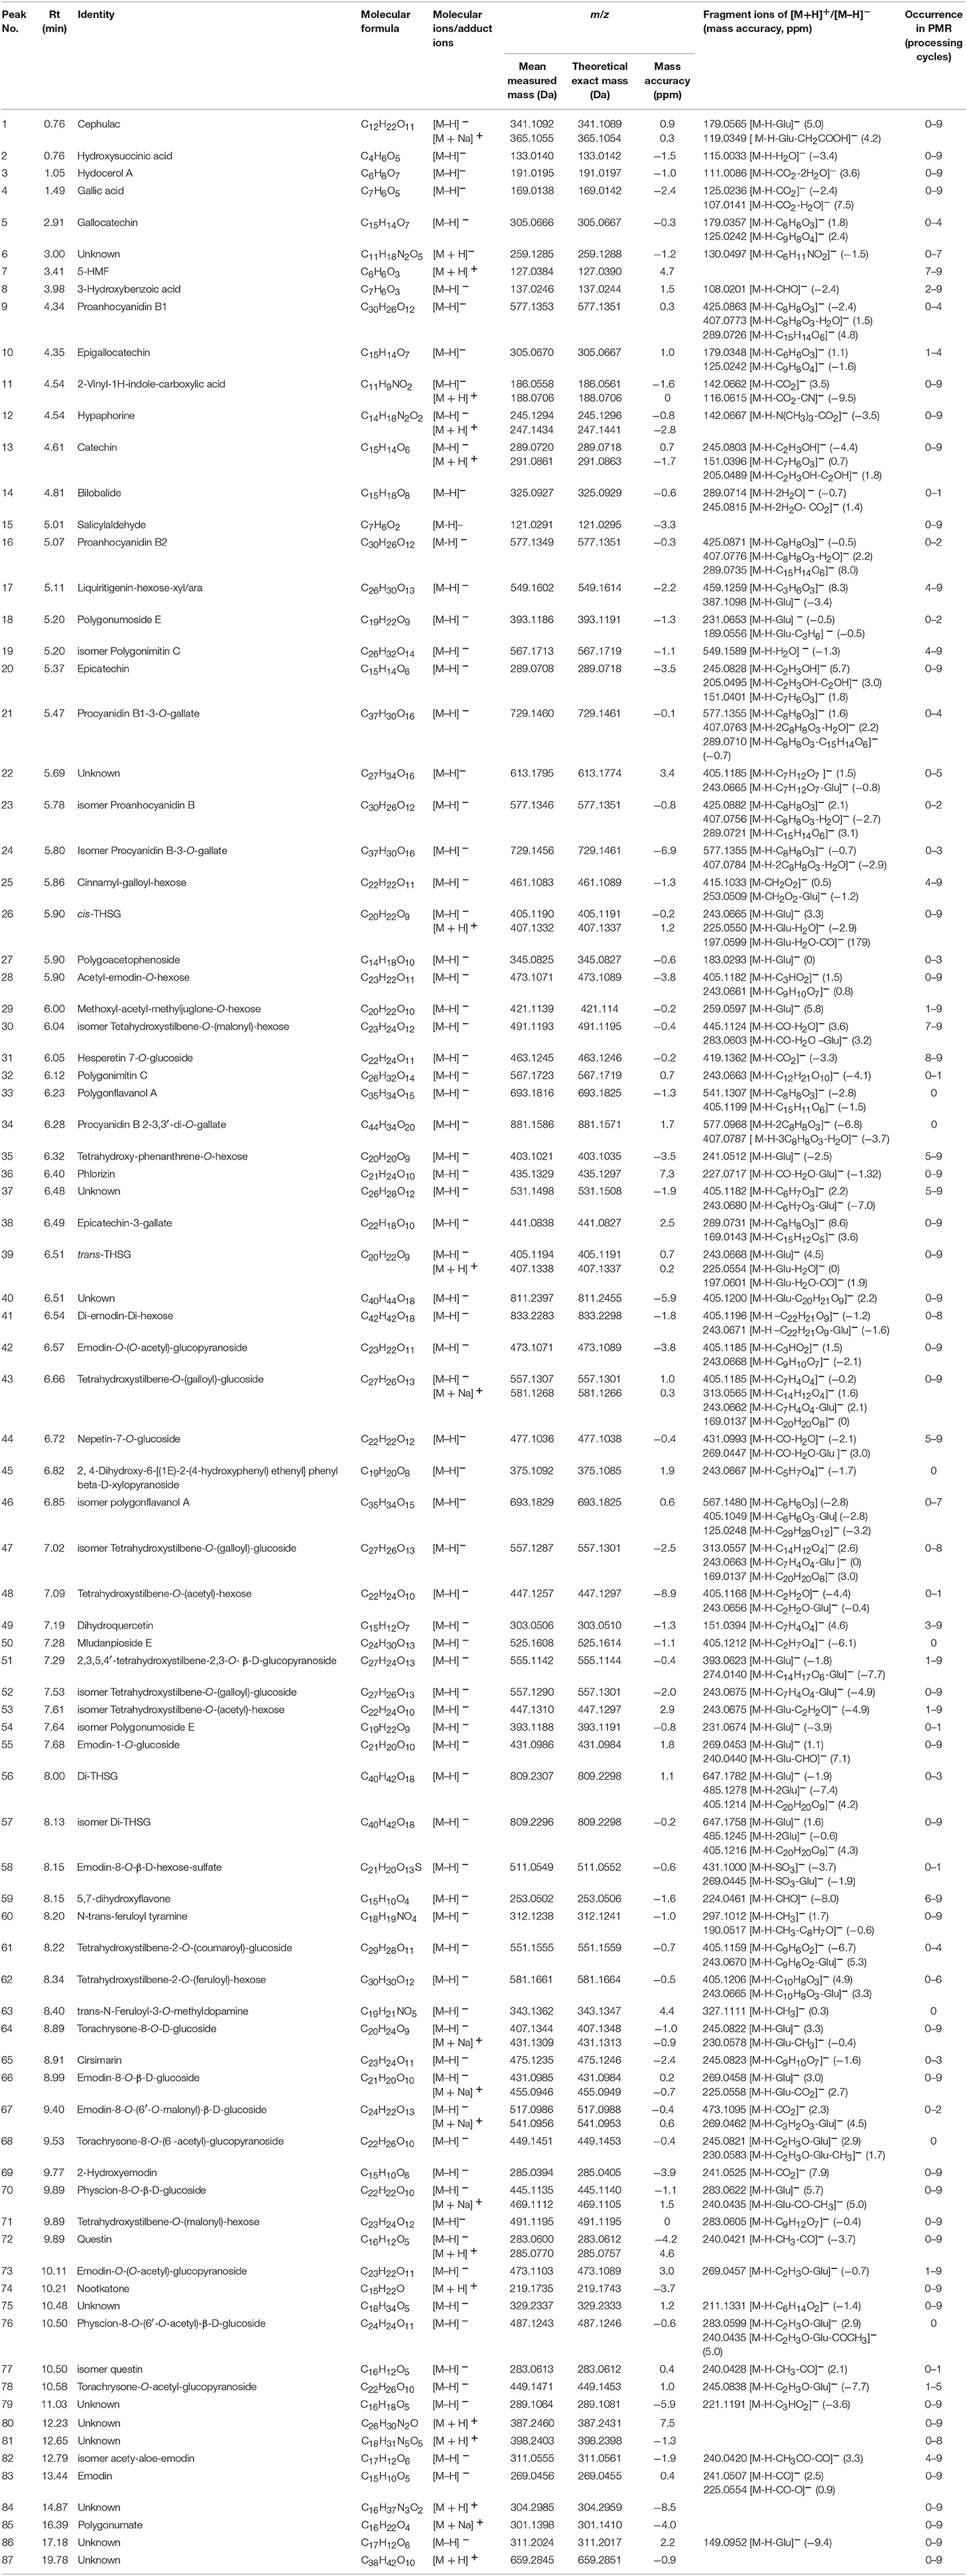
Table 1. Identification of the major secondary metabolites in RPMR and PPMR samples by UHPLC-QTOF-MS/MS.
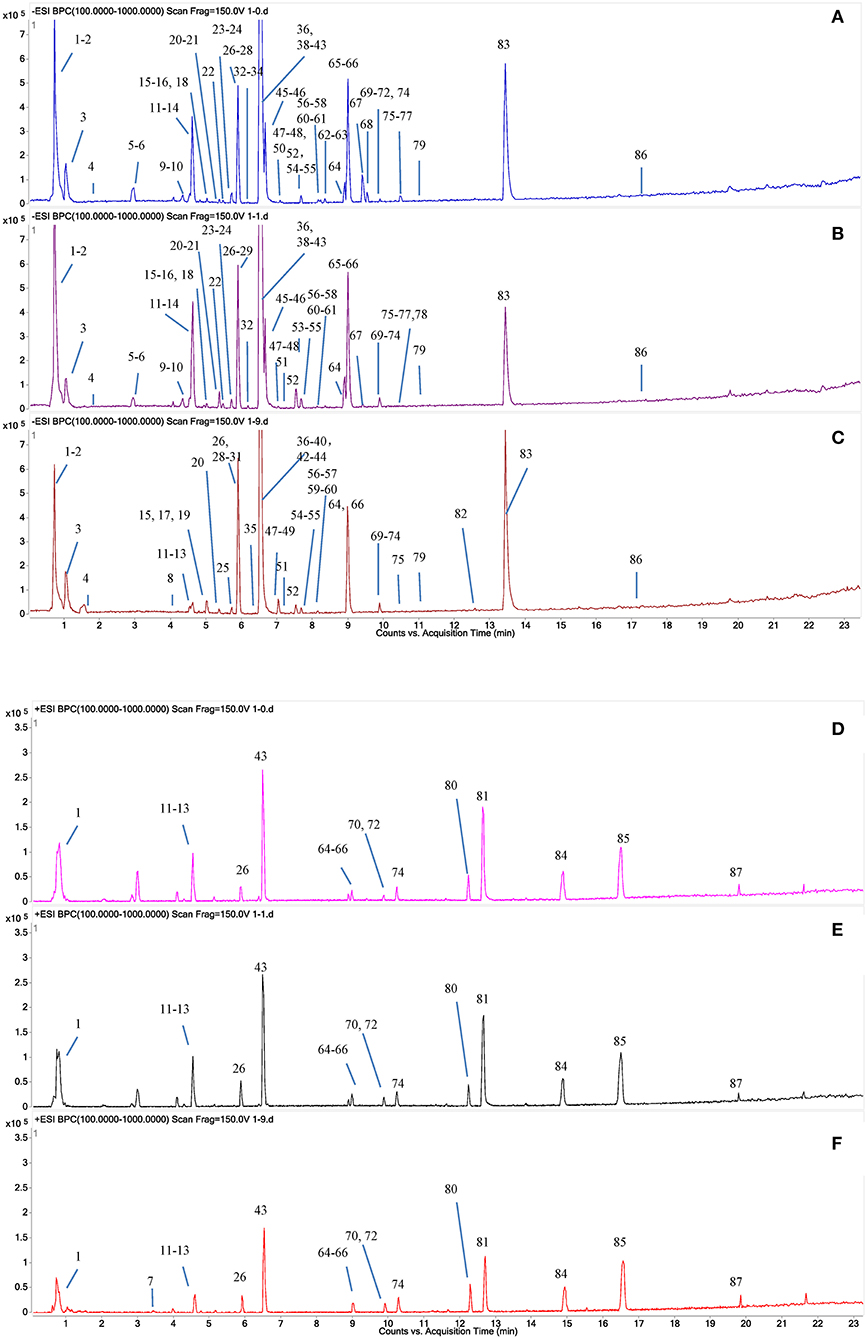
Figure 1. Typical UPLC-QTOF-MS/MS chromatograms of secondary metabolites in PMR. (A,D) RPMR; (B,E) PPMR1; (C,F) PPMR9; (A–C) negative mode; (D–F) positive mode. The peak numbers represent the same meanings as in Table 1.
Peak 39 produced precursor ions at m/z 405.1194 [M-H]− (C20H22O9) and m/z 407.1138 [M+H]+, and in the negative MS/MS spectrum, fragmentation of this molecule generated product ions at m/z 243.0668 (C14H11O4) by losing a glucoside (162 Da), at m/z 225.0554 (C14H9O3) by losing a H2O (18 Da), and at m/z 197.0601 (C13H9O2) by losing a CO (28 Da), respectively. Peak 39 was confirmed as trans-THSG by comparing with the mass data of reference standard. The proposed fragmentation pathway is shown in Figure 2A. Peak 26 showed precursor ions of m/z 405.1190 ([M-H]−) and 407.1332 ([M+H]+), respectively, and the fragment ions at m/z 243.0665 (C14H11O4), 225.0552 (C14H9O3), 197.0599 (C13H9O2) were found. The m/z values of peak 26 were similar to those of peak 39, thus it was deduced as cis-THSG, an isomer of trans-THSG. Stilbene derivatives were also detected. For example, peaks 56 and 57 were established as C40H42O18, as they gave [M-H]− ion at m/z 809.2307 and 809.2296, respectively. The fragment ions of peak 56 at m/z 647.1782, m/z 485.1278 and peak 57 at m/z 647.1758, m/z 485.1245 indicated successive loss of two glucosides (162 Da). Product ions at m/z 405.1214 and m/z 405.1216 were also found for peaks 56 and 57, respectively. All the results suggest that peaks 56 and 57 correspond to di-THSG and an isomer of di-THSG, respectively.
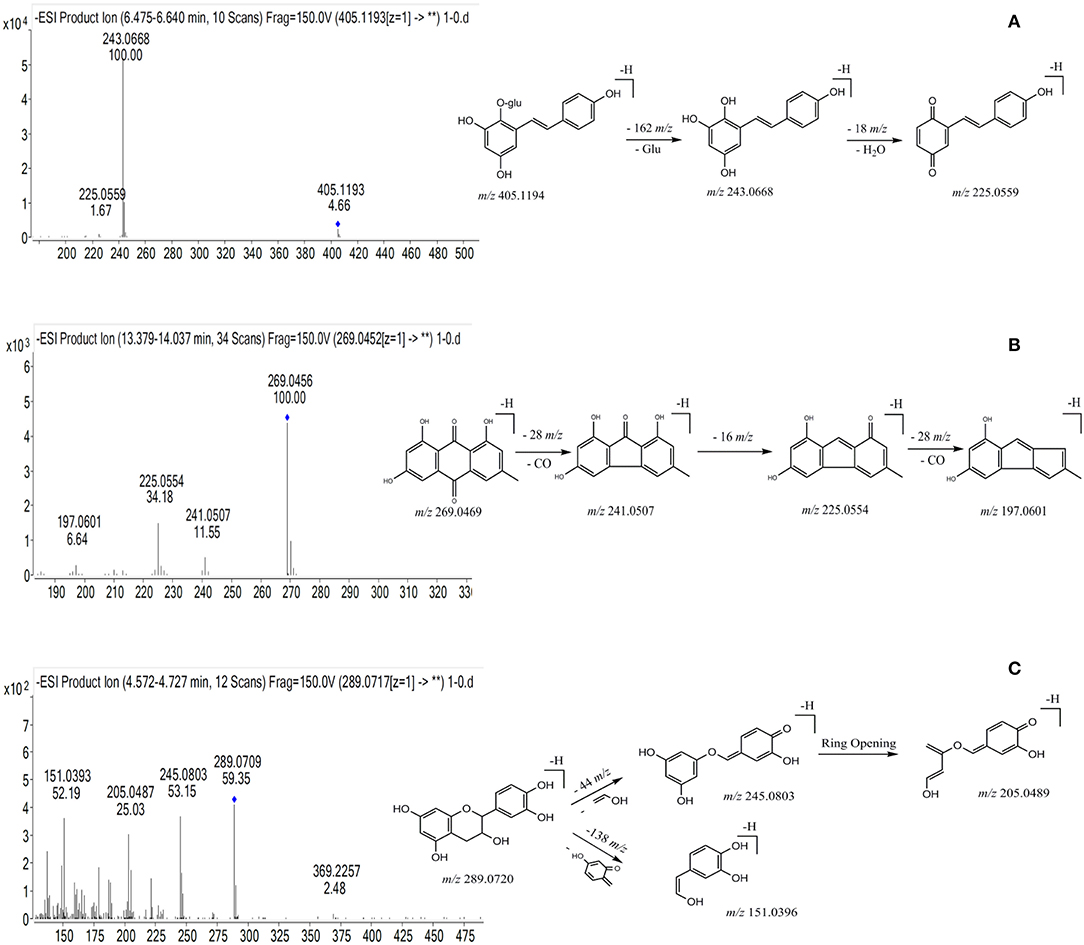
Figure 2. The chemical structure, typical mass spectra and proposed fragmentation pathways of three types of chemical components from PMR. (A) THSG; (B) emodin; (C) catechin.
The molecular formula of peak 83 was established as C15H10O5, based on the detected precursor ion at m/z 269.0456 ([M-H]−) in negative mode. Fragment ions at m/z 241.0507 and m/z 225.0554 were deduced to be generated by successive loss of a –CO (28 Da) and a –O (16 Da). Based on these data as compared with the reference standard, peak 83 was confirmed as emodin (Figure 2B). Compound 66 produced a precursor ion at m/z 431.0985 ([M-H]−) (C21H20O10), and the fragmentation of this molecule produced product ions at m/z 269.0458 resulting from the loss of a glucoside (162 Da), at m/z 225.0558 resulting from a further loss of a –CO (28 Da). After comparing with the MS/MS spectra of emodin and emodin-8-O-β-D-glucoside, compound 66 was identified as emodine-8-O-β-D-glucoside. Compound 55 produced precursor ions [M-H]− at m/z 4310.986 (C21H20O10), and diagnostic ions at m/z 269.0453, while m/z 240.0440 corresponded to the loss of a glucoside and a –CHO (29 Da). Taken together, this data indicates compound 55 should be a isomer of emodine-8-O-β-D-glucoside, and it was therefore identified as emodin-1-O-glucoside.
Compound 13 was found to have a retention time of 4.61 min, producing molecular ions of m/z at 289.0720 ([M-H]−) and 291.0861 ([M+H]+) (C15H14O6). It produced fragment ions at m/z 245.0803, 205.0489 and 151.0396 in the MS/MS spectrum (Figure 2C). Based on this data and previous literature reports, it could be deduced as catechin (Figure 2C). Peaks 9 and 16 gave [M-H]− ions at m/z at 577.1353 (C30H26O12) and 577.1349, respectively. In the MS/MS spectrum, peak 9 gave dominant ions at m/z 425.0863 with a loss of C8H8O3 (152 Da), at m/z 407.0773 with a loss of H2O (18 Da), and m/z at 289.0726 (C15H14O6) was observed; Peak 16 produced dominant ions at m/z 425.0871, 407.0776 and 289.0735, implying a disintegration similar to the compound represented by peak 9. After comparing with the reference standard, peak 9 was confirmed to be proanthocyanidin B1, and compound 16 was identified as proanthocyanidin B2.
Multivariate Statistical Analysis
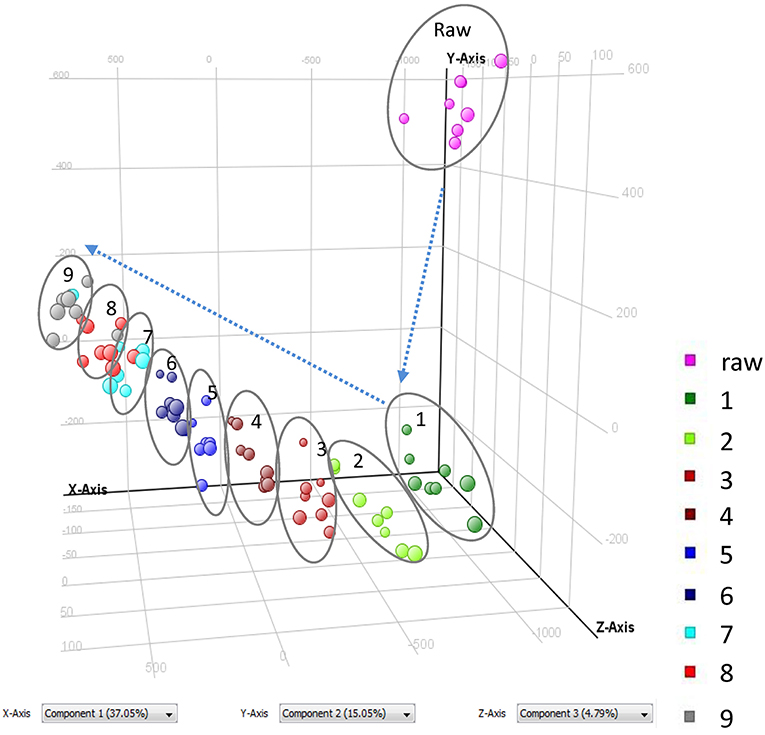
As shown in Figure 1 and Table 1, nine cycles processing qualitatively and progressively changed the chemical profile of PMR. A total of 68 chemical components were detected in RPMR. However, they were gradually depleted by the processing. For example, 61 and 36 of them were detected in PPMR1 and PPMR9, respectively. Meanwhile, 19 chemicals were newly detected after the processing. In order to further visualize the differences in overall chemical profiles between RPMR and PPMR, Principal Component Analysis (PCA) and Volcano Plot were used to process the MS data of untargeted metabolomics. PCA score plots clearly show PPMR plots distinct from RPMR plots; in other words, processing categorically changed the chemical profile of PMR. Furthermore, the plots from PPMR1 to PPMR9 gradually shift away from RPMR plots (Figure 3). This tendency demonstrates that the number of cycles has a critical influence on the chemical components in the final product: more changes in the chemical profile occurred with more processing cycles.
Volcano plot analysis was then employed to explore the chemical markers that contributed most to the difference in chemical profiles between RPMR and PPMR. Each point on the volcano plot was based on both p-value and fold-change values, and in this study these two values were set at 0.05 and 3.0, respectively. The points which satisfy the condition p < 0.05 and fold change > 3.0 appear in red and are marker candidates, whereas the others appear in gray. The software displayed the results of the markers in red as a p-value table with molecular weights, retention times, p-values and fold changes, and the contributing components were thus showed by this p-value table. Here, RPMR and PPMR9 were selected for the filtering analysis. Finally, 18 compounds, namely cephulac (1), gallic acid (4), 3-hydroxybenzoic acid (8), catechin (13), liquiritigenin-hexose-xyl/ara (17), isomer polygonimitin C (19), cinnamyl-galloyl-hexose (25), methoxyl-acetyl-methyljuglone-O-hexose (29), isomer tetahydroxystilbene-O-(malonyl)-hexose (30), emodin-O-(O-acetyl)-glucopyranoside (42), tetrahydroxystilbene-O-(galloyl)-glucoside (43), nepetin-7-O-glucoside (44), isomer tetrahydroxystilbene-O-(galloyl)-glucoside (47), 2,3,5,4′-tetrahydroxystilbene-2,3-O-beta-D-glucopyranoside (51), isomer tetrahydroxystilbene-O-(acetyl)-hexose (53), 5,7-dihydroxyflavone (59), emodin-O-(O-acetyl)-glucopyranoside (73) and isomer acety-aloe-emodin (82) were explored as the chemical markers most responsible for the differences between RPMR and PPMR9 (Figure 4).
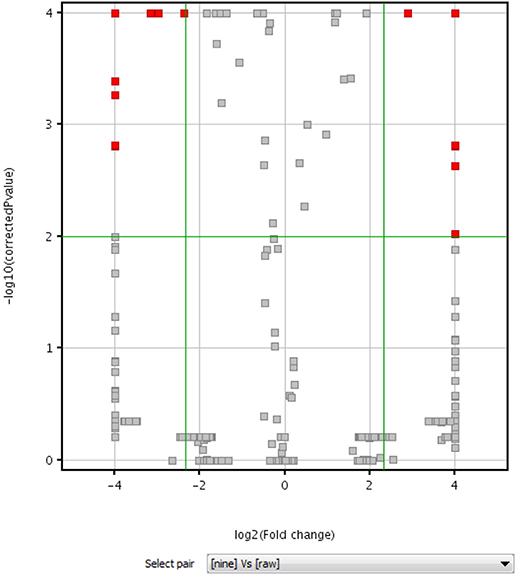
Figure 4. Volcano plot of raw (RPMR) and processed PMR (PPMR9) samples based on untargeted metabolomics analysis.
Targeted Metabolomics Analysis
UHPLC-QqQ- MS/MS Conditions
To further explore how processing cycles quantitatively affect the chemical components of PMR, 12 chemicals, namely trans-THSG, cis-THSG, emodin, physcion, emodin-8-O-β-D-glucosides and physcion-8-O-β-D-glucosides, gallic acid, proanthocyanidin B1, proanthocyanidin B2, epicatechin, catechin and epicatechin-gallate, were selected as the analytes for targeted metabolomics analysis. These chemicals were not only detected as major chemical components but also reported to be the major bioactive chemical components in PMR (Yao et al., 2006; Han et al., 2013; Lin et al., 2015b). Furthermore, the UPLC-QTOF-MS/MS analysis preliminarily indicated that their contents were substantially changed by the processing.
In this study, UPLC-QqQ-MS/MS was used for quantitative analysis of the targeted metabolomics. Multiple reaction monitoring (MRM) is a powerful quantitative mode of UPLC-QqQ-MS/MS, for which both quadrupoles are programmed at selective scanning, allowing only one ion pair (precursor and product ions) to be detected. As two stages of mass selectivity are utilized, little interference from the background matrix exists, resulting in high specificity and sensitivity (Liang et al., 2013; Li et al., 2014). On our previous study on PMR by UHPLC-QqQ-MS/MS, chromatography conditions (mobile phase, gradient program, flow rate, injection volume), and mass parameters (ion mode, dry gas flowrate and temperature, sheath gas flowrate and temperature, nebulizer pressure, capillary voltage, dwell time) were investigated, and finally two different conditions were optimized to achieve satisfactory separation for the 12 chemicals due to their different chemical properties (Liang et al., 2018). In detail, the first set of conditions was suitable for 10 chemical components, namely gallic acid (4), proanthocyanidin B1 (9), proanthocyanidin B2 (16), cis-THSG (26), trans-THSG (39), catechin (13), epicatechin (20), epicatechin-3-gallate (38), emodin-8-O-β-D-glucoside (66), and physcion-8-O-β-D-glucoside (70). A second set of analytical conditions was developed for emodin (83) and physcion because they could not be readily ionized under the first set of conditions. The MRM fragments and Collision voltage (eV) of each analyte were individually optimized by Mass Hunter Optimizer Software (Aglient Technologies, Inc. 2010, Version B.03.01) (Table 2). For example, the ion [M-H]− (m/z 125.0) of gallic acid was observed to be specific, stable and abundant. Thus, the ion of m/z 125.0 was selected as the precursor ion of gallic acid. The ion pairs of the other 11 chemicals were also similarly optimized. The MS spectrums of the analytes are shown in Figure 5.

Table 2. MRM conditions in UPLC-QqQ-MS/MS analysis and method validation for quantitative determination.
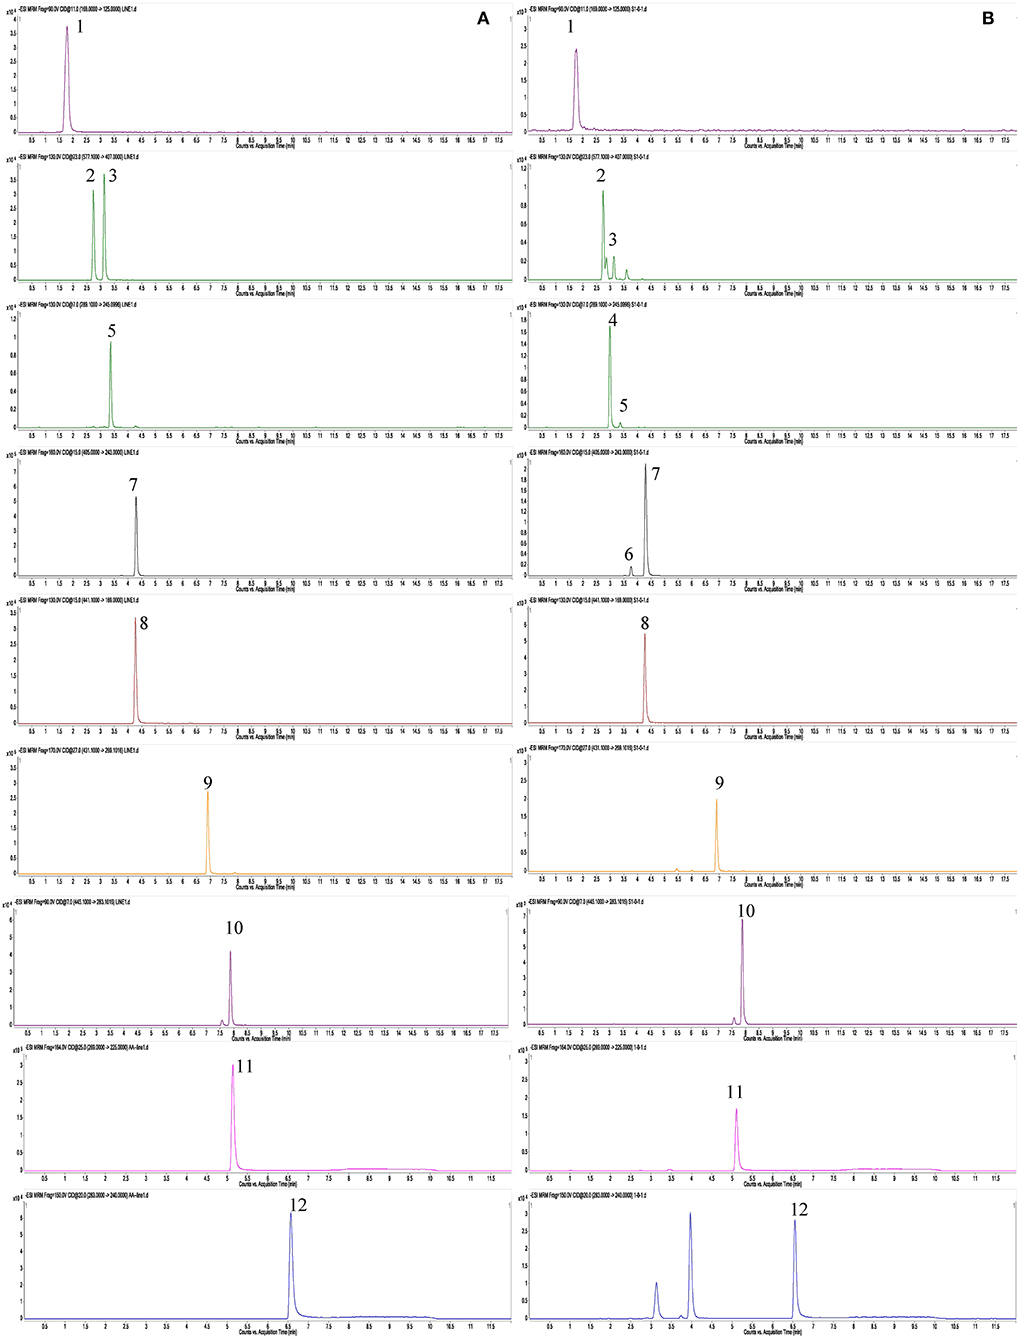
Figure 5. MS spectrums of 12 targeted metabolomics with MRM mode. (A) Reference standard; (B) sample (RPMR). 1, gallic acid; 2, proanthocyanidin B1; 3, proanthocyanidin B2; 4, catechin; 5, epicatechin; 6, cis-THSG; 7, trans-THSG; 8, epicatechin gallate; 9, emodin-8-O-β-D-glucoside; 10, physcion-8-O-β- D-glucoside; 11, Emodin; 12, Physcion.
Quantitative Method Validation
The linearity, sensitivity, precision, repeatability, stability and recovery of quantitative method validation are summarized in Table 2. Due to the lack of reference standards, cis-THSG and catechin were semi-quantified referred to their isomers, trans-THSG and epicatechin, as shown in Table 2. The results showed a good liner relationship over the concentration range of each analyte, with correlation coefficients of determinations R2 all >0.9900. The LODs of all analytes were <17.94 ng/mL, while the LOQs were <56.96 ng/mL. The overall RSDs of intra-day and inter-day variations were not more than 5.59% and 11.74%, respectively. The spike recovery RSDs ranged from 88.98 to 113.48%, which were acceptably accurate. Stability criteria were satisfied as the RSDs were no more than 10.34% in 72 h. All these results showed that the established methods were suitable to analyze all the 12 chemical compounds; details are shown in Table 2.
Quantitative Results
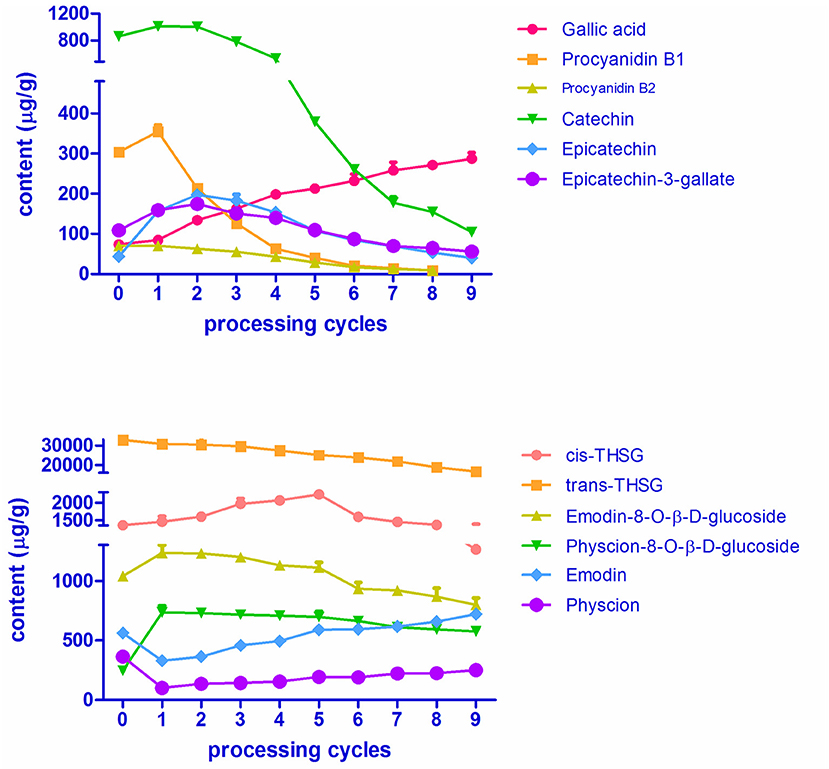
The variations in contents of the 12 chemicals over RPMR and PPMR are shown in Figure 6 and Table S1. Data in the table is an average of nine replicates (three samples of each processing cycle, each sample was analyzed for three times). The RSD values of nine replicates were within 9.85%, which indicate that both of the variations at each processing cycle and variations of the same samples were acceptable. The contents of two stilbene glucosides, namely trans-THSG and cis-THSG, changed significantly after RPMR was processed. The content of cis-THSG was 1252.28 ± 45.70 μg/g in RPMR. It first increased gradually, peaked in PPMR5 at 2066.31 ± 57.88 μg/g, and then decreased step by step to 1195.41 ± 111.92 μg/g after the ninth processing cycle; this final content was, lower than that of RPMR. In contrast, trans-THSG decreased consistently and regularly after each processing cycle, from 32675.01 ± 1102.04 μg/g in RPMR to 16661.65 ± 769.66 μg/g in PPMR9.
The contents of two combined anthraquinones, namely emodin-8-O-β-D-glucosides and physcion-8-O-β-D-glucosides, increased after the first cycle,from 1039.48 ± 2.23 μg/g and 228.51 ± 10.84 μg/g in RPMR to 1265.23 ± 69.56 μg/g and 734.55 ± 55.28 μg/g in PPMR1, respectively. With further processing, their contents decreased to a final content of 799.70 ± 55.32 μg/g and 574.21 ± 27.95 μg/g in PPMR9, respectively, after the ninth cycle. Free anthraquinones, including emodin and physcion, presented an opposite tendency, decreased after the first cycle and then increasing with further processing cycles. For example, the contents of emodin were 562.47 ± 8.95 μg/g, 328.81 ± 14.06 μg/g, and 720.81 ± 8.55 μg/g in the sequence of RPMR, PPMR1, and PPMR9 samples, respectively, while the contents of physcion were 363.44 ± 9.87 μg/g, 101.47 ± 6.07 μg/g, and 251.04 ± 6.75 μg/g in the same sequence of RPMR and PPMR samples (Table S1).
In the case of the six polyphenols, five of them (proanthocyanidin B1, proanthocyanidin B2, catechin, epicatechin, and epicatechin-3-gallate) increased after the first processing cycle compared to raw PMR. The content of the first three compounds started to decrease in the second cycle, whereas epicatechin and epicatechin-gallate still increased in the second cycle and began to decrease in the third cycle. In details, the content of catechin increased from 862.65 ± 43.07 μg/g in RPMR to 1010.02 ± 12.68 μg/g after being processed for one cycle, then decreased gradually after each cycle, and decreased to 104.42 ± 4.04 μg/g after nine cycles. While the variation in the contents of proanthocyanidin B1 and proanthocyanidin B2 are of the same tendency, and their contents first increased to 354.75 ± 17.10 μg/g and 70.81 ± 1.70 μg/g in PPMR1, respectively; and then decreased with the increasing of processing cycles, and finally cannot be detected after nine cycles processing. The contents of epicatechin and epcatechini-3-gallate continuously increased in the first two processing cycles, reaching its highest level of 197.43 ± 9.39 μg/g and 174.17 ± 10.63 μg/g, respectively; after that the content decreased after each cycle, finally reaching a content of 40.30 ± 1.02 μg/g and 56.12 ± 3.24 μg/g, after the last cycle, respectively. The other water-soluble constituent gallic acid increased gradually after each processing cycle, from 73.53 ± 2.67 μg/g in RPMR to 287.07 ± 14.72 μg/g in PPMR9 samples (Table S1).
In summary, the contents of gallic acid continuously increased, while trans-THSG continuously decreased, after each processing cycle. For emodin and physcion, the contents were first decreased and then increased with the increasing of processing cycles. In terms of the other eight analytes, namely cis-THSG, emodin-8-O-β-D-glucosides and physcion-8-O-β-D-glucosides, catechin, epicatechin, epicatechin-3-gallate, proanthocyanidin B1 and proanthocyanidin B2, the contents were first increased and then decreased after the increase of processing cycles. The above quantitative results not only show the changing tendency of the contents of these bioactive compounds with processing cycles, but also are helpful for further deduction of transformation mechanisms involved in the processing chemistry.
Chemical Transformation Mechanisms
The targeted and untargeted metabolomics results provide abundant information to discuss potential mechanisms involved in the processing chemistry of PMR (Figure 7). With regard to the two stilbene glucosides, three reactions could be involved in the variation observed. First, trans-THSG is easily isomerized to cis-THSG when exposed to heat and light as in the processing (Likhtenshtein, 2009), such that further processing would result in an increase of cis-THSG in the first five processing cycles. Second, both cis-THSG and trans-THSG are readily hydrolyzed, such that the steaming would decrease their content. In addition, the occurrence of 5-HMF suggest that the Maillard reaction was involved in the processing of PPMR (Liu et al., 2009).
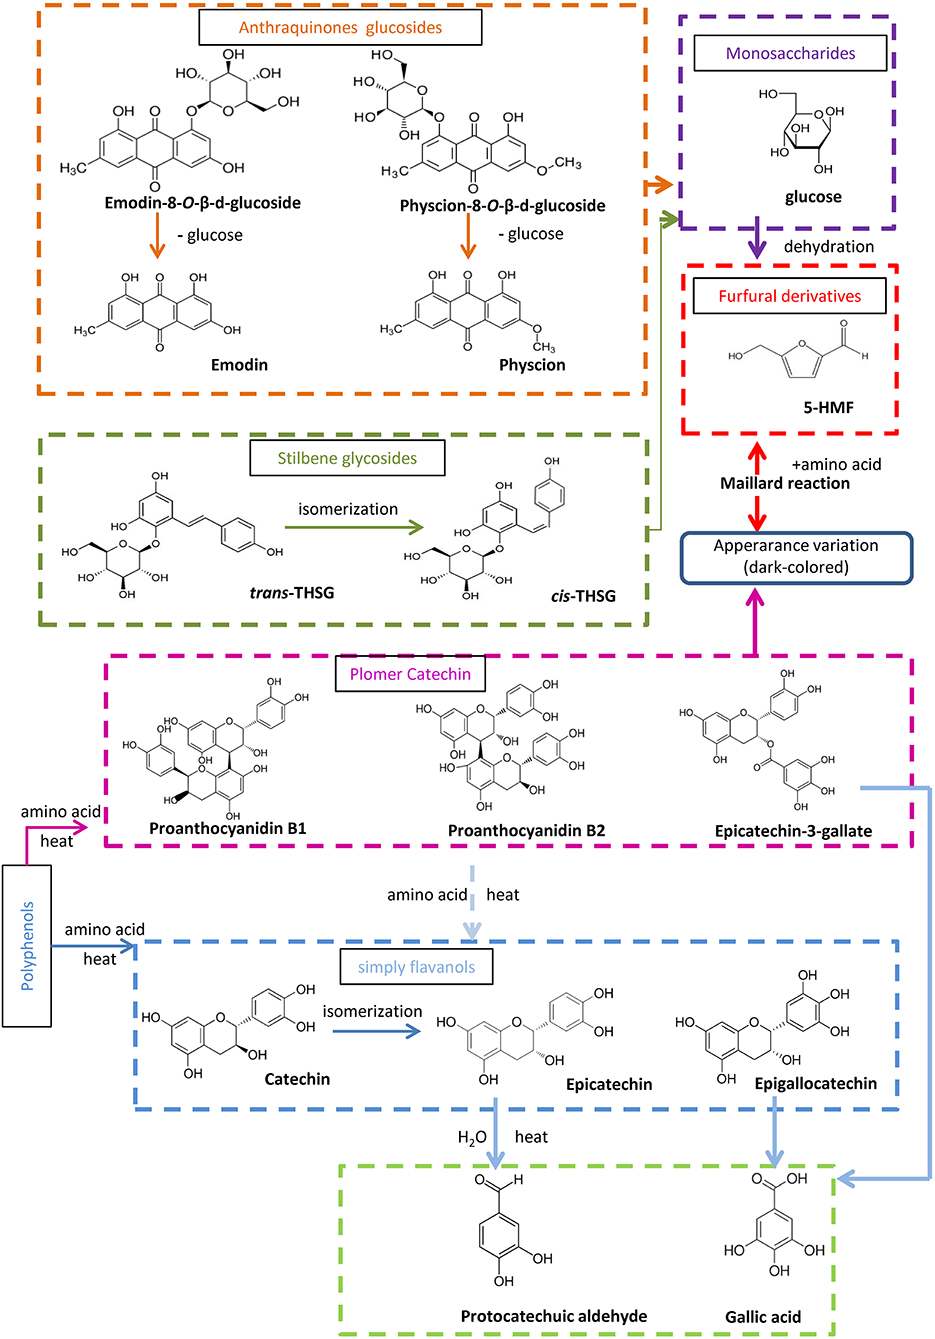
Figure 7. Proposed processing-induced chemical transformation mechanisms of secondary metabolites in PMR. Solid arrows, prone to happen; dotted arrows, speculated/less likely to happen.
According to the untargeted metabolomics results, emodin-8-O-(6′-O-malonyl)-β-D-glucoside, emodin-O-(O-acetyl)-glucoside, and physcion-8-O-(6′-O-acetyl)-β-D-glucoside occurred in RPMR, but were undetected after the first two processing cycles. We deduced that they were hydrolyzed to emodin-8-O-β-D-glucosides and physcion-8-O-β-D-glucosides, as both the latter were quickly increased after the first processing cycle. They would then be further hydrolyzed to emodin or physcion by the processing (Wianowska, 2014). As a result, free anthraquinones increased after each processing cycle.
It has been reported that condensed tannins can undergo acid-catalyzed cleavage in the presence of (or in the presence of an excess of) a nucleophile (Nonaka et al., 1982; Torres et al., 2002). In other words, condensed polymers are depolymerized to oligomer and monomers under thermal and acidic conditions. In the case of PPMR, all six water soluble components increased after the first processing cycle. In addition, the oligomers and monomers, except for gallic acid, were also unstable in thermal and acidic conditions, so they were subject to structural transformation after further processing, which caused catechin to be transformed to its isomeric compound epicatechin (Ross et al., 2011). Besides the isomerization, polymer and monmers were further depolymerized, so that the monomer protocatechuic aldehyde could, finally, be found after processing, and gallic acid, also a final derived monomer, accumulated after each processing cycle.
Some studies have suggested that THSG is a toxic component of PMR (Wu et al., 2012; Meng et al., 2017), in which case, less THSG is safer for human consumption. Our results showed that the content of trans-THSG gradually decreased after each processing cycle and was lowest after nine cycles, while the content of cis-THSG initially increased and only began decreasing after the fifth processing cycle, reaching its lowest content after nine cycles. These results indicate that from the perspective of toxicity of PMR, ideally nine cycles, and certainly more than five cycles, is necessary to produce a safer PPMR for clinic use. However, this still warrants further confirmation by toxicodynamic studies. In addition, as mentioned above, RPMR and PPMR are used for distinct medicinal purposes, while RPMR is used to resolve toxin and free the stool, PPMR is regarded as a traditional tonic for its rejuvenation effects. As combined anthraquinones function as a purgative and are, thus, not suitable as a dietary supplement (Zhao and Xiao, 2010), we deduced that lower combined anthraquinones contents is more appropriate for seeking the supplement effect of PPMR. The content of combined anthraquinones was consistently decreased by the processing, and was lowest in PPMR9. These results indicate that nine cycles of processing might be necessary for its clinic function since combined anthraquinones presented their lowest contents in the last processing cycle. Besides the above mentioned contents variation, results show that the contents of other bioactive compounds in this study, such as catechin, gallic acid, and proanthocyanidin B2, changed after being processed, which may also linked with the changing of therapeutic effect (Yao et al., 2006; Han et al., 2013; Lin et al., 2015b). However, this still needs furtherly verified by pharmacodynamics studies. In summary, based on processing chemistry of PMR, nine cycles processing is necessary to produce a safer, more effective form of PPMR for clinical and home use, whereas further pharmacodynamics and toxicodynamic studies should be carry out to verify it.
Conclusion
In this study, targeted and untargeted metabolomics analyses were integrated to investigate the processing chemistry of PMR. The results demonstrate that the processing by nine cycles of steaming and drying qualitatively and quantitatively alters the chemical profiles of PMR. Several mechanisms, namely hydrolysis, dehydration, isomerization and the Maillard reaction, were potentially involved in the chemical variation. The qualitative and quantitative data further suggest that the nine cycles of processing might be necessary for the preparation of PPMR, and the processing producers cannot be abbreviated to modern one processing cycle, as PPMR that has been processed nine times shows significant differences in its chemical profile and less potentially disruptive chemicals. The research results indicate that the metabolomics strategy could comprehensively characterized the processing chemistry of herbal medicines, thereby contributing to understand the scientific basis of herbal medicine processing.
Author Contributions
LL and JX conceived and designed the experiments. LL and W-WZ performed the experiment. LL analyzed the data. H-BC and Z-ZZ guided the experiment. LL wrote the paper. JX and EB revised the paper. Z-ZZ acquired funding for the research. All authors read and approved the final manuscript.
Funding
This work was supported by Research Grants Council (Project No. 12102415, 12141516, 12102217) and National Natural Science Foundation of the People's Republic of China (Project No. 11475248).
Conflict of Interest Statement
The authors declare that the research was conducted in the absence of any commercial or financial relationships that could be construed as a potential conflict of interest.
Acknowledgments
We acknowledge Mr. Alan Ho from the School of Chinese Medicine, Hong Kong Baptist University for his technical assistance. We thank Ms. Zhene Ma and Huifeng Liang for their assistance in sample processing.
Supplementary Material
The Supplementary Material for this article can be found online at: https://www.frontiersin.org/articles/10.3389/fphar.2018.00934/full#supplementary-material
Figure S1. The appearance of RPMR and PPMR1-9.
Figure S2. Typical UPLC-QTOF-MS/MS chromatograms of secondary metabolites in PMR with different mobile phases. (A,D) RPMR; (B,E) PPMR1; (C,F) PPMR9; (A–C) 0.1% formic acid–water and 0.1% formic acid–acetonitrile; (D–F) 3 mM ammonium acetate-water and methanol.
Table S1. Quantitative results of analysis of secondary metabolites in RPMR and PPMR (μg∙g-1) (n = 9). Data in the table is an average ± SD of nine replicates; * represent undetected.
References
Chen, H. F., Chen, Y. H., Liu, C. H., Wang, L., Chen, X., Yu, B. Y., et al. (2016). Integrated chemometric fingerprints of antioxidant activities and HPLC–DAD–CL for assessing the quality of the processed roots of Polygonum multiflorum Thunb. (Heshouwu). Chin. Med. 11, 18. doi: 10.1186/s13020-016-0087-8
Chernushevich, I. V., Loboda, A. V., and Thomson, B. A. (2001). An introduction to quadrupole-time-of-flight mass spectrometry. J. Mass Spectrom. 36, 849–865. doi: 10.1002/jms.207
Chinese Pharmacopoeia Commission (2015). Pharmacopoeia of People's Republic of China, Version 2015, Vol. 1. Beijing: China Medical Science Publisher.
Han, D. Q., Zhao, J., Xu, J., Peng, H. S., Chen, X. J., and Li, S. P. (2013). Quality evaluation of Polygonum multiflorum in China based on HPLC analysis of hydrophilic bioactive compounds and chemometrics. J. Pharm. Biomed. Anal. 72, 223–230. doi: 10.1016/j.jpba.2012.08.026
Han, L. F., Wu, B., Pan, G. X., Wang, Y. F., Song, X. B., and Gao, X. M. (2009). UPLC-PDA analysis for simultaneous quantification of four active compounds in crude and processed rhizome of Polygonum multiflorum Thunb. Chromatographia 70, 657–659. doi: 10.1365/s10337-009-1180-2
Li, S. Z. (2008). Compendium of Materia Medica (本草綱目), Vol. 1. Shanghai: Shanghai Science and Technology Publisher.
Li, W., Tang, Y., Qian, Y., Shang, E., Wang, L., Zhang, L., et al. (2014). Comparative analysis of main aromatic acids and phthalides in angelicae sinensis radix, chuanxiong rhizoma, and Fo-Shou-San by a validated UHPLC-TQ-MS/MS. J. Pharm. Biomed. Anal. 99, 45–50. doi: 10.1016/j.jpba.2014.07.007
Liang, J., Wu, W., Sun, G., Wang, D., Hou, J., Yang, W., et al. (2013). A dynamic multiple reaction monitoring method for the multiple components quantification of complex traditional Chinese medicine preparations: niuhuang shangqing pill as an example. J. Chromatogr. A 1294, 58–69. doi: 10.1016/j.chroma.2013.04.016
Liang, L., Xu, J., Liang, Z. T., Dong, X. P., Chen, H. B., and Zhao, Z. Z. (2018). Tissue-specific analysis of secondary metabolites creates a reliable morphological criterion for quality grading of polygoni multiflori radix. Molecules 23:1115. doi: 10.3390/molecules23051115
Liang, Z. T., Chen, H. B., Yu, Z. L., and Zhao, Z. Z. (2010). Comparison of raw and processed Radix Polygoni Multiflori (Heshouwu) by high performance liquid chromatography and mass spectrometry. Chin. Med. 5, 1–9. doi: 10.1186/1749-8546-5-29
Likhtenshtein, G. (2009). Stilbenes: Applications in Chemistry, Life Sciences and Materials Science. Stilbenes Preparation and Analysis. Weinheim: John Wiley and Sons.
Lin, L., Ni, B., Lin, H., Zhang, M., Li, X., Yin, X., et al. (2015b). Traditional usages, botany, phytochemistry, pharmacology and toxicology of Polygonum multiflorum Thunb.: a review. J. Ethnopharmacol. 159, 158–183. doi: 10.1016/j.jep.2014.11.009
Lin, L. F., Lin, H. M., Zhang, M., Ni, B., Yin, X. B., Qu, C. H., et al. (2015a). A novel method to analyze hepatotoxic components in Polygonum multiflorum using ultra-performance liquidchromatography-quadrupole time-of-flight mass spectrometry. J. Hazard. Mater. 299, 249–259. doi: 10.1016/j.jhazmat.2015.06.014
Liu, Z., Chao, Z. M., Liu, Y. Y., Song, Z. Q., and Lu, A. P. (2009). Maillard reaction involved in the steaming process of the root of Polygonum multiflorum. Planta Med. 75, 84–88. doi: 10.1055/s-0028-1088349
Liu, Z. L., Liu, Y. Y., Wang, C., Guo, N., Song, Z. Q., Wang, C., et al. (2011). Comparative analyses of chromatographic fingerprints of the roots of Polygonum multiflorum Thunb and their processed products using RRLC/DAD/ESI-MSn. Planta Med. 77, 1855–1860. doi: 10.1055/s-0030-1271200
Meng, Y. K., Li, C. Y., Li, R. Y., and He, L. Z. (2017). Cis-stilbene glucoside in Polygonum multiflorum induces immunological idiosyncratic hepatotoxicity in LPS-treated rats by suppressing PPAR-γ. Acta Pharmacol. Sin. 38, 1340–1352. doi: 10.1038/aps.2017.32 Epub 2017 Jun 26.
Nonaka, G. I., Miwa, N., and Nishioka, I. (1982). Stilbene glycoside gallates and proanthocyanidins from Polygonum multiflorum. Phytochemistry 21, 429–432. doi: 10.1016/S0031-9422(00)95282-8
Qiu, X., Zhang, J., Huang, Z., Zhu, D., and Xu, W. (2013). Profiling of phenolic constituents in Polygonum multiflorum Thunb. by combination of ultra-high-pressure liquid chromatography with linear ion trap-Orbitrap mass spectrometry. J. Chromatogr. A 1292, 121–131. doi: 10.1016/j.chroma.2012.11.051
Ross, C. F., Hoye, C., and Fernandez-Plotka, V. C. (2011). Influence of heating on the polyphenolic content and antioxidant activity of grape seed flour. J. Food Sci. 76, C884–C890. doi: 10.1111/j.1750-3841.2011.02280.x
Torres, J. L., Lozano, C., Julià, L., Sánchez-Baeza, F. J., Anglada, J. M., Centelles, J. J., et al. (2002). Cysteinyl-flavan-3-ol conjugates from grape procyanidins. Antioxidant and antiproliferative properties. Bioorganic Med. Chem. 10, 2497–2509. doi: 10.1016/S0968-0896(02)00127-X
Wang, L., Sang, M. M., Liu, E. W., Banahene, P. O., Zhang, Y., Wang, T., et al. (2017). Rapid profiling and pharmacokinetic studies of major compounds in crude extract from Polygonum multiflorum by UHPLC-Q-TOF-MS and UPLC–MS/MS. J. Pharm. Biomed. Anal. 140, 45–61. doi: 10.1016/j.jpba.2017.03.016
Wang, T. H., Zhang, J., Qiu, X. H., Bai, J. Q., Gao, Y. H., and Xu, W. (2016). Application of ultra-high-performance liquid chromatography coupled with LTQ-orbitrap mass spectrometry for the qualitative and quantitative analysis of Polygonum multiflorum thumb. And Its processed products. Molecules 21:E40. doi: 10.3390/molecules21010040
Wianowska, D. (2014). Hydrolytical instability of hydroxyanthraquinone glycosides in pressurized liquid extraction. Anal. Bioanal. Chem. 406, 3219–3227. doi: 10.1007/s00216-014-7744-5
Wu, X., Chen, X. Z., Huang, Q. C., Fang, D. M., Li, G. Y., and Zhang, G. L. (2012). Toxicity of raw and processed roots of Polygonum multiflorum. Fitoterapia 83, 469–475. doi: 10.1016/j.fitote.2011.12.012
Yao, S., Li, Y., and Kong, L. Y. (2006). Preparative isolation and purification of chemical constituents from the root of Polygonum multiflorum by high-speed counter-current chromatography. J. Chromatogr. A 1115, 64–71. doi: 10.1016/j.chroma.2006.02.071
Ye, D. J. (1987). Immunopharmacological studies on radix Polygoni multiflori and its preparations. Zhongyao Tonbao 12, 21–24.
Yu, X. A., Ge, A. H., Zhang, L., Li, J., An, M. R., Cao, J., et al. (2017). Influence of different processing times on the quality of Polygoni Multiflora Radix by metabolomics based on ultra high performance liquid chromatography with quadrupole time-of-flight mass spectrometry. J. Sep. Sci. 40, 1928–1941. doi: 10.1002/jssc.201600913
Zhao, R., Zhao, S., Mao, X., Jie, F., and Liu, Z. (2008). Study on the correlationship between the content of combined anthraquinone and purgative action of steamed Polygonum multiflorum Thunb. Lishizhen Med. Mat. Med. Res. 19, 2654–2655.
Keywords: polygoni multiflori radix, targeted and untargeted metabolomics, processing chemistry, UPLC-QTOF-MS/MS, UPLC-QqQ-MS/MS
Citation: Liang L, Xu J, Zhou W-W, Brand E, Chen H-B and Zhao Z-Z (2018) Integrating Targeted and Untargeted Metabolomics to Investigate the Processing Chemistry of Polygoni Multiflori Radix. Front. Pharmacol. 9:934. doi: 10.3389/fphar.2018.00934
Received: 23 May 2018; Accepted: 30 July 2018;
Published: 28 August 2018.
Edited by:
Xijun Wang, Heilongjiang University of Chinese Medicine, ChinaReviewed by:
Shuai Ji, Xuzhou Medical University, ChinaJia-bo Wang, 302 Military Hospital of China, China
Copyright © 2018 Liang, Xu, Zhou, Brand, Chen and Zhao. This is an open-access article distributed under the terms of the Creative Commons Attribution License (CC BY). The use, distribution or reproduction in other forums is permitted, provided the original author(s) and the copyright owner(s) are credited and that the original publication in this journal is cited, in accordance with accepted academic practice. No use, distribution or reproduction is permitted which does not comply with these terms.
*Correspondence: Zhong-Zhen Zhao, enp6aGFvQGhrYnUuZWR1Lmhr
 Li Liang
 Jun Xu
 Eric Brand
 Zhong-Zhen Zhao