 Xue-yin Pan1,2,3Yang Yang1,2,3Hong-wu Meng1,2,3
 Hai-di Li1,2,3Xin Chen1,2,3Hui-min Huang1,2,3Fang-tian Bu1,2,3Hai-xia Yu1,2,3Qin Wang1,2,3Cheng Huang1,2,3Xiao-ming Meng1,2,3
 Jun Li1,2,3*
- 1The Key Laboratory of Major Autoimmune Diseases, Anhui Province, Anhui Institute of Innovative Drugs, School of Pharmacy, Anhui Medical University, Hefei, China
- 2The Key Laboratory of Anti-inflammatory of Immune Medicine, Ministry of Education, Hefei, China
- 3Institute for Liver Diseases of Anhui Medical University, Hefei, China
The activation of hepatic stellate cells (HSCs) is a central event in the progression of liver fibrosis. Multiple studies proved that DNA methylation might accelerate HSCs activation. However, the specific pathogenesis of liver fibrosis remains not fully addressed. Our laboratory performed Genome methylation screening to find out the methylated gene in mice with liver fibrosis. The pilot experiments showed that the promoter of prostacyclin synthase (PTGIS) gene was hypermethylated in CCl4-induced liver fibrosis mouse model. Moreover, the down-regulated PTGIS expression can be restored by DNMTs-RNAi and 5-aza-2-deoxycytidine (5-azadC), an inhibitor of DNA methyltransferase (DNMTs). Methylation-specific PCR (MSP) showed that the methylation status of PTGIS in HSC-T6 cells cultures with TGF-β1 (10 ng/mL) was elevated compared with control group. Chromatin immunoprecipitation (ChIP) assay indicated that PTGIS methylation was mainly induced by DNMT1 and DNMT3b. We further investigated the function of PTGIS in liver fibrosis by Recombinant Hepatic-adeno-associated virus (rAAV8)-PTGIS overexpression. The data indicated that overexpression of PTGIS in mouse liver accompanied by elevated apoptosis-related proteins expression in primary HSCs. Conversely, PTGIS silencing mediated by RNAi enhanced the expression of α-SMA and COL1a1 in vitro. Those results illustrated that adding PTGIS expression inhibits the activation of HSCs and alleviates liver fibrosis. Therefore, our study unveils the role of PTGIS in HSCs activation, which may provide a possible explanation for CCl4-mediated liver fibrosis.
Introduction
Liver fibrosis, characterized with the progressively increased accumulation of ECM compounds in liver, is a wound-healing response to various chronic hepatic injuries including virus infection, alcohol abuse and high-fat diet (Bataller and Brenner, 2005; Hernandez-Gea and Friedman, 2011; Trautwein et al., 2015). Without effective therapeutic methods, liver fibrosis can eventually develop into liver cirrhosis and hepatic cancer(Bataller and Brenner, 2005; Trautwein et al., 2015), often requiring liver transplant, pose a huge heath burden on the global community. HSCs, which located in the perisinusoidal space of Disse, characterized by the presence of cytoplasmic perinuclear droplets that are laden with retinyl (vitamin A) esters (Senoo et al., 1998; Moreira, 2007; Friedman, 2008a). After liver injury, the quiescent HSCs (qHSCs) are trans-differentiate into alpha smooth muscle actin (α-SMA)-positive myofibroblast-like cells (Rippe and Brenner, 2004; Mallat and Lotersztajn, 2013). The hepatic architecture will be disturbed by the prolonged and repeated accumulation of ECM proteins by which can form fibrotic scars and nodules, leading to hepatic dysfunction ultimately (Hernandez-Gea and Friedman, 2011; Trautwein et al., 2015). TGF-β1, an inflammatory cytokines is a major pro-fibrogenic cytokine, can up-regulate α-SMA and type I collagen synthesis by HSCs-derived myofibroblast (Hellerbrand et al., 1999). The mechanisms governing the role of the HSCs in fibrosis are still not fully defined.
Increasing evidence suggests that epigenetic modifications play an important role in liver fibrosis. DNA methylation and histone modifications are two key players in epigenetic regulation of gene expression in mammalian cells (Subramaniam et al., 2014). DNA methylation often catalyzed by DNMTs family including DNMT1, DNMT3a and DNMT3b (Anestopoulos et al., 2015). Abnormal patterns of DNA methylation occuring in various liver diseases have been recognized over the last years, such as liver inflammation, fibrosis and cancer (Bian et al., 2014; Wu et al., 2017). Accumulating evidence have demonstrated that DNA methylation in hepatic fibrosis facilitate activation of HSCs and promote the progression of liver fibrogenesis (Bian et al., 2014; Cai et al., 2016; Wu et al., 2017). Therefore, genome-wide analysis of DNA methylation statues in fibrotic organs (e.g., liver, kidney, heart, lung and intestines) will favor to identify the novel DNA methylation biomarkers for fibrotic diseases of different organs. In this paper, we argue that DNA methylation is activated in HSCs in the presence of specific stimuli that correspond to liver fibrosis response.
Prostacyclin synthase (PTGIS, PGIS, CYP8A1) is a member of family 8 (CYP8) in the cytochrome P450 superfamily. PTGIS catalyzes the conversion of PGH2 to prostacyclin (PGI2). And it is a potent mediator of vasodilation and inhibitor of platelet aggregation and cell proliferation (Yokoyama et al., 1996; Tuder et al., 1999; Cho et al., 2015). Various studies have highlighted the importance of the PTGIS expression in preventing tumor growth and progression (Keith et al., 2002, 2004; Pradono et al., 2002). For example, Keith et al. (2002) demonstrated that over-expression of PTGIS can prevent the development of murine lung tumors and inhibit lung carcinogenesis in tobacco-smoke exposed mice (Keith et al., 2004). Moreover, Keith et al. found that PGI2, the catalysate of PTGIS, appears to exert anti-proliferative effects (Paz et al., 2003). Moreover, Frigola et al. (2005) reported that PTGIS promotor hypermethylation is a frequent event in colorectal cancer and PTGIS expression was restored when cultured colorectal cancer cell line HCT116 with the demethylating agent 5-azadC (Sadler et al., 2016). In short, those studies suggested that PTGIS exerts an important role in many physiology and pathology process and its expression levels was influenced by DNA methylation. Nevertheless, it is not clear whether changes in PTGIS expression is involved in liver fibrosis.
In the previous study of our laboratory, the genomic methylation analysis results shown that PTGIS gene was methylated in mice with liver fibrosis. In this study, we sought to define the potential roles of PTGIS in regulating HSCs activation and survival and the molecular mechanism underlying this regulation in liver fibrosis.
Materials and Methods
Animals, Mouse Models of Liver Fibrosis
Normal male C57BL/6J (18–22 g) mice were obtained from the Experimental Animal Center of Anhui Medical University used for CCl4-induced liver fibrosis model. The animal experimental procedures were reviewed and approved by the University Animal Care and Use Committee. Mice were randomly divided into two groups (eight mice per group) including vehicle group and model group. Hepatic fibrosis was generated by biweekly intraperitoneal injection of carbon tetrachloride (CCl4, 10% in olive oil) at a dose of 0.01 mL/g/mouse for 6 weeks. Mice in vehicle group were treated intraperitoneal injection with the same volume of olive oil at the same time intervals. Six weeks later, mice were killed under anesthesia. Samples of blood and liver tissues were collected for further analysis.
Recombinant-Adeno-Associated-Virus-Mediated PTGIS Overexpression in Mice
Mouse PTGIS overexpression plasmid labeled with green fluorescent protein (GFP) was obtained from Genechem Co., Ltd. (Shanghai, China). PTGIS plasmid was packaged with Recombinant-adeno-associated-virus 8 for overexpression PTGIS in vivo. C57BL/6 mice (18–22 g) were housed at the Animal Experimental Center for 1 week in order to adapt to the environment. Then the tails of mice were wiped with alcohol to expand the tail vein for injection. Mice were slowly injected with 100 μL Recombinant-adeno-associated-virus-packaged PTGIS overexpression plasmid with a concentration of 1 × 10¹¹ v.g/mL/mouse through tail vein using 0.5 mL insulin syringe. One week later, mice were intraperitoneally injected with either 10% CCl4 or the equal volume of olive oil for further analysis.
Serum Level of ALT/AST Activity Assay
Serum ALT and AST activities were detected by alanine aminotransferase/aminotransferase Assay Kits (Nanjing Jiancheng Bioengineering Institute) according to the manufacturer’s instructions. The absorbance at 510 nm was obtained with a Multiskan MK3 (Biotek, United States).
Primary HSCs Isolation
Mice were chosen randomly from the vehicle group and CCl4-treated group (n = 8/group). The primary HSCs were perfused from liver tissue of mice in the above two groups. Briefly, a 20-G catheter was put through mouse the portal vein after the mice were anesthetized, then the inferior vena cava were cut. The liver was perfused with PB. Subsequently, the liver was perfused with digestion buffer. After digestion, the liver was disrupted in 1% BSA solution. Single cells were passed through 200-mesh sieve cell strainer. Cells suspension was centrifuged at 4°C, 50 g, 2 min. The supernate were collected to a new 15 mL centrifuge tube, and centrifuged at 4°C, 760 g, 10 min. Discarding the supernate and resuspending the sediment with 4 mL DMEM. The cells suspension was then centrifuged at 4°C, 760 g, 7 min. Discarding the supernate and resuspending the sediment with 2 mL DMEM. Subsequently, cells suspension and Nycodenz (Sigma, GER) were mixed at a density of 1.040–1.060 g/mL. To create discontinuous gradient, the cell-Nycodenz mixture was covered with 1mL Hank’s fluid (Gibco, United States). Then centrifuged at 20°C, 1350 g, 18 min. After centrifugation, the primary HSCs in the interface were collected to a new 15 mL centrifuge tube for following analysis. Then we can get the cells pellet after the cells suspension were centrifuged at 20°C, 1350 g, 5 min. Discarding the supernate and resuspending the cells pellet with 3 mL DMEM. Then the cells suspension can be cultured in the culture bottles. The preparation methods of solution used in primary HSCs isolation were listed in Table 1.

TABLE 1. The preparation methods of solution used in primary HSCs isolation
Histopathology
The middle portion of the left lobe of the liver of each C57BL/6J mice was excised and sectioned and then perfused in 4% paraformaldehyde for at least 48 h. After fixation, the tissues were embedded in paraffin, and 5 μm thick sections were then stained with H&E and Masson’s trichrome for morphological analysis and locating collagen expression by using the standard protocols, respectively.
Immunofluorescence Staining
For immunofluorescence staining, sections were blocked with 10% BSA blocking solution in order to avoid unspecific staining. Then, the sections were incubated with rabbit polyclonal primary antibodies for PTGIS (1:50) mouse monoclonal primary antibodies for α-SMA (1:50). Sections were incubated with both primary antibodies over-night at 4°C, followed by a mixture of anti-rabbit FITC (green, 1:200) and anti-mouse Cy-3 (red, 1:200) conjugated secondary antibodies for 2 h at room temperature. α-SMA and PTGIS expression was visualized by 3, 3′-diaminobenzidine tetrahydrochloride (DAB) staining. Then the stained sections were examined with Inverted fluorescence Microscope (OLYMPUS IX83, Tokyo, Japan).
Cell Culture
The HSC-T6 cells line was obtained from the Type Culture Collection of the Chinese Academy of Sciences (Shanghai, China). HSC-T6 cells (Fumeng Gene, China), an immortalized rat HSCs, were cultured in DMEM (Keygen Bio, China) supplemented with 5%(v/v) Fetal Bovine Serum (FBS, Biological Industries, Israel). HSC-T6 cells were incubated at 37°C with 5% CO2 and propagated every 2 days. HSC-T6 cells were activated by 10 ng/mL TGF-β1 (Peprotech, United States) (Cai et al., 2016).
Total RNA Isolation and Quantitative Real-Time PCR
After splitting by TRIzol reagents (Invitrogen, United States), total RNA was extracted from mice primary HSCs (n = 8/group) and HSC-T6 cells. RNA quantification was determined by Nanodrop 2000 (Thermo Scientific, United States). The mRNA levels of α-SMA, PTGIS, COL1a1, β-actin and GAPDH were determined by RT-qPCR. The primer sequences (Sangon Biotech, China) were listed in Table 2. The mRNA level of α-SMA, PTGIS and COL1a1 were normalized by β-actin (rat) or GAPDH (mice). All samples were performed in triplicate and repeated at least three times.
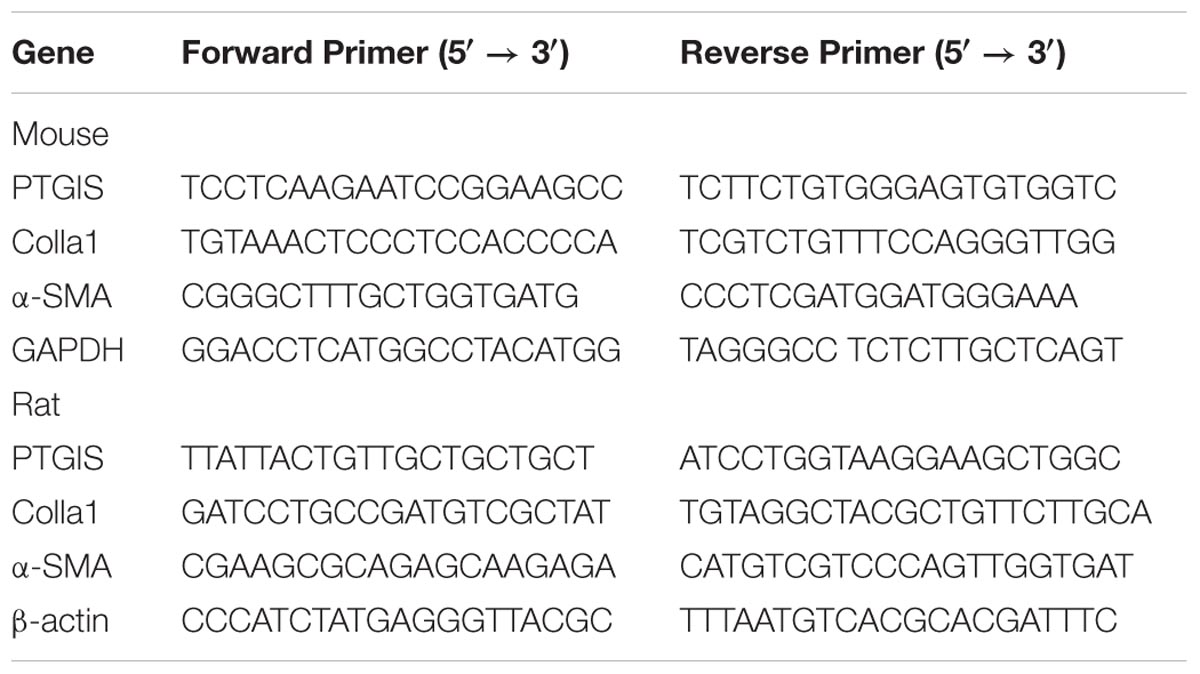
TABLE 2. Primers used in RT-qPCR.
Transfection With PTGIS Plasmid
Adding expression of PTGIS in HSC-T6 cells was mediated by rat-derived PTGIS overexpression plasmid. The transfection efficiency was measured by Western blot and RT-qPCR analysis. Plasmid constructs were purchased from GenePharma Co., Ltd. The transfection procedure were performed as follows. Briefly, 3 × 10⁵/mL HSC-cells were seeded in 6-well plates, cultured in DMEM contain 5% FBS for 12 h as described in Section “Cell Culture.” After adhere to the wall, HSC-T6 cells were transfected with 1000 ng/mL pEX-2-Control or pEX-2-PTGIS overexpression plasmid mixed with Lipo2000 transfection reagent (Invitrogen, Carlsbad, CA, United States) according to the manufacturer’s instruction. Cells were incubated with Opti-MEM at 37°C and 5% CO2 for 6 h. HSC-T6 cells transfected with PTGIS-plasmid were then cultured in DMEM containing 5% FBS and treated with TGF-β1 (10 ng/mL) for 24 h and consequently harvested for analysis with Western blotting, RT-qPCR and other experiments. All experiments were repeated at least three times.
RNA Interference Analysis
Transfection of HSC-T6 cells was conducted with lipofection technique, using Lipofectamine TM2000. Small interfering RNA (siRNA) oligonucleotides used for knockdown gene and a negative scrambled siRNA was used in parallel were synthesized by GenePharma (Shanghai, China). The siRNA sequences used in RNA interference analysis were listed in Table 3. All siRNA were purchased from GenePharma Co., Ltd. Briefly, 3 × 10⁵/mL HSC-T6 cells were seeded in six-well plates, cultured with DMEM contain 5% FBS for 12 h. Subsequently, HSC-T6 cells were transfected with 1000 ng/mL PTGIS-RNAi or Scrambled-RNAi and mixed with lipo2000 transfection reagent (Invitrogen, Carlsbad, CA, United States) according to the manufacturer’s instruction. Cells were incubated with Opti-MEM at 37°C and 5% CO2 for 6 h. HSC-T6 cells transfected with PTGIS-RNAi or Scrambled-RNAi were then cultured in DMEM containing 5% FBS and treated with TGF-β1 (10 ng/mL) for 24 h and consequently harvested for analysis with western blot and RT-qPCR and other experiments. The transfectiong efficiency were determined by Western blot and RT-qPCR analysis. All experiments were performed in triplicate and repeated at least three times.

TABLE 3. The siRNA sequences used in RNA interference analysis.
CCK-8 Analysis
The proliferation of HSC-T6 cells was determined by Cell Counting Kit-8 (CCK-8) analysis. Hundred microliter HSC-T6 cells suspension were seeded in 96-well culture plates at a density of 5 × 10³ per well, and the edge wells were filled with sterile PBS. After attachment, HSC-T6 cells were transfected with pEX-2-PTGIS or pEX-2-Control or PTGIS-RNAi or Scrambled-RNAi for 6 h in Opti-MEM. Then cells were cultured in DMEM containing 5% FBS. The transfected HSC-T6 cells were then treated with TGF-β1 (10 ng/mL) for 24 h. Then, 10 μL CCK-8 (Sigma, United States) was added for 4 h. The value of absorbance (A) was examined at the wavelength of 490 nm. Cell viability = the A value of transfection wells/the A value of control wells ∗ 100%. All experiments were performed in triplicate and repeated at least three times.
Flow Cytometer Analysis
Cell cycle analysis: HSC-T6 cells were trypsinized and collected in 15 mL centrifuge tubes. The cells suspension was centrifuged (1000 g, 3–5 min), mixed sufficiently and fixed in cold ethanol (70%, 1 mL) at 4°C for 12–24 h. After being centrifuged and resuspended, the HSC-T6 cells were added with 0.5 mL mixture (RNase and PI) and incubated for 30 min at 37°C in dark place. Flow cytometer (BD Biosciences) was used to detect the red fluorescence and scattered light at 488 nm wavelength. The analysis of DNA content and scattering light was processed by using the ModFit software (Verity Software House, United States). All experiments were repeated for three times. Cell apoptosis analysis: HSC-T6 cells were collected from suspension by centrifugation, and binding buffer (400 μL) was added to resuspend the cells (about 1∗106/mL). Then, 5 μL Annexin V-FITC (5 min, 2–8°C, dark) and PI were added (5 min, 2–8°C, dark), successively. When the preparation was completed, cells suspension were detected by flow cytometer (BD Biosciences) within 1 h and data fitting was made by FlowJo software (TreeStar, United States). All samples were assayed in triplicates.
Western Blot Analysis
Total protein from cultured HSC-T6 cells and primary HSCs were extracted with RIPA lysis buffer (contained 1% PMSF) (Beyotime, China). Protein of each sample 30–50 μg was separated by SDS-PAGE gel (10%) and then transferred onto PVDF membranes (Millipore Corp, Billerica, MA, United States). The transferred membranes were blocked in 5% skim milk for 3 h in order to break non-specific binding. Subsequently, membranes were incubated with the primary antibody against PTGIS, COL1a1, α-SMA, β-actin, C-myc, Cyclin D1, Bax, Bcl-2, cleaved-casepase 3, DNMT1, DNMT3a and DNMT3b overnight at 4°C, followed by incubation with secondary antibody at room temperature for 1 h. Signals were captured with Bioshine ChemiQ image system. The intensities of each western blotting band were quantified and analyzed by using the Image J software (NIH, Bethesda, MD, United States). The characteristics of antibodies were listed in Table 4.
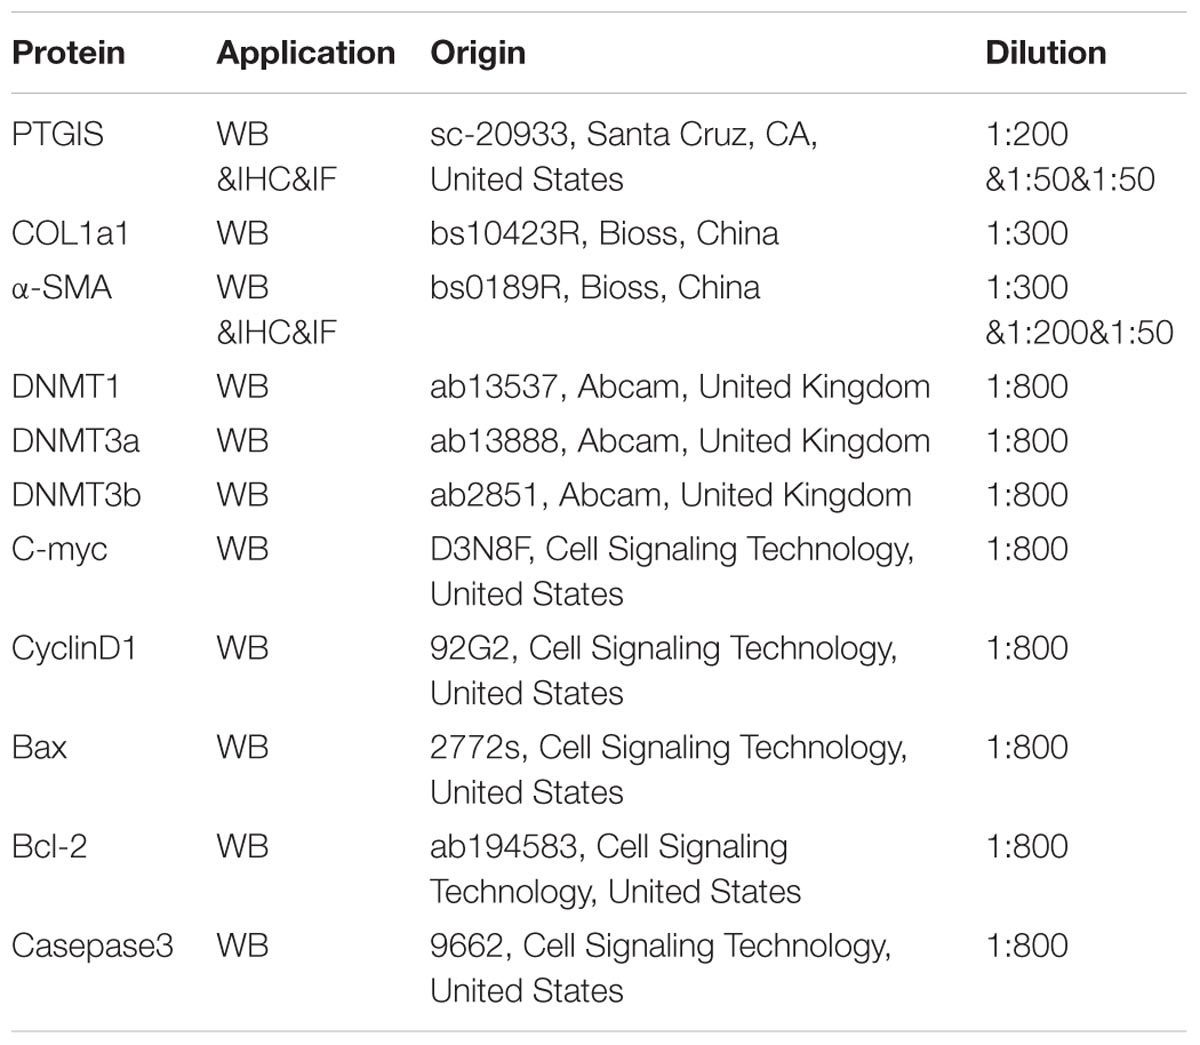
TABLE 4. The characteristics of antibodies.
Immunohistochemistry
Briefly, Liver tissues were firstly fixed in 10% neutral buffered formalin solution, follow embedded in paraffin and stained for routine histology. Slides were dewaxed in xylene and dehydrated in gradient alcohol, and antigen retrieval was obtained by microwaving in citric buffer for 15 min. After antigen retrieval, sections were deparaffinized and treated with 0.3% hydrogen peroxide for 15 min. Then, the sections were further blocked by 5% BSA and incubated with primary antibody against PTGIS (1:50) and α-SMA (1:200) overnight at 4°C. Follow on, the sections were incubated with biotinylated secondary antibody for 60 min at room temperature after rinsing. PTGIS and α-SMA expression was visualized by using 3,3-diaminobenzidine tetrahydrochloride (DAB) staining. Finally, the sections were mounted by gums and subjected to microscopic examination.
Statistical Analysis
Statistical Analysis Data are expressed as the mean ± SEM. One-way analysis of variance followed by the Newman–Keuls post hoc test (Prism 5.0 GraphPad Software, Inc., San Diego, CA, United States) was used to analyze results. All other protocols, which include MSP assay, ChIP assays are detailed in the Supplementary Materials and Methods.
Results
Expression of PTGIS Was Down-Regulated in CCl4-Induced Fibrotic Model
Liver fibrosis was induced in C57BL/6J mice by intraperitoneal injection CCl4 (10% in olive oil) for 6 weeks. As showed in Figure 1A, liver tissues from CCl4-treated mice presented with fibrotic lesions and obvious hepatomegaly. Hematoxylineeosin (H&E) staining, masson trichrome staining showed that normal lobular architecture with central veins and radiating hepatic cords in the vehicle group, while liver fibrosis liver showed prominent hepatic steatosis, necrosis, formation of regenerative nodules and fibrotic septa (Figure 1B). The immunostaining results showed that the expression of α-SMA was extensively stained in CCl4-treated mice livers tissue section (Figure 1C). Moreover, serum ALT and AST levels were obviously elevated in CCl4-induced fibrotic mice compared with vehicle group (Figure 1D). The proteins and mRNAs levels of COL1a1 and α-SMA were dramatically elevated while PTGIS was notably decreased in primary HSCs isolated from fibrotic livers relative to the vehicle group (Figure 1E). As showed in Figure 1F, immunohistochemistry staining pointed out that PTGIS expression was dramatically decreased in fibrotic liver tissues. As showed in Supplementary Figure 1, immunofluorescence staining illustrated that α-SMA protein expression was elevated in primary HSCs isolated from CCl4-treated mice group compared with vehicle-treated group. Double immunofluorescence staining showed that PTGIS-positive area and α-SMA-positive area were highly overlapped (Figure 1G), which indicated that PTGIS might be expressed in HSCs. Taken together, these data indicated that liver fibrosis mice model were well established and PTGIS expression was decreased in CCl4-induced mice model.
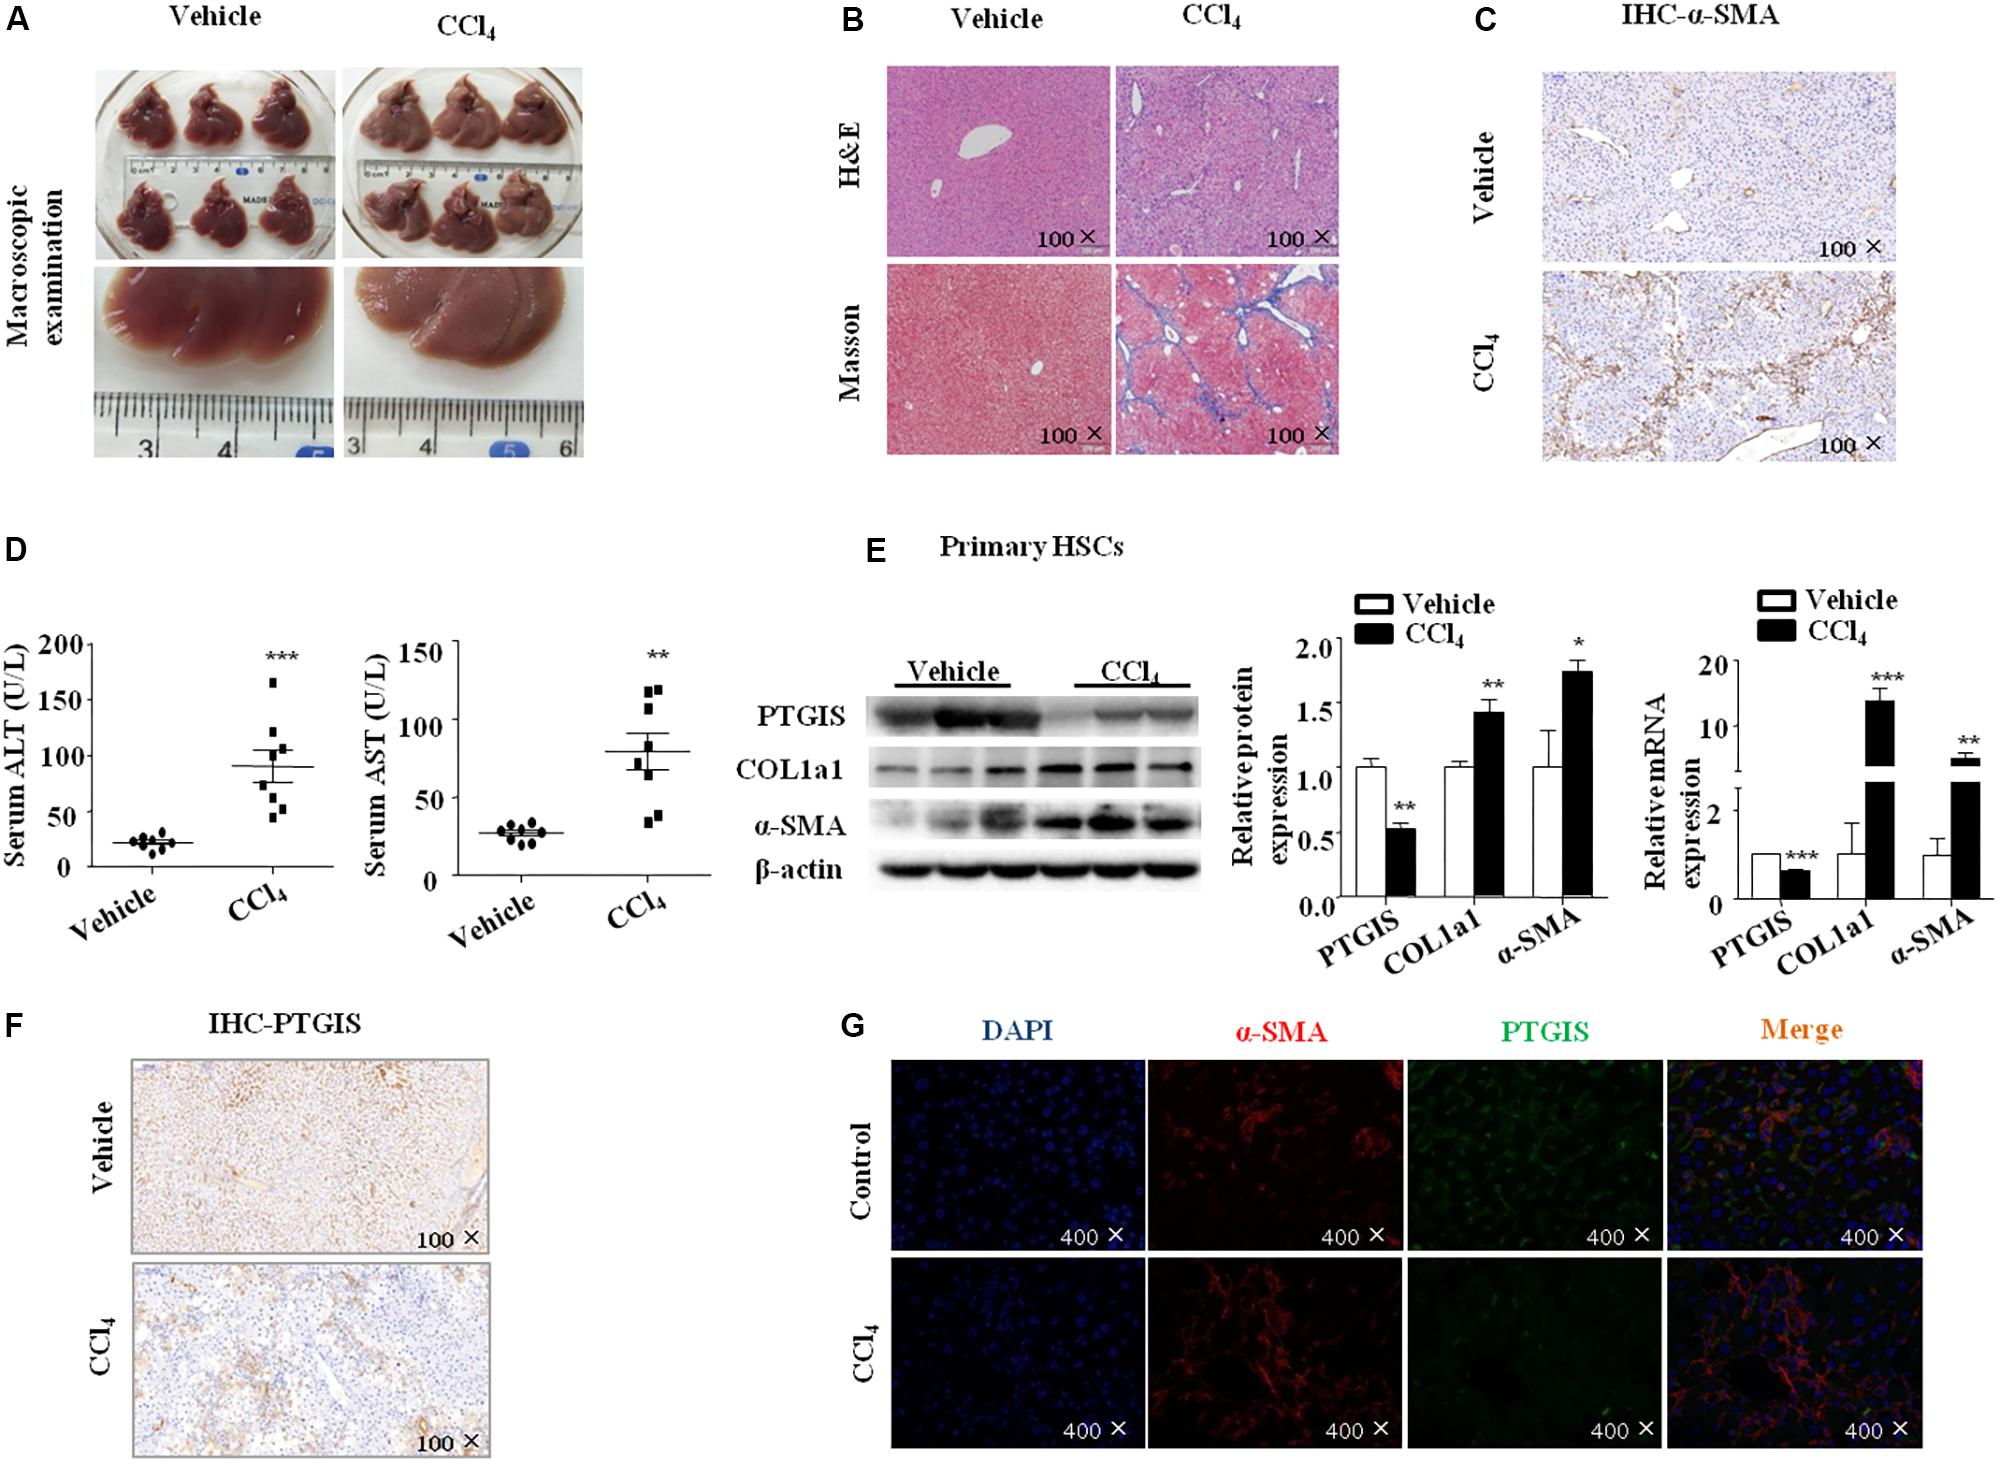
FIGURE 1. The expression of PTGIS in fibrotic model in C57BL/6J mice. (A) Macroscopic examination of fresh liver tissue without fixation from C57BL/6J mice in Vehicle group and Model group. (B) Pathology observation of the mouse liver sections stained with H&E staining, Masson staining (100×). (C) The expression of α-SMA were determined by immunohistochemistry (IHC) staining (100×). (D) Serum ALT and AST levels of mice between vehicle group and model group were determined, ∗∗p < 0.01, ∗∗∗p < 0.001 vs. Vehicle group, n = 8/group. (E) The protein and mRNA levels of PTGIS, COL1a1 and α-SMA in primary HSCs isolated from fibrotic livers were analyzed by western blot and RT-qPCR analysis, representative blots of three of three independent experiments are shown, ∗p < 0.05, ∗∗p < 0.01 vs. Vehicle group. (F) The expression levels of PTGIS in fibrotic liver were determined by Immunohistochemistry staining (100×). (G) Double immunofluorescence staining of α-SMA (red) and PTGIS (green), representative views from Vehicle group and CCl4-treated mice were presented (400×).
PTGIS Expression Was Increased in the First 4 weeks and Then Decreased in the Process of Model Establishment
To detected the PTGIS expression changes in the process of fibrotic models establishment, C57BL/6J mice were stimulated with CCl4 (10%) with different time points (1, 2, 3, 4, 5, 6 week). Hematoxylineeosin (H&E) staining, masson trichrome staining, immunohistochemistry (IHC) for α-SMA showed that the damage of tissue were enhanced by time-dependent manner (Figure 2A). Interestingly, immunohistochemistry (IHC) for PTGIS revealed that PTGIS were obviously increased in early-stage CCl4-induced liver injury, and remarkably decreased after 4 weeks CCl4 induced fibrotic livers compared with 3 weeks (Figure 2B). Additionally, Western Blot results revealed that COL1a1 and α-SMA protein levels were dramatically increased in a time-depend manner (Figure 2D) and the protein levels of PTGIS was increased firstly and decreased after 4 weeks of CCl4-treated (Figure 2C). Furthermore, the mRNA levels of PTGIS, COL1a1 and α-SMA were consistent with Western blot analysis (Figure 2E). It has been demonstrated that PTGIS own anti-inflammatory property (Phillips et al., 2014; Cebola et al., 2015). Therefore, we supposed that the up-regulated expression of PTGIS in early-fibrotic-stage was a positive feedback to liver inflammation.
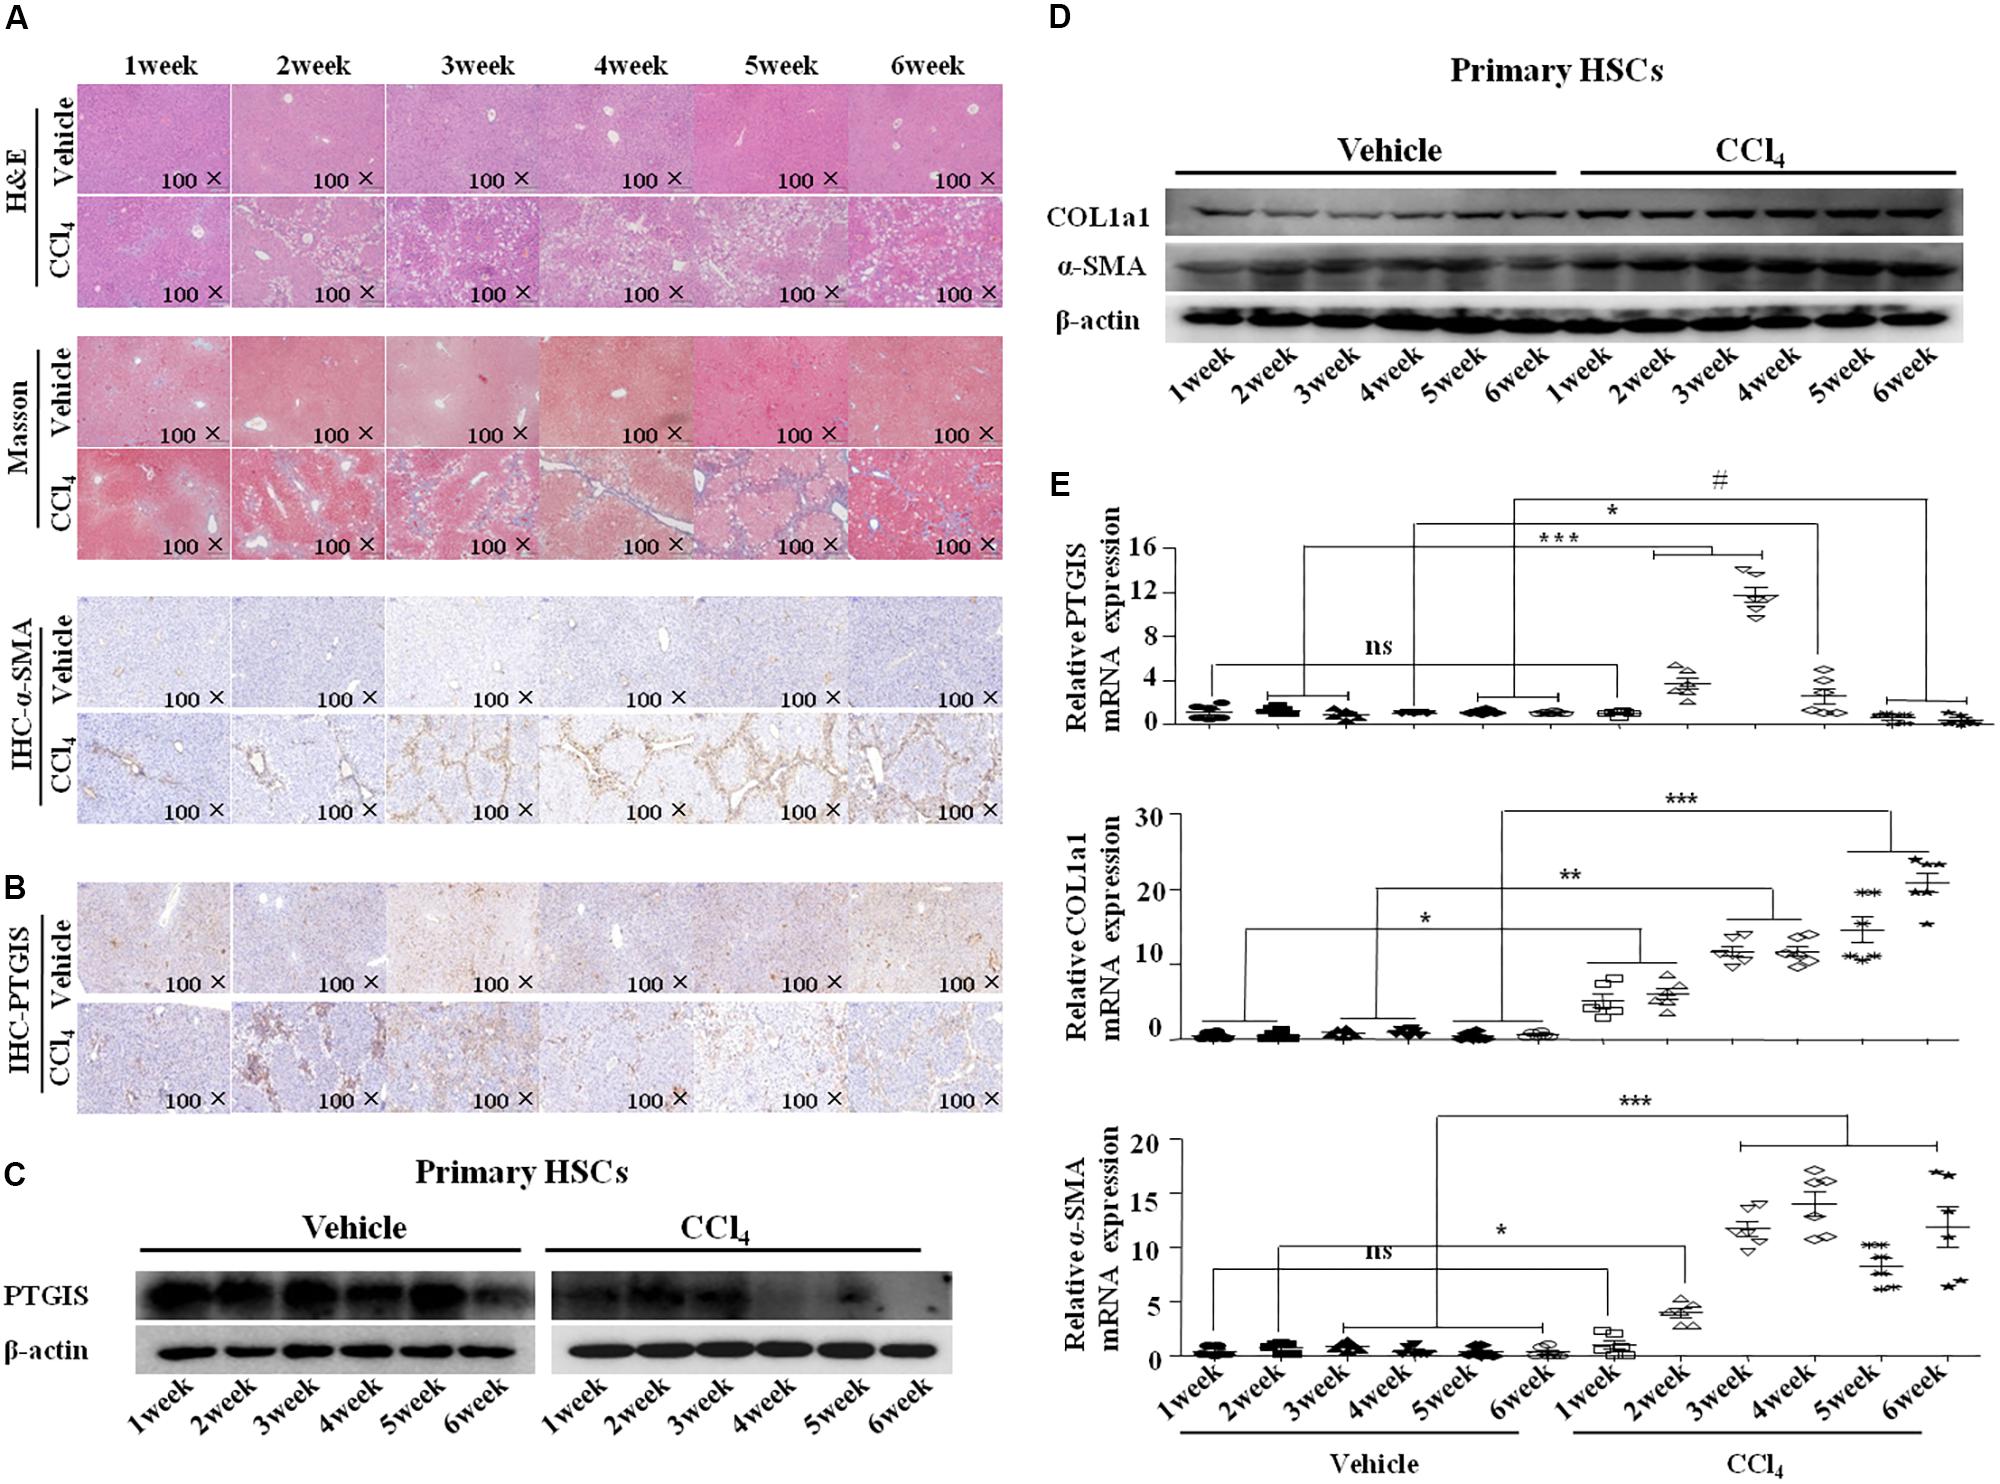
FIGURE 2. PTGIS expression changes between the model establishment. (A) The mice were stimulated with CCl4 for different time span. Pathology observation of the mouse liver sections stained with H&E staining, Masson staining (100×). The expression of α-SMA were detected by immunohistochemistry(100×). (B) Immune signals for PTGIS (100×). (C) The protein expression changes of PTGIS in vehicle and CCl4-treated group was measured by Western blot experiment. (D) The protein levels of PTGIS, COL1a1 and α-SMA were determined by western blot analysis. (E) PTGIS, COL1a1 and α-SMA mRNA expression levels were detected by RT-qPCR, ∗P < 0.05, ∗∗P < 0.01, ∗∗∗P < 0.001 vs. vehicle group.
PTGIS Expression Was Down-Regulated in HSCs in Vitro
To determine the expression of PTGIS in TGF-β1-treated HSC-T6 cells, we performed Western blot, RT-qPCR and immunoflurescence staining. As illustrated in Figure 3A, HSC-T6 cells treated with TGF-β1 at the concentration of 0, 5 10, 15 ng/mL for 24 h, the results showed that highest levels of COL1a1 and α-SMA was presented at the concentration of 10 ng/mL. Additionally, the expression levels of COL1a1 and α-SMA protein were also up-regulated in HSC-T6 cells stimulated with TGF-β1 (10 ng/mL) for 0, 6, 12, 24, 48 h (Figure 3B). Take all the results into consideration, we chose TGF-β1 (10 ng/mL) and 24 h for the further study. As showed in Figure 3C, the protein levels of PTGIS were down-regulated in HSC-T6 cells treated with TGF-β1 (10 ng/mL) compared with Control group. The result of RT-qPCR was similar (Figure 3D). We further examinated the PTGIS protein expression by immunofluorescence staining (Figure 3E), the results showed that PTGIS was expressed in the cytoplasm and was dramatically decreased in TGF-β1-treated group.
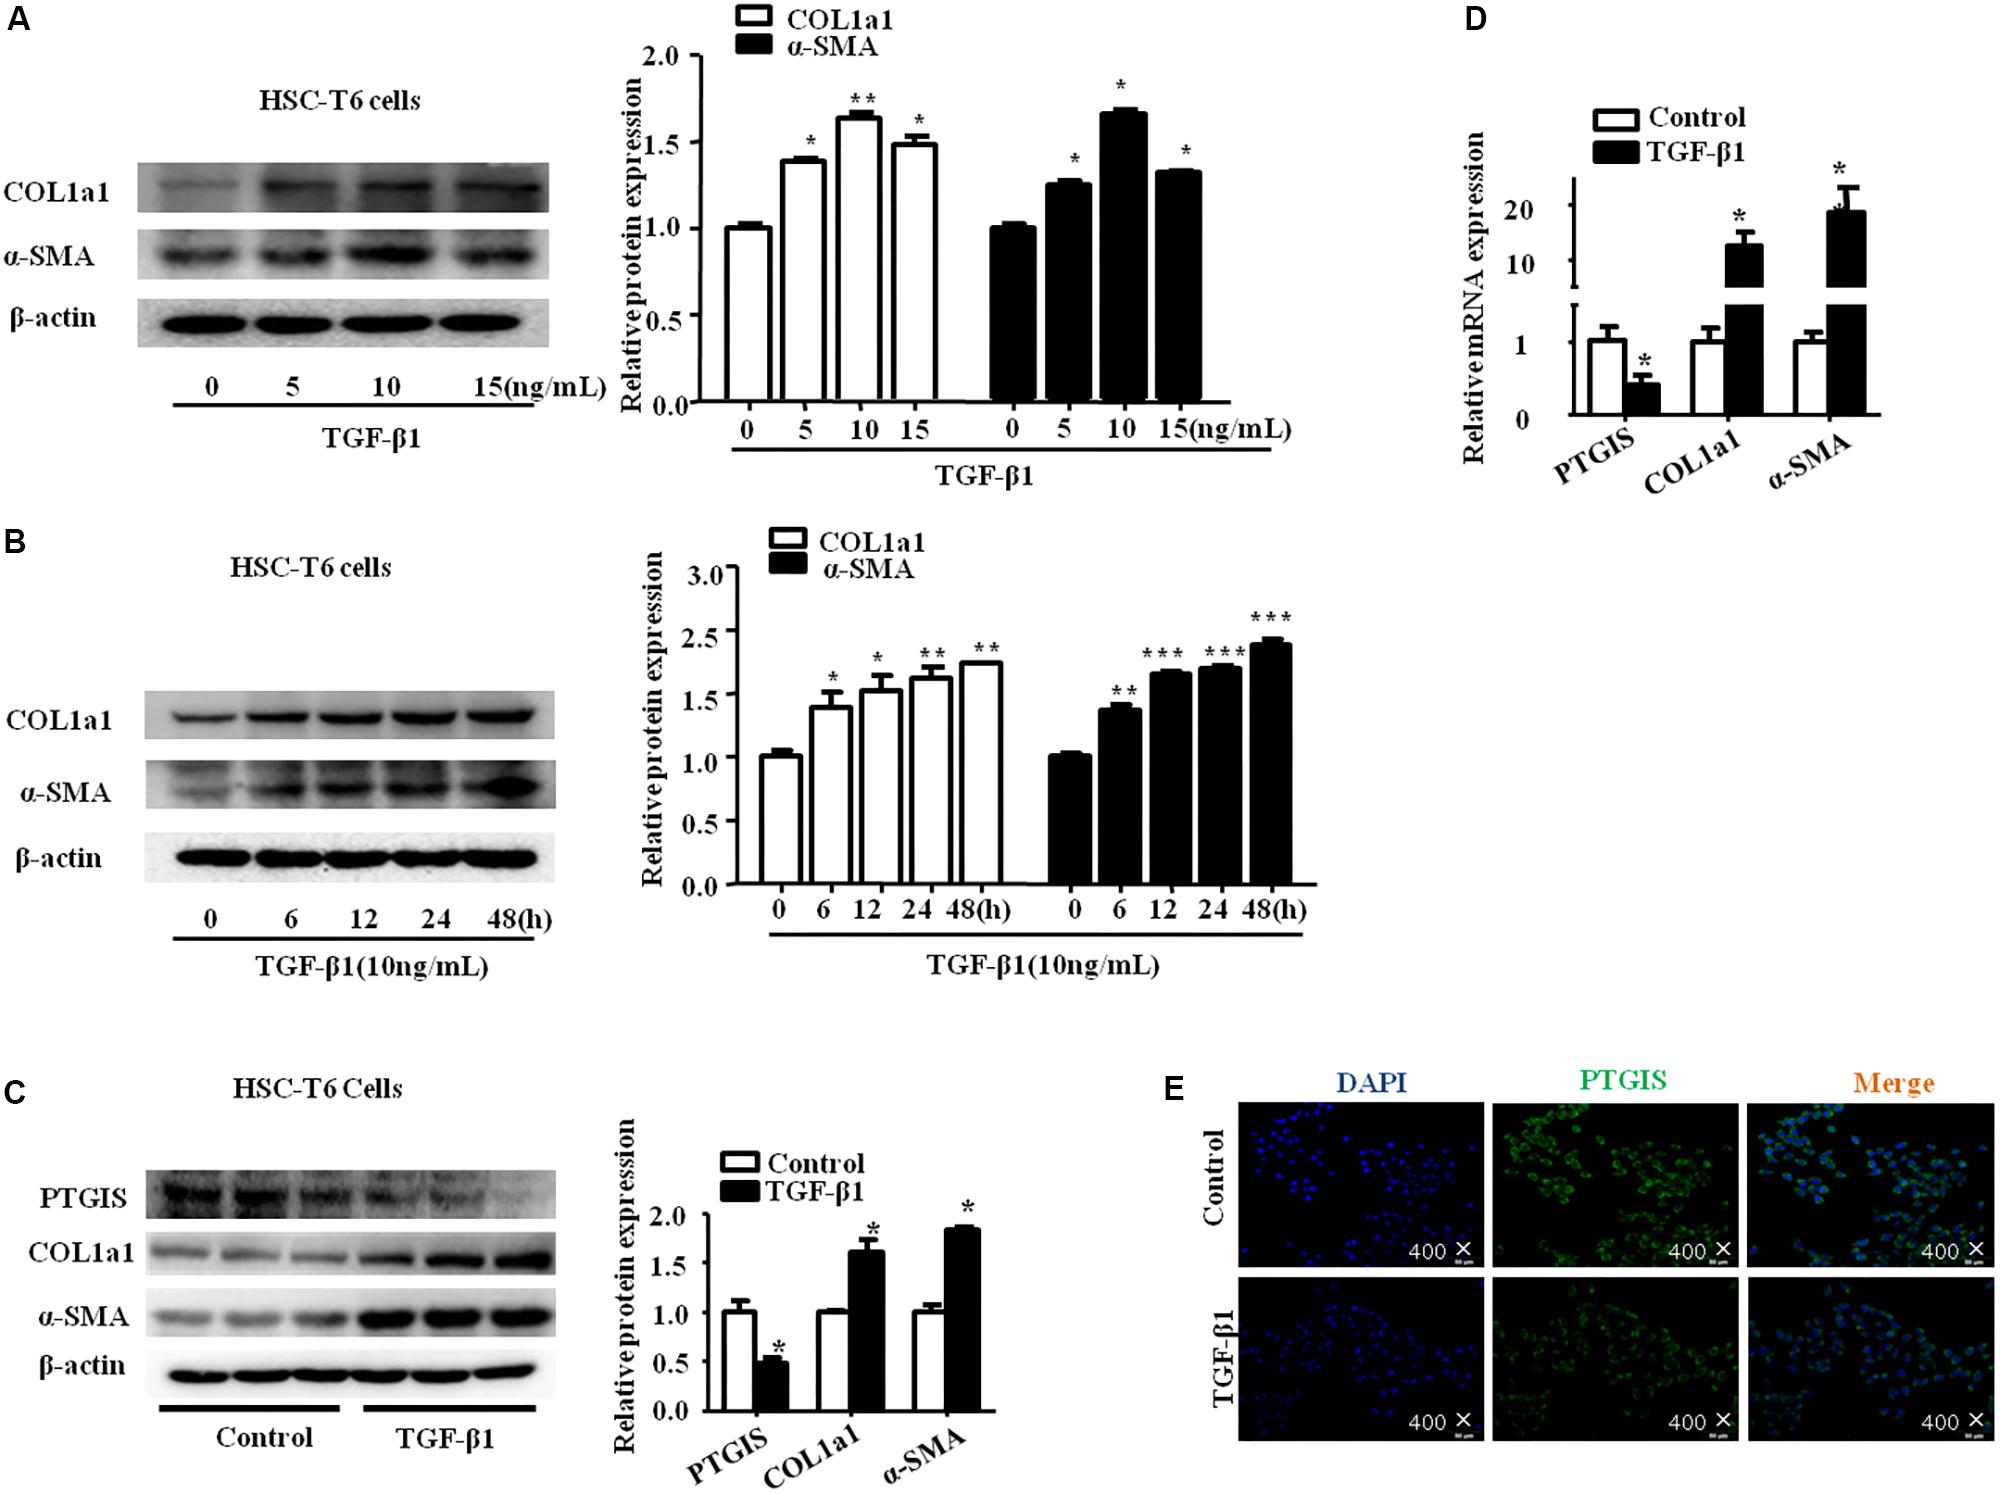
FIGURE 3. The expression of PTGIS in HSC-T6 cells treated with TGF-β1. (A) HSC-T6 cells were stimulated with different concentration of TGF-β1 (0, 5, 10, 15 ng/mL) for 24 h. The protein expression levels of COL1a1 and α-SMA were measured by western blot. The results are shown as relative expression against non-treated HSC-T6 cells. ∗p < 0.05, ∗∗p < 0.01 vs. non-treated group. (B) HSC-T6 cells were stimulated with TGF-β1 (10 ng/mL) for 0, 6, 12, 24, 48 h. The protein levels of COL1a1 and α-SMA were measured by Western blot, ∗p < 0.05, ∗∗p < 0.01, ∗∗∗p < 0.001 vs. control group. (C) The PTGIS, COL1a1 and α-SMA protein levels treated with TGF-β1 (10 ng/mL) for 24 h in HSC-T6 cells were detected by western blot analysis, ∗P < 0.05, ∗∗P < 0.01, ∗∗∗P < 0.001 vs. control group. (D) The mRNA levels of PTGIS, COL1a1 and α-SMA were measured by RT-qPCR experiment, ∗P < 0.05 vs. control group. (E) The expression levels of PTGIS protein in the HSC-T6 cells treated with TGF-β1 were determined by Immunofluorescence (400×).
The Down-Regulated PTGIS Expression Was Associated With DNA Hypermethylation and Can Be Restored by 5-azadC and DNMTs-RNAi
To determine whether decreased PTGIS expression was associated with DNA methylation in fibrotic livers, prediction was done to determine the CpG island of PTGIS gene (Figure 4A). We detected the protein expression of DNMT1, DNMT3a and DNMT3b were detected in vivo and in vitro. As showed in Figure 4B, DNMT1, DNMT3a, and DNMT3b expression were up-regulated in primary HSCs isolated from CCl4-induced fibrotic mice and TGF-β1-treated HSC-T6 cells.
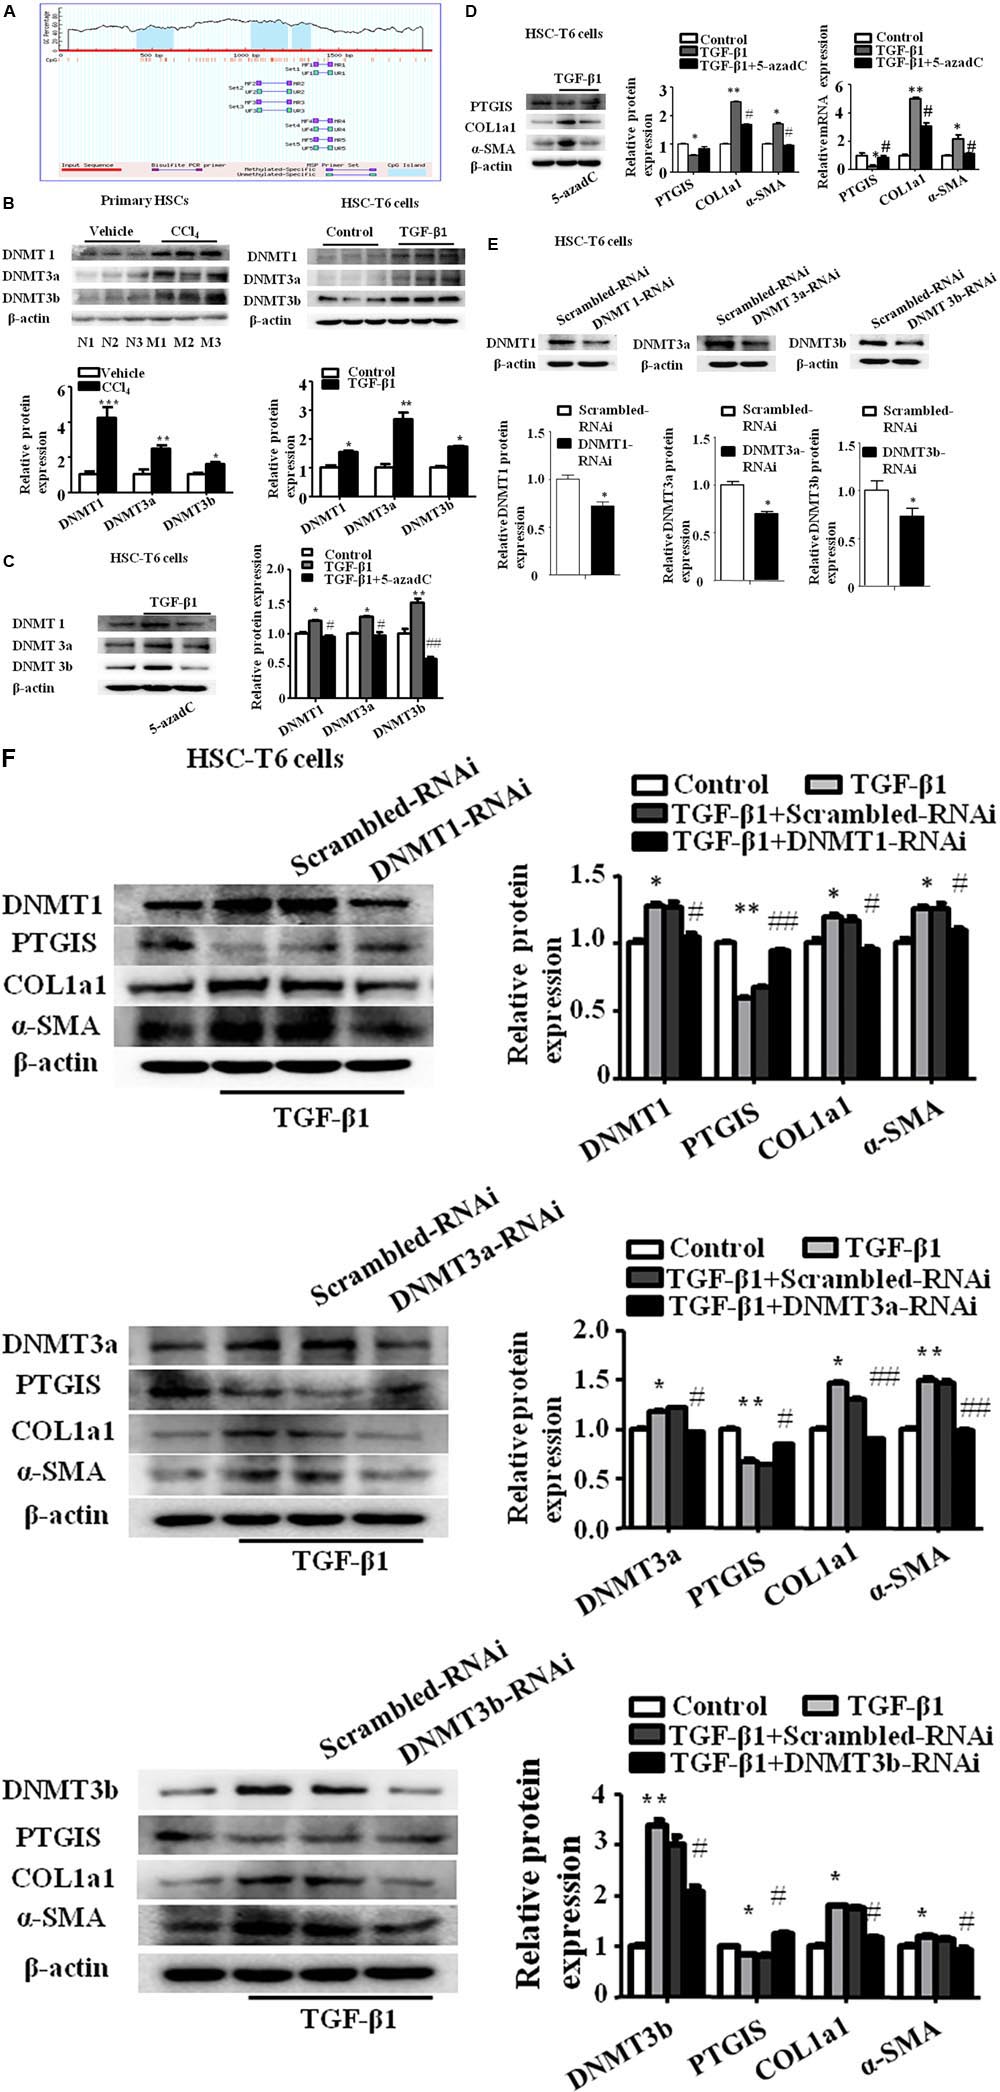
FIGURE 4. The expression of PTGIS was associated with DNA hypermethylation in activated HSC-T6 cells. (A) The CpG island in PTGIS gene were predicted. (B) The protein levels of DNMT1, DNMT3a, and DNMT3b in primary HSCs isolated from fibrotic livers and HSC-T6 cells were detected by western blot analysis, ∗P < 0.05, ∗∗P < 0.01, ∗∗∗P < 0.001 vs. vehicle group or control group. (C) The protein levels of DNMT1, DNMT3a and DNMT3b in control, model and TGF-β1 + 5-azadC groups, HSC-T6 cells were treated with 5-azadC (2 μM) 6 h before added TGF-β1(10 ng/mL) for 24 h, ∗p < 0.05, ∗∗p < 0.01 vs. control group, #p < 0.05, ##p < 0.01 vs. TGF-β1-treated group. (D) The protein and mRNA levels of PTGIS, COL1a1, and α-SMA were measured by western blot and RT-qPCR, ∗P < 0.05, ∗∗P < 0.01 vs. control group, #p < 0.05 vs. TGF-β1 group. (E) The efficiency of DNMT1, DNMT3a and DNMT3b lose-expression in HSC-T6 cells were detected by western blot, ∗p < 0.05 vs. Scrambled-RNAi group. (F) The protein levels of DNMT1, DNMT3a, DNMT3b, PTGIS, COL1a1 and α-SMA were detected via western blot analysis, ∗P < 0.1, ∗∗P < 0.05 vs. control group, #P < 0.1, ##P < 0.05 vs. TGF-β1 + Scrambled-RNAi group.
To further elucidate whether the lost expression of PTGIS was results from aberrant DNA methylation, the DNMTs inhibitors 5-aza-2′-deoxycytidine (5-azadC) (2 μM) was used 6 h before TGF-β1-treated in HSC-T6 cells (Cai et al., 2016). Western blot results revealed that the protein levels of DNMT1, DNMT3a and DNMT3b were obviously inhibited by 5-azadC (2 μM) (Figure 4C). The lost expression of PTGIS was restored by 5-azadC (2 μM) (Figure 4D). These data suggested that DNMTs of HSCs may have an important role in the methylation of PTGIS.
To further identify which DNMTs mainly influenced PTGIS promoter methylation, DNMT1-siRNA, DNMT3a-siRNA and DNMT3b-siRNA were used to knockdown DNMT1, DNMT3a and DNMT3b expression in HSC-T6 cells, respectively. Firstly, the inhibitory effect was verified by Western Blot (Figure 4E). The results of Western Blot revealed that PTGIS expression were negatively with the protein levels of DNMT1, DNMT3a and DNMT3b, and the protein levels of COL1a1 and α-SMA were negatively related with PTGIS expression (Figure 4F). ChIP assay showed that PTGIS gene can be pulled down by anti-DNMT1 and anti-DNMT3b antibody in TGF-β1 activated HSC-T6 cells whereas anti-DNMT3a and negative control anti-IgG antibody cannot pull down PTGIS gene. The results of ChIP assay indicated that DNMT1 and DNMT3b directly binding with PTGIS gene in HSC-T6 cells (Supplementary Figure 2A). MSP analysis showed that PTGIS gene was mainly amplified by PTGIS unmethylated primer (PTGIS-U) in non-treated cells, whereas mainly amplified by PTGIS methylated primer (PTGIS-M) in TGF-β1-treated HSC-T6 cells (Supplementary Figure 2B). The results of MSP showed that TGF-β1 could induced aberrant hypermethylation of PTGIS gene. Taken together, these data indicated that the downregulation of PTGIS in liver fibrosis was attributed to DNA methylation and PTGIS gene methylation was mainly caused by DNMT1 and DNMT3b.
Liver-Specific PTGIS Overexpression Alleviated CCl4-Induced Liver Fibrosis in C57BL/6J Mice
Recombinant adeno-associated viral (rAAV) vectors can infect both dividing and non-dividing cells in vitro and in vivo, establishing long-term and efficient transgene expression with minimal toxicity and cellular immune response (Gao et al., 2002; McCarty et al., 2003; Wang et al., 2003; McCarty, 2008). To identify the function of PTGIS in liver fibrosis in vivo, rAAV8-empty or rAAV8-PTGIS was intravenously injected into CCl4-treated mice via the tail vein before the first injection of 10% CCl4. Fluorescent microscopy showed efficient transduction of liver, as indicated by eGFP expression (Figure 5A). Histologically, H&E staining and Masson trichrome staining showed that forced expression of PTGIS could alleviate steatosis, necrosis and collagen deposition (Figure 5B). IHC-PTGIS showed that the PTGIS expression was restored in primary HSCs after administration of rAAV8-PTGIS in model group (Figure 5B). Furthermore, forced expression of PTGIS dramatically decreased the levels of serum ALT/AST compared with model group (Figure 5C). The protein and mRNA expression levels of COL1a1 and α-SMA were down-regulated in primary HSCs isolated from rAAV8-PTGIS-treated model group compared with rAAV8-empty-treated group (Figure 5D). The data presented indicated that adding PTGIS expression in vivo could alleviate CCl4-induced HSCs activation and liver fibrosis in mouse model.
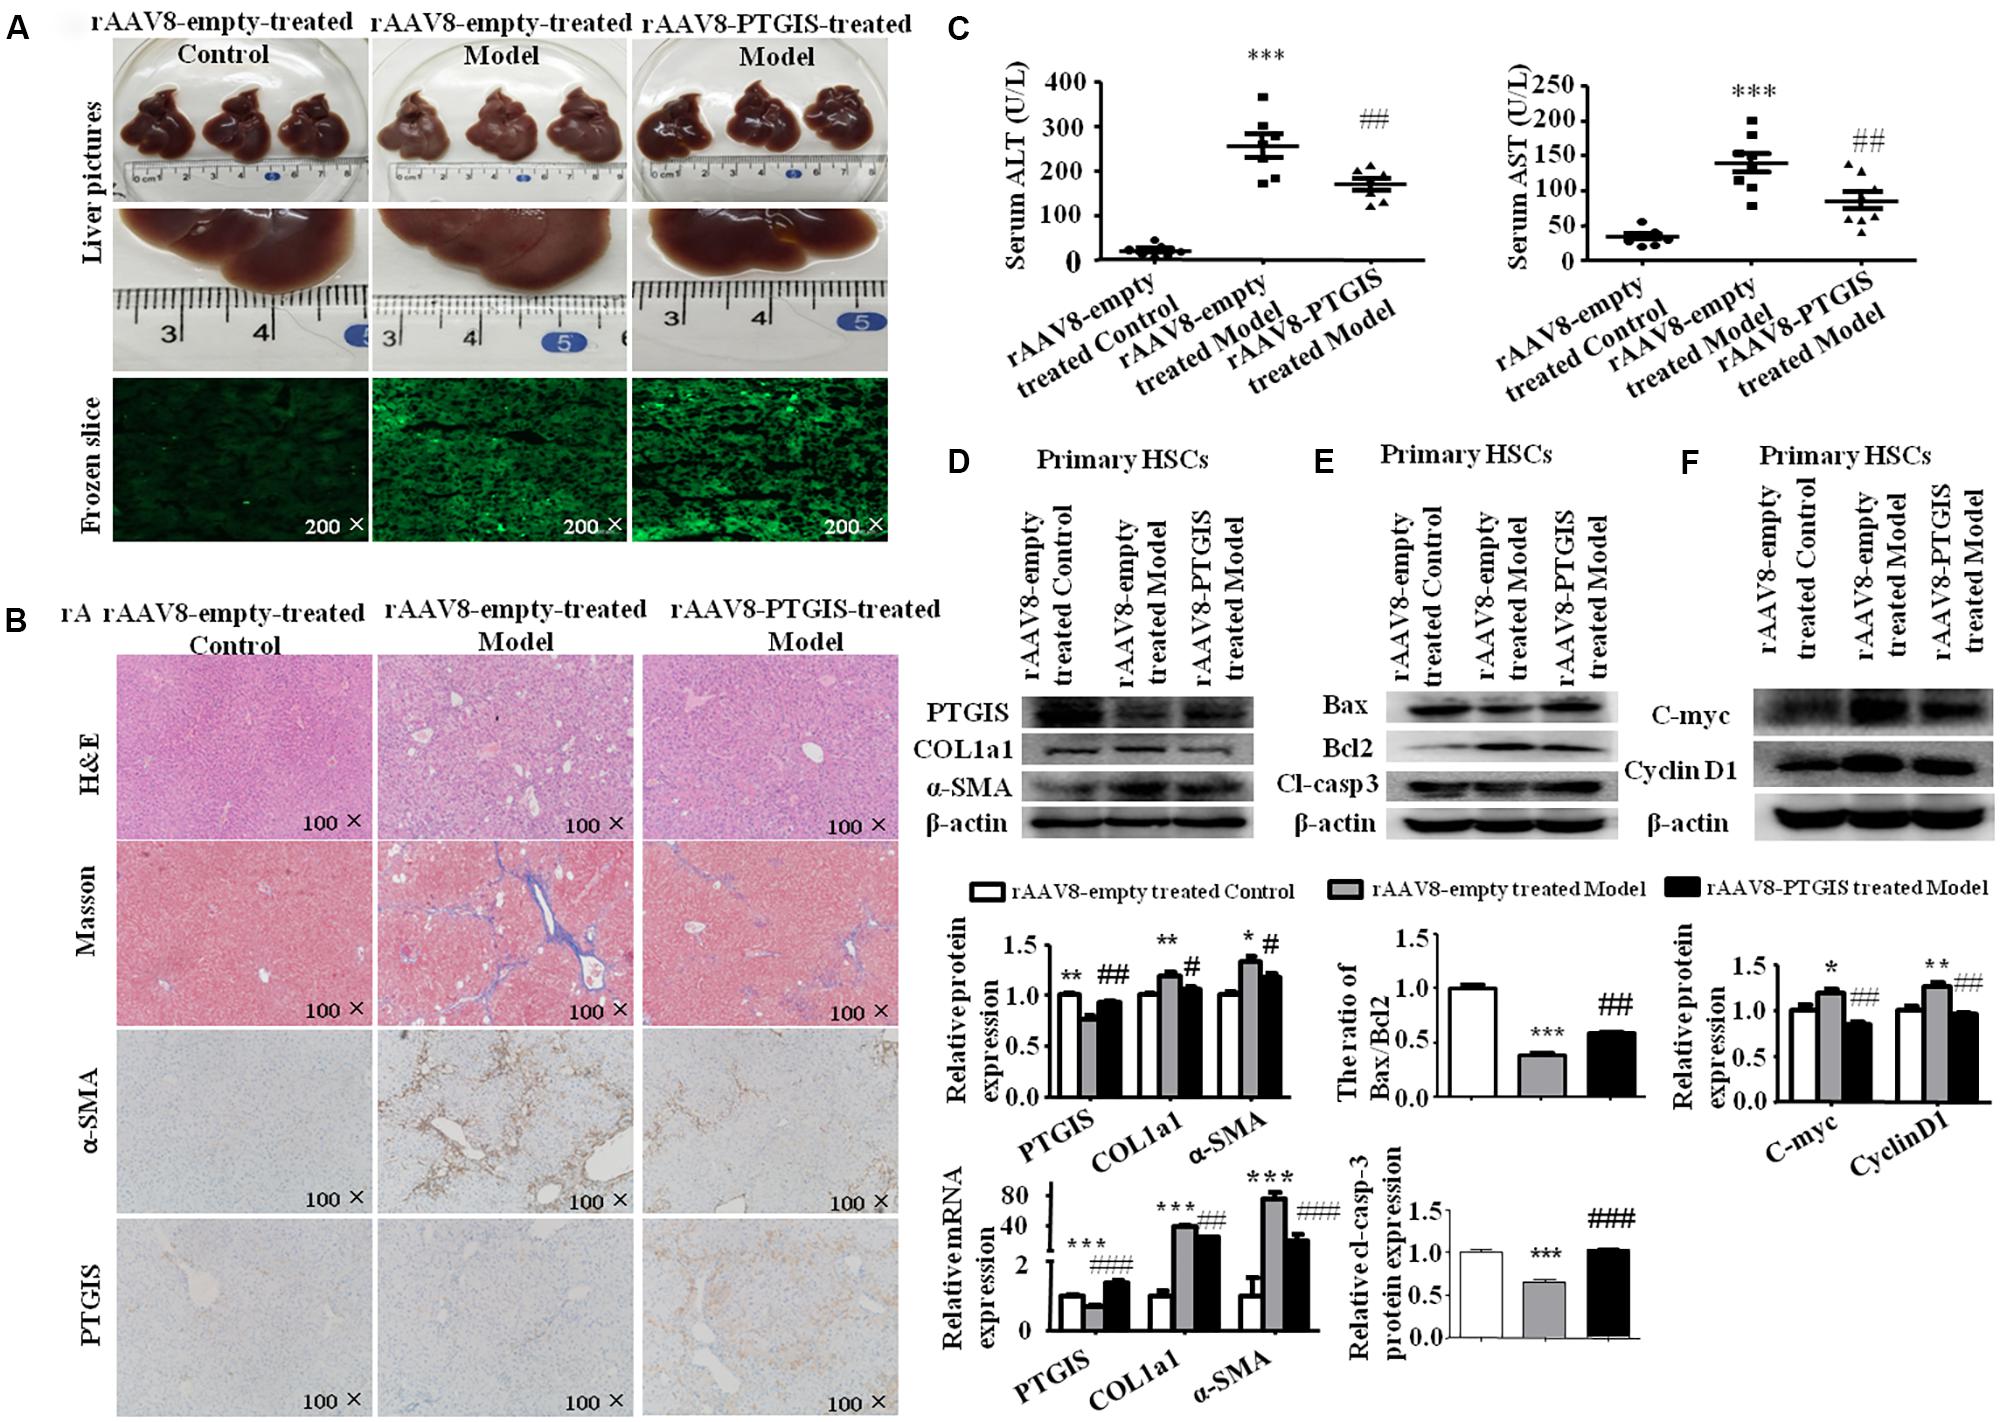
FIGURE 5. Liver-specific PTGIS overexpression alleviated CCl4-induced liver fibrosis. (A) Macroscopic examination of fresh liver tissue without fixation from C57BL/6J mice in rAAV8-empty-treated control group, rAAV8-empty-treated model group and rAAV8-PTGIS-treated model group, and the transduction efficient of rAAV8-PTGIS-eGFP in liver tissues were examinated by laser confocal microscopy. (B) Pathology observation of the mouse liver sections stained with H&E staining, masson staining (200 μM), immunohistochemistry (IHC) for α-SMA (200 μM) and PTGIS (200 μM). (C) Serum ALT and AST levels, ∗∗∗P < 0.001 vs. rAAV8-empty treated Control group, ##p < 0.01 vs. rAAV8-empty treated Model group. (D) The protein and mRNA expression levels of PTGIS, COL1a1, α-SMA were examinated by western blot and RT-qPCR analysis, ∗P < 0.05, ∗∗P < 0.01 vs. rAAV8-empty treated Control group, #p < 0.05, ##p < 0.01 vs. rAAV8-empty treated Model group. (E) the protein levels of Bax, Bcl2, and Cleaved-caspase3 were assessed by western blot experiment, ∗∗∗P < 0.001 vs. rAAV8-empty treated Control group, ##p < 0.01, ###p < 0.001 vs. rAAV8-empty treated Model group. (F) The protein levels of C-myc and CyclinD1 were detected by western blot analysis, ∗P < 0.05 vs. rAAV8-empty treated Control group, #p < 0.05 vs. rAAV8-empty treated Model group.
PTGIS Overexpression Inhibited TGF-β1-Induced HSC-T6 Cells Activation and Promoted Activated HSCs Apoptosis in Vivo and in Vitro
It has been demonstrated previously that PTGIS can inhibit cell growth in lung to alleviate pulmonary hypertension (Tuder et al., 1999) and overexpression of PTGIS in human embryonic kidney epithelial 293 (HEK-293) cell line can induce cell death (Hatae et al., 2001). Accordingly, we supposed that forced PTGIS expression in vivo and in vitro may alleviate liver fibrosis through affect HSCs activation and survival. To test this hypothesis, we examinated the expression levels of apoptosis associated protein (Bax, Bcl2, and cleaved-casepase3) and Cell cycle-related protein (C-myc and CyclinD1) in primary HSCs. The Western Blot analysis showed that the ratio of Bax/Bcl2 and the expression of cleaved-casepase3 were significantly elevated in primary HSCs isolated from rAAV8-PTGIS-treated model group compared with primary HSCs isolated from rAAV8-empty-treated model group (Figure 5E), which indicated that PTGIS may have pro-apoptosis effect on primary HSCs. The increased C-myc and CyclinD1 protein levels in primary HSCs isolated from rAAV8-empty-treated model group were decreased in rAAV8-PTGIS-treated model group (Figure 5F). The results indicated that adding PTGIS expression inhibits cell cycle.
To explore the function of PTGIS in the progress of HSC-T6 cells activation, HSC-T6 cells were transfected with PTGIS plasmid (pEX-2-PTGIS). As showed in Figure 6A, pEX-2-PTGIS plasmid could obviously elevate PTGIS protein and mRNA expression. Forced-expression of PTGIS significantly decreased the protein and mRNA levels of COL1a1 and α-SMA in pEX-2-PTGIS group compared with pEX-2-control group in TGF-β1 activated HSC-T6 cells (Figure 6B). The results of flow cytometric analysis (FCM) showed that over-expression of PTGIS observably induced G0/G1 arrest in HSC-T6 cells compared with pEX-2-PTGIS-control group, accompanied with an obvious reduction of cell numbers in the G2/M phase (Figure 6C). In addition, the expression of C-myc and CyclinD1 protein were up-regulated in TGF-β1-treated group and down-regulated in pEX-2-PTGIS group (Figure 6D). CCK8 assay suggested that the viability of HSC-T6 cells was obviously increased in TGF-β1-treated group compared with control group and significantly decreased in pEX-2-PTGIS group compared with pEX2-control group (Figure 6E). Next, we investigated the influence of PTGIS over-expression on the apoptosis of activated HSC-T6 cells by Annexin-V/PI staining. Flow cytometric analysis revealed that forced PTGIS expression increased apoptosis cells percentage in activated HSC-T6 cells (Figure 6F). Furthermore, forced PTGIS expression significantly increased the ratio of Bax/Bcl2 and Cleaved-caspase3 levels (Figure 6G). The above results demonstrated that overexpression of PTGIS can inhibit HSC-T6 cells activation and promote activated HSC-T6 cells apoptosis in vitro.
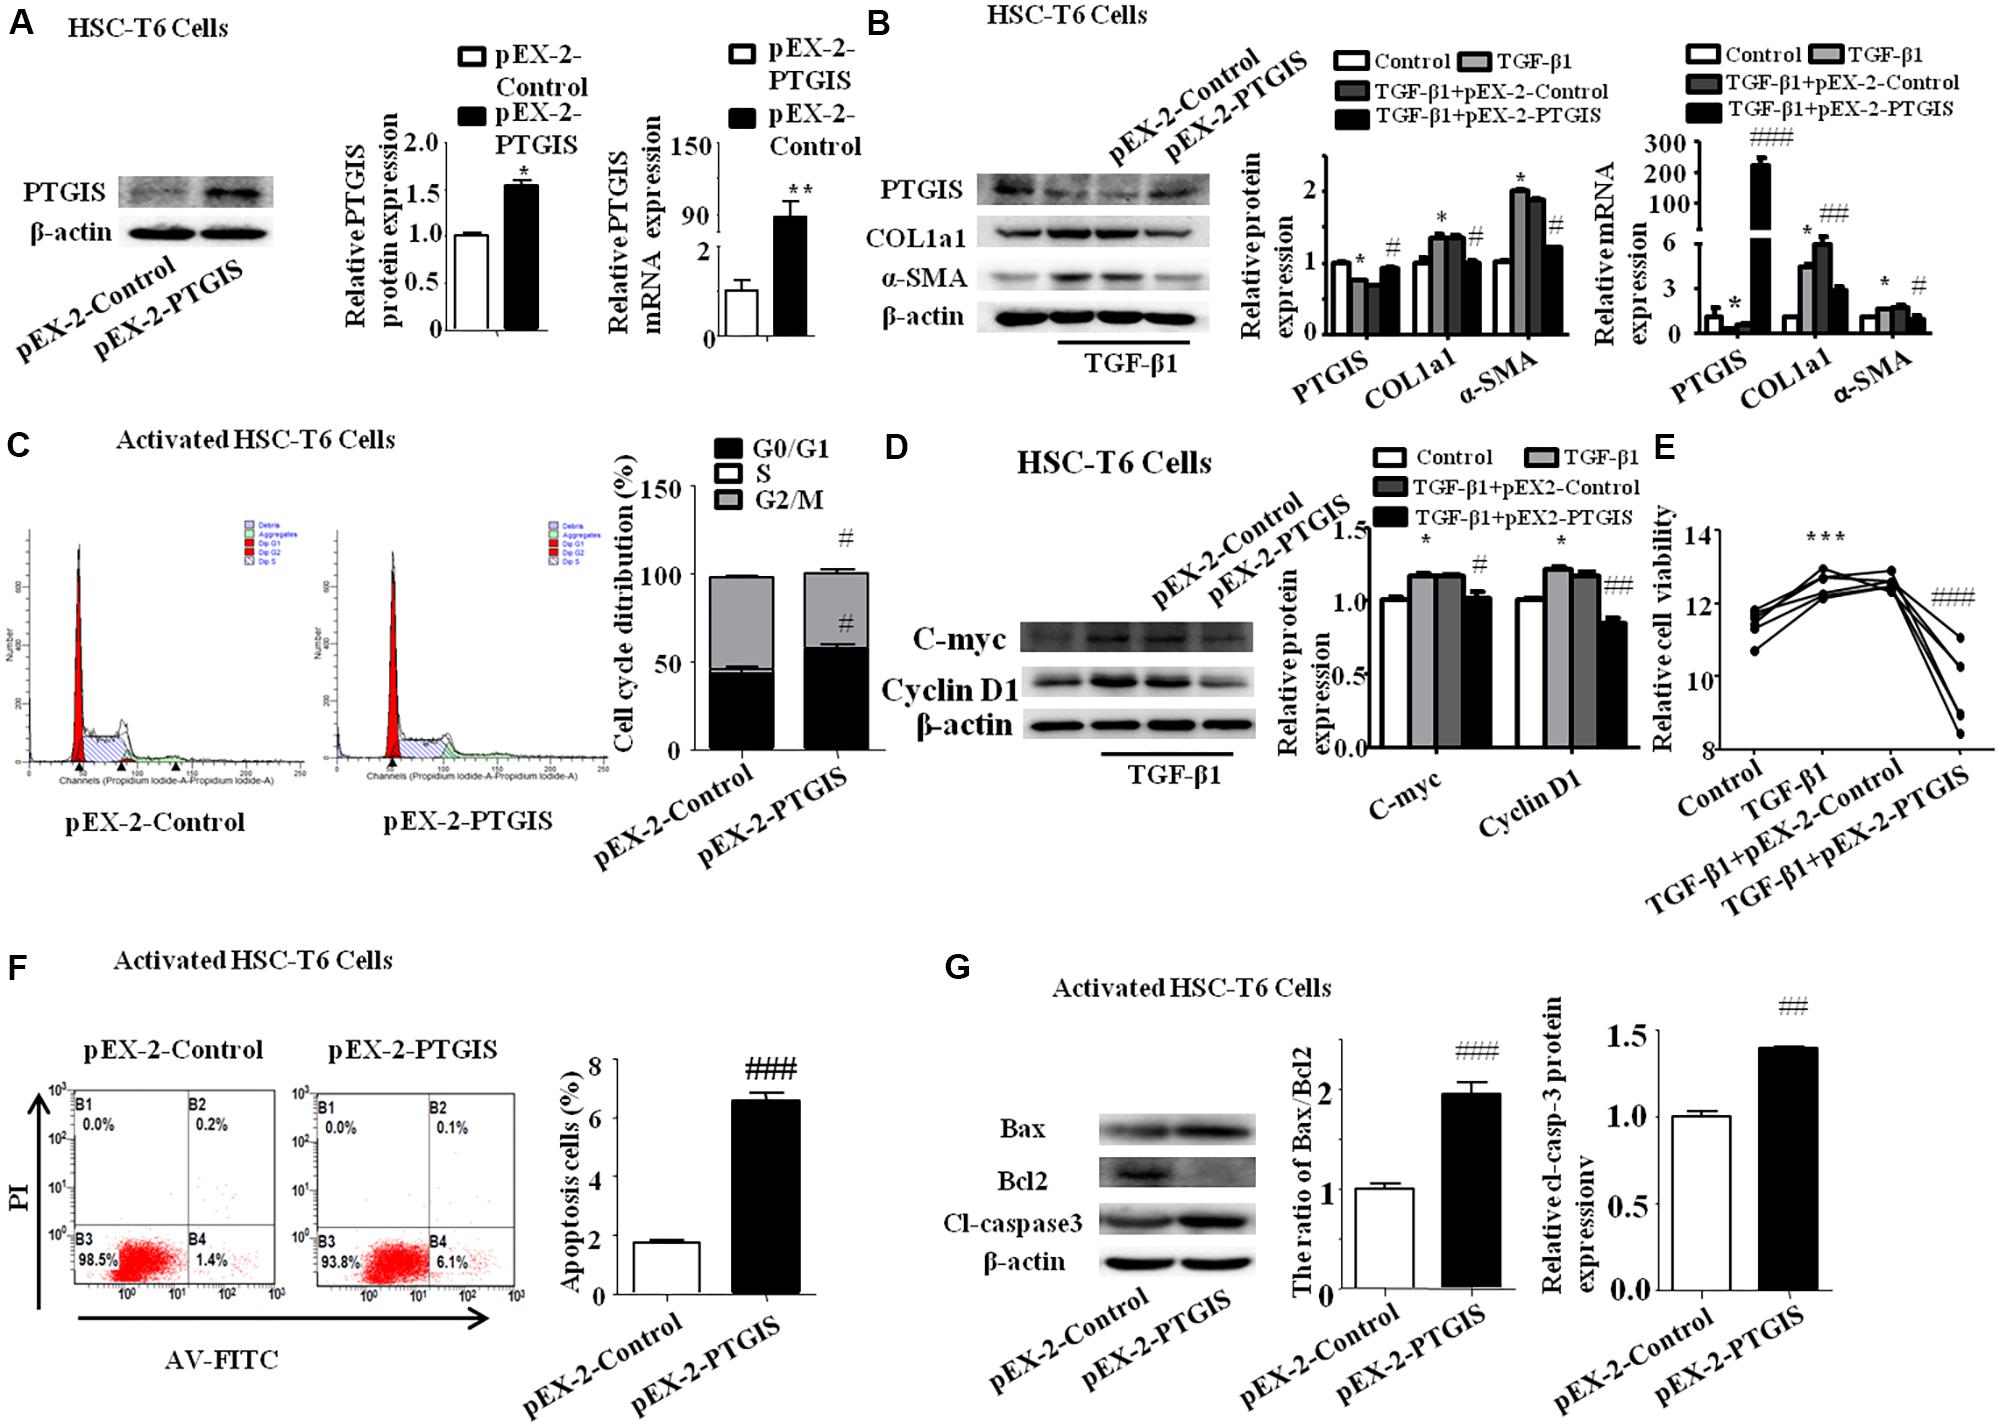
FIGURE 6. Function of forced PTGIS expression on TGF-β1-induced activation of HSC-T6 cells. (A) The efficiency of PTGIS over-expression in HSC-T6 cells were detected by western blot and RT-qPCR analysis. ∗P < 0.05, ∗∗P < 0.01 vs. control group. (B) The PTGIS, COL1a1 and α-SMA protein and mRNA expression levels in TGF-β1-treated and pEX-2-PTGIS-transfected HSC-T6 cells were detected by western blot and RT-qPCR experiments. ∗P < 0.05 vs. control group, #P < 0.05 vs. TGF-β1 + pEX-2-control group. (C) The cell cycle were measured by flow cytometry analysis of pEX-2-PTGIS-transfected HSC-T6 cells, #p < 0.1 vs. TGF-β1 + pEX-2-control group. (D) The protein and mRNA levels of C-myc and Cyclin D1 were detected by western blot analysis, ∗P < 0.05 vs. control group, #P < 0.05 vs. TGF-β1 + pEX-2-control group. (E) The relative cell viability of HSC-T6 cells were measured by CCK8 analysis, ∗∗ P < 0.001 vs. control group, ###P < 0.001 vs. TGF-β1 + pEX-2-control group. (F) FACS analysis were used to examined apoptosis rate alteration in HSC-T6 cells from pEX-2-control and pEX-2-PTGIS group in TGF-β1 activated HSC-T6 cells, ###P < 0.001 vs. TGF-β1 + pEX-2-control group. (G) The apoptosis-associated proteins (Bax/Bcl2, cleaved-casepase3) were detected by western blot analysis, ##P < 0.01, ###P < 0.001 vs. pEX-2-control group in activated HSC-T6 cells.
PTGIS Silencing Enhanced HSC-T6 Cells Activation in Vitro
PTGIS-RNAi was used further to confirm the effect of PTGIS on the progress of HSC-T6 cells activation. Western Blot and RT-qPCR results indicated that PTGIS-RNAi could successfully silenced the expression of PTGIS (Figure 7A). As presented in Figure 7B, the expression of COL1a1 and α-SMA were significantly up-regulated in the protein and mRNA levels in the PTGIS-RNAi transfected group compared with scrambled-RNAi group in activated HSC-T6 cells. The results of flow cytometric analysis (FCM) showed that inhibited PTGIS expression could increase the percentage of G2/M in activated HSC-T6 cells (Figure 7C). As showed in Figure 7D, the protein levels of C-myc and CyclinD1 were significantly increased in PTGIS-RNAi group compared with Scrambled-RNAi group in TGF-β1-activated HSC-T6 cells. CCK8 assay suggested that the viability of HSC-T6 cells was significantly elevated PTGIS-RNAi group contrasted with scrambled-RNAi group (Figure 7E). Flow cytometric analysis revealed that lose-expression of PTGIS had no significant influcence on the apoptotic cell numbers in activated HSC-T6 cells (Figure 7F). Furthermore, losting PTGIS expression had no influence on the ratio of Bax/Bcl-2 and Cleaved-caspase3 expression (Figure 7G). The possible reasons for why PTGIS silencing has no effect on apoptosis may be is the expression of PTGIS was too little to influence the apoptosis process of activated HSC-T6 cells. Taken together, these data indicated that PTGIS silencing could enhance activation of HSC-T6 cells but have little influence on HSC-T6 cells activation.
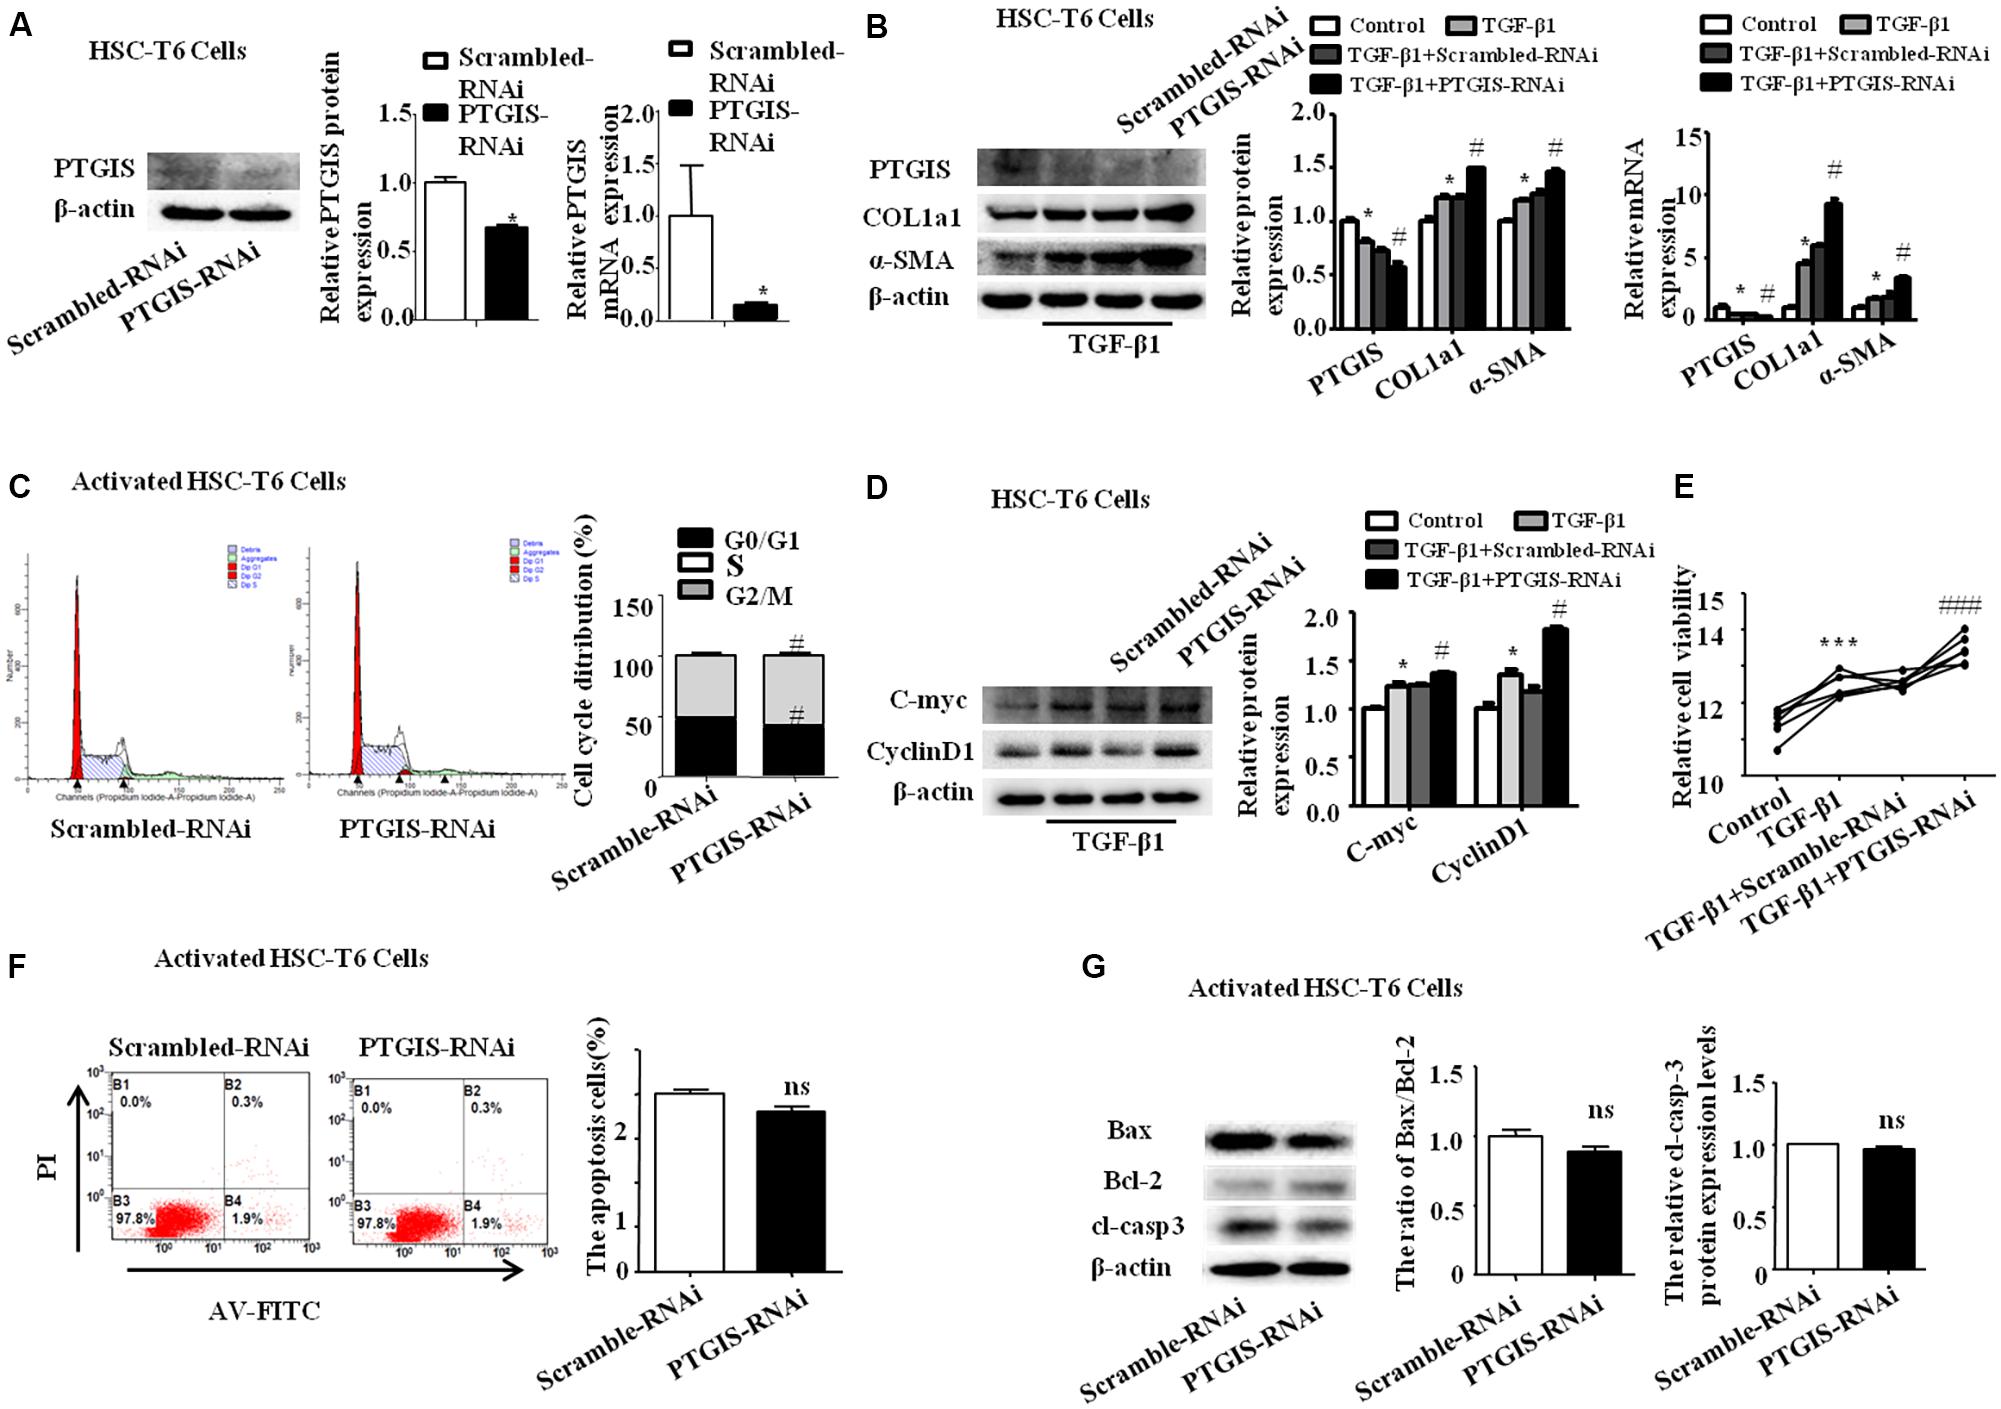
FIGURE 7. Influence of loss-expression of PTGIS in TGF-β1-treated HSC-T6 cells. (A) The efficiency of PTGIS lose-expression in HSC-T6 cells were detected by western blot and RT-qPCR. ∗p < 0.05 vs. control group. (B) The PTGIS, COL1a1 and α-SMA protein and mRNA expression levels in PTGIS-RNAi-transfected HSC-T6 cells were detected by western blot and RT-qPCR experiments. ∗P < 0.05 vs. control group, #P < 0.05 vs. TGF-β1 + Scrambled-RNAi group. (C) The cell cycle of PTGIS-RNAi transfected HSC-T6 cells, #P < 0.05 vs. TGF-β1 + Scrambled-RNAi transfected group in TGF-β1 activated HSC-T6 cells. (D) The protein and mRNA levels of Cmyc and Cyclin D1 were detected by western blot analysis, ∗P < 0.05 vs. control group, #p < 0.05 vs. Scrambled-RNAi transfected group in activated HSC-T6 cells. (E) The relative cell viability of HSC-T6 cells were measured by CCK8 analysis, ∗∗∗P < 0.001 vs. control group, ###p < 0.001 vs. TGF-β1 + Scrambled-RNAi transfected group. (F) FACS analysis were used to examined apoptosis rate alteration in HSC-T6 cells from Scrambled-RNAi transfected group and PTGIS-RNAi transfected group in TGF-β1 activated HSC-T6 cells, ###p < 0.001 vs. TGF-β1 + Scrambled-RNAi transfected group. (G) The apoptosis-associated proteins (Bax, Bcl2, cleaved-casepase3) were detected by western blot analysis, ##p < 0.01, ###p < 0.001 vs. Scrambled-RNAi transfected group in activated HSC-T6 cells.
Discussion
Liver fibrosis is a medical condition characterized by an extensive deposition of extracellular compounds. With extensive accumulation of ECM, liver fibrosis will ultimately developed into liver cirrosis and HCC, which requiring for liver transplant (Bataller and Brenner, 2005; Jiao et al., 2009; Troeger et al., 2012). Therefore, more and more studies paid attention to hepatic fibrosis not only there is no effective therapeutic strategy for liver fibrosis but also it will lead serious consequence. HSCs-derived myofibroblast is the principle source of ECM, which plays pivotal role in the pathogenesis of liver fibrosis (Hernandez-Gea and Friedman, 2011). For a long time, hepatic fibrosis was thought to be an irreparable pathological process because of the collapse of liver parenchyma and vascular architecture (Popper and Uenfriend, 1970). Nevertheless, increasingly clinical and experiment researchers have underlined that established liver fibrosis can be reversed if remove the etiological agents and promote the activated HSCs apoptosis (Ellis and Mann, 2012; Chen et al., 2016). Therefore, inhibiting HSCs activation and promoting activated HSCs apoptosis to blocking ECM deposition, finally remolding the distorted liver architecture will be the crucial therapeutic strategy for liver fibrosis. In our study, force- and gain-experiment of PTGIS in vivo and in vitro revealed a closely correlation between PTGIS and HSCs activation as measured by the expression of α-SMA and COL1a1.
Epigenetic modification plays a pivotal role in many physiological and pathological process, including tumor genesis and fibrogenesis (Bian et al., 2014, 2017; Wu et al., 2017). The genomic methylation screening results shows that PTGIS promoter was hypermethylated in fibrotic mice. In our study, we demonstrated that DNMTs protein levels were elevated in mice induced with CCl4 and HSC-T6 cells treated with TGF-β1. And decreased PTGIS expression can be restores by DNMT-RNAi and 5-azadC. The results of MSP confirmed that PTGIS was hypermethylated in HSC-T6 cells cultured with TGF-β1 (10 ng/mL). The ChIP assay indicated that the methylation of PTGIS was mainly attributed to DNMT1 and DNMT3b. Taken together, these data indicated that downregulation of PTGIS in hepatic fibrosis was attributed to hypermethylation of PTGIS promoter which mainly induced by DNMT1 and DNMT3b.
Forced PTGIS expression in vivo through tail vein injection rAAV8-PTGIS can alleviate liver fibrosis, which was certified by the decreased COL1a1 and α-SMA protein and mRNA expression levels in primary HSCs isolated from fibrotic mice and the downregulated serum ALT/AST levels. Moreover, the functional studies revealed that forced-expression of PTGIS mediated by pEX2-PTGIS plasmid in vitro can inhibit HSC-T6 cells activation and promote activated HSC-T6 cells apoptosis. However, loss-expression of PTGIS can promote HSC-T6 cells activation and ECM accumulation. The elevated apoptosis-related protein in forced PTGIS expression group in vivo and in vitro verified that PTGIS induced activated HSCs apoptosis. This verdict was further attested by FCM results in vitro in pEX2-PTGIS transfected group. The major mechanism contributed to PTGIS exerts its function in hepatic fibrogenesis was showed in Figure 8.
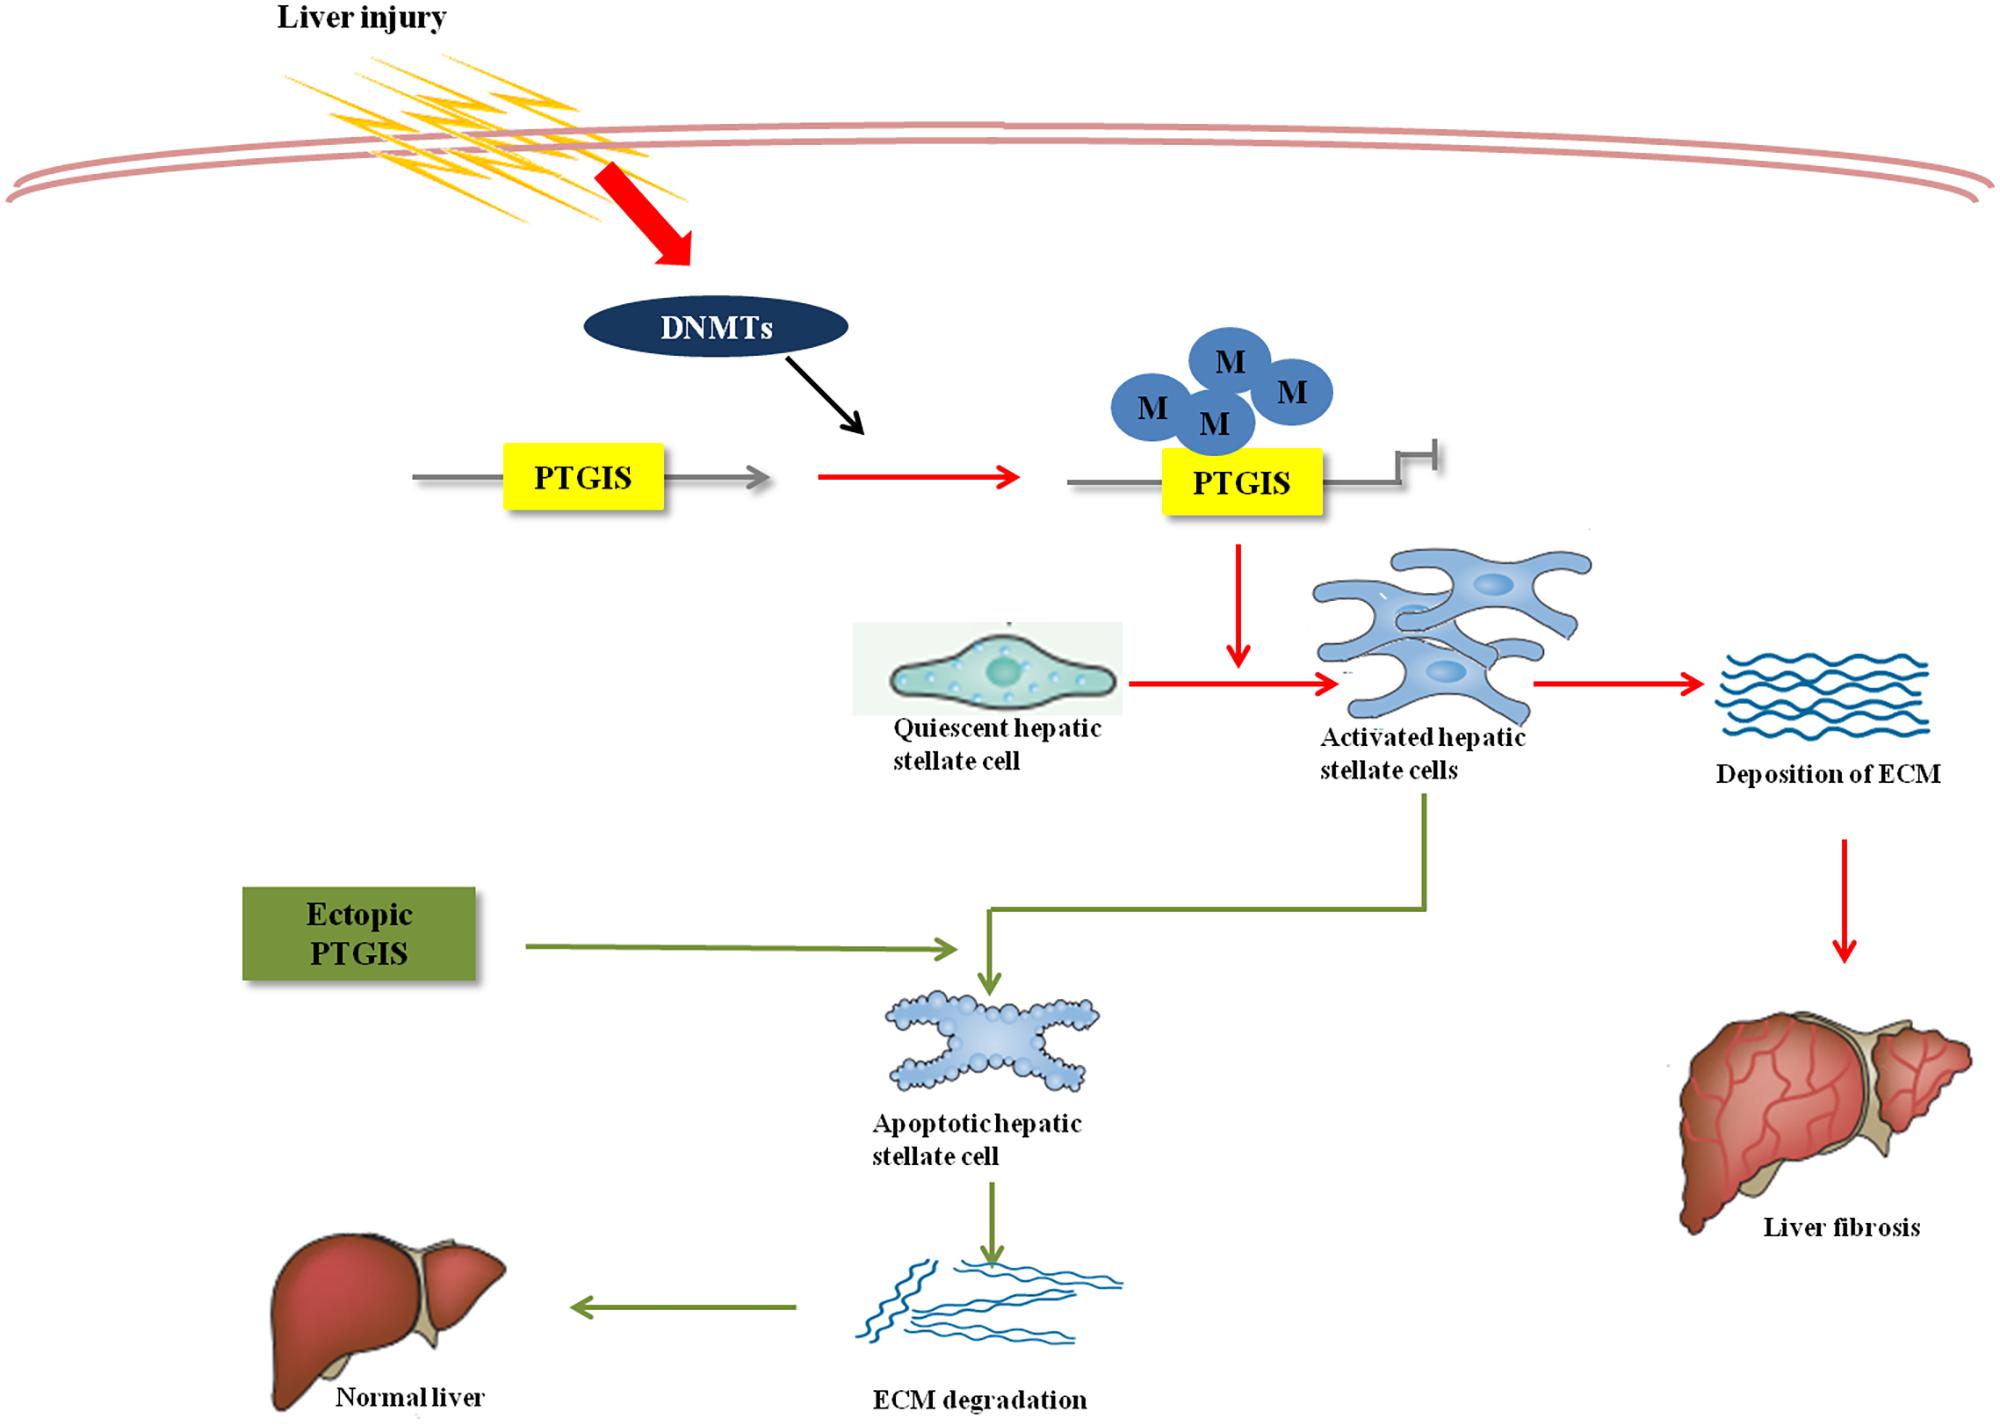
FIGURE 8. Overview of PTGIS in liver fibrosis. The major mechanism contributed to PTGIS exerts its function in hepatic fibrogenesis. DNA methyltransferases led to predominant inhibition of PTGIS expression. Ectopic expression of PTGIS alleviate liver fibrosis by promoting activated hepatic stellate cells apoptosis and then reverse the progress of liver fibrosis.
It is interesting to note that PTGIS was elevated in the early-liver-fibrotic stage and down-regulated in the later period of model establishment process in the process of fibrotic mice model establishment. It has been demonstrated that PTGIS was hypermethylated in colorectal cancer and misregulation of PTGIS leads to the accumulation of pro-inflammatory signals (Cebola et al., 2015). Furthermore, most type of liver insult damage epithelial cells, which leads to the release of inflammatory cytokines such as TGF-β1, TNF, IL-6 and IL-1β (Pellicoro et al., 2014). Then HSCs activated by TGF-β1. Therefore, we hypothesized that the elevated PTGIS expression in the early-liver-fibrotic stage may attribute to its positive feedback to inflammation response.
Conclusion
Our experiment results suggested that DNA methylation of PTGIS plays a pivotal role in the progression of liver fibrosis and HSCs activation. Forced PTGIS expression in vivo and in vitro can offset CCl4 or TGF-β-induced activation of HSCs, and even provoke cells apoptosis. However, PTGIS silencing facilitate the activation of HSCs and ECM deposition. These results indicated a latent therapeutic capacity of PTGIS for treatment of liver fibrosis. As far as we know, this is the first investigation about PTGIS hypermethylation in progression of liver fibrosis in vivo and in vitro. This study suggests a therapeutic role of PTGIS in liver fibrosis and encourages further studies to determine the value of PTGIS as a novel biomarker in hepatic fibrosis.
Despite the fact that HSCs play a pivotal role in liver fibrosis, HC is the domain cell type residing in the liver and HCs apoptosis and impaired HCs proliferation also have been commonly recognized as critical inhibitors of fibrosis. Persistence of chronic inflammation response always resulted in hepatic fibrosis (Friedman, 2008b; Sacchi et al., 2015; Zhang et al., 2017), and kupffer cells plays important role in trigger the process of hepatic fibrosis. It has been reported that PGI2, the product of PTGIS, promotes colorectal cancer growth probably by activating PPARδ (Gupta et al., 2000) and inhibition of COX-2-derived PGI2 induces colon cancer cells apoptosis (Wu and Liou, 2009). Additionally, it also reported that PGI2 regulates the transcription of VEGF by PPARδ (Mizukami et al., 2004; Arany et al., 2008) and VEGF expression is augment by hypoxia-induced PTGIS in human fibroblast (Wang et al., 2013). We detected the expression of PTGIS protein in primary hepatocytes and primary macrophages isolated from mice treated with CCl4 (Supplementary Figures 3A,B). The results of Western blot showed that PTGIS protein expression was significantly down-regulated in primary macrophages. In general, it is worth doing further studies to explore whether PTGIS have effect on HCs apoptosis and kupffer cells activation and the underlying molecular mechanism in the progress of liver fibrosis.
Author Contributions
X-yP performed the experiments, analyzed the data, and drafted the paper. YY, H-dL and XC helped to design the study and helped to draft the paper. H-mH helped to analyze the data. H-wM helped to perform western blot analysis. F-tB, H-xY, and QW helped to isolate primary HSCs. CH and X-mM participated in the design of the study. JL conceived the study and revised the manuscript.
Funding
This study was supported by the National Natural Science Foundation of China (No. 81473268) and Anhui University of Science and Technology (No. 1704a0802161).
Conflict of Interest Statement
The authors declare that the research was conducted in the absence of any commercial or financial relationships that could be construed as a potential conflict of interest.
Supplementary Material
The Supplementary Material for this article can be found online at: https://www.frontiersin.org/articles/10.3389/fphar.2018.00553/full#supplementary-material
Abbreviations
5-azadC, 5-aza-2-deoxycytidine; ALT, alanine aminotransferase; AST, aspartate aminotransferase; BCA, bicinchoninic acid; BSA, bovine serum albumin; ChIP, Chromatin immunoprecipitation; DMEM, Dulbecco’s Modified Eagle’s Medium; DNMTs, DNA methyltransferase; ECM, extracellular matrix; FBS, Fetal bovine serum; H&E, hematoxylin and eosin; HC, hepatocyte; HCC, hepatic carcinoma; HIF, human intestinal fibroblasts; HSCs, hepatic stellate cells; IL-1β, interleukin-1β; IL-6, interleukin-6; MSP, methylation-specific PCR; PGH2, prostaglandin H2; PGI2, prostaglandin I2; PPARδ, peroxisome proliferator-activator δ; PTGIS, prostacyclin synthase; PVDF, polyvinylidene fluoride; rAAV, Recombinant adeno-associated viral vectors; RT-qPCR, reverse transcription polymerase chain reaction; SDS-PAGE, sodium salt-polyacrylamide gel electrophoresis; TBST, tris buffered saline with tween-20; TGF-ββ1, Transforming growth factor-β1; TNF, tumor necrosis factor; VEGF, vascular endothelial growth factor.
References
Anestopoulos, I., Voulgaridou, G. P., Georgakilas, A. G., Franco, R., Pappa, A., and Panayiotidis, M. I. (2015). Epigenetic therapy as a novel approach in hepatocellular carcinoma. Pharmacol. Ther. 145, 103–119. doi: 10.1016/j.pharmthera.2014.09.005
Arany, Z., Foo, S. Y., Ma, Y., Ruas, J. L., Bommi-Reddy, A., Girnun, G., et al. (2008). HIF-independent regulation of VEGF and angiogenesis by the transcriptional coactivator PGC-1 alpha. Nature 451, 1008–1012. doi: 10.1038/nature06613
Bataller, R., and Brenner, D. A. (2005). Liver fibrosis. J. Clin. Invest. 115, 209–218. doi: 10.1172/JCI24282
Bian, E. B., Huang, C., Wang, H., Chen, X. X., Zhang, L., Lv, X. W., et al. (2014). Repression of Smad7 mediated by DNMT1 determines hepatic stellate cell activation and liver fibrosis in rats. Toxicol. Lett. 224, 175–185. doi: 10.1016/j.toxlet.2013.10.038
Bian, E. B., Wang, Y. Y., Yang, Y., Wu, B. M., Xu, T., Meng, X. M., et al. (2017). Hotair facilitates hepatic stellate cells activation and fibrogenesis in the liver. Biochim. Biophys. Acta 1863, 674–686. doi: 10.1016/j.bbadis.2016.12.009
Cai, S. P., Cheng, X. Y., Chen, P. J., Pan, X. Y., Xu, T., Huang, C., et al. (2016). Transmembrane protein 88 attenuates liver fibrosis by promoting apoptosis and reversion of activated hepatic stellate cells. Mol. Immunol. 80, 58–67. doi: 10.1016/j.molimm.2016.11.002
Cebola, I., Custodio, J., Munoz, M., Diez-Villanueva, A., Pare, L., Prieto, P., et al. (2015). Epigenetics override pro-inflammatory PTGS transcriptomic signature towards selective hyperactivation of PGE2 in colorectal cancer. Clin. Epigenet. 7:74. doi: 10.1186/s13148-015-0110-4
Chen, P. J., Cai, S. P., Yang, Y., Li, W. X., Huang, C., Meng, X. M., et al. (2016). PTP1B confers liver fibrosis by regulating the activation of hepatic stellate cells. Toxicol. Appl. Pharmacol. 292, 8–18. doi: 10.1016/j.taap.2015.12.021
Cho, S. A., Rohn-Glowacki, K. J., Jarrar, Y. B., Yi, M., Kim, W. Y., Shin, J. G., et al. (2015). Analysis of genetic polymorphism and biochemical characterization of a functionally decreased variant in prostacyclin synthase gene (CYP8A1) in humans. Arch. Biochem. Biophys. 569, 10–18. doi: 10.1016/j.abb.2015.01.012
Ellis, E. L., and Mann, D. A. (2012). Clinical evidence for the regression of liver fibrosis. J. Hepatol. 56, 1171–1180. doi: 10.1016/j.jhep.2011.09.024
Friedman, S. L. (2008a). Hepatic stellate cells: protean, multifunctional, and enigmatic cells of the liver. Physiol. Rev. 88, 125–172. doi: 10.1152/physrev.00013.2007
Friedman, S. L. (2008b). Mechanisms of hepatic fibrogenesis. Gastroenterology 134, 1655–1669. doi: 10.1053/j.gastro.2008.03.003
Frigola, J., Munoz, M., Clark, S. J., Moreno, V., Capella, G., and Peinado, M. A. (2005). Hypermethylation of the prostacyclin synthase (PTGIS) promoter is a frequent event in colorectal cancer and associated with aneuploidy. Oncogene 24, 7320–7326. doi: 10.1038/sj.onc.1208883
Gao, G. P., Alvira, M. R., Wang, L., Calcedo, R., Johnston, J., and Wilson, J. M. (2002). Novel adeno-associated viruses from rhesus monkeys as vectors for human gene therapy. Proc. Natl. Acad. Sci. U.S.A. 99, 11854–11859. doi: 10.1073/pnas.182412299
Gupta, R. A., Tan, J., Krause, W. F., Geraci, M. W., Willson, T. M., Dey, S. K., et al. (2000). Prostacyclin-mediated activation of peroxisome proliferator-activated receptor delta in colorectal cancer. Proc. Natl. Acad. Sci. U.S.A. 97, 13275–13280. doi: 10.1073/pnas.97.24.13275
Hatae, T., Wada, M., Yokoyama, C., Shimonishi, M., and Tanabe, T. (2001). Prostacyclin-dependent apoptosis mediated by PPAR delta. J. Biol. Chem. 276, 46260–46267. doi: 10.1074/jbc.M107180200
Hellerbrand, C., Stefanovic, B., Giordano, F., Burchardt, E. R., and Brenner, D. A. (1999). The role of TGFbeta1 in initiating hepatic stellate cell activation in vivo. J. Hepatol. 30, 77–87. doi: 10.1016/S0168-8278(99)80010-5
Hernandez-Gea, V., and Friedman, S. L. (2011). Pathogenesis of liver fibrosis. Annu. Rev. Pathol. 6, 425–456. doi: 10.1146/annurev-pathol-011110-130246
Jiao, J., Friedman, S. L., and Aloman, C. (2009). Hepatic fibrosis. Curr. Opin. Gastroenterol. 25, 223–229. doi: 10.1097/MOG.0b013e3283279668
Keith, R. L., Miller, Y. E., Hoshikawa, Y., Moore, M. D., Gesell, T. L., Gao, B., et al. (2002). Manipulation of pulmonary prostacyclin synthase expression prevents murine lung cancer. Cancer Res. 62, 734–740.
Keith, R. L., Miller, Y. E., Hudish, T. M., Girod, C. E., Sotto-Santiago, S., Franklin, W. A., et al. (2004). Pulmonary prostacyclin synthase overexpression chemoprevents tobacco smoke lung carcinogenesis in mice. Cancer Res. 64, 5897–5904. doi: 10.1158/0008-5472.CAN-04-1070
Mallat, A., and Lotersztajn, S. (2013). Cellular mechanisms of tissue fibrosis. 5. Novel insights into liver fibrosis. Am. J. Physiol. Cell Physiol. 305, C789–C799. doi: 10.1152/ajpcell.00230.2013
McCarty, D. M. (2008). Self-complementary AAV vectors; advances and applications. Mol. Ther. J. Am. Soc. Gene Ther. 16, 1648–1656. doi: 10.1038/mt.2008.171
McCarty, D. M., Fu, H., Monahan, P. E., Toulson, C. E., Naik, P., and Samulski, R. J. (2003). Adeno-associated virus terminal repeat (TR) mutant generates self-complementary vectors to overcome the rate-limiting step to transduction in vivo. Gene Ther. 10, 2112–2118. doi: 10.1038/sj.gt.3302134
Mizukami, Y., Li, J., Zhang, X., Zimmer, M. A., Iliopoulos, O., and Chung, D. C. (2004). Hypoxia-inducible factor-1-independent regulation of vascular endothelial growth factor by hypoxia in colon cancer. Cancer Res. 64, 1765–1772. doi: 10.1158/0008-5472.CAN-03-3017
Moreira, R. K. (2007). Hepatic stellate cells and liver fibrosis. Arch. Pathol. Lab. Med. 131, 1728–1734.
Paz, M. F., Wei, S., Cigudosa, J. C., Rodriguez-Perales, S., Peinado, M. A., Huang, T. H., et al. (2003). Genetic unmasking of epigenetically silenced tumor suppressor genes in colon cancer cells deficient in DNA methyltransferases. Hum. Mol. Genet. 12, 2209–2219. doi: 10.1093/hmg/ddg226
Pellicoro, A., Ramachandran, P., Iredale, J. P., and Fallowfield, J. A. (2014). Liver fibrosis and repair: immune regulation of wound healing in a solid organ. Nat. Rev. Immunol. 14, 181–194. doi: 10.1038/nri3623
Phillips, R. J., Fortier, M. A., and Lopez Bernal, A. (2014). Prostaglandin pathway gene expression in human placenta, amnion and choriodecidua is differentially affected by preterm and term labour and by uterine inflammation. BMC Pregnancy Childbirth 14:241. doi: 10.1186/1471-2393-14-241
Popper, H., and Uenfriend, S. (1970). Hepatic fibrosis. Correlation of biochemical and morphologic investigations. Am. J. Med. 49, 707–721. doi: 10.1016/S0002-9343(70)80135-8
Pradono, P., Tazawa, R., Maemondo, M., Tanaka, M., Usui, K., Saijo, Y., et al. (2002). Gene transfer of thromboxane A(2) synthase and prostaglandin I(2) synthase antithetically altered tumor angiogenesis and tumor growth. Cancer Res. 62, 63–66.
Rippe, R. A., and Brenner, D. A. (2004). From quiescence to activation: gene regulation in hepatic stellate cells. Gastroenterology 127, 1260–1262. doi: 10.1053/j.gastro.2004.08.028
Sacchi, P., Cima, S., Zuccaro, V., Columpsi, P., Sarda, C., Mariani, M., et al. (2015). Understanding the mechanisms of fibrogenesis in HIV/HCV-coinfected patients: implications for clinical practice. AIDS Rev. 17, 159–170.
Sadler, T., Bhasin, J. M., Xu, Y., Barnholz-Sloan, J., Chen, Y., Ting, A. H., et al. (2016). Genome-wide analysis of DNA methylation and gene expression defines molecular characteristics of Crohn’s disease-associated fibrosis. Clin. Epigenetics 8:30. doi: 10.1186/s13148-016-0193-6
Senoo, H., Imai, K., Matano, Y., and Sato, M. (1998). Molecular mechanisms in the reversible regulation of morphology, proliferation and collagen metabolism in hepatic stellate cells by the three-dimensional structure of the extracellular matrix. J. Gastroenterol. Hepatol. 13(Suppl.), S19–S32. Epub 1998/10/29. PubMed PMID: 9792031 doi: 10.1111/jgh.1998.13.s1.19
Subramaniam, D., Thombre, R., Dhar, A., and Anant, S. (2014). DNA methyltransferases: a novel target for prevention and therapy. Front. Oncol. 4:80. doi: 10.3389/fonc.2014.00080
Trautwein, C., Friedman, S. L., Schuppan, D., and Pinzani, M. (2015). Hepatic fibrosis: concept to treatment. J. Hepatol. 62(Suppl. 1), S15–S24. doi: 10.1016/j.jhep.2015.02.039
Troeger, J. S., Mederacke, I., Gwak, G. Y., Dapito, D. H., Mu, X., Hsu, C. C., et al. (2012). Deactivation of hepatic stellate cells during liver fibrosis resolution in mice. Gastroenterology 143, 1073–1083.e22. doi: 10.1053/j.gastro.2012.06.036
Tuder, R. M., Cool, C. D., Geraci, M. W., Wang, J., Abman, S. H., Wright, L., et al. (1999). Prostacyclin synthase expression is decreased in lungs from patients with severe pulmonary hypertension. Am. J. Respir. Crit. Care Med. 159, 1925–1932. doi: 10.1164/ajrccm.159.6.9804054
Wang, J., Ikeda, R., Che, X. F., Ooyama, A., Yamamoto, M., Furukawa, T., et al. (2013). VEGF expression is augmented by hypoxia-induced PGIS in human fibroblasts. Int. J. Oncol. 43, 746–754. doi: 10.3892/ijo.2013.1994
Wang, Z., Ma, H. I., Li, J., Sun, L., Zhang, J., and Xiao, X. (2003). Rapid and highly efficient transduction by double-stranded adeno-associated virus vectors in vitro and in vivo. Gene Ther. 10, 2105–2111. doi: 10.1038/sj.gt.3302133
Wu, K. K., and Liou, J. Y. (2009). Cyclooxygenase inhibitors induce colon cancer cell apoptosis Via PPARdelta – > 14-3-3epsilon pathway. Methods Mol. Biol. 512, 295–307. doi: 10.1007/978-1-60327-530-9_16
Wu, Y., Bu, F., Yu, H., Li, W., Huang, C., Meng, X., et al. (2017). Methylation of Septin9 mediated by DNMT3a enhances hepatic stellate cells activation and liver fibrogenesis. Toxicol. Appl. Pharmacol. 315, 35–49. doi: 10.1016/j.taap.2016.12.002
Yokoyama, C., Yabuki, T., Inoue, H., Tone, Y., Hara, S., Hatae, T., et al. (1996). Human gene encoding prostacyclin synthase (PTGIS): genomic organization, chromosomal localization, and promoter activity. Genomics 36, 296–304. doi: 10.1006/geno.1996.0465
Keywords: DNA methylation, gene expression, proliferation, apoptosis, hepatic stellate cells, PTGIS
Citation: Pan X-y, Yang Y, Meng H-w, Li H-d, Chen X, Huang H-m, Bu F-t, Yu H-x, Wang Q, Huang C, Meng X-m and Li J (2018) DNA Methylation of PTGIS Enhances Hepatic Stellate Cells Activation and Liver Fibrogenesis. Front. Pharmacol. 9:553. doi: 10.3389/fphar.2018.00553
Received: 08 March 2018; Accepted: 08 May 2018;
Published: 28 May 2018.
Edited by:
Barbara Romano, University of Naples Federico II, ItalyReviewed by:
Guoxun Chen, The University of Tennessee, Knoxville, United StatesXufeng Tao’, Dalian Medical University, China
Copyright © 2018 Pan, Yang, Meng, Li, Chen, Huang, Bu, Yu, Wang, Huang, Meng and Li. This is an open-access article distributed under the terms of the Creative Commons Attribution License (CC BY). The use, distribution or reproduction in other forums is permitted, provided the original author(s) and the copyright owner are credited and that the original publication in this journal is cited, in accordance with accepted academic practice. No use, distribution or reproduction is permitted which does not comply with these terms.
*Correspondence: Jun Li, bGpAYWhtdS5lZHUuY24=; MTkwODAwNzQ4MkBxcS5jb20=