 Shuhao Zhang1†
 Shyamal Goswami2†
 Jiaqiang Ma2†Lu Meng2Youping Wang2Fangming Zhu2Dandan Zhang3
 Shan Zheng1
 Rui Dong1Xianmin Xiao1
 Xiaoming Zhang2*
 Gong Chen1*
- 1Department of Pediatric Surgery, Children's Hospital of Fudan University, Shanghai, China
- 2Key Laboratory of Molecular Virology and Immunology, Institut Pasteur of Shanghai, Chinese Academy of Sciences, Shanghai, China
- 3MOE Key Laboratory of Metabolism and Molecular Medicine, Department of Biochemistry and Molecular Biology, School of Basic Medical Sciences, Fudan University, Shanghai, China
Biliary atresia (BA) is a destructive pediatric liver disease and CD4+T cell activation is demonstrated to play an important role in BA. However, a comprehensive scenario regarding the involvement of CD4+T cell subsets to the development of BA remains unclear. Here, we aim to explore the infiltration of CD4+T cell subsets and their clinical significance in BA. In the present study, thirty BA liver samples were collected during surgery and were divided into good (BA1, n = 16) and poor prognosis (BA2, n = 14), with samples from choledochal cyst patients (n = 8) as control. By using multiplex immunohistochemistry, we evaluated the infiltration level of CD4+T cell subsets in the portal areas. RT-qPCR and flow cytometry were further applied to explore detailed features of Treg subsets. We revealed that hepatic infiltrating Th1, Th2, Th17, and ICOS+Treg cells were significantly increased in BA patients compared to controls and were negatively associated with prognosis, while high infiltrating ICOS−Tregs showed a favorable outcome. Phenotypic analysis indicated that, in contrast to ICOS+Tregs, ICOS−Tregs were mainly CD45RAhiCD45ROlow, and preferentially expressed more CD73. Besides, RT-qPCR revealed elevated expression of CD25, CD73, TGF-β, and BCL-2 genes in ICOS−Tregs. Finally, functional assay confirmed that ICOS−Tregs had a higher suppressive capacity to cytokine secretion and were more resistant to apoptosis in vitro. Collectively, we demonstrate that a mixed immune response is involved in BA pathogenesis, and the globally enhanced effector CD4+T cell response is associated with unfavorable prognosis, highly suppressive ICOS−Tregs is a protective factor and may serve an important reference to predict prognosis.
Introduction
Biliary atresia (BA) is a childhood disease characterized by fibroinflammatory obstruction of the extrahepatic and intrahepatic bile ducts. BA development is always associated with persistent and progressive inflammatory response resulting in progressive jaundice and rapid fibrosis (1). During inflammation, the portal area is infiltrated with characteristic inflammatory cells, consisting of CD4+T cells, CD8+T cells, and Kupffer cells (2–4). Dendritic cells (5) and natural killer cells (6) could injure the biliary epithelium, and T cells further induce bile duct obstruction, liver fibrosis, and cirrhosis by excessive production of cytokines such as IFN-γ, IL-6, and IL-17. However, the exact role of T cells in pathogenesis of BA remains obscure.
Effector T cells induced autoimmune attack is one of the important causes of bile duct injury. While, the immunosuppressive regulatory T (Tregs) cells have been shown to exhibit a protective role in BA (7, 8). Tregs are not a homogenous population, but can be divided into two subsets based on ICOS expression. ICOS+Tregs preferentially secrete high amounts of IL-10 and moderate levels of TGF-β1, while ICOS−Tregs exert a suppressive function primarily through secreting TGF-β1 (9). Therefore, the two Treg subsets with different functions can play opposite roles in some diseases, such as hepatocellular carcinoma (10) and melanoma (11). The functionality and co-existence of these two Treg subsets in BA is still unknown.
Previous studies mainly focused on single immune cell type in BA, while a comprehensive picture of the major CD4+T cell subsets is lacking. In addition, most of previous reports had neglected the in-situ contextual link between immune cell type infiltration and disease outcome. With the aid of our recently-developed multiplex immunohistochemistry (mIHC) technique, we could further explore the link between the infiltration of these CD4+T cell subsets (Th1, Th2, Th17, and Tregs) in the liver tissues and disease outcomes in BA patients. Furthermore, extended investigations with flow cytometry and functional assays were also performed to study the ICOS+ and ICOS−Tregs.
Materials and Methods
Patients
Patients for Immunohistochemistry
The histopathological liver sections of 30 BA patients who underwent Kasai portoenterostomy (KPE) at Children's Hospital of Fudan University (Shanghai, China) were collected within the period of February 2015 to March 2017. Postoperative serum aspartate aminotransferase (AST), alanine aminotransferase (ALT), direct bilirubin (DB), total bilirubin (TB) levels are reliable indexes for predicting the prognosis of BA patients (12–15). Thus, patients were divided into two groups based on these indexes 6 months after surgery. Clinicopathologic features of the 30 patients were provided in Table 1. Poor prognosis (BA2 group, n = 14) was defined as the serum TB level more than 17.1 μmol/L, serum DB level more than 6.8 μmol/L and the liver enzymes were abnormal (ALT > 50 U/L, AST > 50 U/L). The rest of the patients were good prognosis (BA1 group, n = 16). Eight liver sections from choledochal cysts were considered as healthy control (clinicopathologic features were summarized in Table 1).
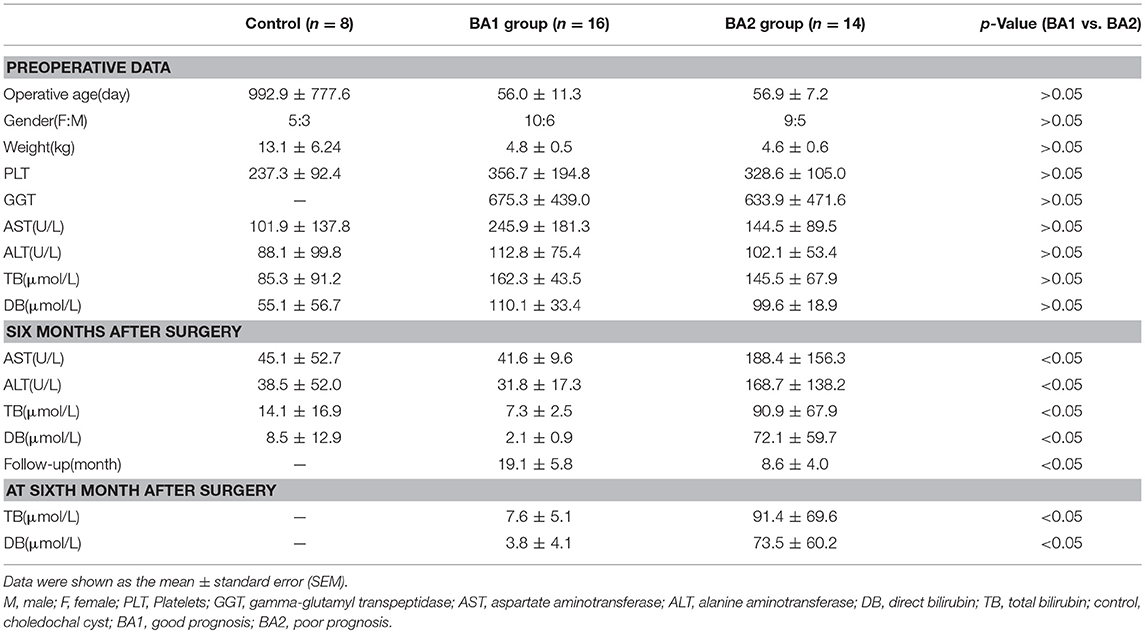
Table 1. Demographic and laboratory data of BA patients and control patients.
Patients for Flow Cytometry and Functional Assays
Peripheral blood samples and freshly resected liver tissues from 24 BA patients were harvested during KPE at Children's Hospital of Fudan University (Shanghai, China) in June 2017. Five of them were used to detect the ICOS expression on Tregs; five of them were used for phenotypic analysis; four of them were used for RNA isolation; four of them were used for apoptosis experiment; six of them were used for coculture experiment. Peripheral blood samples from 10 patients, including brachial plexus injury (n = 4) and accessory ear (n = 6) were included as the control.
Multiplex Immunohistochemistry
Multispectral imaging was performed as described in the supplementary section of Feng et al. (16) with appropriate optimization. The liver sections were deparaffinized in three changes of xylene and two changes of 100% ethanol and subsequent gradation of 95, 80, and 70% alcohol for 3 min each. After being heat-induced epitope retrieval with a preheated epitope retrieval solution (pH 8.0, Enzo Life Sciences, Inc. USA), endogenous peroxidase was inactivated by incubation in 3% H2O2 for 20 min. Next, the sections were pre-incubated with 10% normal goat serum and then incubated overnight with primary antibodies: CD4, Foxp3, T-bet, GATA3, ICOS, and ROR-γt (details in Table S1). The next day, sections were incubated with the HRP-conjugated second antibody (Vector) for 20 min at room temperature. After washing, polymer tagged HRP mediate the covalent binding of a different fluorophore (Opal-520, Opal-570, Opal-620, Opal-650, and Opal-690) sequentially, coupled with tyramide signal amplification (TSA) step as specified by the manufacturer (Perkin Elmer Inc.). At last, sections were counterstained with DAPI (Sigma-Aldrich). Slides were imaged using the PerkinElmer Vectra platform and a 0.3345 mm2 area containing at least one portal area was analyzed in batches using PerkinElmer inForm® software and cell quantification of positively stained cells was analyzed by R script.
Flow Cytometry and Apoptosis Assay
Peripheral Blood Mononuclear Cells (PBMCs) were isolated by Ficoll density gradient (Amersham, Uppsala, Sweden). Then single cell suspensions were stained with fluorochrome-conjugated antibodies against CD4, CD25, CD127, ICOS, CD39, CD73, CD45RO, CD45RA, and PE-mouse Isotype (details in Table S2) to identify the phenotypes of Treg subsets. Gating on Tregs was same as the sorting gates (Figure S1). Data were acquired by BD LSRFortessa. APC-Annexin-V (Cat:640941 Biolegend) and PI (Sigma) were used to assess cell apoptosis.
Isolation of CD3+CD25−T Cells, ICOS+Tregs and ICOS−Tregs
PBMCs were acquired as above. Then PBMCs were incubated with CD3 biotin (Biolegend, Clone. OKT3) and anti-biotin beads (Miltenyi Biotec) to acquire the CD3+T cells by positive selection. CD3+T cells were divided into two parts. One part was stained with PB-anti-SAV and CD25 to isolate CD3+CD25−T cells with BD FACSMelody. Another part was stained with CD4, CD25, CD127, and ICOS to isolate ICOS+Tregs and ICOS−Tregs. Sorting gates were shown in Figure S1.
RNA Isolation and Quantitative RT-PCR
Total cellular RNA was extracted from ICOS+Tregs and ICOS−Tregs of BA patients' peripheral blood with TRIzol reagent (Invitrogen, cat. 15596026/15596018) and subjected to reverse transcription with PrimeScript RT reagent Kit (Takara, cat. RR037A) according to the manufacturers' instructions. The expressions of ICOS, CD25, CD39, CD73, TGF-β, and BCL-2 were analyzed via RT-qPCR with a SYBR Premix EX Taq (Tli RNaseH plus, Takara, cat. RR420A) with primers listed in Table S3. For analysis, expression levels of the genes were normalized to the values of beta-actin. Analysis of relative gene expression data using real-time quantitative PCR was calculated with the 2-ΔΔCt method (17).
Co-culture Experiment of Sorted CD3+CD25−T Cells and Treg Subsets
CD3+CD25−T cells were cultured alone or with ICOS+Tregs and ICOS−Tregs, respectively, in 96-well round-bottom plates in RPMI 1640 complete medium in the presence of 10 ng/ml human IL-2 and 0.5 μM 5′-AMP (Sigma-Aldrich) for 3 days at 37°C. Dynabeads Human T-Activator CD3/CD28 (ThermoFisher, Cat. 111.31D) was used to stimulate T cells and added at a ratio of 1:5 (beads: T responder). Treg subsets were added at a ratio of 1:2 (Treg subset: T responder). After 3 days, cells were restimulated with 50 ng/mL PMA and 1 μg/mL Ionomycin in the presence of GolgiPlug for 5 h. Dead cells were removed by the Live/Dead dye Zombie Yellow (Biolegend). Then, cells were stained with anti-CD4, CD8, IFN-γ, IL2, and TNFα antibodies (details in Table S2). Data were acquired by BD LSRFortessa.
Statistical Analysis
Data were shown as the medians ± IQRs or mean ± standard error (SEM) depending on data characteristics. Statistical analysis was performed with SPSS18.0 and Graphpad Prism 6. Statistical p-values were analyzed by a two-tailed Student's t-test. Correlation analyses were performed using Spearman's test. Survival curves were drawn by Kaplan–Meier univariate estimates and performed using classification as “low” or “high” according to the Youden index. Multivariate analysis was performed by Cox regression analysis. p-values < 0.05 were considered statistically significant.
Results
Increased Infiltration of Th1, Th2, and Th17 Cells in the Portal Area of Livers From BA Patients
CD4+ Th subsets had been implicated as important immune cells correlate to the pathogenesis of BA. As expected, Th subset markers CD4, T-bet, GATA-3, and ROR-γt could be detected in the portal areas of BA livers (Figures S2A–D) and a more concrete picture of the infiltrated Th1 (CD4+T-bet+), Th2 (CD4+GATA-3+), and Th17 (CD4+ROR-γt+) in situ were shown in Figures S3A–C and Figures 1A,B. The density of CD4+T cells in the portal area of BA2 group was significantly higher than BA1 and control groups (p < 0.05; Figure 1C and Table 2). When going to the subset level, both BA1 and BA2 groups had higher densities of Th1, Th2, and Th17 cells than the control group. In addition, BA2 group displayed a higher density of Th1 and Th17 cells than BA1 group. We also compared the cell percentages and the results indicated that Th1, Th2, and Th17 percentages from BA2 group all significantly higher than BA1 and control groups (p < 0.05; Figure 1C and Table 2). Collectively, the portal area of BA liver was enriched with Th1, Th2, and Th17 cells and the infiltration levels were further increased in BA2 group, suggesting that an enhanced inflammation was linked to the deterioration of BA (density unit: cells/0.3345 mm2; percentage: cells/CD4; Treg percentage: Treg subset/Treg).
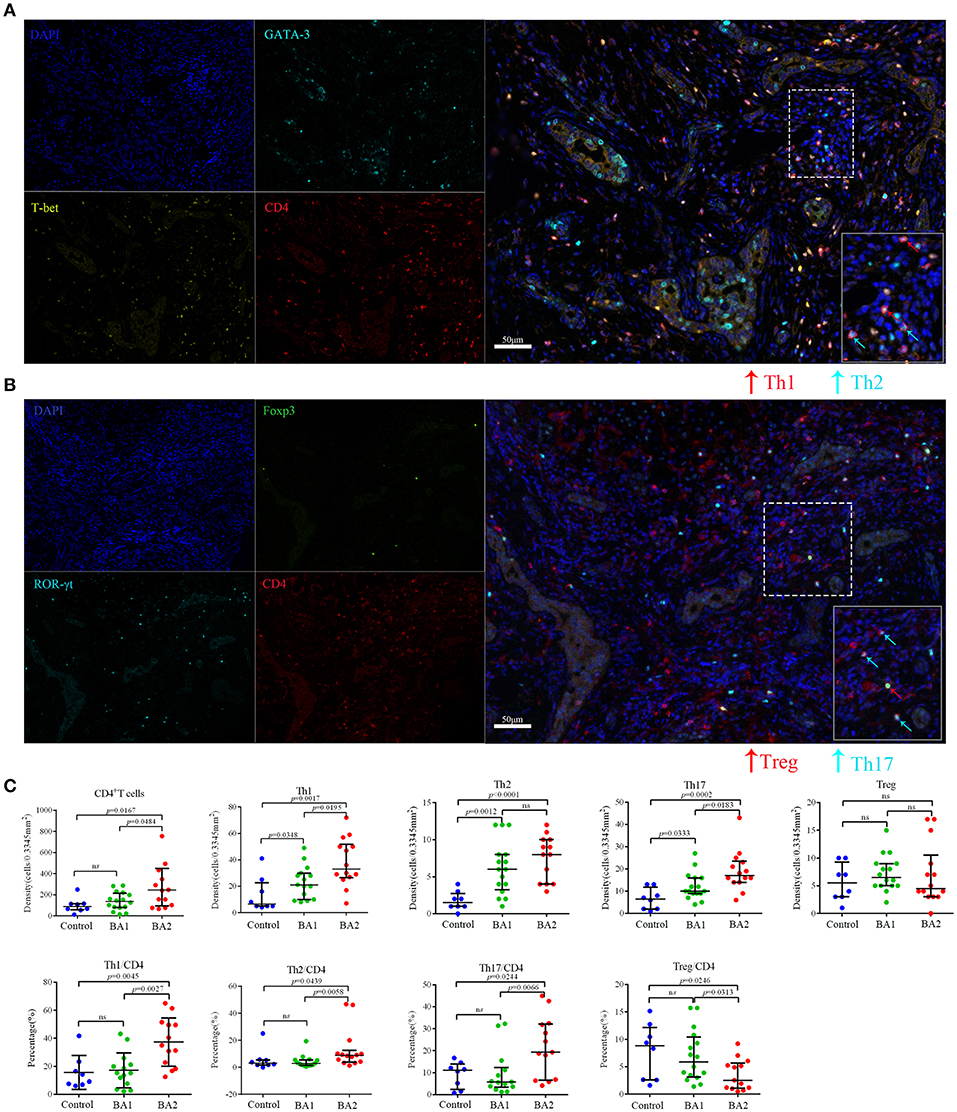
Figure 1. Representative mIHC images and statistical analyses of CD4+T cell subsets. (A) The four images on the left side were single stain of DAPI (blue), CD4 (red), T-bet (yellow), and GATA-3 (cyan). Merged image on the right side showed Th1 (CD4+T-bet+) and Th2 (CD4+GATA3+) cells. The lower right image in the merged image was the magnification of dotted line area. (B) The four images on the left side were single stain of DAPI (blue), CD4 (red), ROR-γt (cyan), and Foxp3 (green). Merged image on the right side showed Th17 (CD4+ROR-γt+) and Treg (CD4+Foxp3+) cells. The lower right image in the merged image was the magnification of dotted line area. (C) Analyses of the densities and percentages of CD4+T cell subsets among control (choledochal cyst), BA1 (good prognosis) and BA2 (poor prognosis) groups. Mann-Whitney test was used.
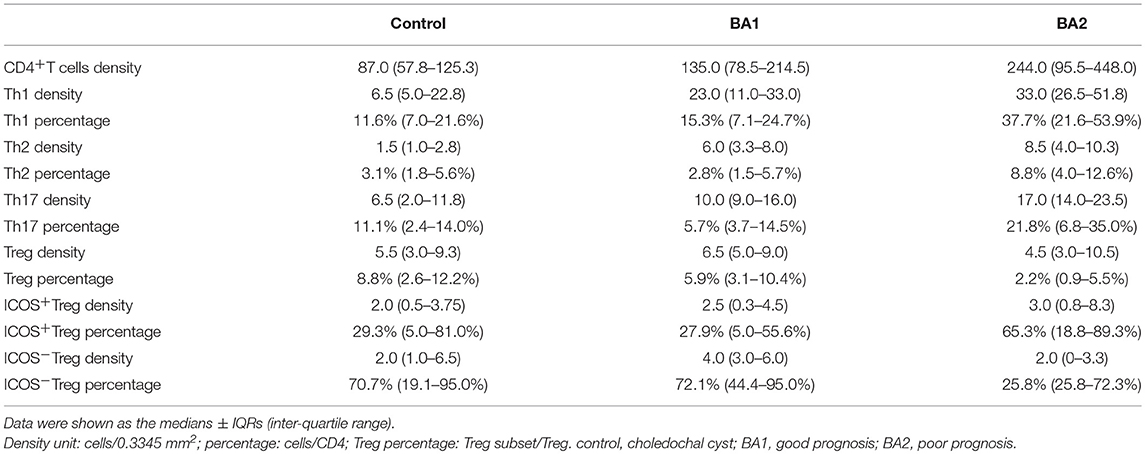
Table 2. The infiltrating density and percentage of major CD4+T cell subsets.
Detection of Tregs and ICOS+/ICOS−Tregs in the Portal Area of Livers From BA Patients
With a similar study strategy as above, the infiltration of Tregs (CD4+Foxp3+) were detected in the livers of BA and control groups (Figures S2E, S3D). Though the densities of Tregs did not show significance among the three groups, the Treg percentage of BA2 group was significantly lower than the BA1 and control groups (p < 0.05; Figure 1C; Table 2).
According to the expression of ICOS, Tregs can be further divided into ICOS+Tregs and ICOS−Tregs, thus we proceeded to evaluate the expression of ICOS on Tregs by flow cytometry and found that the percentage of ICOS+Tregs was increased in the peripheral blood of BA patients compared to the controls. Strikingly, ICOS+Tregs were significantly increased and on average, was accounted for more than half of total Tregs in the livers of BA patients (Figure 2A). Next, we applied IHC to confirm the above detection, representative images were shown in Figure S2F and Figure 2B. The infiltrating densities and percentages of ICOS+Tregs and ICOS−Tregs in the portal areas were included in Table 2. Group comparison analysis revealed that the BA2 group showed a significant decrease of the density of ICOS−Tregs compared to BA1 group (p < 0.05; Figure 2C). Furthermore, there was a tendency of increased percentage of ICOS+Tregs and a concomitant decreased percentage of ICOS−Tregs in the BA2 group (Figure 2C). These results suggested that the decreased number of hepatic Tregs particularly ICOS−Tregs were already existed before operation which might correlate to the poor prognosis of the BA patients.
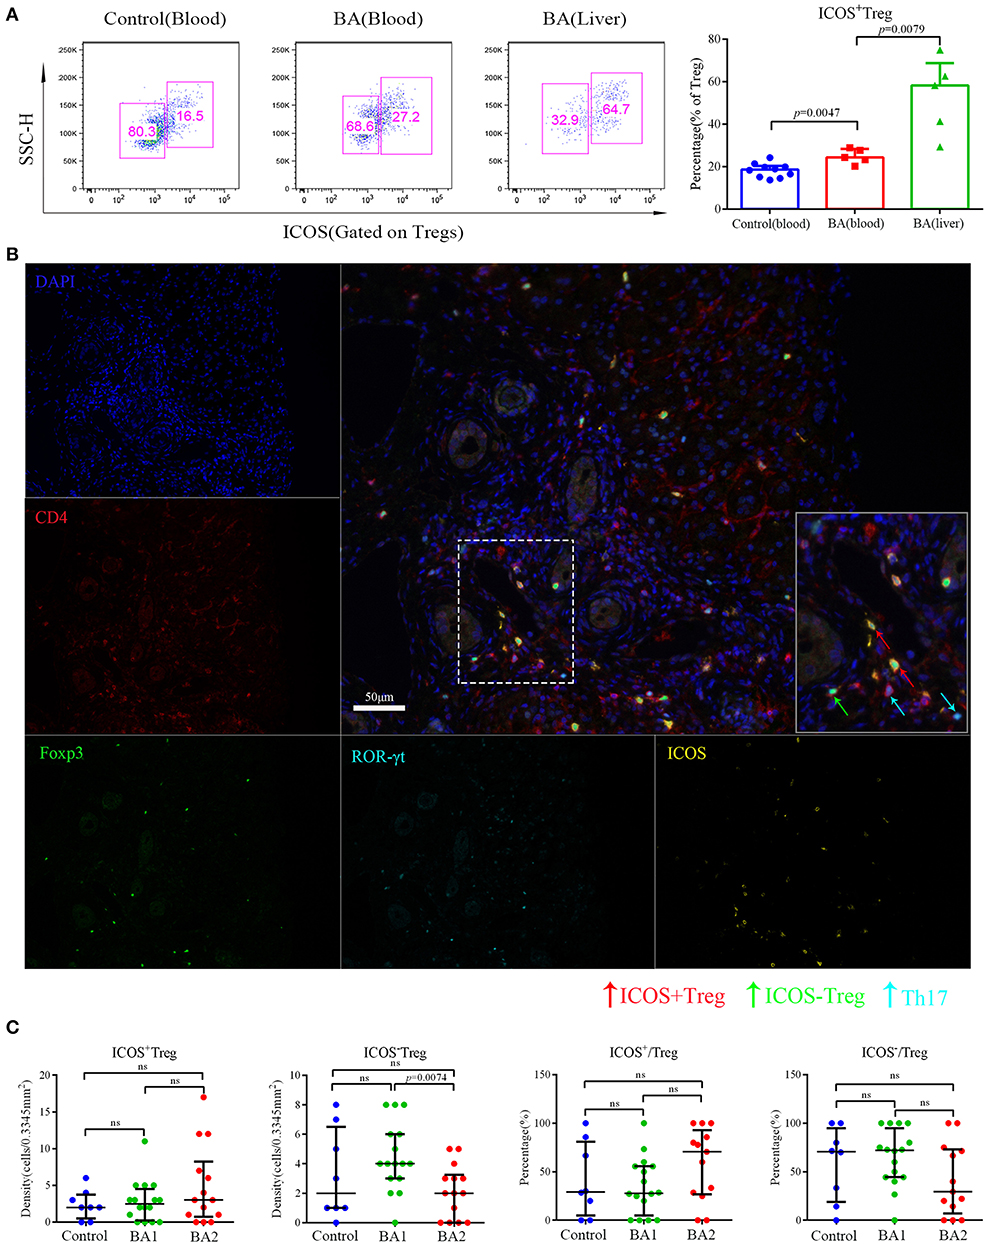
Figure 2. Flow cytometry and mIHC analyses of Treg subsets. (A) Representative flow cytometry image (left) and statistical analysis (right) of ICOS expression on Tregs. Control patients included four patients with brachial plexus injury and six patients with accessory ear. (B) The five small images were single stain of DAPI (blue), CD4 (red), ROR-γt (cyan), Foxp3 (green), and ICOS (yellow). Merged image on the right upper side showed Th17 (CD4+ ROR-γt +) ICOS+Treg (CD4+Foxp3+ICOS+) and ICOS−Treg (CD4+Foxp3+ICOS−). The lower right image in the merged image was the magnification of dotted line area. (C) Analyses of the densities and percentages of Treg subsets among control (choledochal cyst), BA1 (good prognosis), and BA2 (poor prognosis) groups. Mann-Whitney test was used.
Correlation Between Infiltration of Hepatic Major CD4+T Cell Subsets and Clinical Indexes at Sixth Month After Surgery in BA Patients
To determine whether preoperative infiltrating CD4+T cell subsets in the portal areas of BA livers had clinical relevance, correlation analysis was performed between infiltrating CD4+T cell subsets and postoperative serum TB and DB levels at sixth month. Our data revealed that elevated total CD4+T cells as well as percentages of Th1, Th2, and Th17 cells were positively correlated with these two serum parameters; on the contrary, Tregs percentage; and ICOS−Tregs density showed negative correlation (All p-values were below 0.05, Table 3). These results suggested that the level of preoperative inflammatory response influenced the bile drainage after surgery and the time of jaundice-free survival. Whereas, hepatic Tregs as well as ICOS−Tregs were favorable factors for bile drainage.
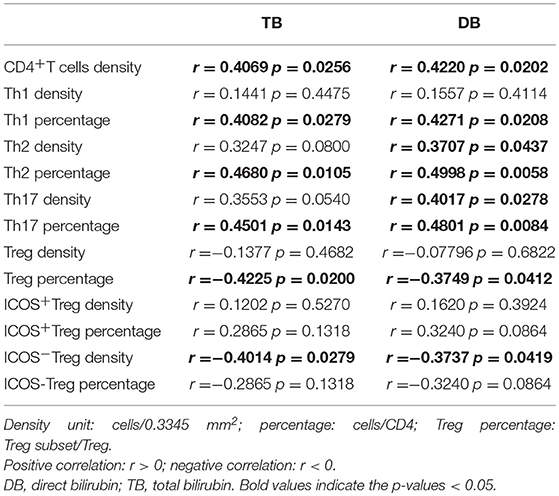
Table 3. Correlation between infiltrating levels of immune cells and bilirubin levels at sixth month after surgery.
Prognostic Significance of Preoperative Infiltration of Major CD4+T Cell Subsets in BA Patients
Next, we evaluated the prognostic values of the CD4+T cell subsets. The optimal cut-off for immunocytes infiltration was determined by ROC curve analysis (Figure S4 and Figure S5A), and then each subset was divided into high and low groups according to the cut-offs. By using Kaplan–Meier curves, we identified that high CD4+T cell, Th1, and Th17 densities, as well as high Th1, Th2, and Th17 percentages were negatively associated with jaundice-free and improved liver function survival (All p-values were below 0.05, Figure 3A and Figure S5B).
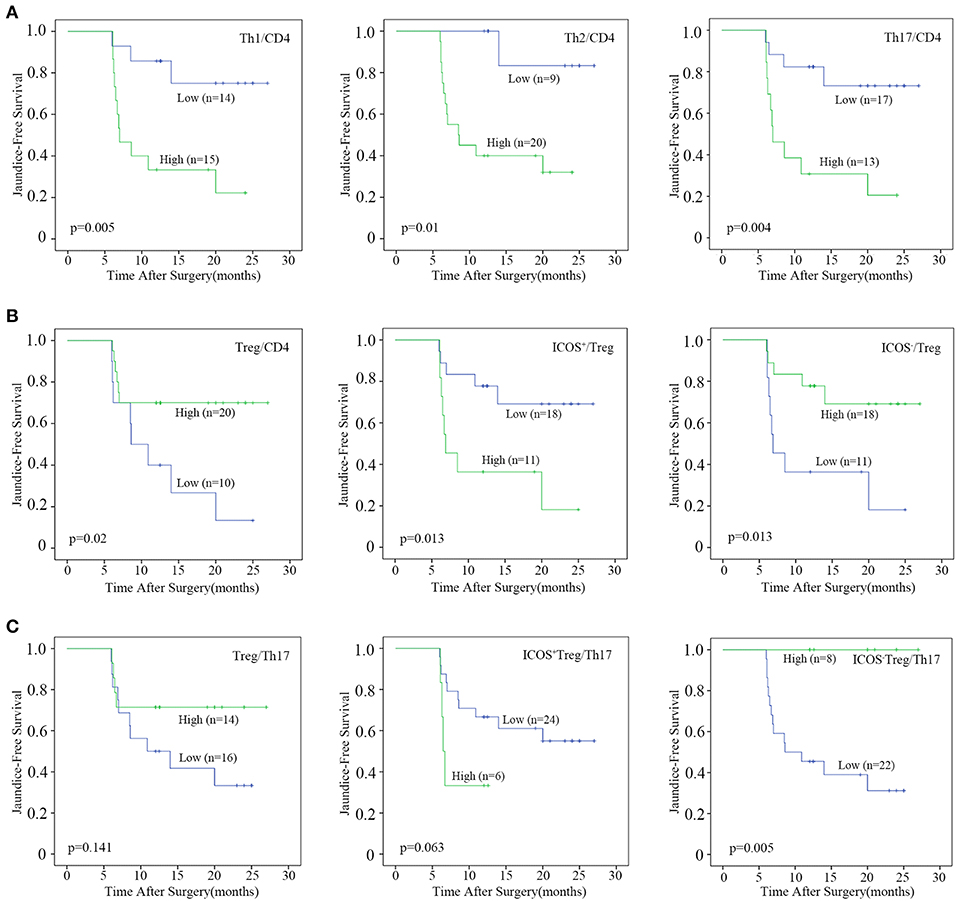
Figure 3. Prognostic analyses of CD4+T cell subsets. Patients were divided into “high” and “low” groups according to the optimal cut-offs which were determined by ROC curve analysis. Kaplan–Meier analysis of jaundice-free survival for (A) the percentages of Th1, Th2, and Th17 cells, (B) the percentages of Treg, ICOS+Treg, and ICOS−Treg cells, (C) the ratio of Treg, ICOS+Treg, and ICOS−Treg to Th17 were analyzed. Log-rank test was used.
By contrast, a high Treg percentage was positively associated with BA prognosis (p = 0.02; Figure 3B). When Tregs were further divided into ICOS+ and ICOS−Tregs, only ICOS−Treg percentage and density were positively associated with jaundice-free survival (p = 0.013 and 0.026, respectively; Figure 3B and Figure S5B). We further explored the prognostic value of the ratios of Treg or Treg subsets vs. Th17 cells. The results showed that only a high ratio of ICOS−Treg to Th17 cells was positively associated with jaundice-free survival (p = 0.005; Figure 3C). Collectively, we demonstrated that a high infiltration of Th1, Th2, and Th17 cells were negatively associated with BA prognosis, while a high infiltration of Tregs was a favorable prognostic factor for BA which was ascribed to the ICOS−Treg subset.
Univariate and Multivariate Analyses
To illustrate whether infiltrating ICOS+Tregs and ICOS−Tregs were independent prognostic factor, clinicopathologic features, and each CD4+T cell subset showing significance by univariate analysis were adopted as covariates when performing multivariate Cox regression analysis (Table 4). However, univariate analysis concerning all the clinicopathologic features in BA did not appear significance. Thus, we adopted each CD4+T cell subset showing significance in univariate analysis to consider those for multivariate evaluation. Patients with high infiltrating percentage of ICOS+Tregs in the portal area harbored a 3.427-fold higher risk of persistent jaundice after operation compared with those patients with low percentage of ICOS+Tregs (Table 5; HR, 3.427; 95%CI, 1.030–11.406; p = 0.045). For preoperative ICOS−Tregs percentage, it was a protective factor in BA (Table 5; HR, 0.292; 95%CI, 0.088–0.971; p = 0.045).
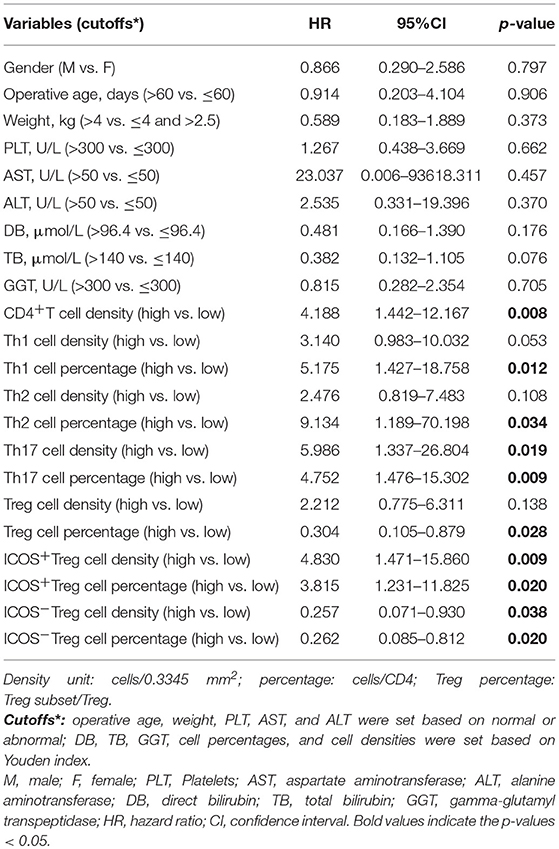
Table 4. Univariate analyses of prognostic factors associated with jaundice-free survival (n = 30).
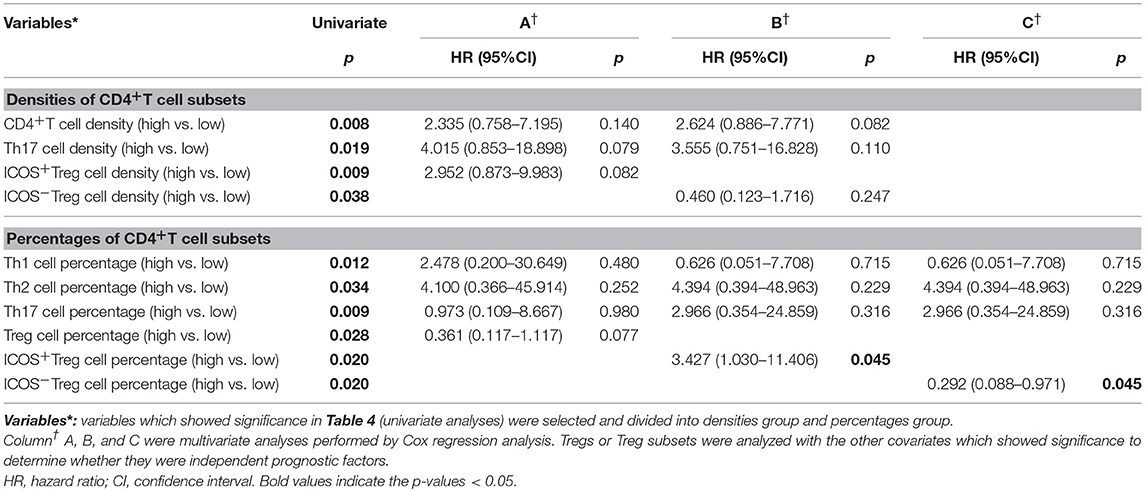
Table 5. Multivariate analyses of prognostic factors associated with jaundice-free survival (n = 30).
Phenotypic and Molecular Analyses of ICOS+ and ICOS−Tregs From BA
The above results highlighted a possible role of ICOS−Tregs in restricting BA progression. Through phenotypic analysis, we found more CD45RA and less CD45RO were expressed on peripheral blood and liver-derived ICOS−Tregs than ICOS+Tregs in BA patients (p < 0.05; Figures 4A–C), indicating that ICOS−Tregs were in a less differentiated status. In addition, ICOS−Tregs expressed more CD73 and less CD39 (Figures 4A–C), two molecules involved in adenosine metabolism and immune suppression (18). RT-qPCR results showed that ICOS−Tregs expressed higher CD25 and TGF-β but lower CD39 than ICOS+Tregs (p < 0.05; Figure 4D). ICOS−Tregs also showed an increased expression of CD73, even though not reached significance (Figure 4D). Interestingly, we found that ICOS−Tregs expressed higher anti-apoptotic molecule BCL-2 (Figure 4D). And ICOS−Tregs sorted from both the blood and livers of BA patients showed a much higher survival capacity than ICOS+Tregs in vitro (Figure 4E). All these results indicated that ICOS−Tregs were different from ICOS+Tregs in several aspects, including less differentiation, high expression of certain suppressive molecules and increased capacity to survive in vitro.
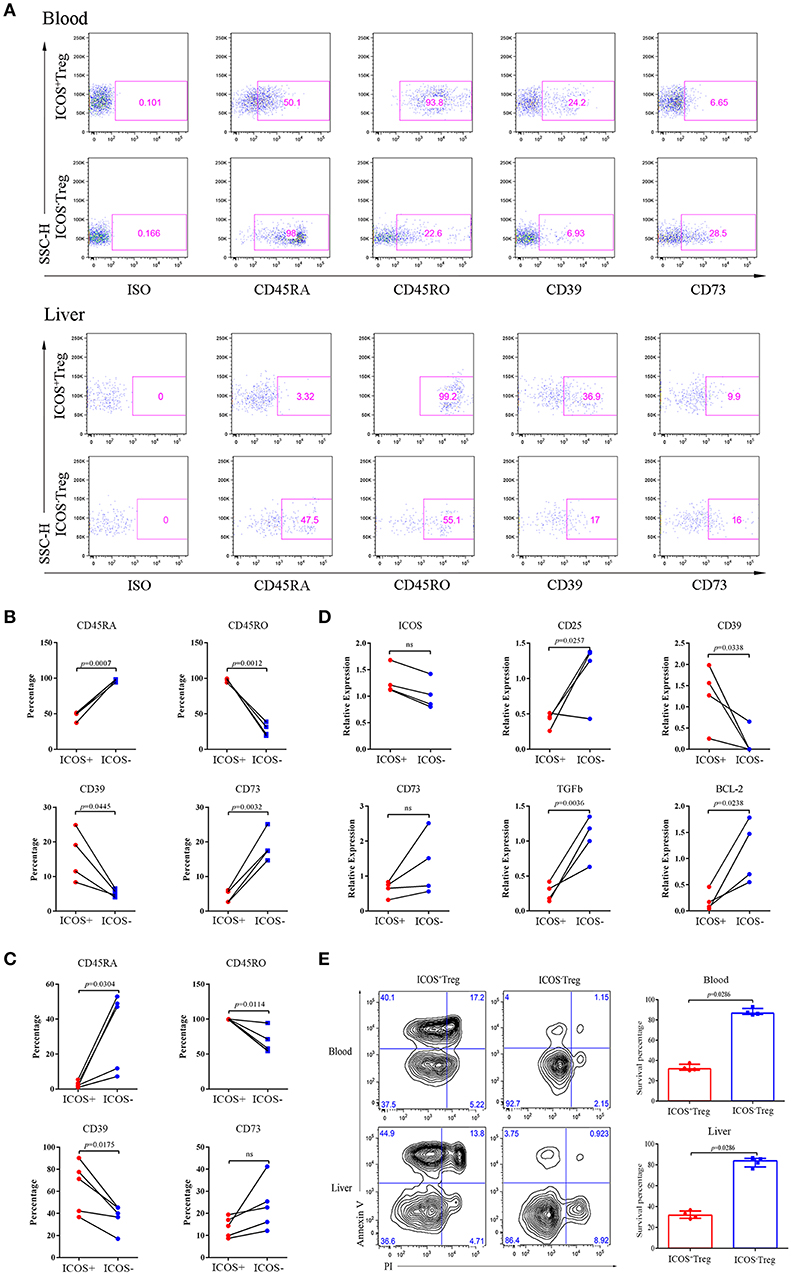
Figure 4. Phenotypes, RT-qPCR and apoptosis analyses of ICOS+Tregs and ICOS−Tregs. (A) Representative images of phenotypic expression of Treg subsets in peripheral blood (upper) and liver tissue (lower) from BA patients. Gates were set based on the ISO. (B,C) The statistical analysis of phenotypic expression of Treg subsets from peripheral blood (upper) and liver tissue (lower). Wilcoxon test was used. (D) RT-qPCR validation of ICOS, CD25, CD39, CD73, TGF-β, and BCL-2 genes were analyzed. Wilcoxon test was used. (E) Apoptosis Assay of Treg subsets from peripheral blood (upper) and liver tissues (lower) of BA patients. Mann-Whitney test was used.
Increased Capacity of ICOS−Tregs to Suppress Cytokines Production of Effector T Cells
To compare the suppressive activities of ICOS+ and ICOS−Tregs, we sorted both the subsets and cocultured each of them with CD3+CD25−T cells. Because insufficient Tregs count in a small hepatic tissue could not meet the needs of the experiment, we had to choose the Tregs from peripheral blood to mimic the closest setup for a replacement. Representative images were shown in Figures 5A,B. The results indicated that compared to ICOS+Tregs, ICOS−Tregs exhibited a stronger capacity to inhibit the production of TNF-α, IL-2, and IFN-γ from CD4+T cells (Figure 5C), as well as TNF-α and IL-2 production from CD8+T cells (Figure 5D). While the production of IFN-γ from CD4+T cells increased in the ICOS+Treg co-culture system instead of decrease (Figure 5C). These results demonstrated that ICOS−Tregs were more suppressive under this experimental condition which provided a possible explanation for their beneficial effect on prognosis.
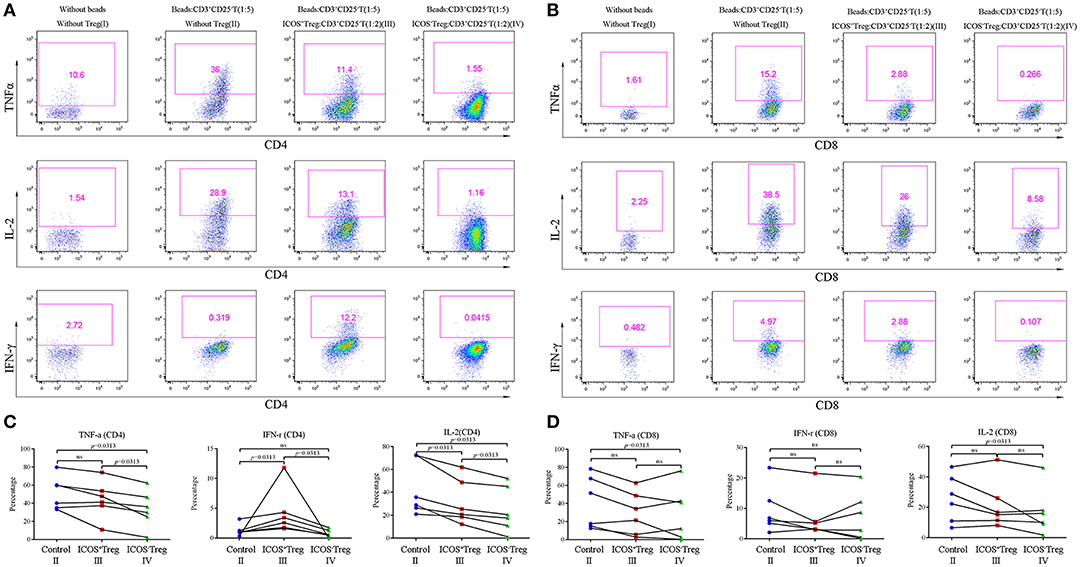
Figure 5. Co-culture experiments of CD3+CD25−T cells and Treg suubsets. (A,B) Effector CD3+CD25−T cells were cultured with or without Treg subsets and CD3+CD28+ dynabeads (ratios were shown in the parenthesis) for 3 days, the representative flow cytometry images of cytokines secretion were shown as above. (C,D) Cytokines including TNF-α, IL-2, and IFN-γ produced by CD4+ and CD8+T cells in the control (II), ICOS+Treg (III), and ICOS−Treg (IV) systems were analyzed. Wilcoxon test was used.
Discussion
In the present study, we accurately quantitated the infiltrating CD4+T cell subsets in the portal areas of BA livers and found that preoperative high infiltrating Th1, Th2, and Th17 cells were harmful to BA patients. In contrast, Tregs had a protective role in this disease, especially ICOS−Tregs, as they could effectively suppress the production of harmful cytokines in BA and were further proved to be a favorable prognostic factor.
Previous studies had proved the pathogenic roles of Th1, Th2, and Th17 cells in BA separately by confirming that IFN-γ (19, 20), IL-13 (21), and IL17 (22) were the main pathogenic cytokines. Most recently, a hypothesis raised by Bezerra et al. (23) emphasized that there might exist biological transitions from a type 1 to a mixed (Th1-2-17) immune response that drives persistent liver injury and progressive fibrosis in BA. This hypothesis is proved in this study. First, we revealed that both Th1 and Th17 cells were significantly enriched in BA livers, which increased even higher in severe cases. Secondly, we found Th2 cells also increased in BA livers, despite previous research showing that Th1 and Th2 cells remain a dynamic balance in vivo normally, overactivation of either subset can cause disease, and either pathway can down-regulate the other (24). Notably, the enhanced Th2 response was not only detected in a minority of BA patients or was an inflammatory stage that independent of Th1 response but existed in conjunction with the Th1 response. Thus, our clinical research revealed that a globally elevated preoperative effector CD4+T cell response could result in totally different prognosis in BA patients with similar preoperative clinical features.
The CD28 family member ICOS is important in regulating the development and immunosuppressive function of Tregs and is an immunological hotspot in tumor immunology (25, 26). Here, we exclusively proved the existent of both ICOS+Tregs and ICOS−Tregs in BA. Previously reported, ICOS+Tregs are more suppressive than ICOS−Tregs (27). However, ICOS−Tregs, instead of ICOS+Tregs exhibited a more powerful capacity to suppress the overproduction of harmful cytokines [e.g., IFN-γ, TNF-α, and IL-2 (28)] and were more beneficial to prognosis in our study. We conclude the possible reasons as followed: First, ICOS−Tregs expressed more CD73 and less CD39 compared with ICOS+Tregs. CD39 is an ectoenzyme that could hydrolyze ATP and ADP to AMP, while CD73 is an ecto-5′-nucleotidase that converts AMP to adenosine which could suppress effector CD4+T cell response and cytokines secretion (18, 29). Consistently, Sauer et al. (30) found that Tregs with decreased CD39 and increased CD73 expression in ADA+/+ mice were more suppressive than Tregs expressed the opposite pattern in ADA−/− mice. Second, ICOS−Tregs which expressed more CD45RA but less CD45RO were more resistant to apoptosis due to their less differentiated status (31). Besides, this subset also upregulated BCL-2 expression which could inhibit cell apoptosis (32). Therefore, ICOS+Tregs might not be able to persistently sustain immune balance as ICOS−Tregs in BA due to higher apoptosis. Third, we confirmed higher expression of three immunosuppression-related genes CD25, CD73, and TGF-β in ICOS−Tregs which might enable ICOS−Tregs to perform a more suppressive function in BA. Similar phenomena were also demonstrated in a previous study that KLRG1+ICOS+Tregs were prone to apoptosis, and had an impaired proliferative capacity and suppressive function (33), but KLRG1+ and KLRG1−Treg subsets generally displayed a similar suppressive potential (34). KLRG1+ICOS+Tregs could even reprogram into inflammatory cytokine-producing effector T cells (33), and ICOS+Tregs adopted a Th1-like Treg phenotype could produce more IFN-γ (35). These might also explain the enhanced IFN-γ production in ICOS+Treg co-culture system.
Clinically, BA patients usually receive sequential therapy of KPE and liver transplantation. However, whether all the patients should firstly receive KPE is under controversy because a successful KPE could not restore the impaired liver function of BA patients who already have severe cirrhosis and liver inflammation before operation. Therefore, it is necessary to predict the prognosis of BA patients and perform a KPE on those selective patients who may get benefit from it. Serum GGT levels (36) and transient elastography (37) were applied in predicting the prognosis of BA, however their accuracy varied. Postoperative serum TB and DB levels were associated with BA prognosis, especially TB, 2014 Practice Guideline of American Association for the Study of Liver Diseases (AASLD) indicated that BA patients should be promptly referred for liver transplantation evaluation if the TB was >6 mg/dL beyond 3 months after KPE (38). We herein found that the preoperative infiltrating effector CD4+T cells were positively correlated the serum TB and DB levels at the sixth month after surgery and were negatively associated with patients' prognosis. Thus, we supported the early detection of CD4+T lymphocytes as an important reference for postoperative liver function and prognosis. It should be pointed out that ICOS−Treg percentage which was an independent prognostic factor, especially the ratio of ICOS−Treg to Th17 cells was a better predictive measure for prognosis. Together, we provided a potential new biomarker to predict the prognosis of BA patients.
We believe that the strong inference of this study needs to be encouraged to perform in larger cohorts combining immuno-pathological aspect, and will ensure therapeutic interpretability and stratification accuracy. In summary, we here prove that BA is an immune-related disease and preoperative immune dysfunction is one of the triggers which could aggravate the condition of BA patients. In future, adjuvant immunotherapy may have the potential to alleviate the symptom or delay the progression of BA if we find the right target.
Data Availability
The raw data supporting the conclusions of this manuscript will be made available by the authors, without undue reservation, to any qualified researcher.
Ethics Statement
Statement involving human subjects: This study was carried out in accordance with the recommendations of the Ethics Committee of the Children's Hospital of Fudan University (2018 [164]) with written informed consent in accordance with Declaration of Helsinki. The protocol was approved by the Ethics Committee of the Children's Hospital of Fudan University.
Author Contributions
GC and XZ designed the study and interpreted the data. ShuZ did the experiments, analyzed the data, and wrote the manuscript. SG analyzed and interpreted the data. JM did the experiments and analyzed the data. LM interpreted the data and wrote the manuscript. YW gave the technical support. FZ analyzed the data. DZ did the experiments. ShaZ, RD, and XX interpreted the data. All authors gave approval for the final version of the manuscript.
Funding
This study was supported by the Strategic Priority Research Program (No. XDB29030302), Interdisciplinary Innovation Team, Frontier Science Key Research Project (No. QYZDB-SSW-SMC036), Chinese Academy of Sciences, Shanghai Key Disciplines (No. 2017ZZ02022), the National Natural Science Foundation of China (No. 81873545), the Science Foundation of Shanghai Excellent Youth Scholars (No. 2017YQ042), the Science Foundation of Shanghai (No. 18411969100 and No. 17411960600), and the National High Technology Research and Development Program of China (2015AA020104).
Conflict of Interest Statement
The authors declare that the research was conducted in the absence of any commercial or financial relationships that could be construed as a potential conflict of interest.
Supplementary Material
The Supplementary Material for this article can be found online at: https://www.frontiersin.org/articles/10.3389/fped.2019.00279/full#supplementary-material
Figure S1. Sorting gates of ICOS+Tregs, ICOS−Tregs, and CD3+CD25−T cells in BD FACSMelody flow cytometric cell sorter. (A) Sorting gates of ICOS+Tregs and ICOS−Tregs. (B) Sorting gate of CD3+CD25−T cells.
Figure S2. Representative images of single immunohistochemistry. Antibodies tests of single immunohistochemistry of (A) CD4, (B) T-bet, (C) GATA-3, (D) ROR-rt, (E) Foxp3, (F) ICOS in the portal areas of BA livers.
Figure S3. Representative images of multiplex immunohistochemistry. The lower right image is the magnification of dotted line area. Triple immunohistochemistry of (A) DAPI (blue), CD4 (red), and T-bet (cyan) to identify Th1 (CD4+T-bet+) cells, (B) DAPI (blue), CD4 (red), and GATA-3 (yellow) to identify Th2 (CD4+GATA-3+) cells, (C) DAPI (blue), CD4 (red), and ROR-γt (cyan) to identify Th17 (CD4+ROR-γt+) cells, (D) DAPI (blue), CD4 (red), and Foxp3 (green) to identify Treg (CD4+Foxp3+) cells.
Figure S4. ROC curve analyses of CD4+T cell subsets. (A) Univariate ROC curve analysis about prognostic outcome onto Th1, Th2, and 687 Th17 percentages. (B) Univariate ROC curve analysis about prognostic outcome onto 688 Treg and Treg subsets percentages. (C) Univariate ROC curve analysis about 689 prognostic outcome onto ratios of Treg or Treg subsets to Th17.
Figure S5. ROC curve and Kaplan-Meier analyses for the density of CD4+T cell subsets. (A) Univariate ROC curve analysis about prognostic outcome onto density of each CD4+T cell subset was performed. (B) Kaplan–Meier curves comparing jaundice-free survival and improved liver function in patients with high and low densities of CD4, Th1, Th2, Th17, Treg, ICOS+Treg, and ICOS−Treg cells in the portal areas were analyzed. Log-rank test was used.
Table S1. Antibody list of immunohistochemistry.
Table S2. Antibody list of flow cytometry.
Table S3. Sequences of primers used for qPCR assays in this study.
Abbreviations
BA, biliary atresia; KPE, Kasai portoenterostomy; ICOS, inducible costimulator; AST, aspartate aminotransferase; ALT, alanine aminotransferase; TB, total bilirubin; DB, direct bilirubin; ADA, absence of adenosine deaminase; GGT, gamma-glutamyl transpeptidase.
References
1. Mack CL. What causes biliary atresia? unique aspects of the neonatal immune system provide clues to disease pathogenesis. Cell Mol Gastroenterol Hepatol. (2015) 1:267–74. doi: 10.1016/j.jcmgh.2015.04.001
2. Mack CL, Tucker RM, Sokol RJ, Karrer FM, Kotzin BL, Whitington PF, et al. Biliary atresia is associated with CD4+ Th1 cell–mediated portal tract inflammation. Pediatr Res. (2004) 56:79–87. doi: 10.1203/01.PDR.0000130480.51066.FB
3. Narayanaswamy B, Gonde C, Tredger JM, Hussain M, Vergani D, Davenport M. Serial circulating markers of inflammation in biliary atresia–evolution of the post-operative inflammatory process. Hepatology. (2007) 46:180–7. doi: 10.1002/hep.21701
4. Lages CS, Simmons J, Chougnet CA, Miethke AG. Regulatory T cells control the CD8 adaptive immune response at the time of ductal obstruction in experimental biliary atresia. Hepatology. (2012) 56:219–27. doi: 10.1002/hep.25662
5. Liu Y, Li K, Yang L, Tang S, Wang X, Cao G, et al. Dendritic cells regulate treg-Th17 axis in obstructive phase of bile duct injury in murine biliary atresia. PLoS ONE. (2015) 10:e136214. doi: 10.1371/journal.pone.0136214
6. Shivakumar P, Sabla GE, Whitington P, Chougnet CA, Bezerra JA. Neonatal NK cells target the mouse duct epithelium via Nkg2d and drive tissue-specific injury in experimental biliary atresia. J Clin Invest. (2009) 119:2281–90. doi: 10.1172/JCI38879
7. Yang Y, Liu Y, Tang S, Yang L, Yang J, Cao G, et al. Elevated Th17 cells accompanied by decreased regulatory T cells and cytokine environment in infants with biliary atresia. Pediatr Surg Int. (2013) 29:1249–60. doi: 10.1007/s00383-013-3421-6
8. Tucker RM, Feldman AG, Fenner EK, Mack CL. Regulatory T cells inhibit Th1 cell-mediated bile duct injury in murine biliary atresia. J Hepatol. (2013) 59:790–6. doi: 10.1016/j.jhep.2013.05.010
9. Ito T, Hanabuchi S, Wang Y, Park WR, Arima K, Bover L, et al. Two functional subsets of FOXP3+ regulatory T cells in human thymus and periphery. Immunity. (2008) 28:870–80. doi: 10.1016/j.immuni.2008.03.018
10. Tu J, Ding Y, Ying X, Wu F, Zhou X, Zhang D, et al. Regulatory T cells, especially ICOS+ FOXP3+ regulatory T cells, are increased in the hepatocellular carcinoma microenvironment and predict reduced survival. Sci Rep. (2016) 6:35056. doi: 10.1038/srep35056
11. Martin-Orozco N, Li Y, Wang Y, Liu S, Hwu P, Liu YJ, et al. Melanoma cells express ICOS ligand to promote the activation and expansion of T-regulatory cells. Cancer Res. (2010) 70:9581–90. doi: 10.1158/0008-5472.CAN-10-1379
12. Nio M, Wada M, Sasaki H, Tanaka H, Okamura A. Risk factors affecting late-presenting liver failure in adult patients with biliary atresia. J Pediatr Surg. (2012) 47:2179–83. doi: 10.1016/j.jpedsurg.2012.09.003
13. Hung PY, Chen CC, Chen WJ, Lai HS, Hsu WM, Lee PH, et al. Long-term prognosis of patients with biliary atresia: a 25 year summary. J Pediatr Gastroenterol Nutri. (2006) 42:190–5. doi: 10.1097/01.mpg.0000189339.92891.64
14. De VW, de Langen ZJ, Groen H, Scheenstra R, Peeters PM, Hulscher JB, et al. Biliary atresia in the Netherlands: outcome of patients diagnosed between 1987 and 2008. J Pediatr. US. (2012) 160:638–44. doi: 10.1016/j.jpeds.2011.09.061
15. Goda T, Kawahara H, Kubota A, Hirano K, Umeda S, Tani G, et al. The most reliable early predictors of outcome in patients with biliary atresia after Kasai's operation. J Pediatr Surg. (2013) 48:2373–7. doi: 10.1016/j.jpedsurg.2013.08.009
16. Feng Z, Puri S, Moudgil T, Wood W, Hoyt CC, Wang C, et al. Multispectral imaging of formalin-fixed tissue predicts ability to generate tumor-infiltrating lymphocytes from melanoma. J Immunother Cancer. (2015) 3:47. doi: 10.1186/s40425-015-0091-z
17. Livak KJ, Schmittgen TD. Analysis of relative gene expression data using real-time quantitative PCR and the Method. Methods. (2001) 25:402–8. doi: 10.1006/meth.2001.1262
18. Deaglio S, Dwyer KM, Gao W, Friedman D, Usheva A, Erat A, et al. Adenosine generation catalyzed by CD39 and CD73 expressed on regulatory T cells mediates immune suppression. J Exp Med. (2007) 204:1257–65. doi: 10.1084/jem.20062512
19. Bezerra JA, Tiao G, Ryckman FC, Alonso M, Sabla GE, Shneider B, et al. Genetic induction of proinflammatory immunity in children with biliary atresia. Lancet. (2002) 360:1653–9. doi: 10.1016/S0140-6736(02)11603-5
20. Wen J, Zhou Y, Wang J, Chen J, Yan W, Wu J, et al. Interactions between Th1 cells and Tregs affect regulation of hepatic fibrosis in biliary atresia through the IFN-γ/STAT1 pathway. Cell Death Differ. (2017) 24:997–1006. doi: 10.1038/cdd.2017.31
21. Li J, Bessho K, Shivakumar P, Mourya R, Mohanty SK, Dos Santos JL, et al. Th2 signals induce epithelial injury in mice and are compatible with the biliary atresia phenotype. J Clin Invest. (2011) 121:4244–56. doi: 10.1172/JCI57728
22. Lages CS, Simmons J, Maddox A, Jones K, Karns R, Sheridan R, et al. The dendritic cell-T helper 17-macrophage axis controls cholangiocyte injury and disease progression in murine and human biliary atresia. Hepatology. (2017) 65:174–88. doi: 10.1002/hep.28851
23. Bezerra JA, Wells RG, Mack CL, Karpen SJ, Hoofnagle JH, Doo E, et al. Biliary atresia: clinical and research challenges for the twenty-first century. Hepatology. (2018) 68:1163–73. doi: 10.1002/hep.29905
24. Magombedze G, Eda S, Ganusov VV. Competition for antigen between Th1 and Th2 responses determines the timing of the immune response switch during Mycobaterium avium subspecies paratuberulosis infection in ruminants. PLoS Comput Biol. (2014) 10:e1003414. doi: 10.1371/journal.pcbi.1003414
25. Redpath SA, van der Werf N, Cervera AM, MacDonald AS, Gray D, Maizels RM, et al. ICOS controls Foxp3+regulatory T-cell expansion, maintenance and IL-10 production during helminth infection. Eur J Immunol. (2013) 43:705–15. doi: 10.1002/eji.201242794
26. Zhang Y, Luo Y, Qin S, Mu Y, Qi Y, Yu M, et al. The clinical impact of ICOS signal in colorectal cancer patients. Oncoimmunology. (2016) 5:e1141857. doi: 10.1080/2162402X.2016.1141857
27. Huang XM, Liu XS, Lin XK, Yu H, Sun JY, Liu XK, et al. Role of plasmacytoid dendritic cells and inducible costimulator-positive regulatory T cells in the immunosuppression microenvironment of gastric cancer. Cancer Sci. (2014) 105:150–8. doi: 10.1111/cas.12327
28. Arafa RS, Abdel Haie OM, El-Azab DS, Abdel-Rahman AM, Sira MM. Significant hepatic expression of IL-2 and IL-8 in biliary atresia compared with other neonatal cholestatic disorders. Cytokine. (2016) 79:59–65. doi: 10.1016/j.cyto.2015.12.023
29. Kobie JJ, Shah PR, Yang L, Rebhahn JA, Fowell DJ, Mosmann TR. T regulatory and primed uncommitted CD4 T cells express CD73, which suppresses effector CD4 T cells by converting 5′-adenosine monophosphate to adenosine. J Immunol. (2006) 177:6780–6. doi: 10.4049/jimmunol.177.10.6780
30. Sauer AV, Brigida I, Carriglio N, Hernandez RJ, Scaramuzza S, Clavenna D, et al. Alterations in the adenosine metabolism and CD39/CD73 adenosinergic machinery cause loss of Treg cell function and autoimmunity in ADA-deficient SCID. Blood. (2012) 119:1428–39. doi: 10.1182/blood-2011-07-366781
31. Dunne PJ. Epstein-Barr virus-specific CD8+ T cells that re-express CD45RA are apoptosis-resistant memory cells that retain replicative potential. Blood. (2002) 100:933–40. doi: 10.1182/blood-2002-01-0160
32. Hata AN, Engelman JA, Faber AC. The BCL2 family: key mediators of the apoptotic response to targeted anticancer therapeutics. Cancer Discov. (2015) 5:475–87. doi: 10.1158/2159-8290.CD-15-0011
33. Kornete M, Mason E, Istomine R, Piccirillo CA. KLRG1 expression identifies short-lived Foxp3(+) Treg effector cells with functional plasticity in islets of NOD mice. Autoimmunity. (2017) 50:354–62. doi: 10.1080/08916934.2017.1364368
34. Tauro S, Nguyen P, Li B, Geiger TL. Diversification and senescence of Foxp3+ regulatory T cells during experimental autoimmune encephalomyelitis. EUR J Immunol. (2013) 43:1195–207. doi: 10.1002/eji.201242881
35. Kornete M, Mason ES, Girouard J, Lafferty EI, Qureshi S, Piccirillo CA. Th1-Like ICOS+ Foxp3+ treg cells preferentially express CXCR3 and home to β-islets during pre-diabetes in BDC2.5 NOD mice. PLoS ONE. (2015) 10:e126311. doi: 10.1371/journal.pone.0126311
36. Ihn K, Ho IG, Chang EY, Han SJ. Correlation between gamma-glutamyl transpeptidase activity and outcomes after Kasai portoenterostomy for biliary atresia. J Pediatr Surg. (2018) 53:461–7. doi: 10.1016/j.jpedsurg.2017.10.001
37. Wu J, Lee C, Lin W, Jeng Y, Chen H, Ni Y, et al. Transient elastography is useful in diagnosing biliary atresia and predicting prognosis after hepatoportoenterostomy. Hepatology. (2018) 68:616–24. doi: 10.1002/hep.29856
38. Squires RH, Ng V, Romero R, Ekong U, Hardikar W, Emre S, et al. Evaluation of the pediatric patient for liver transplantation: 2014 practice guideline by the american association for the study of liver diseases, american society of transplantation and the north american society for pediatric gastroenterology, hepatolo. Hepatology. (2014) 60:362–98. doi: 10.1002/hep.27191
Keywords: biliary atresia, immune dysfunction, CD4+T cell subset, inducible co-stimulator, prognosis
Citation: Zhang S, Goswami S, Ma J, Meng L, Wang Y, Zhu F, Zhang D, Zheng S, Dong R, Xiao X, Zhang X and Chen G (2019) CD4+T Cell Subset Profiling in Biliary Atresia Reveals ICOS− Regulatory T Cells as a Favorable Prognostic Factor. Front. Pediatr. 7:279. doi: 10.3389/fped.2019.00279
Received: 07 March 2019; Accepted: 21 June 2019;
Published: 09 July 2019.
Edited by:
Jan B. F. Hulscher, University Medical Center Groningen, NetherlandsReviewed by:
Corentin Babakissa, Université de Sherbrooke, CanadaDuška Tješić-Drinković, School of Medicine, University of Zagreb, Croatia
Copyright © 2019 Zhang, Goswami, Ma, Meng, Wang, Zhu, Zhang, Zheng, Dong, Xiao, Zhang and Chen. This is an open-access article distributed under the terms of the Creative Commons Attribution License (CC BY). The use, distribution or reproduction in other forums is permitted, provided the original author(s) and the copyright owner(s) are credited and that the original publication in this journal is cited, in accordance with accepted academic practice. No use, distribution or reproduction is permitted which does not comply with these terms.
*Correspondence: Xiaoming Zhang, xmzhang@ips.ac.cn; Gong Chen, chengongzlp@hotmail.com
†These authors have contributed equally to this work