 Chulananda D. A. Goonasekera
 Joseph A. Carcillo2
 Akash Deep
- 1Department of Anesthetics, King's College Hospital, London, United Kingdom
- 2Divison of Pediatric Critical Care Medicine, University of Pittsburgh School of Medicine, Pittsburgh, PA, United States
- 3Paediatric Intensive Care Unit, King's College Hospital, London, United Kingdom
Background: In septic shock, both oxygen delivery (DO2) and oxygen consumption (VO2) are dysfunctional. The current therapeutic regimens are geared to normalize global oxygen delivery (DO2) to tissues via goal directed therapies but mortality remains high at 10–20%.
Methods: We studied cardiac index (CI), systemic vascular resistance index (SVRI), central venous oxygen saturation (ScvO2), central venous pressure (CVP), peripheral oxygen saturation (SpO2), mean blood pressure (MBP), body temperature, blood lactate, base excess and hemoglobin concentration (Hb) in a cohort of children admitted in “fluid-refractory” severe septic shock to pediatric intensive care, over 4.5-years. We calculated their 6 h global oxygen delivery (DO2) and global oxygen consumption (VO2) over the first 42 h and looked at factors associated with VO2/DO2 ratio (i.e., global oxygen extraction, gO2ER) and 28-day mortality.
Results: Sixty-two children mean age (SD) 7.19 (5.44) years were studied. Fifty-seven (93%) children were sedated and mechanically ventilated and all received adrenaline or noradrenaline or both and added milrinone in 6 (9.6%). At 28 days, 9 (14.5%) were dead. The global oxygen extraction ratio (gO2ER) was consistently lower amongst the survivors and independently predicted mortality (ROC AUC = 0.75). A lactate level of 4 mmol/l or above, when associated with a concurrent metabolic acidosis predicted mortality with a sensitivity of 100% (95% CI 90.5–100) and a specificity of 67.7% (95% CI 62.2–72.9). A gO2ER of 0.48 or above on admission to the PICU was associated with death with a 66.7% sensitivity (95%CI 29.9–92.5) and 90.5% specificity (95%CI 79.3–96.8). A global O2ER of >0.48 combined with a concurrent blood lactate >4.0 mmol/l at any time within the first 42 h of therapy predicted death with a sensitivity of 63.9% (95% CI, 46.2–79.1) and specificity of 97.8% (95% CI, 95.7–99.0). A radar plot identified MBP-CVP difference, and CI as additional goals of therapy that may offer a survival benefit.
Conclusions: Global O2ER of >0.48 with a concurrent blood lactate >4.0 mmol/l in children with metabolic acidosis was an independent factor associated with death in fluid resistant septic shock. Trends of gO2ER seem useful to recognize survivors and non-survivors early in the illness.
Background
Childhood mortality in invasive infections, sepsis and septic shock remains high at 3.9, 5.6, and 17.0%, respectively (1, 2). Significant advances in the management of septic shock in children have been made and it hails from standardized, timely, goal directed therapies to normalize “macro-circulation” abnormalities (3). Clinicians target global oxygen delivery (DO2) as the therapeutic goal with the hope of matching the supply-demand gap of oxygen during the treatment of shock.
In septic shock, both oxygen delivery and oxygen consumption are dysfunctional. Some authors claim normalizing ScvO2 as an additional goal of therapy may be beneficial (4) whilst others argue that higher than normal ScvO2 may increase the mortality risk (5, 6). Higher ScvO2 can indicate improved oxygen delivery but it does not rule out continuing hypoxia (7). This is because high ScvO2 can also reflect poor tissue oxygen consumption resulting from sepsis induced dysfunctional capillary perfusion and altered mitochondrial function. However, quantitative estimations of these are scant.
Microcirculatory alterations in sepsis are associated with organ dysfunction and mortality (8, 9). Due to practical difficulties of measuring regional oxygen consumption and oxygen delivery, most clinical studies have focused on global oxygen delivery (DO2) and global oxygen consumption (VO2). Oxygen delivery is formally calculated using the degree of hemoglobin (Hb) oxygen saturation, and dissolved O2 content in arterial blood and cardiac output (CO). The oxygen consumption (VO2) is a composite estimate of global oxygen utilization. It is the calculated oxygen content difference between arterial and venous blood standardized to cardiac index.
To understand the evolution of DO2 and VO2 in pediatric “fluid resistant” septic shock during the resuscitation and stabilization phase and its associations, we estimated global oxygen delivery (DO2) and global oxygen consumption (VO2) and outcomes in a cohort of children in “fluid resistant” septic shock who were receiving standard goal directed therapy in the pediatric intensive care.
Methods
We retrospectively studied hemodynamic variables during initial stabilization for 42 h and 28-day outcome in all children admitted from June 2009–Feb 2014 in fluid refractory septic shock to a regional 16-bed Pediatric Intensive Care Unit (PICU). Shock was classified as “fluid-refractory” when the total fluid requirement during resuscitation exceeded 60 ml/kg fulfilling international consensus conference criteria (10, 11) and required inotrope/vasopressor/vasodilator therapy.
All children had continuous hemodynamic monitoring including invasive arterial blood pressure and central venous pressure (via SVC catheter) as standard. Vasoactive agents (noradrenaline, adrenaline or milrinone) were used to optimize hemodynamics as per the ACCM-CPP protocol (12). In addition, their cardiac index (CI) and systemic vascular resistance index (SVRI) were measured approximately 6-h by an Ultrasonic Cardiac Output Monitor (USCOM model 1-A, USCOM Limited Australia http://www.uscom.com.au/) using a trans-cutaneous Doppler probe placed at the supra sternal notch (13, 14).
We calculated global oxygen delivery (DO2) using a standard formula (Equation 1) using pulse oximetry (SpO2) as an suitable surrogate for oxygen saturation of arterial blood (SaO2) (15). DO2 was standardized to body surface area (DO2I).
Equation 1 Oxygen delivery index (DO2I) calculation formula (normal range 520-720 ml O2/min/m2).
DO2I = O2 delivery index = DO2 mls/min/m2 = (10 × Hb/dl × 1.34 × SpO2) + (PaO2 in mmHg × 0.003 × 10) × Cardiac index l/min/m2.
We also obtained simultaneous measured central venous oxygen saturations (ScvO2) (16–18) of venous samples obtained via radiologically confirmed central venous catheters placed in superior vena cava (SVC) and estimated mixed venous oxygen content. Global oxygen consumption (VO2) was derived by subtracting estimated oxygen content in mixed venous blood from that of arterial blood (Equation 2). This too was standardized to body surface area (VO2I).
Equation 2 Oxygen consumption index (VO2I) calculation formula (normal range 110–160 ml O2/min/m2).
VO2I = Oxygen consumption mls/min/m2 = [(SpO2 – ScvO2) × 10 × 1.34 × Hb/dl] + [(PaO2 - PvO2 in mmHg) × 0.003 × 10] × Cardiac index l/min/m2.
We used the ratio of global oxygen consumption (VO2) to global oxygen delivery (DO2) standardized to body surface area i.e., VO2I/DO2I ratio (global oxygen extraction ratio - gO2ER, normal 0.28) as a crude clinical measure of global “efficacy” of oxygen consumption during resuscitation and stabilization phases of sepsis. We contemplated that global “efficacy” depended upon a combination of factors including the ability of tissues to extract oxygen and the reserve capacity of the cardiovascular system to increase oxygen delivery to match the peripheral oxygen demand. A higher gO2ER value was therefore suggestive of inadequate oxygen delivery (DO2) or increased oxygen consumption (VO2) or both. A lower gO2ER was reflective of increased oxygen delivery or decreased oxygen consumption (VO2) or both.
Statistics
Absolute values were standardized to body surface area to adjust for age as appropriate. Continuous variables were summarized as mean (SD) and categorical data as count (percentage). Student t-test was used to test differences in continuous variables and the χ2 test to compare proportions. All analyses were performed with statistical software IBM-SPSS version 20 (IBM Corporation, New York, USA). All tests were 2-tailed, and P < 0.05 was considered statistically significant.
Using gO2ER values, a receiver operating characteristic curves (ROC) was developed against outcome. The area under the curve (AUC) of more than 0.75 was considered clinically useful (19).
To have an “aerial view,” we also created radar plots of the above parameters observed over the first 42 h for survivors and non-survivors separately. These plots represented mean ± SE of each variable to enable a visual comparison between surviving and non-surviving populations.
Results
There were 62 children (M: F = 34:28) aged mean (SD) 7.19 (5.44) years admitted in fluid refractory septic shock. Nine required continuous veno-venous hemofiltration (CVVH) during ICU stay. Upon admission to the PICU, 93.5% children were mechanically ventilated and sedated using a combination of morphine and midazolam. At 42 h 85% of the surviving children were still on ventilators. A demographic difference between survivors and non-survivors was not observed but the PIM2 score was worse as expected in non-survivors (Table 1).
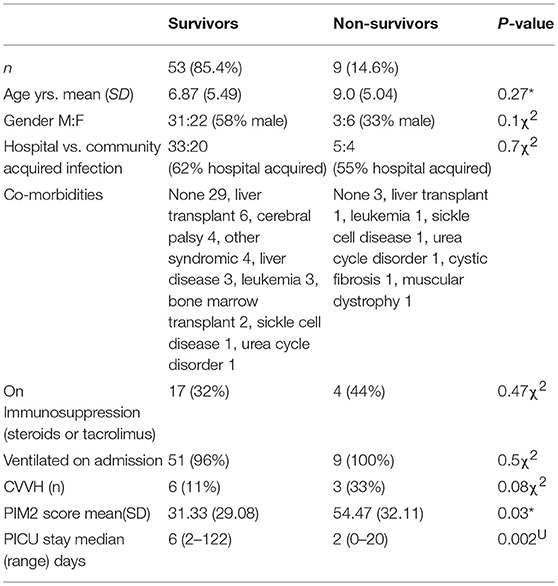
Table 1. Demographic data of survivors vs. non-survivors (*t-test, χ2 chi sq, UMann Whitney U-test).
Fifty-nine (95%) had a positive bacterial blood culture (Vancomycin Resistant E coli 2, Pneumococcal 3, Staph Aureus 12, MRSA 1, Pseudomonas 4, Coag Neg staph 7, E coli 10, Enterococcus 2, Streptococcus 7, Klebsiella 8, and Meningococcal 3). At 28 days, 9 (14.5%) children were dead. Of these, 6 (2/3rd) died within the first 42 h of admission to the PICU. Fourteen (26%) of the survivors and 4 (44%) of the non-survivors had a Hickman line in situ.
Their progression of CI, SVRI and the use of inotropes and vasopressors are shown in Figures 1A,B and Table 2. The CI values during the 42-h study period on average were significantly higher amongst survivors compared to non-survivors [mean (SD), 4.8 (1.4) vs. 3.9 (2.1) l/min/m2, ANOVA F = 16.8, p < 0.001]. The SVRI values recorded during the 42 h study period were also significantly higher amongst survivors compared to non-survivors [mean (SD), 889.9 (201.6) vs. 827.8 (254.9) dyne s/cm5/m2, ANOVA F = 4.2, p < 0.03]. The evolution trends of DO2I and VO2I are shown in Figure 2. The mean DO2I was consistently above 600 ml/min/m2 in survivors [mean (SD), 659.5 (210.9) vs. that of non-survivors 485.3 (255.5) mls/min/m2, ANOVA F = 30.5, p < 0.001]. The concurrent VO2I reduced with time in survivors (Figure 2). The initial gO2ER was elevated in all (expected normal 0.25 – 0.3) but gradually reduced with minimal variability in survivors. In contrast, the gO2ER remained high amongst non-survivors (Figure 3). The widening variability was due to loss of numbers with time. The gO2ER correlated with SpO2-ScvO2 gap; r = 0.98 (P < 0.0001) and r = 0.93 (p < 0.0001) amongst survivors and non-survivors respectively.
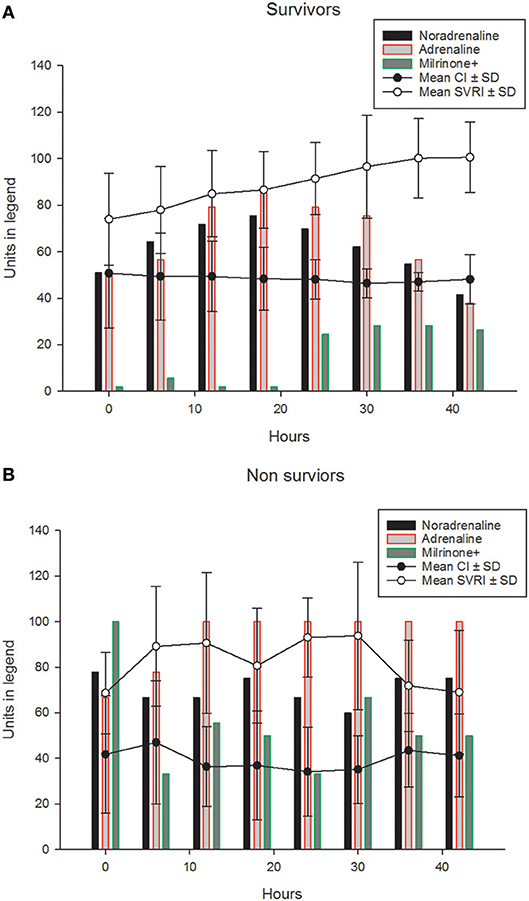
Figure 1. The (mean ±SD) progression of CIx10 l/ min/m2 (line graph) and SVRI÷10dyne s/cm5/m2 (line graph) and the percentages of children (bar graphs) receiving, adrenaline, noradrenaline and milrinone (±other vasopressors such as Terlipressin) during the first 42 h in (A) survivors. The (mean ±SD) progression of CIx10 l/min/m2 (line graph) and SVRI÷10dyne s/cm5/m2 (line graph) and the percentages of children (bar graphs) receiving, adrenaline, noradrenaline and milrinone (±other vasopressors such as Terlipressin) during the first 42 h are shown in (B) non-survivors.
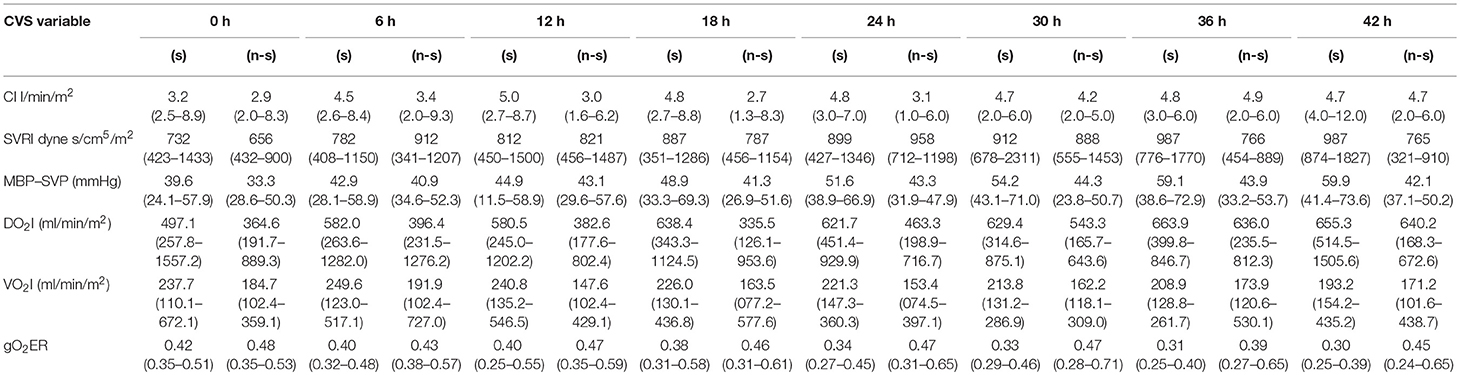
Table 2. Six hourly cardiovascular parameters of survivors (s) and non-survivors(n-s) described in median (range) (1 cmH2O = 0.735 mmHg).
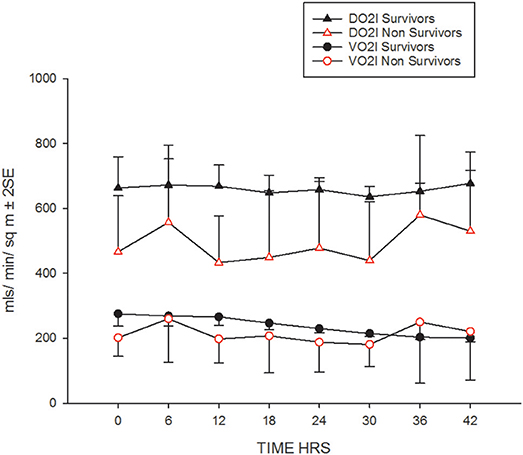
Figure 2. The evolution of DO2I and VO2I in the first 42 h.
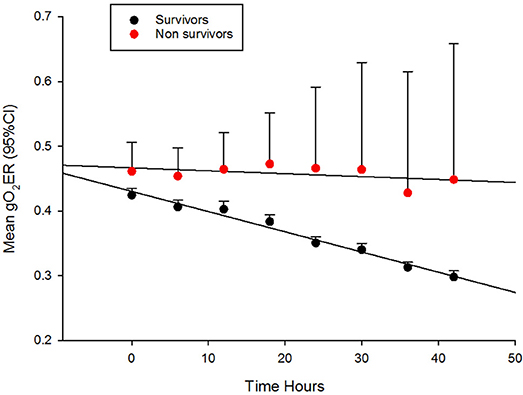
Figure 3. The evolution of global oxygen extraction ratio (gO2ER) in fluid refractory septic shock in children during the first 42 h of therapy in PICU.
The receiver operating characteristic (ROC) curve of the 6 h gO2ER values of all children observed during the first 42 h showed an area under the curve (AUC) of 0.76 against death. A gO2ER of 0.48 or above on admission to the PICU predicted death with a 66.7% sensitivity (95%CI 29.9–92.5) and 90.5% specificity (95%CI 79.3–96.8). The ROC curve of blood lactate levels of all children observed during the first 42 h at 6 hourly intervals against 28-day mortality also showed an AUC of 0.97. A lactate level of 4mmol/l or above, associated with a concurrent metabolic acidosis within the first 42 h of therapy linked to mortality with a sensitivity of 100% (95% CI 90.5–100) and a specificity of 67.7% (95% CI 62.2–72.9). However, the base excess alone was nonpredictive of the mortality risk (ROC AUC was 0.25) (see Figure 4).
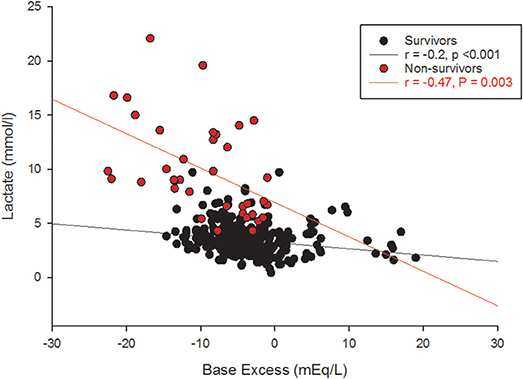
Figure 4. Lactate and base excess amongst survivors and non-survivors.
A global O2ER of >0.48 combined with a concurrent blood lactate >4.0 mmol/l at any time within the first 42 h of therapy predicted death with a sensitivity of 63.9% (95% CI, 46.2–79.1) but a specificity of 97.8% (95% CI, 95.7–99.0). The gO2ER significantly positively correlated with blood lactate (survivors r = +0.68, p < 0.001, non-survivors r = +0.74, p = 0.003) and negatively with base excess in survivors (r = −0.2, p < 0.001) but not in non-survivors (r = −0.15, p = 0.3).
Oxygen supply dependence graphs were generated for survivors and non-survivors (Figure 5). A critical DO2 was not demonstrable in these curves. The SpO2-ScvO2 gap had a significant negative correlation with CI (r = −0.16, p = 0.001) and SVRI (r = −0.28, p < 0.001) in survivors. However, SpO2-ScvO2 gap neither correlated with CI (r = −0.07, p = 0.5) nor with SVRI (r = −0.17, p = 0.2) in non-survivors.
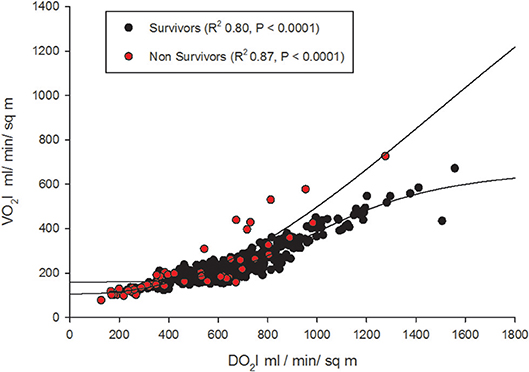
Figure 5. Oxygen supply-dependence graphs (with non-linear logistic regression curves) amongst survivors and non-survivors.
VO2I significantly positively correlated (2 tailed, Pearson) with CI (r = +0.817, p < 0.001) and negatively with SVRI (r = −0.542, P < 0.001). The overview radar plots of above clinical parameters drawn separately for survivors and non-survivors with the respective ± 2SE fills enabled visual recognition of the areas of disparity that needs attention to bring the non-survivor plot closer to that of survivors (Figure 6).
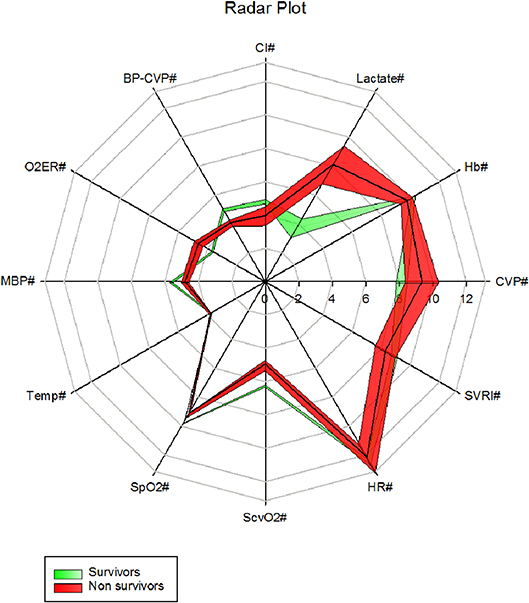
Figure 6. A radar plot showing mean ± 2SE area fills of 6 h first 42 h clinical parameters between survivors and non survivors (CVP# = CVP cmH2O, Hb# = Hb g/dl, Lactate# = Lactate mmol/l, CI# = CI l/min/m2, MBP-CVP# = [Mean BP- CVP/10]mmHg, gO2ER# = gO2ER x 10, MBP# = [mean BP/10] mmHg, Temp# = [Temperature /10]°C, SpO2# = [SpO2/10]%, ScvO2# = [ScvO2 x 10]%, HR# = [Heart rate/10] /min, SVRI# = [SVRI/100]dyne s/cm5/m2).
Neither the Hb on admission nor the body temperature was associated with outcome. The O2ER correlated with blood lactate levels (Figure 7).
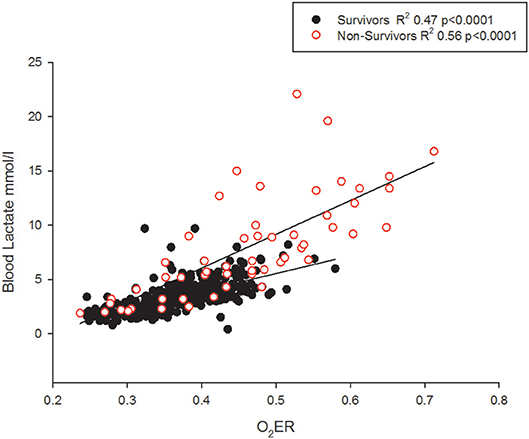
Figure 7. The O2ER and blood lactate correlate but non-survivors may demonstrate lower lactate levels.
Discussion
We have presented a comprehensive account of the cardiovascular parameters in a cohort of children in “fluid resistant” septic shock during the first 42 h of bundle therapy in intensive care. Their severity of illness is indicated by the PIM2 scores (20). The titration of inotropes and vasopressors during treatment was assisted by non-invasive 6 hourly cardiac output monitoring. The limitation of our study to 42 h was based on lack of data resulting from steadily receding need for inotropes (21) and clinicians deciding to taper off invasive monitoring and regular cardiac output measurements in children showing improvement. We also looked at the physiological variables that accounts for DO2 and its influence upon mortality and the reliability of ScvO2 as a therapeutic efficacy evaluation tool.
Critical DO2
The expected normal values for global DO2I and global VO2I are 500 ml /min/m2, and 150 ml/min/m2 respectively in adults (22). In the new born DO2I is high at birth reducing to a mean (SD) of 609 (141) ml/min/m2 at 3 days of age (23). We noted that global DO2I above 600 ml/min/m2 during the first 42 h of therapy in PICU was more likely to be associated with survival (Figure 2) in our cohort. A trial involving adult high-risk surgical postoperative patients too has identified a global DO2I above 600 ml/ min/m2 as critical for survival (24).
We could not demonstrate a critical DO2 in our cohort, especially non-survivors (Figure 5). This refers to the point at which the compensatory increase in O2 extraction is exhausted with the lowering DO2, and the VO2 becomes dependent on DO2 (25). This pathologic O2 supply dependency possibly results from loss of efficient tissue distribution of DO2 (26). In fact, this abnormal dependence of VO2 on DO2 and the absence of a critical DO2, may be the “hallmark” of fluid refractory septic shock state. In other words, tissue oxygen consumption is not met by the delivered oxygen despite maximum extraction leading to a state of chronic tissue oxygen debt. The longer this persists; more likely the shock state becomes irreversible as we have noted in our gO2ER plot of non-survivors (Figure 3). In adults too, VO2 dependency on DO2 is considered a marker of septic shock (27). It seems that clinically deliverable ranges of global DO2 achieved via current bundle therapies were insufficient to rectify this state of VO2 dependence on DO2 in our non-survivors. This observation is in agreement with that of recent epidemiological data showing children who die early from refractory septic shock, usually die of cardiovascular demise (28).
gO2ER
Upon admission to PICU, gO2ER was approximately 0.5 in most children (Figure 3). Thus, gO2ER was less sensitive in predicting mortality on admission. However, we noted a steady improvement in gO2ER toward normal levels (0.25–0.3) with a narrow 95% CI during the first 42 h of therapy along with a progressive reduction in global VO2I in survivors (Figure 2). In contrast, a persistently high mean gO2ER was observed in non-survivors (Figure 3) with a progressively widening 95% CI due to reduced number of data following the demise of some children. A gO2ER greater than 0.5 at 6 h was a recognized risk factor of death after cardiac operations in infants (29). We also observed that the first 42-h gO2ER value was independently associated with 28-day mortality (Figure 3).
In our cohort, a high gO2ER resulted from a disproportionately lower DO2 due to a lower CI especially amongst non-survivors (Figure 2). This might reflect an inability of the myocardium to respond to the demand i.e., a state of myocardial “stunning” alluded to mitochondrial dysfunction (30–32). Unmasking of myocardial weakness during treatment of septic shock is known (21). We observed that persistently high gO2ER and lack of attainment of critical DO2 in the initial phases of therapy may identify children in septic shock with chronic tissue oxygen debt progressing to an irreversible shock state and death. This suggests that early options of treatment above the standard is needed in the above sub-set of children, for example, inodilators such as milrinone or levosimendan, or even extracorporeal membrane oxygenation (ECMO) to attain critical DO2 and save life (33) (34). This is because our data suggest that the DO2 was far short of matching the oxygen need or consumption especially amongst non-survivors. In this context, gO2ER seems a valid and independent global estimate of the real time “efficacy” of O2 consumption in this clinical scenario and a tool to identify children at high risk of death although cellular oxygen uptake and utilization are not verifiable from global measurements (35).
ScvO2
When DO2 is insufficient to meet metabolic requirements, increased tissue oxygen extraction reduces oxygen content in effluent venous blood (16). Thus, a high SpO2-ScvO2 gap is a crude estimate of high oxygen consumption at tissue level. This explains its crude use as a marker of inadequate tissue perfusion and a therapeutic goal in critical care practice. We observed a strong correlation between SpO2-ScvO2 gap and gO2ER as expected.
It is also contemplated that ScvO2 may read higher when O2 consumption is reduced at capillary level (16–18). In other words, SpO2-ScvO2 gap should be lower in the presence of arterio-venous (A-V) shunting i.e., in severe sepsis. On the contrary, we observed that SpO2-ScvO2 gap significantly correlated negatively with CI and SVRI in survivors, i.e., with clinical improvement. But, it neither correlated with CI nor with SVRI in non-survivors. This suggested that ScvO2 had little monitoring value in children in whom it matters most i.e., in non-survivors. Although ScvO2 has been shown to be useful in guiding resuscitation (36), its validity in the resuscitated subjects remains a matter of controversy (37). Further, a reduction in ScVO2 when CI was < 3.3 as well as > 6.0 (l/m2/min) has been observed in pediatric septic shock (21). This may also explain why we cannot overcome flow dependence as CI increases in our cohort (Figure 5).
Lactate
Although lactate and base excess correlate, it's different between survivors and non-survivors (Figure 4). High lactate on hospital admission, and at 12 and 24 h in pediatric septic shock is reported to predict death (38). It appears that the risk of death was highest only when a metabolic acidosis (as detected by base excess) was present concurrently with a blood lactate level > 4 mmol (39). This is possibly because there were many other factors in addition to poor tissue perfusion contributing to the rise in blood lactate; for example, the use of adrenaline, renal impairment and liver dysfunction (40). This affirms that clinical and prognostic importance of an elevated lactate differs widely by disease state (39). In our study, gO2ER correlated positively with blood lactate (Figure 7), but lower levels of lactate amongst some non-survivors reduced its sensitivity in recognizing high mortality risk (Figure 7). This explains why a global O2ER of >0.48 combined with a concurrent blood lactate >4.0 mmol/l and a metabolic acidosis enhanced its sensitivity of assessing risk of death. The high O2ER together with metabolic acidosis makes the origin of lactate more likely from tissue anaerobic metabolism. Therefore, despite the confounding factors, we infer that gO2ER in combination with lactate can predict mortality with a significant sensitivity and specificity. However, negative base excess alone had no value in mortality prediction. Data to support or refute treatment of lactate acidosis with a buffer (sodium bicarbonate) or its clearance through dialysis in this scenario are scant (41).
Radar Plots
Our overview radar plot of cardiovascular variables was an attempt to recognize all vital parameters and therapeutic monitoring targets between non-survivors and survivors in a single figure (Figure 6). The use of mean ± 2 SE fills was an attempt to recognize what parameters may be significantly apart between the two populations i.e., surviving and non-surviving children presenting in fluid refractory septic shock. We presume that closing the gap in these parameters toward that of the survivors may improve chances of survival. The radar plot suggested areas of therapy that may be optimized. For example, increasing mean MBP-CVP gap by reducing the upper limit of CVP to 8 cm H2O, enhancing the lower limit of SVRI and increasing the cardiac index (by mechanical means) could be lifesaving if achieved concurrently. We have learned that fluids in excess of 40 mls/kg in resuscitation may improve survival in septic shock in children (42) but, overzealous use may be detrimental (43). A CVP of 8 cm H2O or below has been linked to lowest mortality in septic shock (43).
Limitations of This Study
The retrospective nature of our study limits its value, but all data used in this study has been prospectively collected in real-time and validated (i.e., authenticated and saved by the supervising nurse daily) and archived electronically in the “MetaVision” (Clinical Information System) database of the PICU. Thus, inherent errors of retrospective clinical studies based on paper records were minimized.
Another limitation of our study was ScvO2. Historically, site dependent measurement errors have rendered ScvO2 less valuable. Since ScvO2 can vary due to preferential blood flow patterns of superior vena cava (SVC) and inferior vena cava (IVC) (17, 44) and admixture of highly desaturated coronary blood flow, the ScvO2 may not reflect true oxygen consumption. In children with septic shock, low CI is generally associated with lower ScvO2; however, ScvO2 may also remain less than 70% in normal and in high cardiac output states (e.g., in warm shock) (21).
Similarly, the use of peripheral perfusion dependent SpO2 as a surrogate marker of SaO2 could have underestimated the DO2I especially in cold shock states. However, the margin of error ensued is likely to be very small as our mean (SD) SpO2 was 96.1 (3.6). On the other hand, the use of ScvO2 in the calculation of VO2I may also have added a margin of error. ScvO2 is more variable than SvO2 and tends to be an over-estimate in critically ill patients (45). It is also observed to remain less than 70% in some children with normal and high CI in septic shock (21). Although ScvO2 is useful in guiding resuscitation (36), its validity in the resuscitated is controversial (37).
CI measurement by USCOM is also subject to wide variation. In order to minimize inter-observer variability, USCOM operators were certified competent by the author (AD) as advocated by previous researchers (46).
In severe sepsis states, changes in ScvO2 due to preferential blood flow pattern and microcirculatory shunting at tissue level are both contributors to gO2ER. Therefore, the persistently high gO2ER that we observe in this study as a predictor of death is a global crude reflector of not just oxygen consumption, but also inherent circulation abnormalities associated with severe sepsis including microcirculatory shunting.
A drawback is that gO2ER cannot be used worldwide as CI is not measured at all PICUs and CI measurements have its own limitations (47, 48). However, our findings support its use in very specific conditions such as septic shock. This is in line with surviving sepsis guidelines emphasizing the early use of age-specific therapies to attain time-sensitive goals, specifically in the first hour of fluid resuscitation and inotrope therapy, and subsequent intensive care unit hemodynamic support (12).
Conclusion
We observe that absolute ScvO2, and base excess were less robust indicators of outcome during initial 42 h of therapy of “fluid resistant” pediatric septic shock. In contrast, global O2ER of >0.48 found concurrently with a blood lactate >4.0 mmol/l and metabolic acidosis seems a better independent predictor of death.
We conclude that trends of gO2ER may recognize survivors and non-survivors early in the illness. Although, further studies are required to assess the validity of this bedside measure, a non-improving gO2ER may justify implementation of extraordinary measures of therapy such as mechanical cardiac support and novel pharmacologic strategies early in pediatric septic shock.
Ethics Statement
This was an observational study of routinely monitored clinical parameters in septic shock in the PICU. No patient identifiable data was stored. Therefore, according to the local guidance the study was registered as a service evaluation project at King's College Hospital, London (Clinical Audit Support System (CASS) project no. 2902).
Author Contributions
All authors contributed to manuscript revision, read and approved the submitted version. AD led collection of data; CG performed the statistical analysis, prepared figures and tables and wrote the first draft of the manuscript and managed revisions. JC assisted interpretation of data in the clinical context and previous research findings.
Funding
Open access publication support from USCOM Australia Ltd.
Conflict of Interest Statement
The authors declare that the research was conducted in the absence of any commercial or financial relationships that could be construed as a potential conflict of interest.
Acknowledgments
The authors thank Dr. Abhinav Rastogi for assistance with data collection and Mr. Mahes Salgado for language scrutiny and all other medical and nursing staff of the Pediatric Intensive Care Unit for their overwhelming support.
Abbreviations
95% CI, ninety five percent confidence interval; ANOVA, analysis of variance; AUC, area under the curve; A-V, arterio-venous; CI, cardiac index; CO, cardiac output; CVP, central venous pressure; CVVH, continuous veno-venous hemofiltration; DO2, global oxygen delivery; DO2I, global oxygen delivery index; ECMO, extracorporeal membrane oxygenation; gO2ER, global oxygen extraction ratio; Hb, hemoglobin; IVC, inferior vena cava; MAP, mean arterial pressure; MBP, mean blood pressure; PICU, Pediatric Intensive Care Unit; PIM2, Pediatric index of mortality 2; RBC, Red blood cell; ROC, receiver operating characteristic curve; SaO2, oxygen saturation arterial blood; ScvO2, central venous oxygen saturation; SD, standard deviation; SE, standard error; SpO2, peripheral oxygen saturation; SVC, superior vena cava; SVRI, systemic vascular resistance index; USCOM, Ultrasonic Cardiac Output Monitor; VO2, global oxygen consumption; VO2I, global oxygen consumption index; χ2, Chi square test.
References
1. Schlapbach LJ, Straney L, Alexander J, MacLaren G, Festa M, Schibler A, et al. Mortality related to invasive infections, sepsis, and septic shock in critically ill children in Australia and New Zealand, 2002-13: a multicentre retrospective cohort study. Lancet Infect Dis. (2015) 15:46–54. doi: 10.1016/S1473-3099(14)71003-5
2. Goldstein B, Giroir B, Randolph A, International consensus conference on pediatric S. International pediatric sepsis consensus conference: definitions for sepsis and organ dysfunction in pediatrics. Pediatr Crit Care Med. (2005) 6:2–8. doi: 10.1097/01.PCC.0000149131.72248.E6
3. Kawasaki T. Update on pediatric sepsis: a review. J Intensive care. (2017) 5:47. doi: 10.1186/s40560-017-0240-1
4. de Oliveira CF, de Oliveira DS, Gottschald AF, Moura JD, Costa GA, Ventura AC, et al. ACCM/PALS haemodynamic support guidelines for paediatric septic shock: an outcomes comparison with and without monitoring central venous oxygen saturation. Intensive Care Med. (2008) 34:1065–75. doi: 10.1007/s00134-008-1085-9
5. Textoris J, Fouche L, Wiramus S, Antonini F, Tho S, Martin C, et al. High central venous oxygen saturation in the latter stages of septic shock is associated with increased mortality. Crit Care. (2011) 15:R176. doi: 10.1186/cc10325
6. Haase N, Perner A. Central venous oxygen saturation in septic shock–a marker of cardiac output, microvascular shunting and/or dysoxia? Crit Care. (2011) 15:184. doi: 10.1186/cc10314
7. van Beest P, Wietasch G, Scheeren T, Spronk P, Kuiper M. Clinical review: use of venous oxygen saturations as a goal - a yet unfinished puzzle. Crit Care. (2011) 15:232. doi: 10.1186/cc10351
8. De Backer D, Orbegozo Cortes D, Donadello K, Vincent JL. Pathophysiology of microcirculatory dysfunction and the pathogenesis of septic shock. Virulence. (2014) 5:73–9. doi: 10.4161/viru.26482
9. Antonucci E, Fiaccadori E, Donadello K, Taccone FS, Franchi F, Scolletta S. Myocardial depression in sepsis: from pathogenesis to clinical manifestations and treatment. J Crit Care (2014) 29:500–11. doi: 10.1016/j.jcrc.2014.03.028
10. Brilli RJ, Goldstein B. Pediatric sepsis definitions: past, present, and future. Pediatr Crit Care Med. (2005) 6(3 Suppl):S6–8. doi: 10.1097/01.PCC.0000161585.48182.69
11. Davis AL, Carcillo JA, Aneja RK, Deymann AJ, Lin JC, Nguyen TC, et al. American College of critical care medicine clinical practice parameters for hemodynamic support of pediatric and neonatal septic shock. Crit Care Med. (2017) 45:1061–93. doi: 10.1097/CCM.0000000000002425
12. Brierley J, Carcillo JA, Choong K, Cornell T, Decaen A, Deymann A, et al. Clinical practice parameters for hemodynamic support of pediatric and neonatal septic shock: 2007 update from the American College of Critical Care Medicine. Crit Care Med. (2009) 37:666–88. doi: 10.1097/CCM.0b013e31819323c6
13. Cattermole GN, Leung PYM, Mak PSK, Chan SSW, Graham CA, Rainer TH. The normal ranges of cardiovascular parameters in children measured using the ultrasonic cardiac output monitor. Crit Care Med. (2010) 38:1875–81. doi: 10.1097/CCM.0b013e3181e8adee
14. Heerman WJ, Doyle T, Churchwell KT, Mary B. Accuracy of non-invasive cardiac output monitoring (Uscom). Crit Care Med. (2006) 34:A61. doi: 10.1097/00003246-200612002-00214
15. Lebecque P, Shango P, Stijns M, Vliers A, Coates AL. Pulse oximetry versus measured arterial oxygen saturation: a comparison of the Nellcor N100 and the Biox III. Pediatr Pulmonol. (1991) 10:132–5. doi: 10.1002/ppul.1950100216
16. Shepherd SJ, Pearse RM. Role of central and mixed venous oxygen saturation measurement in perioperative care. Anesthesiology. (2009) 111:649–56. doi: 10.1097/ALN.0b013e3181af59aa
17. Rivers EP, Ander DS, Powell D. Central venous oxygen saturation monitoring in the critically ill patient. Curr Opin Crit Care. (2001) 7:204–11. doi: 10.1097/00075198-200106000-00011
18. Weil MH, Afifi AA. Experimental and clinical studies on lactate and pyruvate as indicators of the severity of acute circulatory failure (shock). Circulation (1970) 41:989–1001. doi: 10.1161/01.CIR.41.6.989
19. Linden A. Measuring diagnostic and predictive accuracy in disease management: an introduction to receiver operating characteristic (ROC) analysis. J Eval Clin Prac. (2006) 12:132–9. doi: 10.1111/j.1365-2753.2005.00598.x
20. Steil GM, Eckstein OS, Caplow J, Agus MS, Walsh BK, Wong J. Non-invasive cardiac output and oxygen delivery measurement in an infant with critical anemia. J Clin Monit Comput. (2011) 25:113–9. doi: 10.1007/s10877-011-9287-z
21. Deep A, Goonasekera CD, Wang Y, Brierley J. Evolution of haemodynamics and outcome of fluid-refractory septic shock in children. Intensive Care Med. (2013) 39:1602–9. doi: 10.1007/s00134-013-3003-z
22. Wolff CB. Normal cardiac output, oxygen delivery and oxygen extraction. Adv Exp Med Biol. (2007) 599:169–82. doi: 10.1007/978-0-387-71764-7_23
23. He SR, Sun X, Zhang C, Jian Z, Sun YX, Zheng ML, et al. Measurement of systemic oxygen delivery and inotropy in healthy term neonates with the Ultrasonic Cardiac Output Monitor (USCOM). Early Hum Develop. (2013) 89:289–94. doi: 10.1016/j.earlhumdev.2012.10.006
24. Shoemaker WC, Appel PL, Kram HB, Waxman K, Lee TS. Prospective trial of supranormal values of survivors as therapeutic goals in high-risk surgical patients. Chest. (1988) 94:1176–86. doi: 10.1378/chest.94.6.1176
25. Schumacker PT, Cain SM. The concept of a critical oxygen delivery. Intensive Care Med. (1987) 13:223–9. doi: 10.1007/BF00265110
26. Shoemaker WC. Relation of oxygen transport patterns to the pathophysiology and therapy of shock states. Intensive Care Med. (1987) 13:230–43. doi: 10.1007/BF00265111
27. Friedman G, De Backer D, Shahla M, Vincent JL. Oxygen supply dependency can characterize septic shock. Intensive Care Med. (1998) 24:118–23. doi: 10.1007/s001340050531
28. Weiss SL, Balamuth F, Hensley J, Fitzgerald JC, Bush J, Nadkarni VM, et al. The epidemiology of hospital death following pediatric severe sepsis: when, why, and how children with sepsis die. Pediatric Crit Care Med. (2017) 18:823–30. doi: 10.1097/PCC.0000000000001222
29. Rossi AF, Seiden HS, Gross RP, Griepp RB. Oxygen transport in critically ill infants after congenital heart operations. Ann Thorac Surg. (1999) 67:739–44. doi: 10.1016/S0003-4975(98)01255-7
30. Singer M. The role of mitochondrial dysfunction in sepsis-induced multi-organ failure. Virulence. (2014) 5:66–72. doi: 10.4161/viru.26907
31. Deutschman CS, Tracey KJ. Sepsis: current dogma and new perspectives. Immunity. (2014) 40:463–75. doi: 10.1016/j.immuni.2014.04.001
32. Weiss SL, Selak MA, Tuluc F, Perales Villarroel J, Nadkarni VM, Deutschman CS, et al. Mitochondrial dysfunction in peripheral blood mononuclear cells in pediatric septic shock. Pediatr Crit Care Med. (2015) 16:e4–12. doi: 10.1097/PCC.0000000000000277
33. Sachdev A, Mehra B, Mohanty A, Gupta D, Gupta N. Refractory pediatric cardiogenic shock: a case for mechanical support. Indian J Crit Care Med. (2016) 20:680–3. doi: 10.4103/0972-5229.194012
34. Walley KR. Sepsis-induced myocardial dysfunction. Curr Opin Crit Care. (2018) 24:24. doi: 10.1097/MCC.0000000000000507
35. Leach RM, Treacher DF. The pulmonary physician in critical care 2: oxygen delivery and consumption in the critically ill. Thorax. (2002) 57:170–7. doi: 10.1136/thorax.57.2.170
36. Rivers E, Nguyen B, Havstad S, Ressler J, Muzzin A, Knoblich B, et al. Early goal-directed therapy in the treatment of severe sepsis and septic shock. N Engl J Med. (2001) 345:1368–77. doi: 10.1056/NEJMoa010307
37. Varpula M, Karlsson S, Ruokonen E, Pettila V. Mixed venous oxygen saturation cannot be estimated by central venous oxygen saturation in septic shock. Intensive Care Med. (2006) 32:1336–43. doi: 10.1007/s00134-006-0270-y
38. Jat KR, Jhamb U, Gupta VK. Serum lactate levels as the predictor of outcome in pediatric septic shock. Indian J Crit Care Med. (2011) 15:102–7. doi: 10.4103/0972-5229.83017
39. Andersen LW, Mackenhauer J, Roberts JC, Berg KM, Cocchi MN, Donnino MW. Etiology and therapeutic approach to elevated lactate levels. Mayo Clinic Proc. (2013) 88:1127–40. doi: 10.1016/j.mayocp.2013.06.012
40. Scott HF, Brou L, Deakyne SJ, Fairclough DL, Kempe A, Bajaj L. Lactate clearance and normalization and prolonged organ dysfunction in pediatric sepsis. J Pediatr. (2016) 170:149-55.e1-4.
41. Hindman BJ. Sodium bicarbonate in the treatment of subtypes of acute lactic acidosis: physiologic considerations. Anesthesiology. (1990) 72:1064–76. doi: 10.1097/00000542-199006000-00018
42. Carcillo JA, Davis AL, Zaritsky A. Role of early fluid resuscitation in pediatric septic shock. J Am Med Assoc. (1991) 266:1242–5. doi: 10.1001/jama.1991.03470090076035
43. Boyd JH, Forbes J, Nakada TA, Walley KR, Russell JA. Fluid resuscitation in septic shock: a positive fluid balance and elevated central venous pressure are associated with increased mortality. Crit Care Med. (2011) 39:259–65. doi: 10.1097/CCM.0b013e3181feeb15
44. Lorentzen A-G, Lindskov C, Sloth E, Jakobsen C-J. Central venous oxygen saturation cannot replace mixed venous saturation in patients undergoing cardiac surgery. J Cardiothorac Vasc Anesth. (2008) 22:853–7. doi: 10.1053/j.jvca.2008.04.004
45. Reinhart K, Kuhn H-J, Hartog C, Bredle DL. Continuous central venous and pulmonary artery oxygen saturation monitoring in the critically ill. Intensive Care Med. (2004) 30:1572–8. doi: 10.1007/s00134-004-2337-y
46. Tan HL, Pinder M, Parsons R, Roberts B, van Heerden PV. Clinical evaluation of USCOM ultrasonic cardiac output monitor in cardiac surgical patients in intensive care unit. Br J Anaesth. (2005) 94:287–91. doi: 10.1093/bja/aei054
47. Lavdaniti M. Invasive and non-invasive methods for cardiac output measurement. Int J Caring Sci. (2008) 1:112–7. Available online at: https://core.ac.uk/download/pdf/26188351.pdf
48. Schubert S, Schmitz T, Weiss M, Nagdyman N, Huebler M, Alexi-Meskishvili V, et al. Continuous, non-invasive techniques to determine cardiac output in children after cardiac surgery: evaluation of transesophageal Doppler and electric velocimetry. J Clin Monit Comput. (2008) 22:299–307. doi: 10.1007/s10877-008-9133-0
Keywords: septic shock, children, oxygen delivery, oxygen consumption, mortality
Citation: Goonasekera CDA, Carcillo JA and Deep A (2018) Oxygen Delivery and Oxygen Consumption in Pediatric Fluid Refractory Septic Shock During the First 42 h of Therapy and Their Relationship to 28-Day Outcome. Front. Pediatr. 6:314. doi: 10.3389/fped.2018.00314
Received: 15 August 2018; Accepted: 03 October 2018;
Published: 23 October 2018.
Edited by:
Paolo Biban, Azienda Ospedaliera Universitaria Integrata Verona, ItalyReviewed by:
Dincer Riza Yildizdas, Çukurova University, TurkeyAsha N. Shenoi, University of Kentucky, United States
Stephen W. Standage, Cincinnati Children's Hospital Medical Center, United States
Copyright © 2018 Goonasekera, Carcillo and Deep. This is an open-access article distributed under the terms of the Creative Commons Attribution License (CC BY). The use, distribution or reproduction in other forums is permitted, provided the original author(s) and the copyright owner(s) are credited and that the original publication in this journal is cited, in accordance with accepted academic practice. No use, distribution or reproduction is permitted which does not comply with these terms.
*Correspondence: Akash Deep, akash.deep@nhs.net