
94% of researchers rate our articles as excellent or good
Learn more about the work of our research integrity team to safeguard the quality of each article we publish.
Find out more
ORIGINAL RESEARCH article
Front. Oncol. , 16 October 2020
Sec. Skin Cancer
Volume 10 - 2020 | https://doi.org/10.3389/fonc.2020.581985
This article is part of the Research Topic Advancements in Molecular Diagnosis and Treatment of Melanoma View all 19 articles
 Yanjie Han1*
 Xinxin Li1Jiliang Yan1Chunyan Ma1Xin Wang1Hong Pan1Xiaoli Zheng2Zhen Zhang1Biao Gao1Xin-Ying Ji3*
Melanoma is the deadliest skin tumor and is prone to distant metastases. The incidence of melanoma has increased rapidly in the past few decades, and current trends indicate that this growth is continuing. This study was aimed to explore the molecular mechanisms of melanoma pathogenesis and discover underlying pathways and genes associated with melanoma. We used high-throughput expression data to study differential expression profiles of related genes in melanoma. The differentially expressed genes (DEGs) of melanoma in GSE15605, GSE46517, GSE7553, and the Cancer Genome Atlas (TCGA) datasets were analyzed. Differentially expressed genes (DEGs) were identified by paired t-test. Then the DEGs were performed cluster and principal component analyses and protein–protein interaction (PPI) network construction. After that, we analyzed the differential genes through bioinformatics and got hub genes. Finally, the expression of hub genes was confirmed in the TCGA databases and collected patient tissue samples. Total 144 up-regulated DEGs and 16 down-regulated DEGs were identified. A total of 17 gene ontology analysis (GO) terms and 11 pathways were closely related to melanoma. Pathway of pathways in cancer was enriched in 8 DEGs, such as junction plakoglobin (JUP) and epidermal growth factor receptor (EGFR). In the PPI networks, 9 hub genes were obtained, such as loricrin (LOR), filaggrin (FLG), keratin 5 (KRT5), corneodesmosin (CDSN), desmoglein 1 (DSG1), desmoglein 3 (DSG3), keratin 1 (KRT1), involucrin (IVL), and EGFR. The pathway of pathways in cancer and its enriched DEGs may play important roles in the process of melanoma. The hub genes of DEGs may become promising melanoma candidate genes. Five key genes FLG, DSG1, DSG3, IVL, and EGFR were identified in the TCGA database and melanoma tissues. The results suggested that FLG, DSG1, DSG3, IVL, and EGFR might play important roles and potentially be valuable in the prognosis and treatment of melanoma. These hub genes might well have clinical significance as diagnostic markers.
Melanoma is the most lethal tumor of skin tumors, and prone to distant metastasis (1, 2). The incidence of melanoma has increased rapidly over the past few decades, and current trends indicate that this growth has still been continuing (3–5). Despite encouraging trends related to improved screening and the introduction of new therapies, melanoma remains a major public health problem (6, 7). In 2020, there were approximately 100,350 newly diagnosed melanomas and 6850 deaths worldwide (8).
There are currently an estimated 1.2 million melanoma survivors in the United States alone (9). While many previous studies have examined factors associated with survival (10–13), exhaustive research on the pathogenic genes and markers of melanoma pathogenicity remain scarcely. Data on tumor markers of melanoma can generate important information that can guide treatment, monitoring plans, and point the way for future melanoma research.
In recent years, microarrays and high-throughput sequencing technologies that detect the expression levels of tens of millions of genes in humans have been widely used to predict potential targets for melanoma treatment (14, 15).
Most current studies only focus on the results of a single genetic event or a single cohort study of melanoma (16–18). However, there is still no comprehensive multi-factor analysis and treatment method (19–21). In this study, we have compiled the GEO and TCGA databases in order to explore the key genes and prognostic indicators of melanoma as comprehensively as possible. Our results will promote our cognition of the genetic etiology of melanoma and provide new insights into the clinical diagnosis and treatment of melanoma.
We conducted a search of Gene Expression Omnibus (GEO: https://www.ncbi.nlm.nih.gov/geo/) for high-throughput functional genomics experiments of melanoma. GSE15605, GSE46517, and GSE7553 themicroarray expression profiling datasets were downloaded from Gene Expression Omnibus. These datasets were based on GPL570, GPL96, GPL570 Affymetrix Human Genome Array Platform, respectively. We used the following search terms: melanoma, primary melanoma, metastasis melanoma and skin cutaneous melanoma. Datasets were screened for dataset record following the criteria: (1) samples contained melanoma and normal skin tissue, (2) study type was restricted to expression profiling by array, (3) organism was restricted to Homo sapiens, (4) original data were accessible. We excluded studies of less than five samples in each group. The gene expression profiles meeting inclusion criteria were selected from GEO database and TCGA (https://cancergenome.nih.gov/abouttcga/overview) database. In addition, RNASeqV2 data for cutaneous melanoma can be downloaded from the TCGA database. Both GEO and TCGA have significantly increased our understanding of cancer. One very evident advantage of GEO and TCGA is that data from different independent studies can be integrated to get a large number of clinical samples based on TCGA HNSC RNA-seq data and indicated good performance for predicting 5-year overall survival. This powerful prognostic marker was successfully verified in another independent patients cohort.
Robust multi-array average (RMA) approach was performed for background correction and normalization. Then, the original GEO data were converted into expression measures using Affy R package. Limma R package was subsequently employed for identifying DEGs. For TCGA data, edgeR package was used for DEGs screening. Adjusted p < 0.05 and (∣logFC fold change∣) >2 were chosen as the cut-off criteria based on Benjamini & Hochberg (BH) procedure (22). Intersect function in R was applied for identifying the common DEGs among GSE15605, GSE46517 and GSE7553 and TCGA. The Venn diagram was generated by Venn Diagram R package.
Gene ontology analysis (GO, http://www.geneontology.org/) was used to identify characteristic biological attributes for DEGs (23). Kyoto Encyclopedia of Genes and Genomes pathway (KEGG) enrichment analysis was performed to identify functional attributes for DEGs (24). We used online database for annotation, visualization and integrated discovery (DAVID) (25) and KEGG to access GO and pathway enrichment analysis. p < 0.05 was set as the cut-off criterion.
Functional interactions between proteins can provide support for elucidating the molecular mechanisms of disease processes. In our study, the search tool for the retrieval of interacting gene (STRING) (26) database was utilized to construct PPI network. In addition, Cytoscape software was applied to construct protein interaction relationship network (27).
The Cytoscape was performed to scale degree and closeness of the PPI network. The degree of a node is the average number of edges (interactions) incident to this node. The genes at the top of the degree distribution (≥ 95% percentile) in the significantly perturbed networks were defined as hub genes.
Module analysis of the PPI network was performed with the parameters of minimum size > 3 and P-Value < 0.01 using ClusterONE, a Cytoscape plugin that unified different clustering techniques and displayed them in a single interface.
Gene-level correlations with patient survival were featured in UALCAN (http://ualcan.path.uab.edu/analysis.html) (28). Available TCGA patient survival data were used for Kaplan–Meier survival analysis and to generate overall survival plots.
All clinical specimens used in this research were from the First Affiliated Hospital of Henan University, including 63 cases of melanoma tissues and matched adjacent normal skin tissues obtained from patients who underwent surgery for melanoma or other non-melanoma diseases. Histological diagnosis and tumor stage were determined with immunohistochemical method according to the 2004 World Health Organization guidelines for classification. Paraffin sections (4 μm) were stained overnight with rabbit anti-LOR, anti-FLG, anti-KRT5, anti-CDSN, anti-DSG1, anti-DSG3, anti-KRT1, anti-IVL and anti-EGFR antibody (1: 50; Abcam, UK) at 4°C. Secondary staining was then performed with HRP-conjugated anti-rabbit or anti-mouse IgG using the MaxVision kit and DAB Peroxidase Substrate Kit (Maixin, China). Finally, all slides were stained with hematoxylin. The irrelevant rabbit IgG was used as a control for the primary antibody. All of these were evaluated by assessing staining intensity and percentage of positive cells as follows: no staining (0), weak staining (1), moderate staining (2), and strong staining (3); percentage of positive cells <1% (0), 1–33% (1), 34–66% (2), and 67–100% (3). The two scores for each slide were then combined to produce a final grade of the protein of target gene expression(PTGE): 0, total score = 0; 1+, total score = 1–2; 2+, total score = 3–4; 3+, total score = 5–6. The average score is used when there exists a difference between the two pathologists. This study was approved by the local ethics committee and written informed consent was obtained from each patient.
According to the inclusion criteria, three GEO datasets and TCGA dataset were obtained in our study: GSE15605, GSE46517, GSE7553, and TCGA skin cutaneous melanoma data. DEGs 1,078, 407, 892, and 2,148 from the expression profile datasets GSE15605, GSE46517, GSE7553, and TCGA dataset were extracted, respectively. 160 consistently expressed genes were identified by Venn analysis (Figure 1). Among them, 144 genes were up-regulated while 16 were down-regulated compared to normal skin tissue (Table 1).
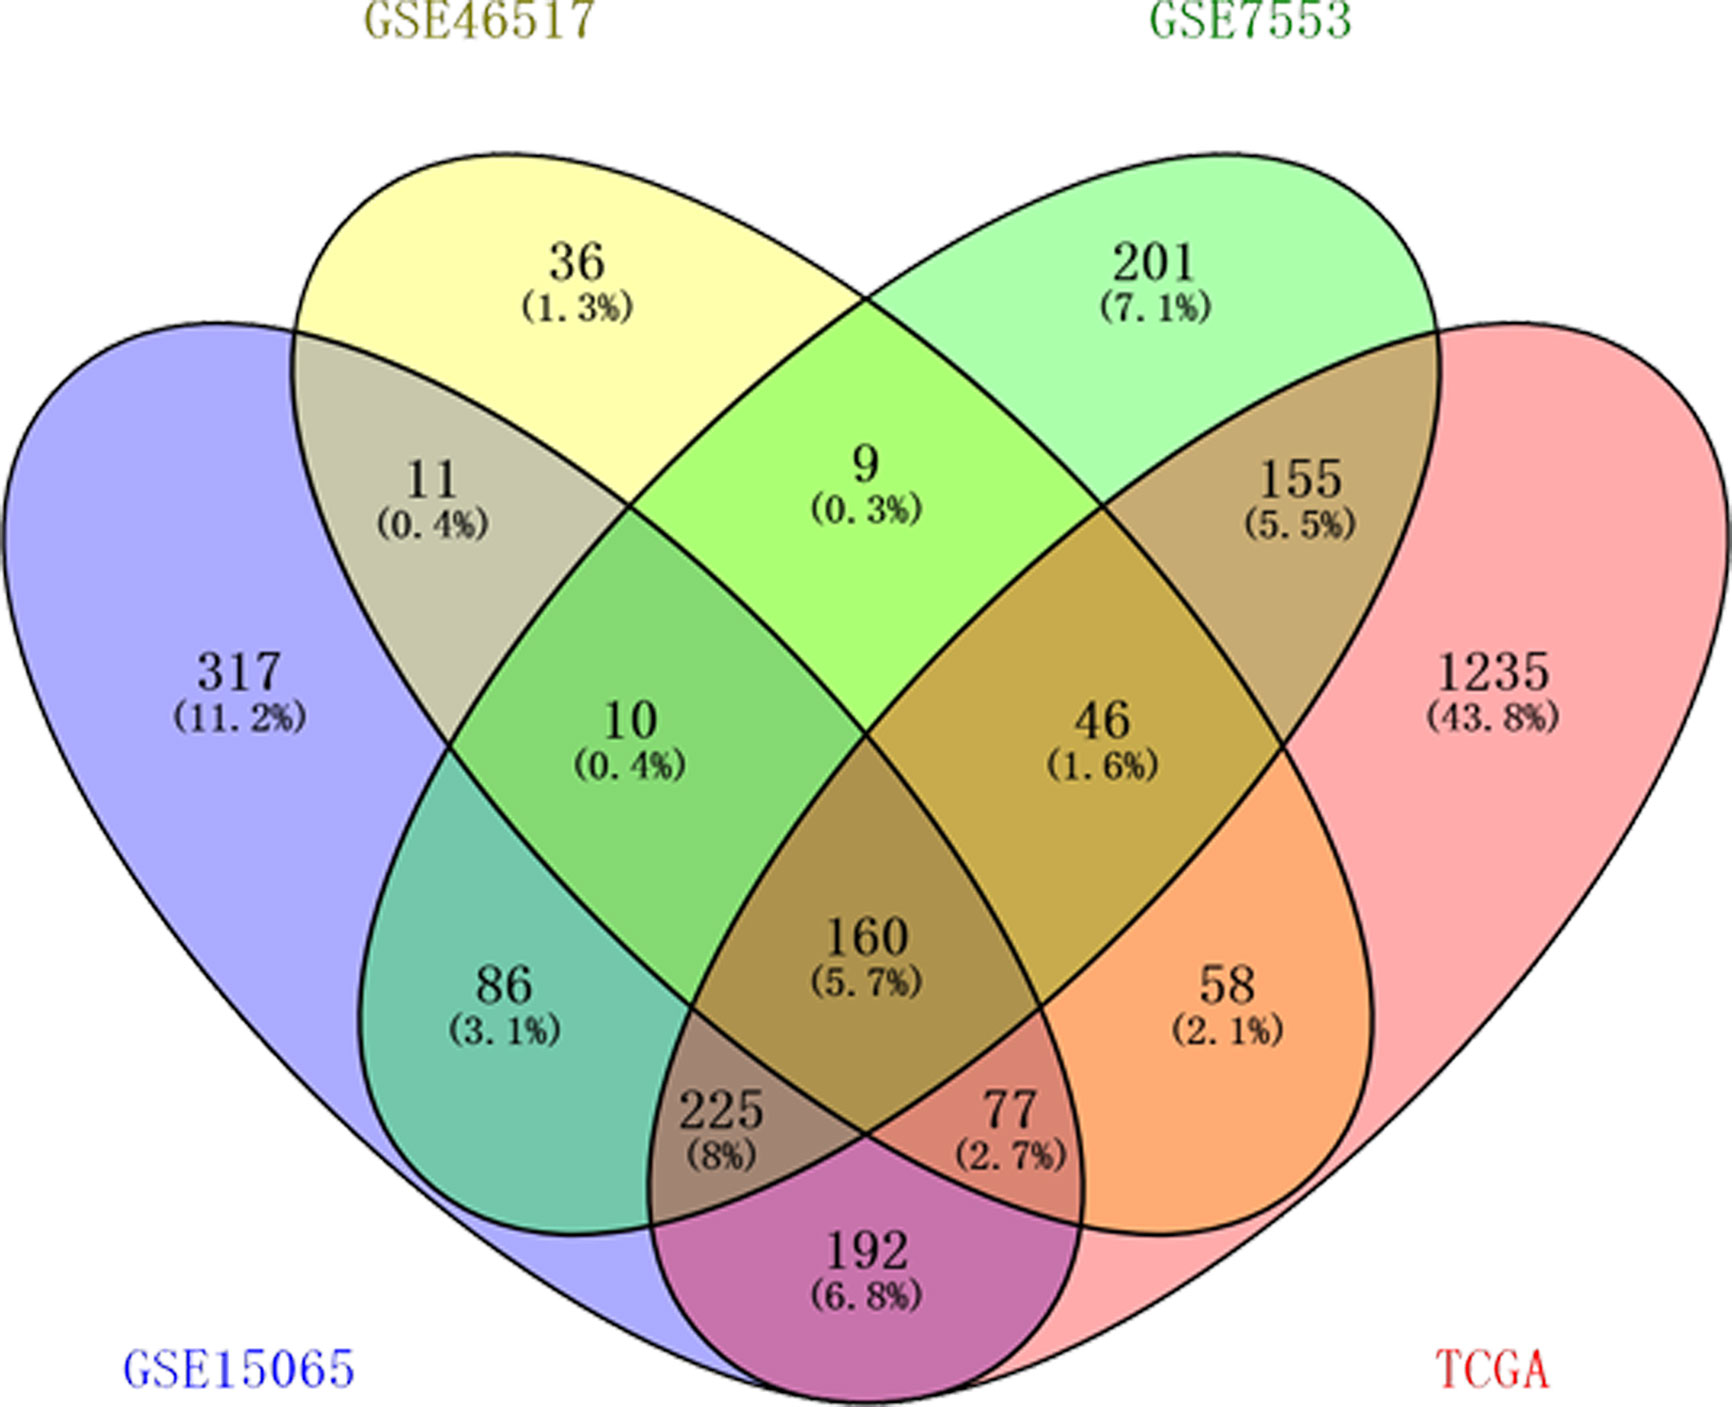
Figure 1 One hundred sixty differentially expressed genes (DEGs) were identified from four datasets. Among them, 144 genes were up-regulated while 16 genes were down-regulated. Different color areas represented different datasets. The cross areas meant the commonly changed DEGs.
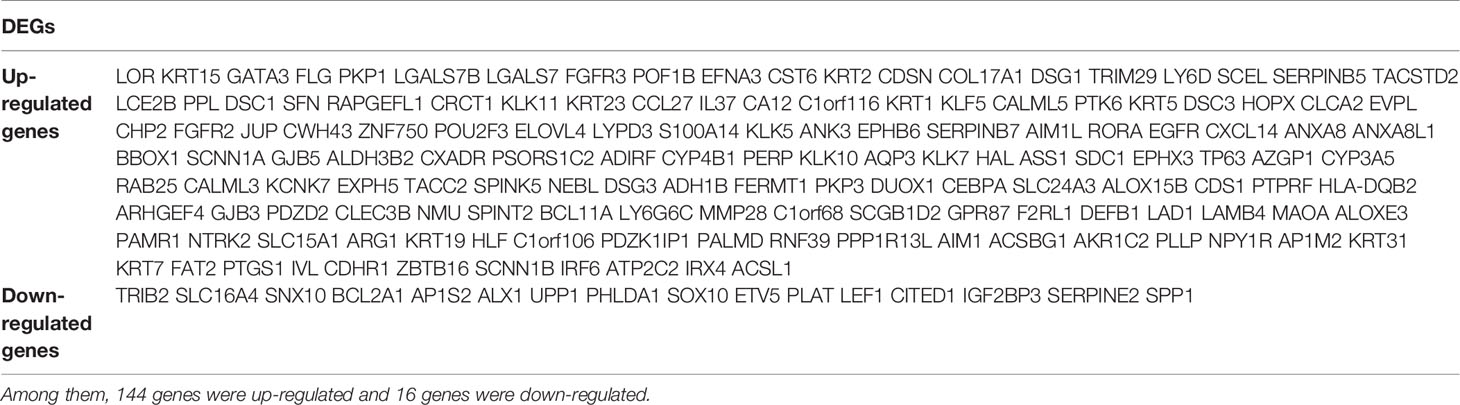
Table 1 160 differentially expressed genes (DEGs) were identified from datasets.
Gene ontology describes gene function and relationships between these concepts. P < 0.01 was used as the cut-off criterion. DEGs were classified into the biological process: pathways and larger processes made up of the activities of multiple gene products. After GO enrichment analysis, we found that 160 DEGs were enriched in 17 GO terms (biological process). Among them, the most enriched GO terms were epidermis development (p=1.88E-17), keratinocyte differentiation (p = 9.90E-10), keratinization (p = 3.40E-06) and establishment of skin barrier (p = 1.49E-05) (Figure 2).
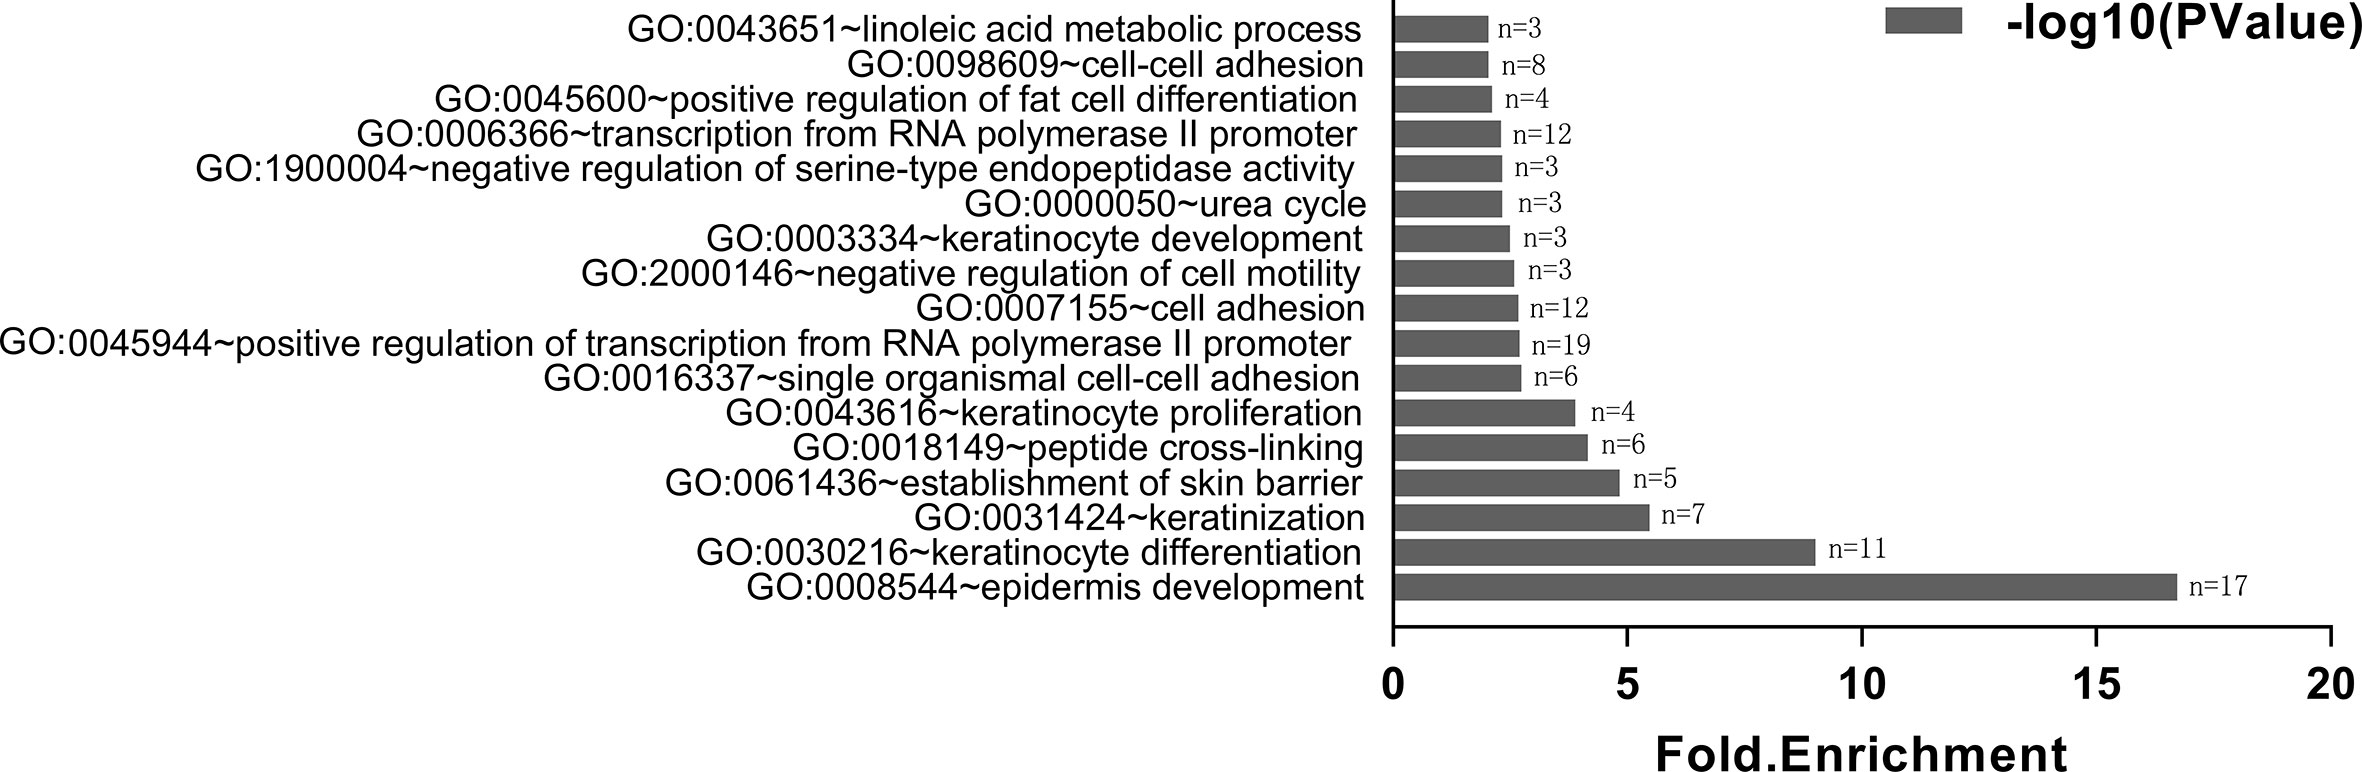
Figure 2 Gene ontology analysis of DEGs. X-axis reflects gene count (n); Y-axis reflects different GO terms. The column value reflects p value (− log10(P Value)): the highest bar represents the biggest − log10(P Value) value (*p < 0.01). We only show terms with p-values less than 0.01 in the figure.
Pathway enrichment analysis was carried out by online websites of KEGG, a database was applied to assign sets of DEGs to specific pathways. p < 0.05 was used as the cut-off criterion. After pathway enrichment analysis, we found that 160 DEGs were enriched in 11 pathways. Among them, DEGs were mainly enriched in the pathways in cancer (p = 0.03), transcriptional misregulation in cancer (p = 0.01), Rap1 signaling pathway (p = 0.02) and Ras signaling pathway (p = 0.03) (Figure 3).
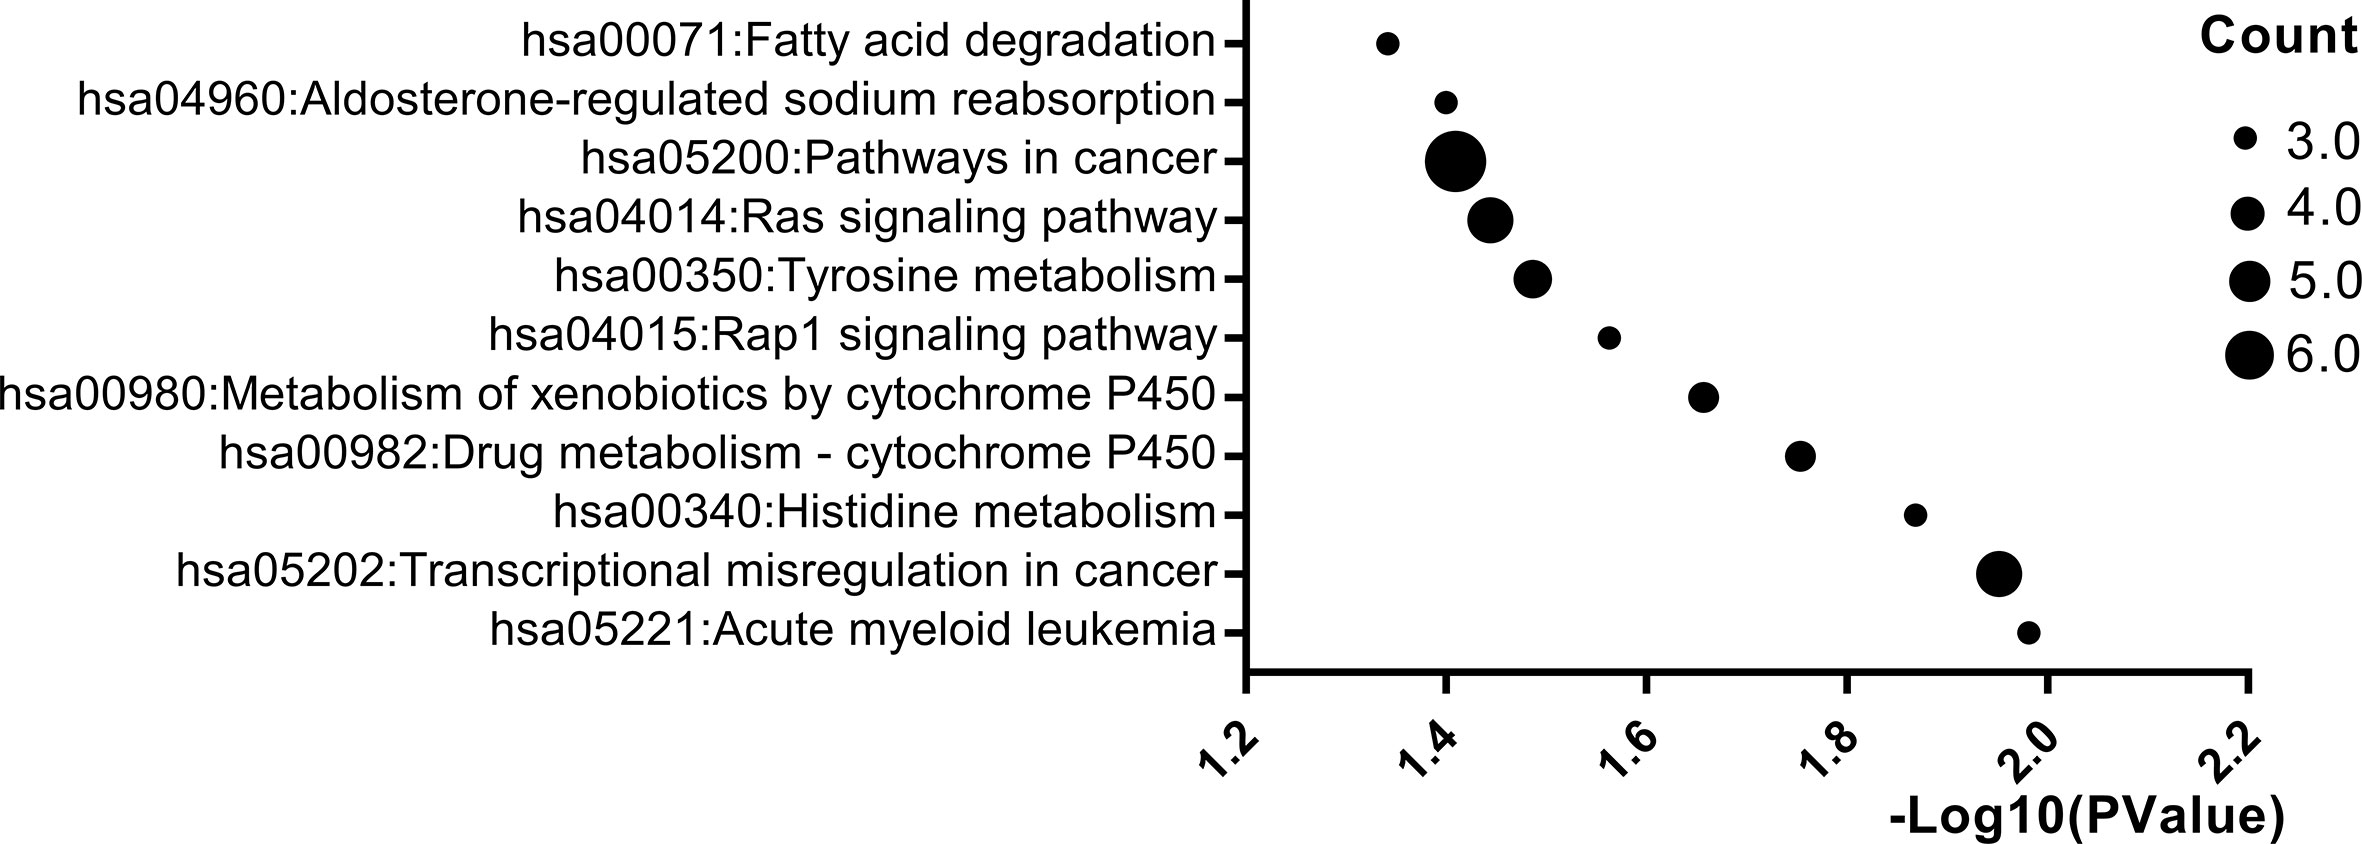
Figure 3 Significantly enriched pathway terms of DEGs. X-axis reflects p value [− log10(p value)]. Y-axis reflects different passway terms. The node size reflects gene count: the bigger the gene count, the bigger the node size is (*p < 0.05). We only showed items with p-values less than 0.05 in the figure.
We obtained a PPI network from STRING to describe protein interactions (Figure 4). Based on the information obtained from the STRING database, a PPI framework with 160 nodes and 385 edges was generated, and its local clustering coefficient was 0.45. The results of computed hub genes were shown in the Table 2, including LOR, FLG, KRT5, CDSN, DSG1, DSG3, KRT1, IVL, and EGFR.
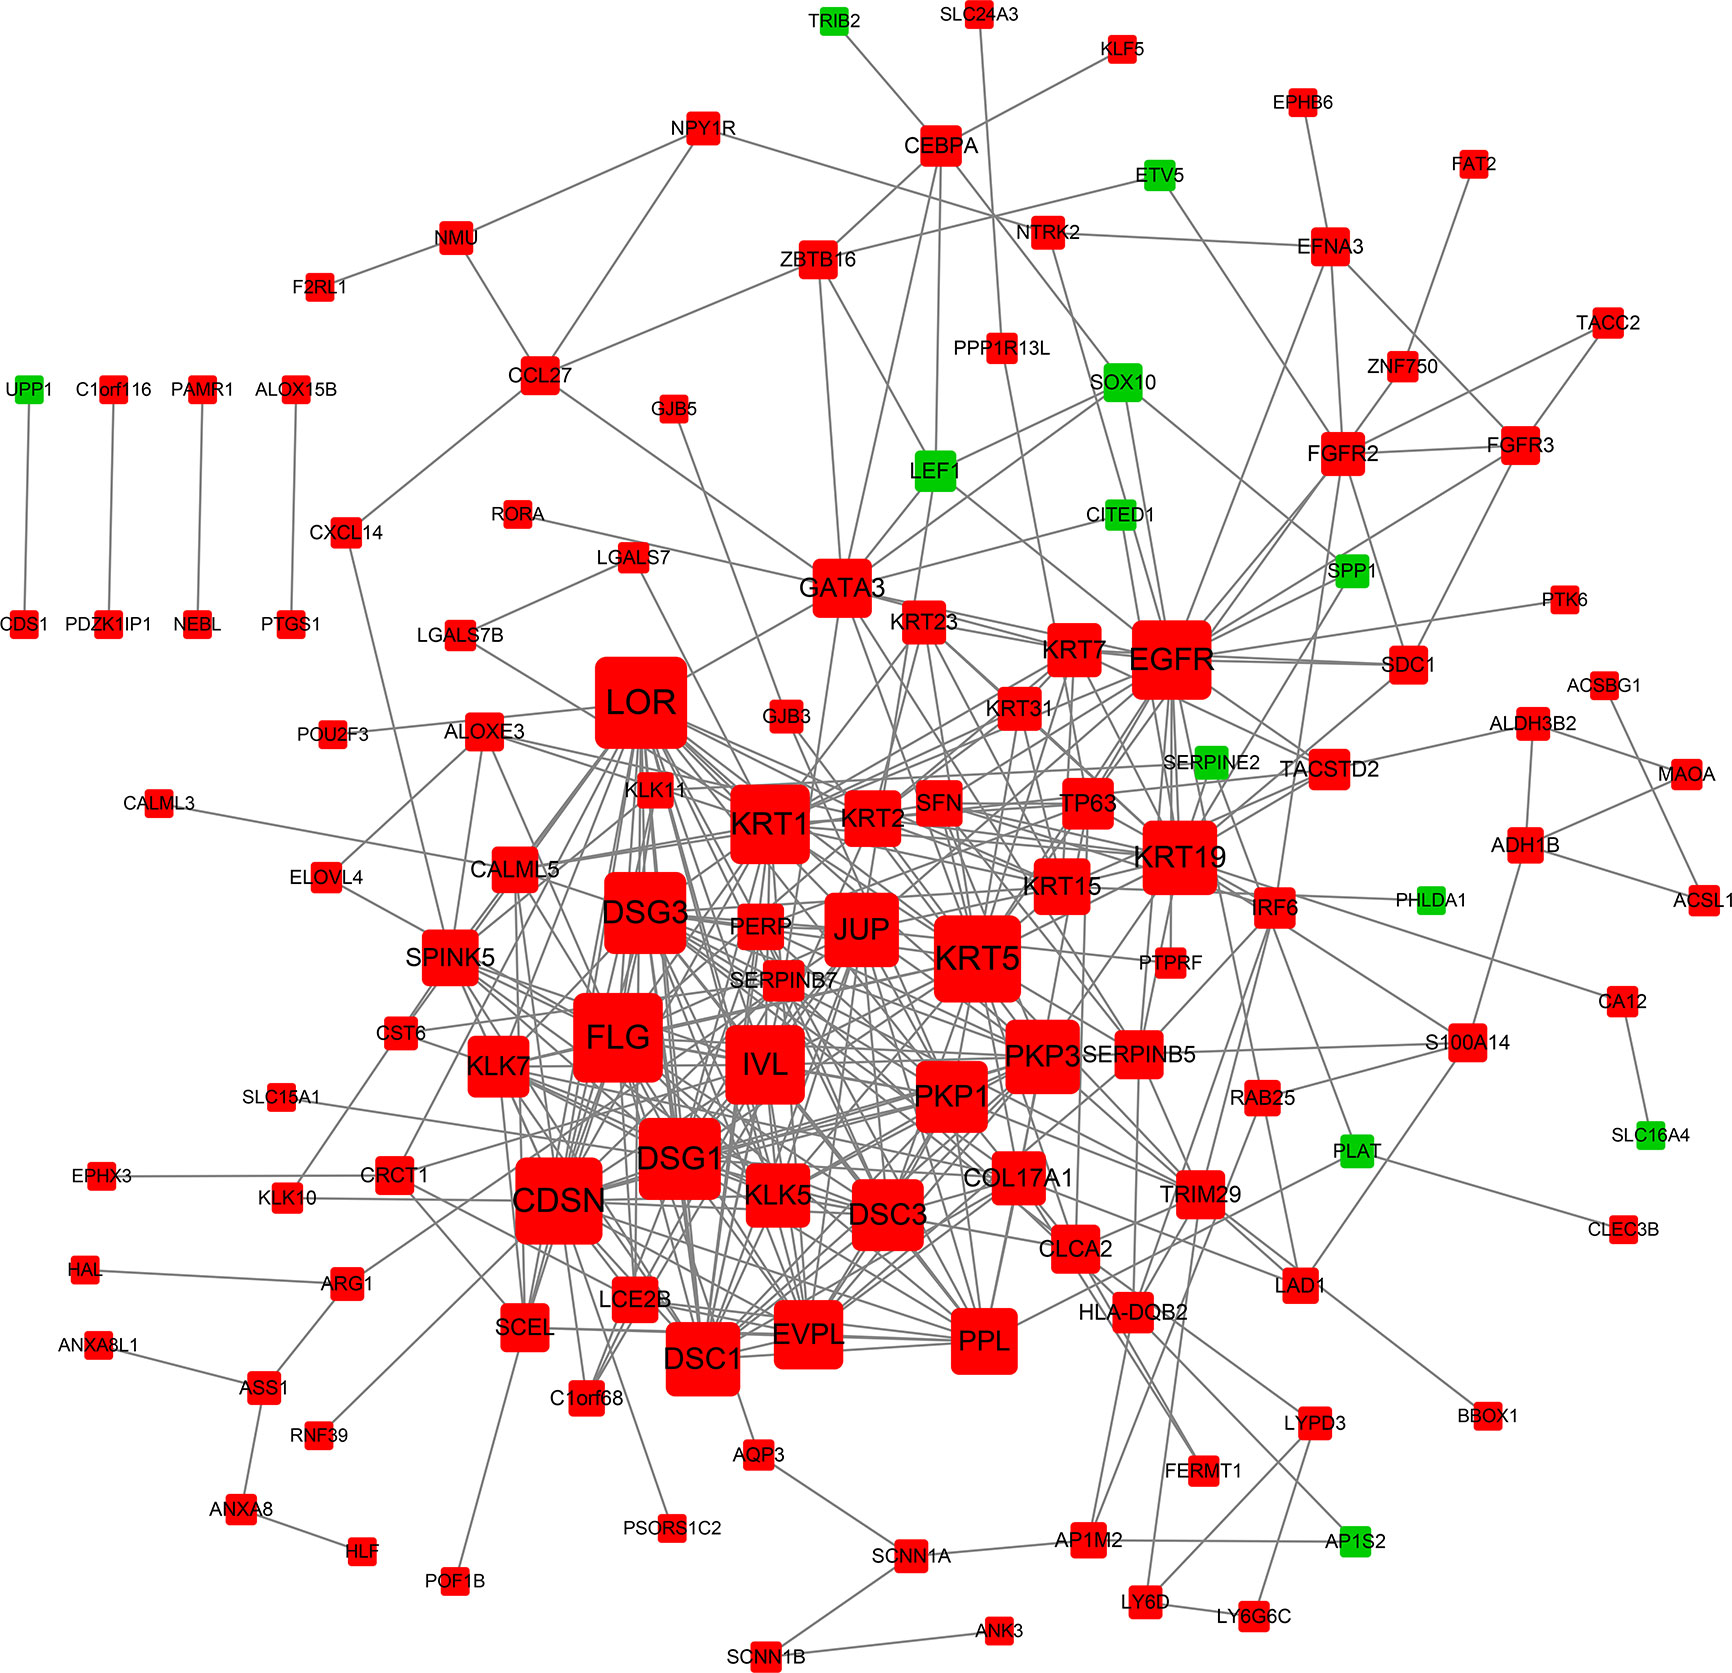
Figure 4 PPI network of DEGs. Each node is a differentially expressed gene (protein). A red node represents an up-regulated gene (protein). A green node represents a down-regulated gene (protein). The node size reflects node degree: the bigger the degree value, the bigger the node size is.
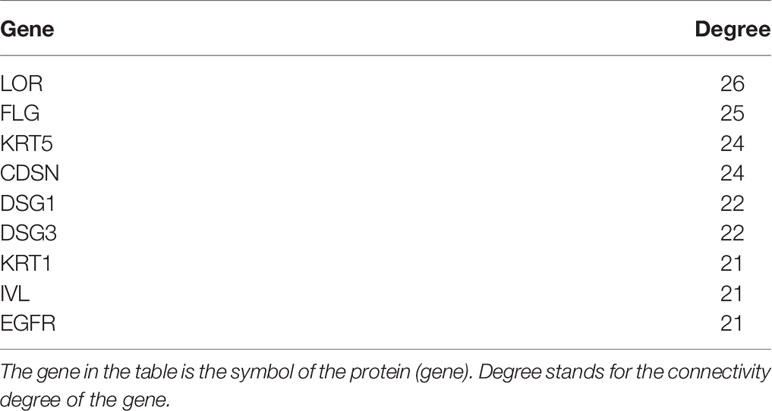
Table 2 The statistical results of connectivity degrees of the PPI network.
To study and identify the function of the overlapping DEGs in detail, cluster analysis of the PPI network was conducted based on the ClusterONE Cytoscape plugin, an important tool for the analysis of densely connected and possibly overlapping regions within the Cytoscape network, which would contribute to the classification of protein network and relevant analysis. There were a total of 23 functional modules given and the most significant module (node = 29, density = 0.4335, p-value = 1.01E-8, Figure 5A) was selected for further analysis of functions and pathways to deeply understand the melanoma progression. To further verify the accuracy of this inference, the module genes were submitted into DAVID to perform the KEGG pathway enrichment analysis. The results showed that they were significantly enriched in the renin secretion signaling pathway, epidermal development, keratinocyte differentiation, peptide cross-linking, keratinization and single biological cell adhesion, among other processes shown, p < 0.05 (Figure 5B).
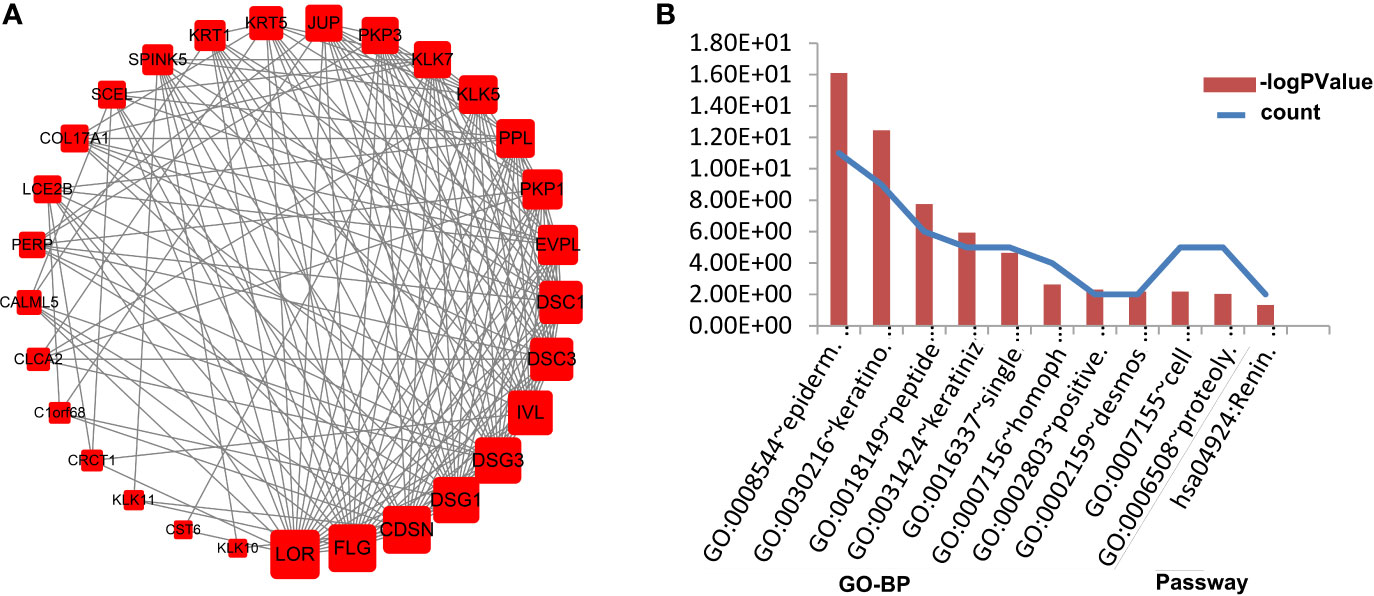
Figure 5 Functional enrichment analysis of the most important modules in PPI networks. The most significant module in the PPI network (A). Nodes stand for the proteins (genes), and edges stand for the interactions of proteins. The GO analysis of the most significant module (B). The left ordinate of histogram represents the gene counts, and the right represents the p-value. BP stands for biological process; and Pathway stands for cell signaling pathway.
Using UALCAN, we verified gene expression level of hub genes in 1 normal tissue, 104 primary tissues, and 368 metastasis tissues from TCGA database. Through this analysis, we found that LOR, FLG, KRT5, CDSN, DSG1, DSG3, KRT1, and IVL were closely related to the metastasis of melanoma (p < 0.01) (Figures 6A–I). Kaplan–Meier survival analyses showed that FLG, KRT5, DSG1, DSG3, and IVL expression levels were significantly associated with melanoma patient survival (p < 0.01) (Figures 6J–R).
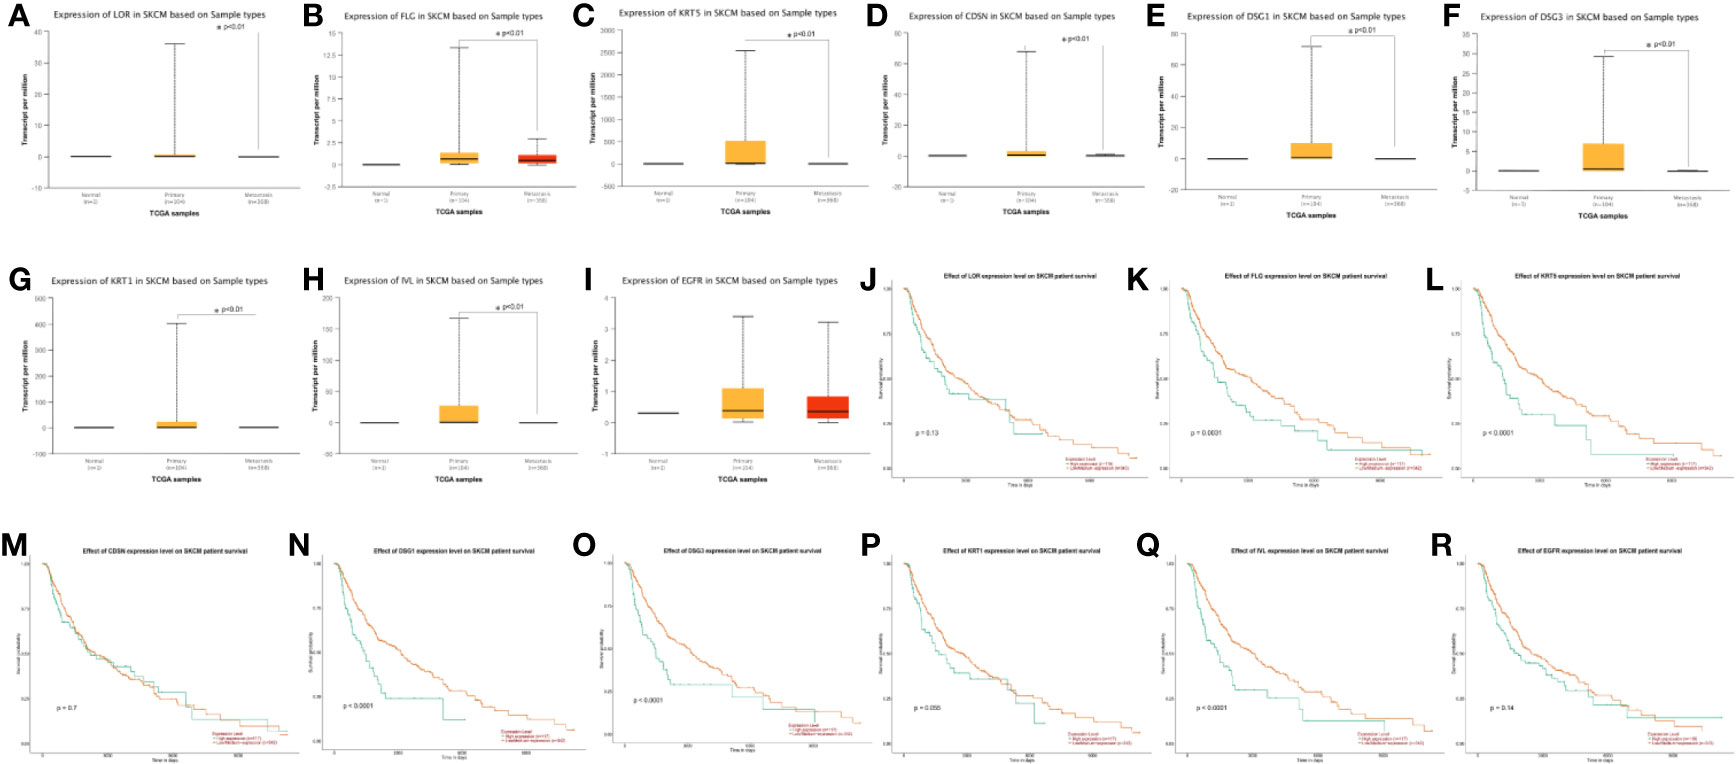
Figure 6 (A-I) Expression profile based on major sample types of hub genes using 473 patients data from TCGA database (*p < 0.01). (J-R) Kaplan-Meier survival plot of hub genes using 459 melanoma patients data from TCGA database (*p < 0.01).
In order to determine the expression of hub genes in human melanoma, we used immunohistochemical methods to detect the expression of the protein corresponding to hub genes. We detected the expression level of hub genes in 63 pairs of melanoma specimens (melanoma and adjacent normal tissue) by immunohistochemistry (Figure 7). The results showed that the expressions of FLG, DSG1, DSG3, IVL, and EGFR were considerably higher than those of adjacent normal tissues (P <0.05) (Figures 7B, E, F, H, I).
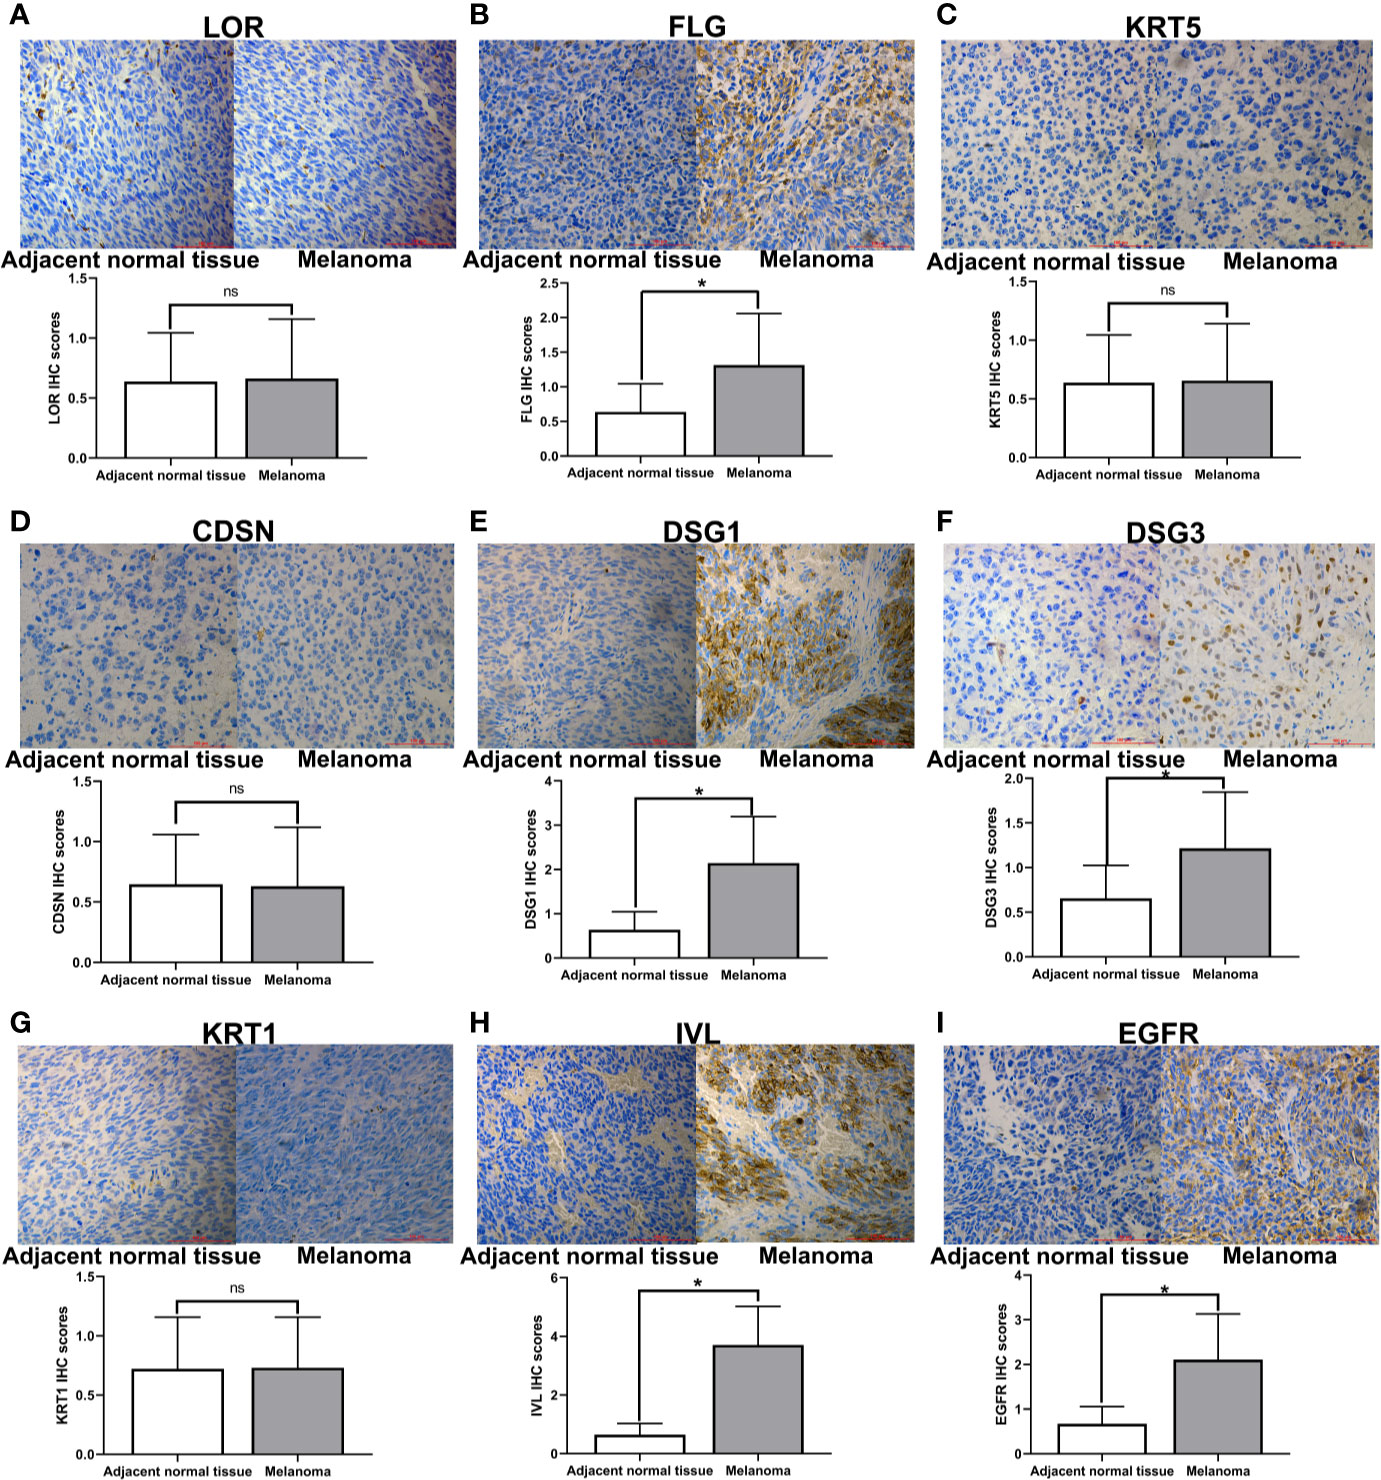
Figure 7 Immunohistochemical staining of hub genes in melanoma tissues and matched adjacent normal tissues. Representative examples of immunohistochemical assessment of hub genes (proteins) expression in melanoma tissues and matched adjacent normal tissues (magnification 200x), *p < 0.05 (ns, no significance).
Melanoma is a progressive disease that requires effective prognostic indicators for diagnosis and treatment. In recent years, effective computational models have been constructed to identify disease-related mRNAs. However, most research has focused on using cell lines or animal models to intervene at the level of a single gene, protein, or miRNA (29, 30). Some commercial genetic testing kits for multi-center joint testing are still not comprehensive enough and still have deficiencies, and cannot effectively serve the purpose of detecting and discovering melanoma (31). For example, for clinicians currently using DecisionDx-melanoma, the integration of the results with the new AJCC staging standard is not clear, especially if the results of the 31 gene expression profile tests are inconsistent with the sentinel lymph node biopsy status (31). In our study, we used high-throughput expression data to study differential expression profiles of related genes in melanoma. We analyzed tumor and normal skin samples from patients in the GEO and TCGA databases to explore abnormally expressed genes in melanoma. The results showed that 160 differentially expressed genes were selected, including 144 up-regulated genes and 16 down-regulated genes. Later, we identified hub genes and pathways in melanoma based on the use of bioinformatics methods. We integrated 4 original microarray datasets and identified 160 frequently changed DEGs. DEGs were mainly enriched in 17 biological processes by GO terms, of which epidermis development, keratinocyte differentiation, keratinization, and establishment of skin barrier were the most obvious. KEGG pathway enrichment analysis showed that DEGs were mainly enriched in 5 signaling pathways, of which pathways in cancer, transcriptional misregulation in cancer, Rap1 signaling pathway and Ras signaling pathway were the most significant. In particular, the pathway of pathways in cancer was enriched by 8 DEGs, such as EGFR and JUP. EGFR (degree = 21) and JUP (degree = 19) were important key node genes in the PPI network. The results of our study suggested that these genes and pathways may play critical roles in the progression of melanoma. For instance, EGFR, as an essential receptor of transforming growth factor alpha, has attracted widespread attention. Previous studies have found that the frequency of oncogenic mutations in the EGFR gene is closely related to the occurrence of melanoma (32–34). In addition, EGFR has been proposed as an important molecular target for the treatment of cancer, which has promoted the development of EGFR pharmacological inhibitors (35, 36). Therefore, we speculated that EGFR may be a candidate gene in pathways in cancer of melanoma. Further, we used the TCGA database to detect the expression of hub genes. However, the sample size of non-melanoma normal tissues in the TCGA database is too small, with only one normal sample. When comparing tumor samples to normal samples, small sample sizes may cause inaccuracies, and we only compare primary and metastatic melanomas. The results showed that the expression of LOR, FLG, KRT5, CDSN, DSG1, DSG3, KRT1, and IVL in these nine hub genes were significantly different. In addition, we also explored the survival analysis of hub genes through the TCGA database. The results of the survival analysis showed that FLG, KRT5, DSG1, DSG3, and IVL of the nine central genes were notably related to the survival time of patients. Finally, based on the survival analysis, we performed clinical specimen validation using immunohistochemistry. The results showed that the expressions of FLG, DSG1, DSG3, IVL, and EGFR were markedly higher than those of adjacent normal tissues. These studies indicated that we got the key genes FLG, DSG1, DSG3, IVL, and EGFR that could affect melanoma development. We further discussed hub genes expressed in melanoma patient tissues. Filaggrin, a highly abundant protein of the stratum corneum, draw considerable attention after the discovery of its role in the aetiology of atopic dermatitis (37). Currently, Kezic S. has reported that FLG may serve as a potential biomarker for a reduced risk of melanoma (38), however, there are limited reports about the associations between FLG and melanoma. Thus, we can speculate that FLG may also play an important role in the melanoma progression as well as EGFR. Desmoglein belongs to the cadherin family, DSG1 and DSG3 are both members, and its intracellular part binds to intracellular anchoring proteins (39, 40). Li G et al. found that desmoglein and E-cadherin together act as an adhesion between factors, especially when melanoma cells proliferate, the expression of desmoglein and E-cadherin decreases (41). Das A et al. found that T-type calcium channel blockers inhibit autophagy and promote apoptosis of malignant melanoma cells (42). Therefore, calcium signaling pathway may be a disease-targeting in melanoma clinical trials. IVL is a soluble cytosolic protein with a molecular weight of 68KD (43). It is a substrate for glutamine transferase of keratinocytes and plays a role in the formation of epidermal keratinizing envelope (43, 44). IVL is synthesized in the spinal cell layer and cross-linked with granulosa cells under the action of glutamine transferase to form an important structural support for the skin barrier (45). At present, IVL is mostly used as a marker protein to study skin keratinocyte differentiation (46, 47). However, there are few reports of the associations between integrin and melanoma (48, 49). In view of its important role in maintaining skin function, we can speculate that IVL may also play an important role in the progression of melanoma. Although the research on key genes of melanoma has been studied, they are not comprehensive enough and lack of experimental verification (50, 51). In this study, a combined analysis of biology and experiment was used in order to have a more comprehensive and in-depth understanding of melanoma.
These limitations should be recognized by the current research. Firstly, in this study, only 160 DEGs were included. The prognostic Hub genes identified here may not represent all DEGs candidates that were potentially correlated with melanoma overall survival. Furthermore, this consideration does not include the location and stage of melanoma, because the information was not available for a considerable proportion of cases. At the same time, the functions of these eight Hub genes were inferred by bioinformatics analysis, and their biological roles in the development of melanoma were still unclear and should be explored in further experimental demonstration.
In summary, we identified a signature of eight hub genes, which predicted the overall survival in four independent testing sets. Moreover, these hub genes were involved in cancer pathways, transcriptional dysregulation signaling pathways in cancer, Rap1 signaling pathway and Ras signaling pathway. These hub genes might well have clinical significance as diagnostic markers. This research was the first analysis of differential genes in melanoma and matched normal tissue samples. However, the biological roles of these eight hub genes in the occurrence and development of melanoma need further study.
Publicly available datasets were analyzed in this study. This data can be found here: https://www.ncbi.nlm.nih.gov/geo/, https://cancergenome.nih.gov/abouttcga/overview.
The studies involving human participants were reviewed and approved by: The pathological experimental protocol was approved by the ethics committee of Kaifeng Central Hospital. The patients/participants provided their written informed consent to participate in this study.
YH and X-YJ conceived and designed this article. JY, CM, XW, HP, XZ, ZZ and BG participated in the experimental data collection. YH and XL coordinated all research realization steps, revised the study draft, and contributed to crucial discussion. All authors contributed to the article and approved the submitted version.
This work was supported by the National Natural Science Foundation of China (No. 81670088 and No. 81602708); and the Henan Provincial Science Foundation Program (No.172102410019).
The authors declare that the research was conducted in the absence of any commercial or financial relationships that could be construed as a potential conflict of interest.
Our article was published on the Research Square platform under the title of A Comprehensive Data Analysis of Differentially Regulated Genes in Melanoma.
1. Wang Y, Leonard MK, Snyder DE, Fisher ML, Eckert RL, Kaetzel DM. NME1 Drives Expansion of Melanoma Cells with Enhanced Tumor Growth and Metastatic Properties. Mol Cancer Res MCR (2019) 17:1665–74. doi: 10.1158/1541-7786.MCR-18-0019
2. Han Y, Li X, Ma C, Ji X, Li T, Zheng X, et al. Seed targeting with tiny anti-miR-1297 inhibits EMT in melanoma cells. J Drug Target (2019) 27:75–81. doi: 10.1080/1061186X.2018.1481412
3. Li WQ, Cho E, Wu S, Li S, Matthews NH, Qureshi AA. Host Characteristics and Risk of Incident Melanoma by Breslow Thickness. Cancer epidemiology, biomarkers & prevention : a publication of the American Association for Cancer Research, cosponsored by the American Society of Preventive Oncology. (2019) 28:217–24. doi: 10.1158/1055-9965.EPI-18-0607
4. Liu-Smith F, Farhat AM, Arce A, Ziogas A, Taylor T, Wang Z, et al. Sex differences in the association of cutaneous melanoma incidence rates and geographic ultraviolet light exposure. J Am Acad Dermatol (2017) 76:499–505.e3. doi: 10.1016/j.jaad.2016.08.027
5. Gershenwald JE, Guy GP Jr. Stemming the Rising Incidence of Melanoma: Calling Prevention to Action. J Natl Cancer Institute (2016) 108:1–3. doi: 10.1093/jnci/djv381
6. Ferris LK, Saul MI, Lin Y, Ding F, Weinstock MA, Geller AC, et al. A Large Skin Cancer Screening Quality Initiative: Description and First-Year Outcomes. JAMA Oncol (2017) 3:1112–5. doi: 10.1001/jamaoncol.2016.6779
7. Wolchok JD, Chiarion-Sileni V, Gonzalez R, Rutkowski P, Grob JJ, Cowey CL, et al. Overall Survival with Combined Nivolumab and Ipilimumab in Advanced Melanoma. N Engl J Med (2017) 377:1345–56. doi: 10.1056/NEJMoa1709684
8. Siegel RL, Miller KD, Jemal A. Cancer statistics, 2020. CA: Cancer J Clin (2020) 70:7–30. doi: 10.3322/caac.21590
9. Miller KD, Siegel RL, Lin CC, Mariotto AB, Kramer JL, Rowland JH, et al. Cancer treatment and survivorship statistics, 2016. CA: Cancer J Clin (2016) 66:271–89. doi: 10.3322/caac.21349
10. Rachidi S, Wallace K, Li H, Lautenschlaeger T, Li Z. Postdiagnosis aspirin use and overall survival in patients with melanoma. J Am Acad Dermatol (2018) 78:949–956.e1. doi: 10.1016/j.jaad.2017.12.076
11. Helgadottir H, Tuominen R, Olsson H, Hansson J, Höiom V. Cancer risks and survival in patients with multiple primary melanomas: Association with family history of melanoma and germline CDKN2A mutation status. J Am Acad Dermatol (2017) 77:893–901. doi: 10.1016/j.jaad.2017.05.050
12. McDermott D, Lebbé C, Hodi FS, Maio M, Weber JS, Wolchok JD, et al. Durable benefit and the potential for long-term survival with immunotherapy in advanced melanoma. Cancer Treat Rev (2014) 40:1056–64. doi: 10.1016/j.ctrv.2014.06.012
13. Lemish WM, Heenan PJ, Holman CD, Armstrong BK. Survival from preinvasive and invasive malignant melanoma in Western Australia. Cancer (1983) 52:580–5. doi: 10.1002/1097-0142(19830801)52:3<580::AID-CNCR2820520334>3.0.CO;2-H
14. Marchione R, Laurin D, Liguori L, Leibovitch MP, Leibovitch SA, Lenormand JL. MD11-mediated delivery of recombinant eIF3f induces melanoma and colorectal carcinoma cell death. Mol Ther Methods Clin Dev (2015) 2:14056. doi: 10.1038/mtm.2014.56
15. Miao W, Li L, Wang Y. A Targeted Proteomic Approach for Heat Shock Proteins Reveals DNAJB4 as a Suppressor for Melanoma Metastasis. Analyt Chem (2018) 90:6835–42. doi: 10.1021/acs.analchem.8b00986
16. Zhan Y, Guo J, Yang W, Goncalves C, Rzymski T, Dreas A, et al. MNK1/2 inhibition limits oncogenicity and metastasis of KIT-mutant melanoma. J Clin Invest (2017) 127:4179–92. doi: 10.1172/JCI91258
17. Araiza-Olivera D, Feng Y, Semenova G, Prudnikova TY, Rhodes J, Chernoff J. Suppression of RAC1-driven malignant melanoma by group A PAK inhibitors. Oncogene (2018) 37:944–52. doi: 10.1038/onc.2017.400
18. Faraj BA, Camp VM, Murray DR, Kutner M, Hearn J, Nixon D. Plasma L-dopa in the diagnosis of malignant melanoma. Clin Chem (1986) 32:159–61. doi: 10.1093/clinchem/32.1.159
19. Sørensen BS, Schmidt H, von der Maase H, Straten PT, Nexø E. Quantification of melanoma cell-specific MART-1 mRNA in peripheral blood by a calibrated competitive reverse transcription-PCR. Clin Chem (2000) 46:1923–8. doi: 10.1093/clinchem/46.12.1923
20. Feigelson HS, Powers JD, Kumar M, Carroll NM, Pathy A, Ritzwoller DP. Melanoma incidence, recurrence, and mortality in an integrated healthcare system: A retrospective cohort study. Cancer Med (2019) 8:4508–16. doi: 10.1002/cam4.2252
21. Roger A, Finet A, Boru B, Beauchet A, Mazeron JJ, Otzmeguine Y, et al. Efficacy of combined hypo-fractionated radiotherapy and anti-PD-1 monotherapy in difficult-to-treat advanced melanoma patients. Oncoimmunology (2018) 7:e1442166. doi: 10.1080/2162402X.2018.1442166
22. Ward A, Balwierz A, Zhang JD, Küblbeck M, Pawitan Y, Hielscher T, et al. Re-expression of microRNA-375 reverses both tamoxifen resistance and accompanying EMT-like properties in breast cancer. Oncogene (2013) 32:1173–82. doi: 10.1038/onc.2012.128
23. Ashburner M, Ball CA, Blake JA, Botstein D, Butler H, Cherry JM, et al. Gene ontology: tool for the unification of biology. The Gene Ontology Consortium. Nat Genet (2006) 25(2000):25–9. doi: 10.1038/75556
24. Kanehisa M, Goto S. KEGG: kyoto encyclopedia of genes and genomes. Nucleic Acids Res (2000) 28:27–30. doi: 10.1093/nar/28.1.27
25. Dennis G Jr., Sherman BT, Hosack DA, Yang J, Gao W, Lane HC, et al. DAVID: Database for Annotation, Visualization, and Integrated Discovery. Genome Biol (2003) 4:P3. doi: 10.1186/gb-2003-4-5-p3
26. Szklarczyk D, Franceschini A, Wyder S, Forslund K, Heller D, Huerta-Cepas J, et al. STRING v10: protein-protein interaction networks, integrated over the tree of life. Nucleic Acids Res (2015) 43:D447–52. doi: 10.1093/nar/gku1003
27. Kohl M, Wiese S, Warscheid B. Cytoscape: software for visualization and analysis of biological networks. Methods Mol Biol (Clifton N J) (2011) 696:291–303. doi: 10.1007/978-1-60761-987-1_18
28. Chandrashekar DS, Bashel B, Balasubramanya SAH, Creighton CJ, Ponce-Rodriguez I, Chakravarthi B, et al. UALCAN: A Portal for Facilitating Tumor Subgroup Gene Expression and Survival Analyses. Neoplasia (N Y N Y) (2017) 19:649–58. doi: 10.1016/j.neo.2017.05.002
29. Randerson-Moor JA, Harland M, Williams S, Cuthbert-Heavens D, Sheridan E, Aveyard J, et al. A germline deletion of p14(ARF) but not CDKN2A in a melanoma-neural system tumour syndrome family. Hum Mol Genet (2001) 10:55–62. doi: 10.1093/hmg/10.1.55
30. Goldstein AM, Chan M, Harland M, Hayward NK, Demenais F, Bishop DT, et al. Features associated with germline CDKN2A mutations: a GenoMEL study of melanoma-prone families from three continents. J Med Genet (2007) 44:99–106. doi: 10.1136/jmg.2006.043802
31. Fried L, Tan A, Bajaj S, Liebman TN, Polsky D, Stein JA. Technological advances for the detection of melanoma: Advances in molecular techniques. J Am Acad Dermatol (2020) 83:996–1004. doi: 10.1016/j.jaad.2020.03.122
32. Pan SH, Su KY, Spiessens B, Kusuma N, Delahaye NF, Gruselle O, et al. Gene expression of MAGE-A3 and PRAME tumor antigens and EGFR mutational status in Taiwanese non-small cell lung cancer patients. Asia Pacific J Clin Oncol (2017) 13:e212–23. doi: 10.1111/ajco.12586
33. Koopmans I, Hendriks D, Samplonius DF, van Ginkel RJ, Heskamp S, Wierstra PJ, et al. A novel bispecific antibody for EGFR-directed blockade of the PD-1/PD-L1 immune checkpoint. Oncoimmunology (2018) 7:e1466016. doi: 10.1080/2162402X.2018.1466016
34. Katunarić M, Jurišić D, Petković M, Grahovac M, Grahovac B, Zamolo G. EGFR and cyclin D1 in nodular melanoma: correlation with pathohistological parameters and overall survival. Melanoma Res (2014) 24:584–91. doi: 10.1097/CMR.0000000000000123
35. Westphal M, Maire CL, Lamszus K. EGFR as a Target for Glioblastoma Treatment: An Unfulfilled Promise. CNS Drugs (2017) 31:723–35. doi: 10.1007/s40263-017-0456-6
36. Yang ZY, Shen WX, Hu XF, Zheng DY, Wu XY, Huang YF, et al. EGFR gene copy number as a predictive biomarker for the treatment of metastatic colorectal cancer with anti-EGFR monoclonal antibodies: a meta-analysis. J Hematol Oncol (2012) 5:52. doi: 10.1186/1756-8722-5-52
37. Thyssen JP, Kezic S. Causes of epidermal filaggrin reduction and their role in the pathogenesis of atopic dermatitis. J Allergy Clin Immunol (2014) 134:792–9. doi: 10.1016/j.jaci.2014.06.014
38. Kezic S. Loss-of-function mutations in filaggrin gene and malignant melanoma. J Eur Acad Dermatol Venereol (2018) 32:193. doi: 10.1111/jdv.14813
39. Schäfer S, Koch PJ, Franke WW. Identification of the ubiquitous human desmoglein, Dsg2, and the expression catalogue of the desmoglein subfamily of desmosomal cadherins. Exp Cell Res (1994) 211:391–9. doi: 10.1006/excr.1994.1103
40. Klessner JL, Desai BV, Amargo EV, Getsios S, Green KJ. EGFR and ADAMs cooperate to regulate shedding and endocytic trafficking of the desmosomal cadherin desmoglein 2. Mol Biol Cell (2009) 20:328–37. doi: 10.1091/mbc.e08-04-0356
41. Li G, Schaider H, Satyamoorthy K, Hanakawa Y, Hashimoto K, Herlyn M. Downregulation of E-cadherin and Desmoglein 1 by autocrine hepatocyte growth factor during melanoma development. Oncogene (2001) 20:8125–35. doi: 10.1038/sj.onc.1205034
42. Das A, Pushparaj C, Herreros J, Nager M, Vilella R, Portero M, et al. T-type calcium channel blockers inhibit autophagy and promote apoptosis of malignant melanoma cells. Pigment Cell Melanoma Res (2013) 26:874–85. doi: 10.1111/pcmr.12155
43. Rorke EA, Eckert RL. Stable expression of transfected human involucrin gene in various cell types: evidence for in situ cross-linking by type I and type II transglutaminase. J Invest Dermatol (1991) 97:543–8. doi: 10.1111/1523-1747.ep12481579
44. Simon M, Green H. The glutamine residues reactive in transglutaminase-catalyzed cross-linking of involucrin. J Biol Chem (1988) 263:18093–8.
45. Steinert PM, Marekov LN. Direct evidence that involucrin is a major early isopeptide cross-linked component of the keratinocyte cornified cell envelope. J Biol Chem (1997) 272:2021–30. doi: 10.1074/jbc.272.3.2021
46. Joo YA, Chung H, Yoon S, Park JI, Lee JE, Myung CH, et al. Skin Barrier Recovery by Protease-Activated Receptor-2 Antagonist Lobaric Acid. Biomol Ther (2016) 24:529–35. doi: 10.4062/biomolther.2016.011
47. Inoue T, Toda S, Narisawa Y, Sugihara H. Subcutaneous adipocytes promote the differentiation of squamous cell carcinoma cell line (DJM-1) in collagen gel matrix culture. J Invest Dermatol (2001) 117:244–50. doi: 10.1046/j.0022-202x.2001.01431.x
48. Arias-Mejias SM, Warda KY, Quattrocchi E, Alonso-Quinones H, Sominidi-Damodaran S, Meves A. The role of integrins in melanoma: a review. Int J Dermatol (2020) 59:525–34. doi: 10.1111/ijd.14850
49. Leask A. A centralized communication network: Recent insights into the role of the cancer associated fibroblast in the development of drug resistance in tumors. Semin Cell Dev Biol (2020) 101:111–4. doi: 10.1016/j.semcdb.2019.10.016
50. Zhang Q, Wang Y, Liang J, Tian Y, Zhang Y, Tao K. Bioinformatics analysis to identify the critical genes, microRNAs and long noncoding RNAs in melanoma. Med (Balt) (2017) 96:e7497. doi: 10.1097/MD.0000000000007497
Keywords: melanoma, differentially expressed genes, bioinformatics analysis, hub genes, tumor marker
Citation: Han Y, Li X, Yan J, Ma C, Wang X, Pan H, Zheng X, Zhang Z, Gao B and Ji X-Y (2020) Bioinformatic Analysis Identifies Potential Key Genes in the Pathogenesis of Melanoma. Front. Oncol. 10:581985. doi: 10.3389/fonc.2020.581985
Received: 10 July 2020; Accepted: 24 September 2020;
Published: 16 October 2020.
Edited by:
Igor Puzanov, University at Buffalo, United StatesReviewed by:
Gagan Chhabra, University of Wisconsin-Madison, United StatesCopyright © 2020 Han, Li, Yan, Ma, Wang, Pan, Zheng, Zhang, Gao and Ji. This is an open-access article distributed under the terms of the Creative Commons Attribution License (CC BY). The use, distribution or reproduction in other forums is permitted, provided the original author(s) and the copyright owner(s) are credited and that the original publication in this journal is cited, in accordance with accepted academic practice. No use, distribution or reproduction is permitted which does not comply with these terms.
*Correspondence: Yanjie Han, aGFueWFuamllODZAMTYzLmNvbQ==; Xin-Ying Ji, MTAxOTAwOTZAdmlwLmhlbnUuZWR1LmNu
Disclaimer: All claims expressed in this article are solely those of the authors and do not necessarily represent those of their affiliated organizations, or those of the publisher, the editors and the reviewers. Any product that may be evaluated in this article or claim that may be made by its manufacturer is not guaranteed or endorsed by the publisher.
Research integrity at Frontiers
Learn more about the work of our research integrity team to safeguard the quality of each article we publish.