
94% of researchers rate our articles as excellent or good
Learn more about the work of our research integrity team to safeguard the quality of each article we publish.
Find out more
ORIGINAL RESEARCH article
Front. Oncol. , 11 September 2020
Sec. Cancer Imaging and Image-directed Interventions
Volume 10 - 2020 | https://doi.org/10.3389/fonc.2020.01763
 Ying Liu1,2
 Xuan Wang3
 Yadong Cui1
 Yuwei Jiang1
 Lu Yu1
 Ming Liu3
 Wei Zhang4
 Kaining Shi5
 Jintao Zhang1
 Chen Zhang1
 Chunmei Li1*
 Min Chen1*
Objective: This study aimed to compare the potential of monoexponential model (MEM), intravoxel incoherent motion (IVIM) model, kurtosis model, and IVIM–kurtosis model in the diagnosis and aggressiveness assessment of prostate cancer (PCa).
Materials and Methods: Thirty-six patients were recruited. Diffusion-weighted images were acquired on a 3.0-T magnetic resonance imaging (MRI) system using 0 b values up to 2,000 s/mm2 and analyzed using four models: MEM (ADCMEM), IVIM (DIVIM, D*IVIM, f IVIM), kurtosis (Dkurtosis, Kkurtosis), and IVIM–kurtosis (DIVIM−kurtosis, D*IVIM−kurtosis, fIVIM−kurtosis, DIVIM−kurtosis) models. The values of these parameters were calculated and compared between PCa, benign prostatic hyperplasia (BPH), and prostatitis. Correlations between these parameters and the Gleason score (GS) of PCa were evaluated using the Pearson test.
Results: Forty-five lesions were studied, including 18 PCa, 12 prostatitis, and 15 BPH lesions. The ADCMEM, DIVIM, fIVIM, Dkurtosis, and DIVIM−kurtosis values were significantly lower and Kkurtosis and KIVIM−kurtosis values were significantly higher in PCa compared with prostatitis and BPH. The area under the curve (AUC) of ADCMEM showed significantly higher values than that of fIVIM and KIVIM−kurtosis, but no statistical differences were found between the other parameters. The D*IVIM−kurtosis value correlated negatively and fIVIM−kurtosis and KIVIM−kurtosis values correlated positively with the GS.
Conclusion: The MEM, IVIM, kurtosis, and IVIM–kurtosis models were all useful for the diagnosis of PCa, and the diagnostic efficacy seemed to be similar. The IVIM–kurtosis model may be superior to the MEM, IVIM, and kurtosis models in the grading of PCa.
Prostate cancer (PCa) is the second-most frequent cancer and the fifth leading cause of cancer-related mortality in men worldwide (1). It is critical to accurately detect PCa and assess its aggressiveness. The European Society of Urogenital Radiology prostate committee highlights the use of magnetic resonance imaging (MRI) in managing suspected PCa (2).
MRI is an excellent technique for detecting and assessing the aggressiveness of PCa, because it can provide both anatomic and functional information. Among various MRI techniques available, diffusion-weighted imaging (DWI) shows great potential to be applied as a clinical marker of tumor diagnosis and aggressiveness assessment (3–5). The apparent diffusion coefficient (ADC), a parameter derived from DWI assuming a monoexponential model (MEM), is usually lower in PCa compared with benign prostate tissues, which is attributed to the increased cellularity of proliferating PCa. Moreover, several previous studies have shown statistically significant correlations between the ADC and the Gleason score (GS) of PCa (6, 7). However, overlaps exist between quantitative ADC values derived from PCa with a higher and a lower GS, as well as between those derived from benign prostatic tissues (8). This may be due to a drawback of the MEM, which assumes a Gaussian distribution of the water thermal motion. Actually, in biological tissues, water diffusion is restricted by the presence of barriers and compartments, leading to a non-Gaussian distribution (9, 10). Therefore, non-Gaussian diffusion models have been introduced for the study of DWI, such as intravoxel incoherent motion (IVIM) and diffusion kurtosis imaging (DKI). IVIM was originally described by Le Bihan (11) and Le Bihan et al. (12), while DKI was first described by Jensen et al. in 2005 (13). Several studies have explored the values of IVIM and DKI for the diagnosis and aggressiveness assessment of PCa. The results have proved that IVIM (14–19) and DKI (20–24) may contribute to the detection and aggressiveness assessment of PCa. However, the results of IVIM and DKI for assessing the aggressiveness of PCa were various; several studies showed that IVIM (16–18) and DKI (22–24) were feasible to stratify the pathological grade of PCa, but a few studies found negative results of IVIM (15) and DKI (20) parameters in predicting the GS.
The IVIM–kurtosis model, taking into account altogether IVIM and non-Gaussian diffusion effects on the diffusion-weighted signal, can provide more parameters compared with the IVIM and DKI models. However, no study has evaluated the utility of the IVIM–kurtosis model in the detection and staging of PCa.
No study has compared the efficiency of the MEM, IVIM, kurtosis, and IVIM–kurtosis models in the diagnosis and aggressiveness assessment of PCa in the same series of patients. This study aimed to quantitatively compare the utility of parameters obtained from the MEM, IVIM, kurtosis, and IVIM–kurtosis models on the differential diagnosis and aggressiveness assessment of PCa, and taking in-bore transrectal MRI-guided biopsy as a pathological reference.
This prospective study was approved by the local institutional review board, and written informed consent was obtained from each patient before the study. Between March 2017 and October 2018, this study included 152 patients with clinical suspicion of PCa. The inclusion criteria were as follows: (a) Routine MRI and multi-b value DWI images of the prostate were acquired before the in-bore transrectal MRI-guided puncture. (b) MRI was performed in patients prior to any treatment of PCa. The exclusion criteria were as follows: (a) images with poor quality, which were regarded as inadequate for the following analysis; (b) patients without pathologic results that proven by subsequent in-bore transrectal MRI-guided prostate biopsy; and (c) time interval between the MRI examination and MRI-guided prostrate biopsy ≥3 months. Figure 1 shows the flow diagram of the recruitment process. Finally, 36 patients were included in this study.
All examinations were performed on a 3.0-T MRI scanner (Achieva, Philips Medical Systems, Best, the Netherlands) with an eight-channel cardiac coil. The scan protocol included axial, coronal, and sagittal T2-weighted image turbo spin echo (TSE); axial T2WI TSE spectrally selective attenuated inversion recovery (SPAIR); and axial T1-weighted image TSE, axial DWI, and multi-b value DWI. The multi-b value DWI was acquired using the following imaging parameters: repetition time (TR) = 5,131 ms, echo time (TE) = 63 ms, thickness/gap = 4/1 mm, field of view (FOV) = 220 × 200 mm SENSE factor = 2, matrix sizes = 88 × 79, gradient overplus = yes, gradient mode = maximum; and b values = 0, 20, 50, 100, 200, 500, 1,000, 1,500, and 2,000 s/mm2. The diffusion gradient duration is 28.2 and 40.5 ms with ramp time. The acquisition time for this sequence was 7 min and 57 s.
The targeted biopsy of suspicious lesions was conducted on the MRI scanner, using an MRI-compatible biopsy device (Invivo, Schwerin, Germany) and an MRI-guided biopsy system (DynaCAD version 2.1.8). The suspicious lesions were identified by two radiologists (MC and CML, with 20 and 10 years of MRI experience, respectively) according to the Prostate Imaging-Reporting and Data System, version 2. The lesions were hypointense on T2WI, hyperintense on DWI, and hypointense on ADC. In the process of puncture biopsy, one radiologist (CL) performed the lesion localization, another (JY or XD) performed the interventional biopsy, and a radiology technologist (JZ) performed the scanning operation. Finally, 36 patients were included in this study: 29 patients had 1 lesion, 5 had 2 lesions, and 2 had 3 lesions. Ultimately, 45 lesions were investigated, including 18 PCa, 12 prostatitis, and 15 BPH.
Signal-to-noise ratio (SNR) of DWI images with b-value of 2,000 s/mm2 is calculated using the following equation:
Sb = 2,000 is the signal intensity (SI) of 2 ROIs drawn on peripheral and transitional zone, while background is the SI of 4 ROIs drawn on corners of images.
The multi-b value DWI images were processed using the Matlab R2015b. The regions of interest (ROIs) were drawn manually on the puncture lesions on parametric maps, and the ROIs were identified by the consensus of two experienced radiologists (YL and CML, with 3 and 10 years of MRI experience, respectively). The Akaike Information Criteria (AIC) and the parameters (DIVIM, D*IVIM, fIVIM, Dkurtosis, Kkurtosis, DIVIM−kurtosis, D*IVIM−kurtosis, fIVIM−kurtosis, and KIVIM−kurtosis) of IVIM, Kurtosis, and IVIM-kurtosis models were measured at the same time in the post-processing step.
ADCMEM was derived from the MEM, using 50 and 1,500 s/mm2 b values. DIVIM, D*IVIM, and fIVIM were derived from the IVIM model; Dkurtosis and Kkurtosis were derived from the kurtosis model; DIVIM−kurtosis, D*IVIM−kurtosis, fIVIM−kurtosis, and KIVIM−kurtosis were derived from the IVIM–kurtosis model. The same ROI was used for these four models.
ADCMEM was calculated by the MEM using the following equation (25):
where S(b) is the mean signal intensity with diffusion gradient b, S0 is the mean signal intensity without diffusion gradient, and b is the b value (50 and 1,500 s/mm2).
The IVIM model and its parameters were fitted according to the following bi-exponential equation (26):
where S(b) is the mean signal intensity, S0 is the signal reference, b represents the b value (0, 20, 50, 100, 200, 500, 1,000, 1,500, and 2,000 s/mm2), and f is the perfusion fraction. D* is the perfusion-related diffusion coefficient, and D represents the diffusion of the non-perfusing fraction.
The kurtosis model was expressed by the following equation (13):
where S(b) is the signal intensity at a specified b value; S0 is the baseline signal intensity at b = 0; b represents the b value (0, 20, 50, 100, 200, 500, 1,000, 1,500, and 2,000 s/mm2); D represents the non-Gaussian diffusion coefficient; and K represents the apparent kurtosis coefficient without unit.
The IVIM–kurtosis model was expressed by the following equation (27):
where S(0) is the theoretical signal intensity at a b value of 0 s/mm2, fIVIM represents the (T1-, T2-weighted) volume fraction of incoherently flowing blood in the tissue, b is the b value (0, 20, 50, 100, 200, 500, 1,000, 1,500, and 2,000 s/mm2), D* is the pseudo-diffusion coefficient associated with the IVIM effect, ADC0 is the virtual ADC obtained when b = 0, and K represents the kurtosis parameter.
AIC was employed to evaluate the performance of curve fitting (28):
where N is the number of data points, SSE is the sum of squared deviance, and p is the number of parameters.
SPSS 22.0 (IBM Corp, NY, USA) and Medcalc (15.8) were used to perform the statistical analyses. The difference among the AIC of IVIM, Kurtosis and IVIM-kurtosis were calculated by analysis of variance (ANOVA) test. Differences among PCa, BPH, and prostatitis in the parameters ADCMEM, DIVIM, D*IVIM, fIVIM, Dkurtosis, Kkurtosis, DIVIM−kurtosis, D*IVIM−kurtosis, fIVIM−kurtosis, and KIVIM−kurtosis were assessed using the analysis of variance (ANOVA) test.
The diagnostic efficiency of the MEM, IVIM, kurtosis, and IVIM–kurtosis models was calculated using receiver operating characteristics (ROC) curves and the binary logistic regression model. The diagnostic sensitivity and specificity were calculated at a cutoff point that maximized the value of the Youden index. Three logistic regression models were established, with IVIM model (DIVIM + fIVIM), kurtosis model (Dkurtosis + Kkurtosis), and IVIM–kurtosis model (DIVIM−kurtosis + KIVIM−kurtosis). ROC comparisons among different parameters and models were also performed. The Pearson tests were used to evaluate the correlations between these parameters and GS of PCa. A P < 0.05 was considered statistically significant.
The mean SNRs were 27.29 (range, 19.49–36.59) for peripheral zone and 24.49 (range, 17.55–34.02) for transitional zone on images with b-value of 2,000 s/mm2.
Table 1 shows the clinical and pathological characteristics of the patients.
Table 2 shows the AIC of IVIM, Kurtosis and IVIM-kurtosis models. The AIC of IVIM and IVIM-kurtosis were lower than the AIC of Kurtosis, but no differences were found between the AIC of IVIM and IVIM-kurtosis.
The ANOVA test results are summarized in Table 3, displaying that ADCMEM, DIVIM, fIVIM, Dkurtosis, and DIVIM−kurtosis values were significantly lower in PCa than in prostatitis and BPH, but no differences were found between prostatitis and BPH. The Kkurtosis and KIVIM−kurtosis values were significantly higher in PCa compared with prostatitis and BPH, but no differences were found between prostatitis and BPH. No significant differences were found among PCa, prostatitis, and BPH for D*IVIM, D*IVIM−kurtosis, and fIVIM−kurtosis. One case with PCa and one case with BPH are shown in Figures 2, 3.
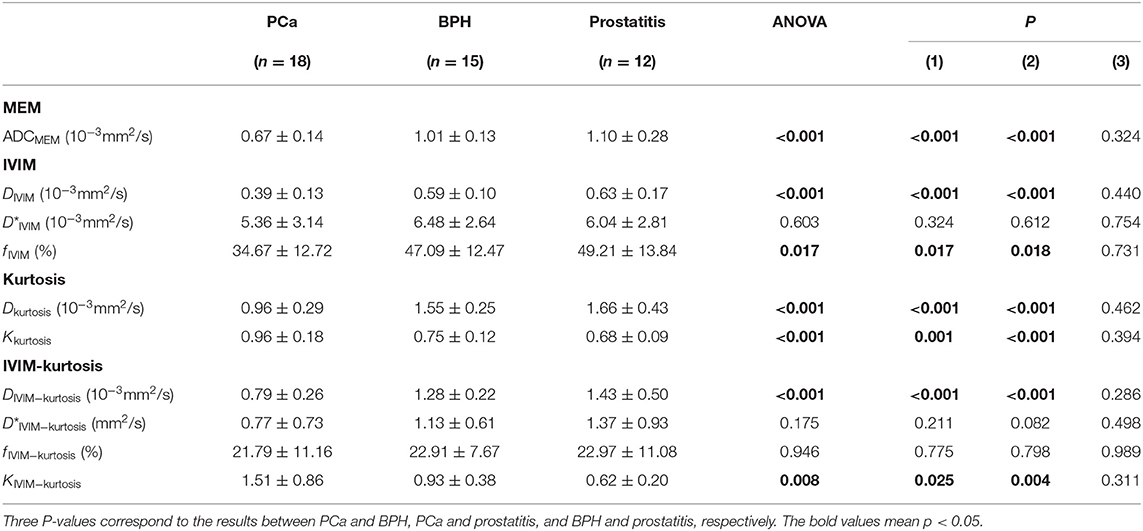
Table 3. MEM, IVIM, kurtosis, and IVIM-kurtosis model parameter values in PCa, BPH, and prostatitis.
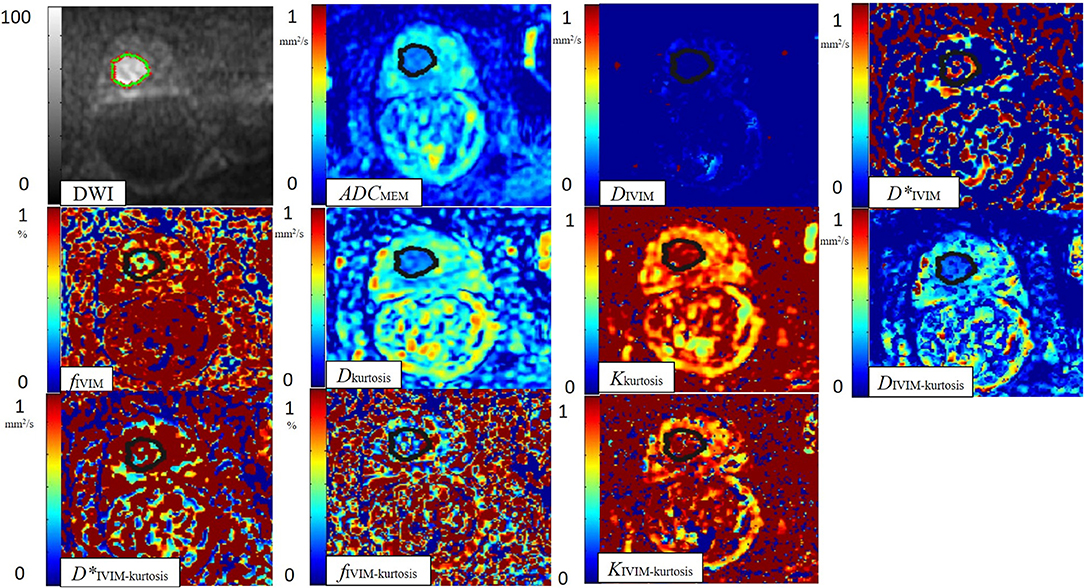
Figure 2. One case with PCa. A 76-year-old man with PCa (pathological GS, 3 + 4). ROI was set in PCa on DWI. ADCMEM, DIVIM, D*IVIM, fIVIM, Dkurtosis, Kkurtosis, DIVIM−kurtosis, D*IVIM−kurtosis, (j) fIVIM−kurtosis, and KIVIM−kurtosis value maps. The cancer tissue showed different signals notably from normal tissues in the DWI, ADCMEM (0.79 × 10⁻³ mm2/s), DIVIM (0.39 × 10⁻³ mm2/s), fIVIM (48.45%), Dkurtosis (1.24 × 10⁻³ mm2/s), Kkurtosis (0.99), DIVIM−kurtosis (0.98 × 10⁻³ mm2/s), and KIVIM−kurtosis (1.36) value maps. The PCa tissue seemed to be similar to normal tissues on the D*IVIM (5.53 × 10⁻³ mm2/s), fIVIM−kurtosis (24.09%), and D*IVIM−kurtosis (0.78 mm2/s) value maps.
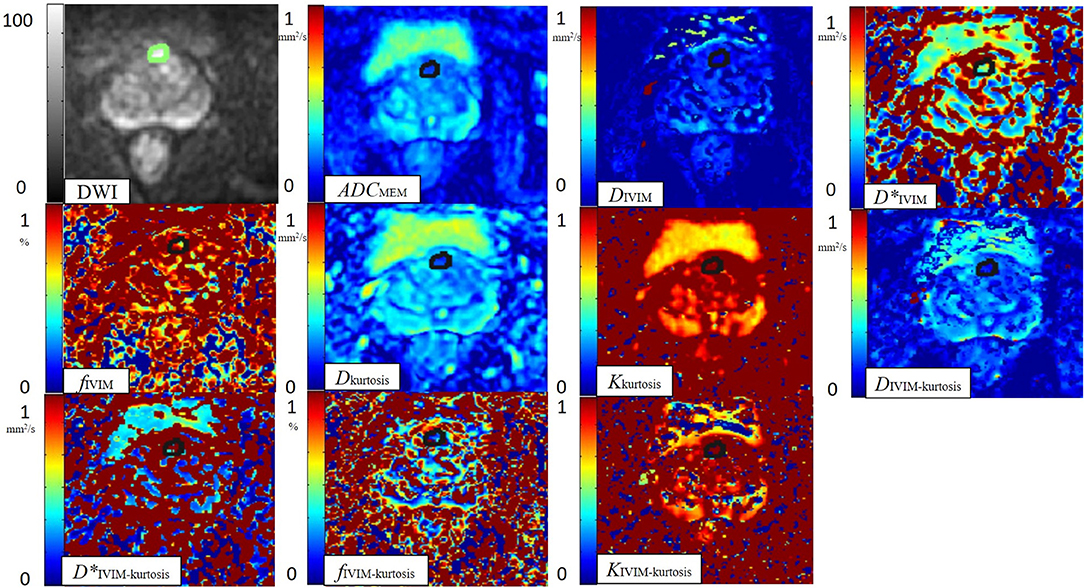
Figure 3. One case with BPH. A 60-year-old man with BPH. ROI was set in BPH on the DWI image. ADCMEM, DIVIM, D*IVIM, fIVIM, Dkurtosis, Kkurtosis, DIVIM−kurtosis, D*IVIM−kurtosis, fIVIM−kurtosis, and KIVIM−kurtosis value maps. The BPH tissue showed different signals notably from normal tissues on the DWI value map. The BPH tissue showed a slightly low signal on the ADCMEM (0.87 × 10⁻³ mm2/s), DVIM (0.45 × 10⁻³ mm2/s), Dkurtosis (1.34 × 10⁻³ mm2/s), and DIVIM−kurtosis (1.22 × 10⁻³ mm2/s) value maps. The BPH tissue seemed to be similar to normal tissues on the D*IVIM (4.09 × 10⁻³ mm2/s), fIVIM (46.17%), Kkurtosis (0.96), D*IVIM−kurtosis (1.65 mm2/s), fIVIM−kurtosis (15.25%), and KIVIM−kurtosis (1.01) value maps.
The results of ROC analyses of various parameters were displayed in Figure 4. The area under the curve (AUC) of ADCMEM, DIVIM, fIVIM, Dkurtosis, Kkurtosis, DIVIM−kurtosis, and KIVIM−kurtosis was 0.967, 0.882, 0.773, 0.921, 0.898, 0.914, and 0.766, respectively.
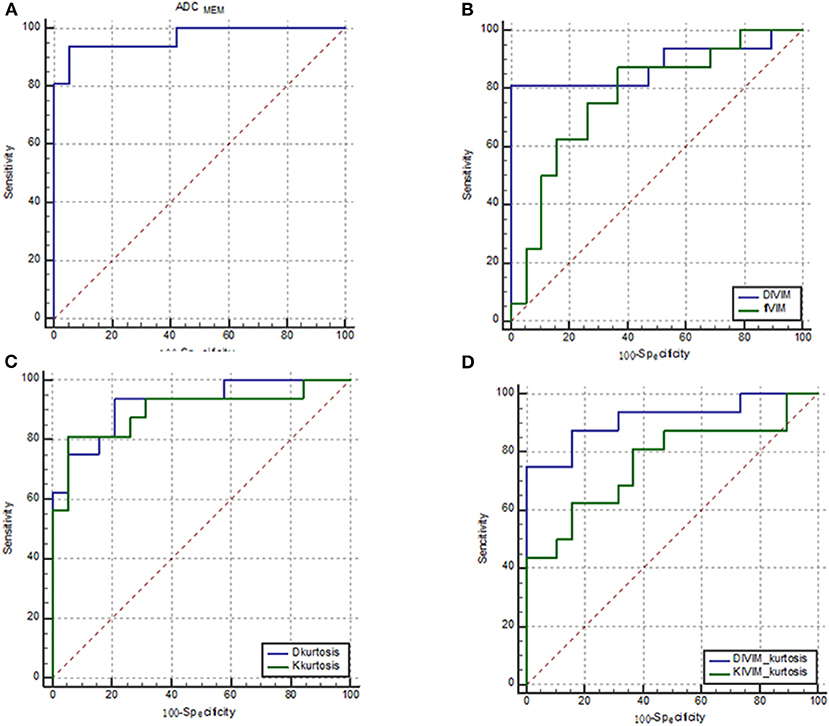
Figure 4. ROC curves of various parameters for identifying PCa. (A) ADCMEM; (B) DIVIM and fIVIM, which were derived from the IVIM model; (C) Dkurtosis and Kkurtosis, which were derived from the kurtosis model; and (D) DIVIM−kurtosis and KIVIM−kurtosis, which were derived from the IVIM–kurtosis model. The AUC of ADCMEM, DIVIM, fIVIM, Dkurtosis, Kkurtosis, DIVIM−kurtosis, and KIVIM−kurtosis was 0.967, 0.882, 0.773, 0.921, 0.898, 0.914, and 0.766, respectively.
Table 4 shows the AUC, sensitivity, specificity, and cutoff values of the parameters. DIVIM and DIVIM−kurtosis exhibited relatively higher sensitivity compared with other parameters, and ADCMEM showed the highest specificity among the parameters.

Table 4. Diagnostic performance of ADCMEM, DIVIM, fIVIM, Dkurtosis, Kkurtosis, DIVIM−kurtosis and KIVIM−kurtosis for differentiating of PCa from BPH and prostatitis.
Table 5 presents the results of ROC comparisons among the parameters. The AUC showed a significantly higher value for ADCMEM than for fIVIM and KIVIM−kurtosis (P = 0.0188 and 0.0260, respectively), but the results did not reveal statistical differences among the other parameters.
The results of ROC analyses of various models are displayed in Figure 5. The AUC of the MEM, IVIM, kurtosis, and IVIM–kurtosis models was 0.967, 0.961, 0.984, and 0.941, respectively.
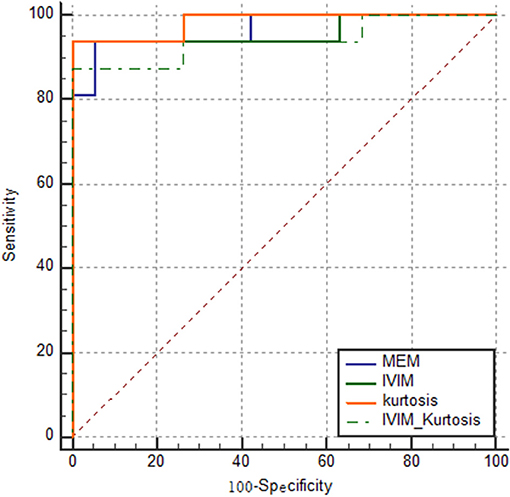
Figure 5. ROC curves of the four models for identifying PCa. The AUC of MEM, IVIM, kurtosis, and IVIM–kurtosis was 0.967, 0.961, 0.984, and 0.941, respectively.
The results in Table 6 show the ROC comparisons among different models. The four models were found to have comparable diagnostic efficiency.
Correlation of parameters with the GS are shown in Table 7; the D*IVIM−kurtosis value correlated negatively with the GS (r = −0.649, P = 0.007), and fIVIM−kurtosis and KIVIM−kurtosis values correlated positively with the GS (r = 0.639, P = 0.008; r = 0.622, P = 0.010, respectively). The other parameters had no significant correlations with the GS.
Figure 6 is the scatter plots that showed D*IVIM−kurtosis value correlated negatively with GS, while fIVIM−kurtosis and KIVIM−kurtosis values correlated positively with GS.
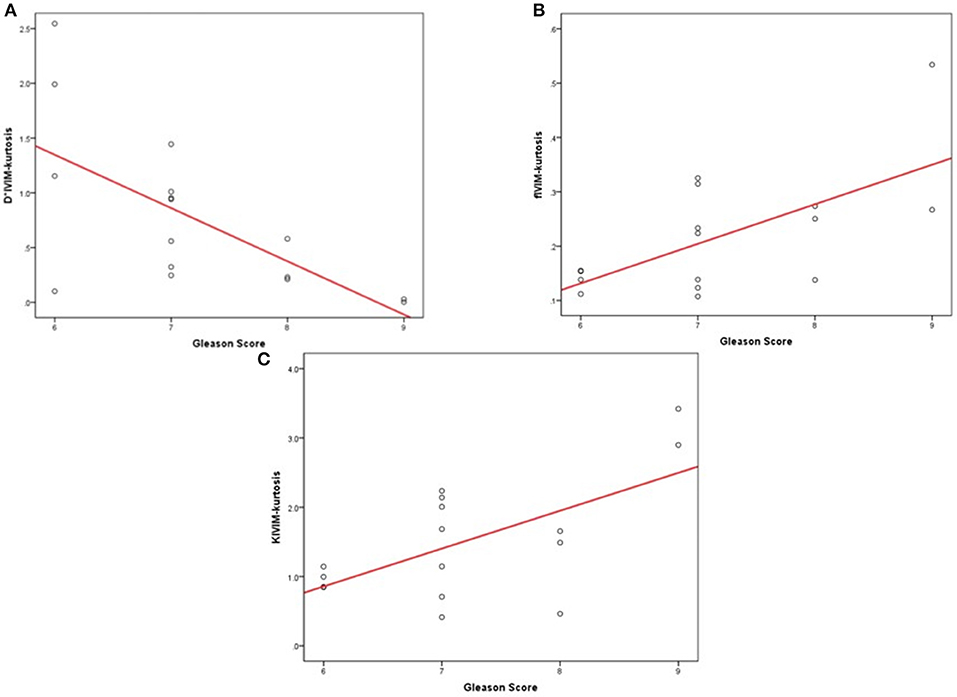
Figure 6. The scatter plots that showed the correlation of parameters with GS. The scatter plots that showed the correlation of parameters with GS. (A) D*IVIM−kurtosis value correlated negatively with GS. (B) fIVIM−kurtosis values correlated positively with the GS. (C) KIVIM−kurtosis values correlated positively with the GS.
The findings of this study revealed that the MEM, IVIM, kurtosis, and IVIM–kurtosis models could all be used to differentiate PCa from non-cancerous tissue.
ADCMEM, based on the monoexponential decay model, derives from the assumption that water molecular diffusion is a random process. The results of this study demonstrated that ADCMEM was significantly lower in PCa than in non-cancerous tissue, which was in accordance with previous studies (29, 30). The lower ADCMEM in PCa may be owing to increased cellularity and fibrosis.
IVIM, following a bi-exponential model, provides pure molecular diffusion parameters (D) and perfusion-related diffusion parameters (D* and f ) (16). DIVIM and fIVIM were statistically lower in PCa compared with non-cancerous tissue, which was similar to the result of Döpfert et al. (31). However, the results of the f value in previous studies were various. Some studies found no significant differences among PCa, prostatitis, and BPH (16, 32); however, several studies also showed a higher f value in PCa (14). Such controversial results may be partially due to the poor repeatability, which may be attributed to the substantially increased heterogeneity of PCa and the intrinsically low f value in prostate parenchyma (19). In the present study, the D*IVIM of PCa was indistinguishable from non-cancerous tissue, which corresponded to a prior report (31). The contributing factor may be that D* was susceptible to measurement and noise variations. It is possible that motion across b-values inside included cases, or physiological noise may affect to the results, particularly in D*, to undermine its performance.
DKI, as an extension of traditional DWI, was adopted to characterize the multiexponential behavior of diffusion decay using a kurtosis-based diffusion model (33). This study showed lower Dkurtosis and higher Kkurtosis in PCa than in non-cancerous tissue, which was in accordance with previous studies (20, 23, 34). Lower Dkurtosis in PCa may be mainly because of the dense cellularity of malignant lesions. The increase in the microstructural complexity of PCa could result in increased K values for PCa compared with non-cancerous tissue (13).
The IVIM–kurtosis model takes into account both the IVIM and non-Gaussian diffusion effects on the diffusion-weighted signal (27), providing more information compared with the IVIM and kurtosis models. The results showed statistically lower DIVIM−kurtosis and higher KIVIM−kurtosis in PCa compared with non-cancerous tissues, which were similar to the results of DIVIM, Dkurtosis, and Kkurtosis in differentiating PCa from non-cancerous tissue. The D*IVIM−kurtosis and fIVIM−kurtosis values had no significant differences among PCa, prostatitis, and BPH, but fIVIM was statistically lower in PCa compared with non-cancerous tissue. The reason may be the poor measurement reproducibility of D* and f . In this study, the results of the ROC analyses for discriminating PCa from non-cancerous tissue revealed that the AUC of ADCMEM showed a higher value compared with fIVIM and KIVIM−kurtosis, with statistical significance. However, no statistically significant differences were found between the other parameters. This may indicate that the differential diagnostic ability of ADCMEM was superior to fIVIM and KIVIM−kurtosis.
Besides the comparisons of individual parameters, the ROC was also compared among various models to find out which model has the best diagnostic accuracy.
The present study revealed that the diagnostic accuracies of the MEM, IVIM, kurtosis, and IVIM–kurtosis models were similar, indicating that the MEM, IVIM, kurtosis, and IVIM–kurtosis models all showed excellent diagnostic performances for PCa and that neither technique was superior to the other. Li et al. (32) showed that the AUC of DKI was higher than that of DWI, which was inconsistent with the results of this study. The difference may result from the different choice of multi-b values; therefore, it is critical to select a suitable range of multi-b values in studies. Unfortunately, the appropriate number and choice of b values are not known. Therefore, the diagnostic value of the four models with different number and range of multi-b values needs to be further investigated, and a large-sized sample study is necessary to confirm the diagnostic efficiency of the models. Considering the scan time and data post-processing time of IVIM, kurtosis, and IVIM-kurtosis were relatively long, so they may be not applicable to all scanners. Despite the high requirements of gradient power and software for IVIM, kurtosis, and IVIM–kurtosis models, MEM have more advantages than other models to some extent, for MEM was easily acquired in clinic with shorter scanning time, taking less resources and also being less prone to motion artifacts.
In aggressiveness assessment, the present study displayed that fIVIM−kurtosis and KIVIM−kurtosis values correlated positively while the D*IVIM−kurtosis value correlated negatively with the GS. Meanwhile, D*IVIM and fIVIM values did not significantly correlate with the GS; the difference may result from the deviation in the evaluation of D* and f parameters.
The K reflects the peaked distribution of tissue diffusivity, which increased with the complexity of the tissue's microstructure (35). The PCa tissue was filled with a destroyed glandular structure in which the cell density increases, and the intercellular space is constricted. These changes in the microstructure would all appear to represent increasing tissue complexity, leading to higher restriction to water molecule movement, which in turn results in the increased K value in intermediate- and high-grade PCa compared with low-grade PCa. However, the parameters derived from the MEM, IVIM, and kurtosis models had no significant correlations with the GS. The results may be attributed to the lack of samples and signal measurement errors, and the number of low-grade PCa (GS ≤ 6) was relatively small. Therefore, further studies with larger patients are needed to observe the utility of various parameters obtained from the MEM, IVIM, and kurtosis models in the aggressiveness assessment of PCa.
Moreover, the transrectal ultrasound (TRUS)-guided biopsy is accepted as the standard for the diagnosis of PCa in most previous studies. However, it has a low sensitivity (40%) (36–38), bringing out errors in the stratification of tumor and non-tumor tissues. Few studies used prostatectomy as the pathological reference, but the ROIs might not perfectly match the pathology. The use of in-bore 3-T MRI-guided biopsy in this study yielded a high PCa diagnostic rate, as it could improve the accuracy in image matching. The in-bore 3-T MRI-guided biopsy allows direct sampling of the lesions suspicious for cancer and assures that the lesion identified by MRI was the lesion evaluated by histology.
Quality of curve fitting was only conducted among three advanced diffusion models since that MEM was processed by two b values (50 and 1,500) and no curve fitting was performed. Larger AIC of Kurtosis model indicates that this model is less suitable for prostate lesions. This may suggest that perfusion caused by the rich capillary network has more contribution to the DWI signal attenuation, rather than the heterogeneous diffusion environments. Similar fitting quality between IVIM and IVIM-kurtosis model also echoes that the introduction of kurtosis component doesn't bring additional advantage into the description of signal attenuation. More histopathological analysis may be helpful for further exploration of diffusion components.
This study had some limitations. First, the patient population was relatively small, with a total of 45 ROIs, and the number of tumors with GS ≤ 6 was relatively small. Therefore, larger patient populations are needed to observe the utility of the MEM, IVIM, kurtosis, and IVIM–kurtosis models in the diagnosis and aggressiveness assessment of PCa. Second, the whole histopathology was not available in patients; this approach could allow a more precise diagnosis of PCa. However, unlike conventional TRUS-guided biopsies, this study used the in-bore MRI-guided biopsy as a reference, which improved the accuracy in biopsy location.
In conclusion, the MEM, IVIM, kurtosis, and IVIM–kurtosis models were beneficial in differentiating PCa from prostatitis and BPH, but the diagnostic efficacy seemed to be similar in all four models. The IVIM–kurtosis model may be advantageous for the aggressiveness assessment of PCa compared with the MEM, IVIM, and kurtosis models.
The datasets presented in this article are not readily available because the policy of Beijing Hospital does not permit that. Requests to access the datasets should be directed to Chunmei Li, bGljaHVubWVpNDE0N0Biamhtb2guY24=.
The studies involving human participants were reviewed and approved by Beijing Hospital ethics committee. The patients/participants provided their written informed consent to participate in this study. Written informed consent was obtained from the individual(s) for the publication of any potentially identifiable images or data included in this article.
YL, CL, KS, and MC contributed conception and design of the study. YL, XW, YC, YJ, LY, ML, WZ, JZ, and CZ organized the database. YL and CL performed the statistical analysis. YL wrote the first draft of the manuscript. CL and MC contributed to manuscript revision. All authors read and approved the submitted version.
This work was supported by grants from Dongcheng District Outstanding Talent Project, Beijing Hospital Nova Project (BJ-2016-037), Beijing Natural Science Foundation (7194315), and Beijing Hospital Clinical Research 121 Project (BJ-2018-090).
KS was employed by the company Philips Healthcare.
The remaining authors declare that the research was conducted in the absence of any commercial or financial relationships that could be construed as a potential conflict of interest.
1. Bray F, Ferlay J, Soerjomataram I, Siegel RL, Torre LA, Jemal A. Global cancer statistics 2018: GLOBOCAN estimates of incidence and mortality worldwide for 36 cancers in 185 countries. CA: Cancer J Clin. (2018) 68:394–424. doi: 10.3322/caac.21492
2. Barentsz JO, Richenberg J, Clements R, Choyke P, Verma S, Villeirs G, et al. ESUR prostate MR guidelines 2012. Eur Radiol. (2012) 22:746–57. doi: 10.1007/s00330-011-2377-y
3. Tan CH, Wei W, Johnson V, Kundra V. Diffusion-weighted MRI in the detection of prostate cancer: meta-analysis. Am J Roentgenol. (2012) 199:822–9. doi: 10.2214/AJR.11.7805
4. Jin G, Su DK, Luo NB, Liu LD, Zhu X, Huang XY. Meta-analysis of diffusion-weighted magnetic resonance imaging in detecting prostate cancer. J Comput Assis Tomography. (2013) 37:195–202. doi: 10.1097/RCT.0b013e3182801ae1
5. Jie C, Rongbo L, Ping T. The value of diffusion-weighted imaging in the detection of prostate cancer: a meta-analysis. Eur Radiol. (2014) 24:1929–41. doi: 10.1007/s00330-014-3201-2
6. Hambrock T, Somford DM, Huisman HJ, van Oort IM, Witjes JA, Hulsbergen-van de Kaa CA, et al. Relationship between apparent diffusion coefficients at 3.0-T MR imaging and gleason grade in peripheral zone prostate cancer. Radiology. (2011) 259:453–61. doi: 10.1148/radiol.11091409
7. Turkbey B, Shah VP, Pang Y, Bernardo M, Xu S, Kruecker J, et al. Is apparent diffusion Coefficient associated with clinical risk scores for prostate cancers that ARE visible on 3-T MR images? Genitourinary Imaging. (2011) 258:8. doi: 10.1148/radiol.10100667
8. Hoeks CMA, Vos EK, Bomers JGR, Barentsz JO, Hulsbergen-van de Kaa CA, Scheenen TW. Diffusion-weighted magnetic resonance imaging in the prostate transition zone: histopathological validation using magnetic resonance–guided biopsy specimens. Invest Radiol. (2013) 48:693–701. doi: 10.1097/RLI.0b013e31828eeaf9
9. Tamura C, Shinmoto H, Soga S, Okamura T, Sato H, Okuaki T, et al. Diffusion kurtosis imaging study of prostate cancer: preliminary findings: DKI of prostate cancer. J Magnet Reson Imaging. (2014) 40:723–9. doi: 10.1002/jmri.24379
10. Jensen JH, Helpern JA. MRI quantification of non-Gaussian water diffusion by kurtosis analysis. NMR Biomed. (2010) 23:698–710. doi: 10.1002/nbm.1518
11. Le Bihan D. Intravoxel incoherent motion perfusion MR imaging: a wake-up call. Radiology. (2008) 249:748–52. doi: 10.1148/radiol.2493081301
12. Le Bihan D, Breton E, Lallemand D, Grenier P, Cabanis E, Laval-Jeantet M. MR imaging of intravoxel incoherent motions: application to diffusion and perfusion in neurologic disorders. Radiology. (1986) 161:401–7. doi: 10.1148/radiology.161.2.3763909
13. Jensen JH, Helpern JA, Ramani A, Lu H, Kaczynski K. Diffusional kurtosis imaging: the quantification of non-gaussian water diffusion by means of magnetic resonance imaging. Magnet Reson Med. (2005) 53:1432–40. doi: 10.1002/mrm.20508
14. Beyhan M, Sade R, Koc E, Adanur S, Kantarci M. The evaluation of prostate lesions with IVIM DWI and MR perfusion parameters at 3T MRI. La Radiol Med. (2019) 124:87–93. doi: 10.1007/s11547-018-0930-3
15. Pesapane F, Patella F, Fumarola EM, Panella S, Ierardi AM, Pompili GG, et al. Intravoxel Incoherent Motion (IVIM) Diffusion Weighted Imaging (DWI) in the periferic prostate cancer detection and stratification. Med Oncol. (2017) 34:35. doi: 10.1007/s12032-017-0892-7
16. Valerio M, Zini C, Fierro D, Giura F, Colarieti A, Giuliani A, et al. Panebianco V. 3T multiparametric MRI of the prostate: does intravoxel incoherent motion diffusion imaging have a role in the detection and stratification of prostate cancer in the peripheral zone? Eur J Radiol. (2016) 85:790–4. doi: 10.1016/j.ejrad.2016.01.006
17. Yang DM, Kim HC, Kim SW, Jahng G-H, Won KY, Lim SJ, et al. Prostate cancer: correlation of intravoxel incoherent motion MR parameters with Gleason score. Clin Imaging. (2016) 40:445–50. doi: 10.1016/j.clinimag.2016.01.001
18. Zhang Y-D, Wang Q, Wu C-J, Wang X-N, Zhang J, Liu H, et al. The histogram analysis of diffusion-weighted Intravoxel Incoherent Motion (IVIM) imaging for differentiating the gleason grade of prostate cancer. Eur Radiol. (2015) 25:994–1004. doi: 10.1007/s00330-014-3511-4
19. Kuru TH, Roethke MC, Stieltjes B, Maier-Hein K, Schlemmer H-P, Hadaschik BA, et al. Intravoxel Incoherent Motion (IVIM) diffusion imaging in prostate cancer - what does it add?: J Comput Assis Tomography. (2014) 38:558–64. doi: 10.1097/RCT.0000000000000088
20. Barrett T, McLean M, Priest AN, Lawrence EM, Patterson AJ, Koo BC, et al. Diagnostic evaluation of magnetization transfer and diffusion kurtosis imaging for prostate cancer detection in a re-biopsy population. Eur Radiol. (2018) 28:3141–50. doi: 10.1007/s00330-017-5169-1
21. Si Y, Liu R. Diagnostic performance of monoexponential DWI versus diffusion kurtosis imaging in prostate cancer: a systematic review and meta-analysis. Am J Roentgenol. (2018) 211:358–68. doi: 10.2214/AJR.17.18934
22. Wang X, Tu N, Qin T, Xing F, Wang P, Wu G. Diffusion kurtosis imaging combined with DWI at 3-T MRI for detection and assessment of aggressiveness of prostate cancer. Am J Roentgenol. (2018) 211:797–804. doi: 10.2214/AJR.17.19249
23. Roethke MC, Kuder TA, Kuru TH, Fenchel M, Hadaschik BA, Laun FB, et al. Evaluation of diffusion kurtosis imaging versus standard diffusion imaging for detection and grading of peripheral zone prostate cancer. Invest Radiol. (2015) 50:483–9. doi: 10.1097/RLI.0000000000000155
24. Rosenkrantz AB, Sigmund EE, Johnson G, Babb JS, Mussi TC, Melamed J, et al. Prostate cancer: feasibility and preliminary experience of a diffusional kurtosis model for detection and assessment of aggressiveness of peripheral zone cancer. Radiology. (2012) 264:126–35. doi: 10.1148/radiol.12112290
25. Mannelli L, Nougaret S, Vargas HA, Do RKG. Advances in diffusion-weighted imaging. Radiol Clin North Am. (2015) 53:569–81. doi: 10.1016/j.rcl.2015.01.002
26. Le Bihan D, Breton E, Lallemand D, Aubin ML, Vignaud J, Laval-Jeantet M. Separation of diffusion and perfusion in intravoxel incoherent motion MR imaging. Radiology. (1988) 168:497–505. doi: 10.1148/radiology.168.2.3393671
27. Iima M, Le Bihan D. Clinical intravoxel incoherent motion and diffusion MR imaging: past, present, and future. Radiology. (2016) 278:13–32. doi: 10.1148/radiol.2015150244
28. Akaike H. Information theory and an extension of the maximum likelihood principle. In: Petrov BN, Csaki F, editors. Second International Symposium on Information Theory. Budapest: Akademai Kiado (1973). p. 267–81
29. Tamada T, Sone T, Jo Y, Toshimitsu S, Yamashita T, Yamamoto A, et al. Apparent diffusion coefficient values in peripheral and transition zones of the prostate: Comparison between normal and malignant prostatic tissues and correlation with histologic grade. J Magnetic Reson Imaging. (2008) 28:720–6. doi: 10.1002/jmri.21503
30. Vargas HA, Akin O, Franiel T, Mazaheri Y, Zheng J, Moskowitz C, et al. Diffusion-weighted endorectal MR imaging at 3 T for prostate cancer: tumor detection and assessment of aggressiveness. Radiology. (2011) 259:775–84. doi: 10.1148/radiol.11102066
31. Döpfert J, Lemke A, Weidner A, Schad LR. Investigation of prostate cancer using diffusion-weighted intravoxel incoherent motion imaging. Magnet Reson Imaging. (2011) 29:1053–8. doi: 10.1016/j.mri.2011.06.001
32. Li C, Chen M, Wan B, Yu J, Liu M, Zhang W, et al. A comparative study of Gaussian and non-Gaussian diffusion models for differential diagnosis of prostate cancer with in-bore transrectal MR-guided biopsy as a pathological reference. Acta Radiol. (2018) 59:1395–402. doi: 10.1177/0284185118760961
33. Vargas HA. Updates in advanced diffusion-weighted magnetic resonance imaging techniques in the evaluation of prostate cancer. World J Radiol. (2015) 7:184. doi: 10.4329/wjr.v7.i8.184
34. Suo S, Chen X, Wu L, Zhang X, Yao Q, Fan Y, et al. Non-Gaussian water diffusion kurtosis imaging of prostate cancer. Magnet Reson Imaging. (2014) 32:421–7. doi: 10.1016/j.mri.2014.01.015
35. Chen Y, Ren W, Zheng D, Zhong J, Liu X, Yue Q, et al. Diffusion kurtosis imaging predicts neoadjuvant chemotherapy responses within 4 days in advanced nasopharyngeal carcinoma patients: monitoring NPC chemotherapy response by DKI. J Magnet Reson Imaging. (2015) 42:1354–61. doi: 10.1002/jmri.24910
36. Babaian RJ, Toi A, Kamoi K, Troncoso P, Sweet J, Evans R, et al. A comparative analysis of sextant and an extended 11-CORE multisite directed biopsy strategy. J Urol. (2000) 163:152–7. doi: 10.1016/S0022-5347(05)67993-1
37. Terris MK. Sensitivity and specificity of sextant biopsies in the detection of prostate cancer: preliminary report. Urology. (1999) 54:486–9. doi: 10.1016/S0090-4295(99)00148-X
Keywords: monoexponential model, intravoxel incoherent motion model, kurtosis model, IVIM–kurtosis model, prostate cancer, prostatitis, benign prostatic hyperplasia
Citation: Liu Y, Wang X, Cui Y, Jiang Y, Yu L, Liu M, Zhang W, Shi K, Zhang J, Zhang C, Li C and Chen M (2020) Comparative Study of Monoexponential, Intravoxel Incoherent Motion, Kurtosis, and IVIM-Kurtosis Models for the Diagnosis and Aggressiveness Assessment of Prostate Cancer. Front. Oncol. 10:1763. doi: 10.3389/fonc.2020.01763
Received: 07 April 2020; Accepted: 06 August 2020;
Published: 11 September 2020.
Edited by:
Roger M. Bourne, The University of Sydney, AustraliaReviewed by:
Rossella Canese, Istituto Superiore di Sanità (ISS), ItalyCopyright © 2020 Liu, Wang, Cui, Jiang, Yu, Liu, Zhang, Shi, Zhang, Zhang, Li and Chen. This is an open-access article distributed under the terms of the Creative Commons Attribution License (CC BY). The use, distribution or reproduction in other forums is permitted, provided the original author(s) and the copyright owner(s) are credited and that the original publication in this journal is cited, in accordance with accepted academic practice. No use, distribution or reproduction is permitted which does not comply with these terms.
*Correspondence: Chunmei Li, bGljaHVubWVpNDE0N0Biamhtb2guY24=; Min Chen, Y2pyLmNoZW5taW5AdmlwLjE2My5jb20=
Disclaimer: All claims expressed in this article are solely those of the authors and do not necessarily represent those of their affiliated organizations, or those of the publisher, the editors and the reviewers. Any product that may be evaluated in this article or claim that may be made by its manufacturer is not guaranteed or endorsed by the publisher.
Research integrity at Frontiers

Learn more about the work of our research integrity team to safeguard the quality of each article we publish.