 Monika Lejman1*
 Monika Włodarczyk2
 Borys Styka2
 Agata Pastorczak3Joanna Zawitkowska4Joanna Taha3Łukasz Sędek5Katarzyna Skonieczka6Marcin Braun7Olga Haus6
 Tomasz Szczepański5Wojciech Młynarski3Jerzy R. Kowalczyk4
- 1Laboratory of Genetic Diagnostics, Department of Pediatric Hematology, Oncology and Transplantology, Medical University of Lublin, Lublin, Poland
- 2Laboratory of Genetic Diagnostics, University Children's Hospital, Lublin, Poland
- 3Department of Pediatric, Oncology, Hematology and Diabetology, Medical University of Łódz, Łódź, Poland
- 4Department of Pediatric Hematology, Oncology and Transplantology, Medical University of Lublin, Lublin, Poland
- 5Department of Microbiology and Oncology, Medical University of Silesia in Katowice, Katowice, Poland
- 6Department of Clinical Genetics, Faculty of Medicine, Collegium Medicum in Bydgoszcz, Nicolaus Copernicus University in Torun, Bydgoszcz, Poland
- 7Department of Pathology, Chair of Oncology, Medical University of Łódz, Łódź, Poland
T-cell acute lymphoblastic leukemia (T-ALL) is a highly heterogeneous disease, and numerous genetic aberrations in the leukemic genome are responsible for the biological and clinical differences among particular ALL subtypes. However, there is limited knowledge regarding the association of whole-genome copy number abnormalities (CNAs) in childhood T-ALL with the course of leukemia and its outcome. The aim of this study was to identify the pattern of whole-genome CNAs in 86 newly diagnosed childhood T-ALL cases using a high-density single-nucleotide polymorphism array. We analyzed the presence of whole-genome CNAs with respect to immunophenotype, clinical features, and treatment outcomes. A total of 769 CNAs, including trisomies, duplications, deletions, and segmental loss of heterozygosity, were detected in 86 analyzed samples. Gain or loss of chromosomal regions exceeding 10 Mb occurred in 46 cases (53%), including six cases (7%) with complex chromosomal alterations. We observed that microdeletions in selected genes (e.g., FIP1L1 and PDGFRB) were related to the clinical features. Interestingly, 13% of samples have a duplication of the two loci (MYB and AIH1—6q23.3), which never occurred alone. Single-nucleotide polymorphism array significantly improved the molecular characterization of pediatric T-ALL. Further studies with larger cohorts of patients may contribute to the selection of prognostic CNAs in this group of patients.
Introduction
T-cell acute lymphoblastic leukemia (T-ALL) accounts for ~15% of pediatric ALL cases (1). T-cell acute lymphoblastic leukemia is a biologically heterogeneous malignancy with numerous genetic aberrations in the leukemic genome. T-cell acute lymphoblastic leukemia has been divided into four subtypes according to the European Group for the Immunological Classification of Leukemia (EGIL): pro-T EGIL T-I (cCD3+, CD7+), pre-T EGIL T-II (cCD3+, CD7+, and CD5/CD2+), cortical T EGIL T-III (cCD3+, Cd1a+, sCD3+/−), and mature-T EGIL T-IV (cCD3+, sCD3+, CD1a−) (2). Early T-cell precursor (ETP)–ALL is characterized as an additional subtype of T-cell ALL with blasts usually negative for CD1a and CD8, weak expression of CD5, and the presence of one or more myeloid or stem cell markers (3, 4). The prognostic factors and risk stratification are different in T-ALL when compared to B-lineage leukemia. Minimal residual disease (MRD) response plays an essential role in the risk group assignment; leukocytosis and age at diagnosis are not independent prognostic factors in T-ALL (5). Generally, pre-T ALL shows a worse outcome than pre-B ALL in both pediatric and adult patients (6). Currently, risk-adapted therapy and appropriate supportive care result in a relatively high 5 year overall survival rate of 80%. However, effective treatment of T-ALL relapses is still clinically challenging (5). Because most patients with relapse were originally stratified into an intermediate risk group, none of the existing prognostic genetic markers were efficient enough to predict treatment outcome in T-ALL. In the last 10 years, advanced genomic and transcriptomic studies using high-throughput techniques have provided a better understanding of the pathogenesis of T-ALL (7, 8). Moreover, associations of molecular lesions with specific T-ALL subtypes, clinical features, and outcomes have been documented (9).
However, there is still limited knowledge about the association of whole-genome copy number abnormalities (CNAs) in childhood T-ALL with disease course and outcome. In this study, we analyzed the pattern of whole-genome CNAs using a high-density single-nucleotide polymorphism (SNP) array in childhood ALL, depending on the maturation state of leukemic cells, clinical features, and treatment outcome.
Materials and Methods
Patients
A series of bone marrow aspirates from 86 children with newly diagnosed T-ALL were analyzed prior to any oncological treatment. All patients were treated in 13 centers of the Polish Pediatric Leukemia/Lymphoma Study Group, according to the following protocols: ALL IC BFM 2002 [n = 15 (17%)], ALL IC BFM 2009 [n = 56 (66%)], and AIEOP BFM ALL 2017 [n = 15 (17%)], within the randomized trial of the International Berlin-Frankfurt-Munster Study Group (I-BFM-SG) for the therapy of childhood ALL. Bone marrow samples from all patients were cytogenetically investigated by G-banding analysis at the time of diagnosis. Targeted fluorescence in situ hybridization (FISH) t(9,22) (q34; q11)/BCR-ABL1, 11q23/KMT2A rearrangements were performed in 86 cases (100%). Genetic tests were performed for all ALL samples. The majority of patient samples (49 of 86) were examined in the Department of Diagnostic Genetics of Medical University of Lublin, and these samples were collected from the Department of Hematology, Oncology, and Transplantology in Lublin. The remaining data on patient cytogenetics were previously established within the therapeutic program through a combined cytogenetics FISH screening in the National Reference Center: Department of Clinical Genetics, Collegium Medicum in Bydgoszcz. Immunophenotypic data enabled the classification of patients into pre-T ALL [n = 24 (28%)], cortical T-ALL [n = 23 (26.6%)], mature T-ALL [n = 21 (24%)], and ETP-ALL [n = 2 (2%)] based on the EGIL criteria. In 16 cases (19%), immunophenotypic data were not available to determine a specific subtype of T-ALL. The clinical and laboratory details of patients with T-ALL are presented in Table 1. All of the participants have written consent to participate and publish the data. All procedures performed in studies involving human participants were in accordance with the ethical standards of the institutional and/or national research committee and with the 1964 Helsinki Declaration and its later amendments or comparable ethical standards. Informed consent was obtained from all individuals included in the study and their parents or guardians on behalf of any participant younger than 16 years. The study was approved by the ethics committee (KNW/0022/KB1/153/I/16/17).
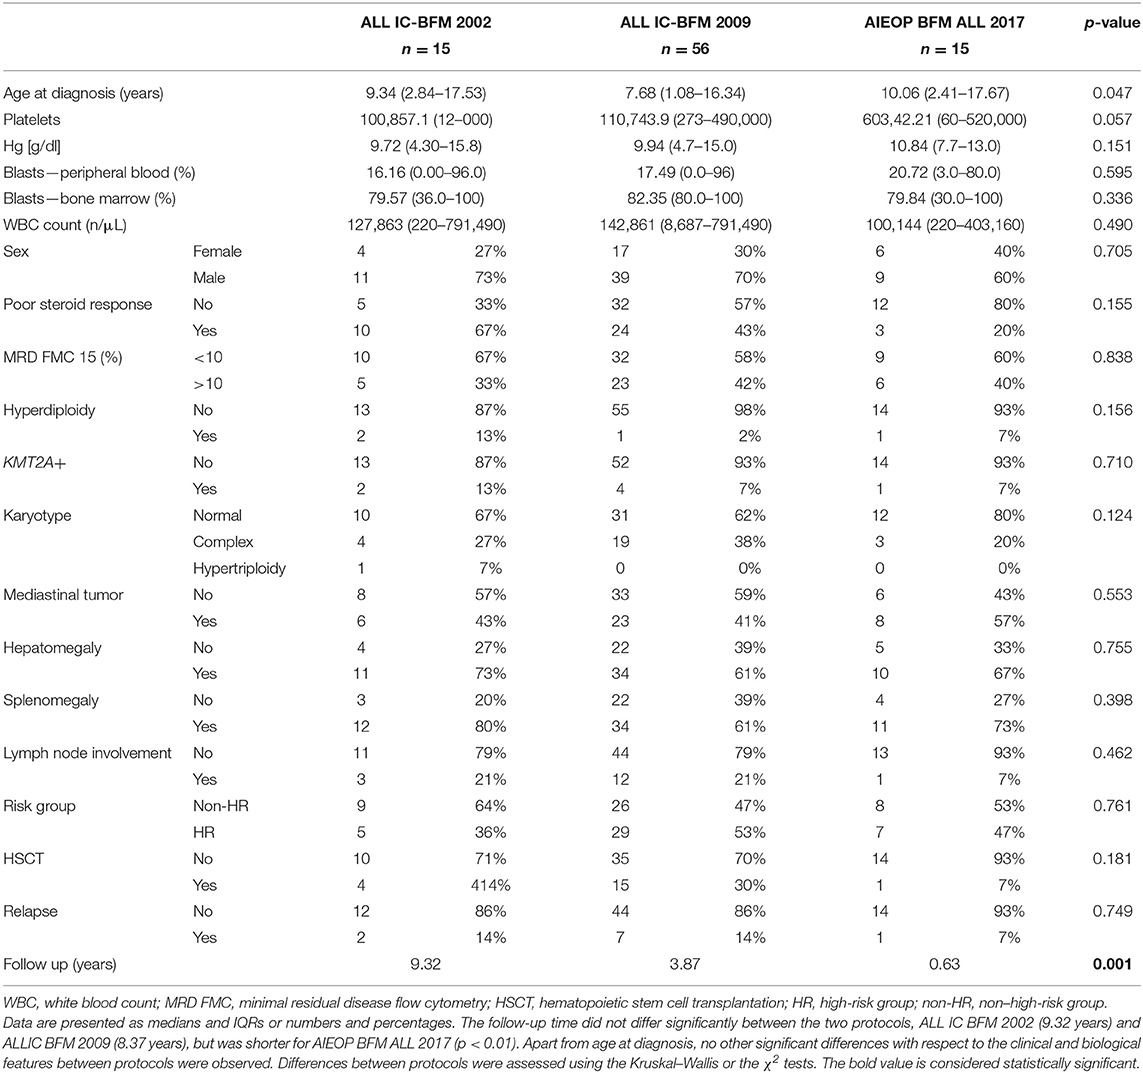
Table 1. Clinical and biological characteristics of the study group with respect to the implemented treatment protocol.
Laboratory Methods
Bone marrow samples were aspirated into anticoagulant (EDTA)–containing tubes from patients with T-ALL at the time of diagnosis. Genomic DNA was isolated with the QIAamp DNA Blood Mini Kit (Qiagen, Hilden, Germany). DNA samples were stored at −20°C until SNP arrays experiments were performed. The median leukemic cell counts in the collected bone marrow were assessed using flow cytometry to be 82.43% (range = 30–100%). The concentration and quality of isolates were determined by spectrophotometry (NanoDrop 8000; Thermo Fisher Scientific, Waltham, MA, USA). The microarray analyses were performed with the use of a CytoScan HD array [2,670,000 markers, including 750,000 SNP and 1,900,000 non-polymorphic copy number variant (CNV) markers] (Applied Biosystems, part of Thermo Fisher Scientific). All laboratory procedures were carried out according to the manufacturer's protocols. A previously described microarray method that has been standardized in our laboratory based on AIEOP-BFM array screening strategy recommendations was used for microdeletion and microduplication assessments (10). In total, 250 ng of genomic DNA was analyzed in accordance with the manufacturer's protocols. The study was based on an analysis of scanned data files that were generated with the Chromosome Analysis Suite v 3.3 (ChAS; Thermo Fisher Scientific). Furthermore, the copy numbers of altered regions (CNAs) were calculated, and the data were normalized to a reference model (Thermo Fisher Scientific) of baseline reference intensities, NA 33 (hg19/CRCh37). The copy number states and their breakpoints were determined with the use of the hidden Markov model software package. The threshold levels of log2 ratio ≥ 0.5 and ≤0.5 were used for the categorization of the altered chromosomal regions as CNV gains and losses, respectively. The identification of normal diploid markers in the cancer samples constituted an essential part of the algorithm, which was particularly significant in highly sample-induced aberrations. Furthermore, unaltered diploid markers were used for the calibration of signals, resulting in a log2 ratio of 0 (e.g., copy number 2). The algorithm also indicated that the identified unaltered diploid markers corresponded with CN = 4. In such a case, the log2 ratio was readjusted, and the chromosomal ploidy of 4 was reported. The obtained data were analyzed based on two different criteria: genome-wide CNVs and leukemia-associated region/gene-specific CNAs (leukemia genes_all_20150505; Fullerton Overlap Map_hg19). Our panel of 92 selected genes was created based on comprehensive literature describing genetic alterations and their role in pathogenesis T-ALL (7, 9, 11, 12). The genes are listed in Table S1. The minimal number of probes was applied to determine the CNAs were 50 probes for duplication (gain) and 25 probes for deletion (loss). Copy number–neutral loss of heterozygosity (LOH) is reported when the length is >3,000 kbp. To further identify the genes involved in the CNVs, two databases were applied: the UCSC database (http://genome.ucsc.edu) and Ensemble (http://www.ensembl.org). For microarray results, copy number polymorphisms were excluded based on comparison with the Database of Genomic Variants (http://projects.tcag.ca/variation/).
Statistical Analysis
Clinical parameters, such as patient's age at diagnosis, white blood count (WBC), hemoglobin, and platelet count at diagnosis, percentage of blasts in peripheral blood and bone marrow, MRD level, and survival parameters, are presented as medians with interquartile ranges (IQRs) and were compared using Kruskal–Wallis analysis of variance or the χ2 test. The association between CNAs and clinical features was tested using the χ2 test or Fisher exact test (when the expected values were <5). Individual p-values corrected for multiple comparisons of all 92 genes (Bonferroni correction) are reported. Additionally, for genes in which correlations of CNAs with clinical features were significant, a multivariate logistic regression model was used with CNVs as the outcome variable and clinical features as predictors. p < 0.05 were considered statistically significant. Statistical analysis was performed using Statistica Software version 13.1 PL (StatSoft, Krakow, Poland) and R software, version 3.5.4.
Results
Characterization of the Study Group
The group consisted of 27 girls (32%) and 59 boys (68%). The age of patients ranged from 1.08 to 17.67 years (median age, 8.37 years). The characteristics of the patient cohort are presented in Table 1.
Molecular Karyotypes of Childhood T-ALL
Fifty-five T-ALL cases showed normal karyotype, and in six cases, there was a failure of bone marrow cell culture in cytogenetic analysis. Original karyotypes and revisions based on SNP array analysis in 86 pediatric patients with T-ALL are presented in Table S2. Duplication or deletion of chromosomal regions exceeding 10 Mb, which are potentially cytogenetically visible, occurred in 46 cases (53%), including six cases (7%) with complex chromosomal alterations. In 16 cases (18%), alterations were limited only to homozygosity regions (hmz). No monosomies or cases of whole-chromosome LOH were found. Trisomies of whole chromosomes 7, 8, 13, 14, 19, 21, 22, and X were identified in eight cases (9%): one trisomy of chromosomes 7, 14, 19, 22, and X; two trisomies of chromosome 21; and three trisomies of chromosome 8. One patient presented trisomies in chromosomes 21, 22, and X. No structural abnormalities were found in 27 patients (31%) (Figure 1).
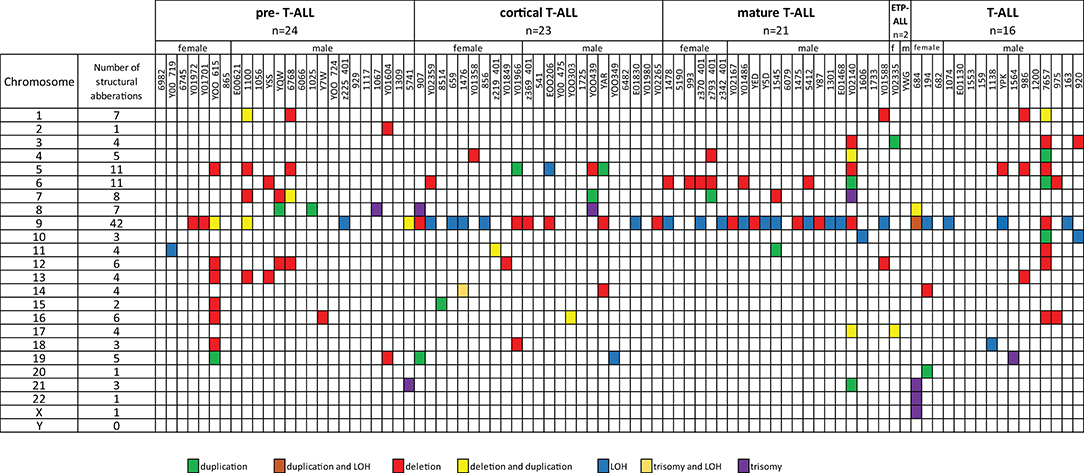
Figure 1. Frequencies of structural chromosomal abnormalities in 86 T-ALL cases according to particular T-ALL subtypes.
Additionally, in seven cases (8%), we noticed inconsistency between the cytogenetic and SNP array testing results. In general, array testing added novel or complementary genetic information to the cytogenetic results by better defining chromosome break points in 66 cases (77%). The smallest partial gains of overlapping regions were observed on chromosomes 9q 118,514,469–141,020,389 bp (9q33.1–q34.3), 5p 113,576–44,151,712 bp (5p15.33–p12), 7q 148,013,257–159,119,707 bp (7q36.1–q36.3), and 8q 131,101,950–146,295,771 bp (8q21–q24.3). The smallest regions of overlap of recurrent deletions were 9p 203,861–35,701,152 bp (9p11–p21.2) and 9p 203,861–35, 701,152 bp (9p21.1–pter), 6q 79,110,264–110,247,755 bp (6q14.1–q21), 5q 100,821,228–180,719,789 bp, (5q21.3–qter), 1p 849,466–8,096,240 bp 1(p36.33–p36.31), 7q 108,354,488–159,119,707 bp (7q31.1–qter), 12p 173,786–31,598,670 bp (12p13.31–p11.21), 13q 40,010,662–70,747,804 bp (13q13q21.3), and 16q 57,712,418–88,818,573 bp (16q21–q24.3). Twenty-eight cases of segmental LOH were found in 27 cases. The most common region for LOH was 9p 192,128–21,894,495 bp (9p24.3p13.3), identified in 21 cases. In the described cohort, the presence of alterations in chromosome 9 was significantly associated with a specific immunophenotype: mature T-ALL (68.75% of cases), whereas pre–T-ALL was characterized by a lack of abnormalities in this chromosome (83.33% of cases), p = 0.019.
Single-nucleotide polymorphism array testing revealed multiple alternating changes (normal segments, gains, and losses) within the 11q14.1q25 region of chromosome 11 in patient z219–401 (Figure 2). These alterations were also observed in cytogenetic analysis as triplications between 11q13 and 11q12 of chromosome 11.
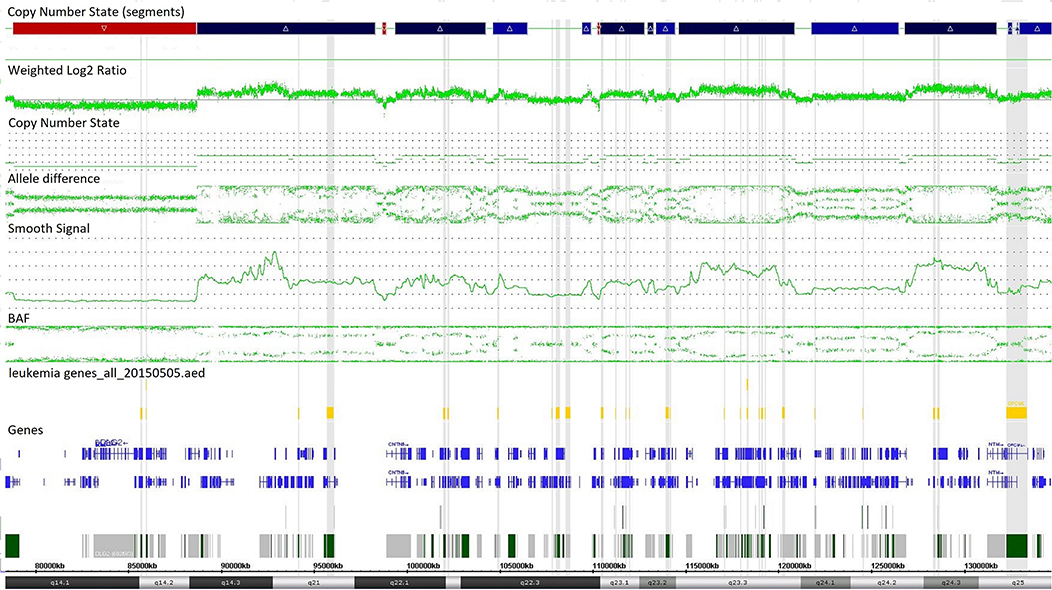
Figure 2. Complex copy number gains and losses in region 11q14.1q25 of chromosome 11 in patient with T-cell ALL by single-nucleotide polymorphism (SNP) array (case z219-401). Colored segmental regions (top line: red color—deletions; blue color—gains), copy number state allele difference, and smooth signal (bottom panel) aberrations by SNP array.
Case 986 presented an amplification at 9q34 with breakpoints in the NUP214 and ABL1 genes (Figure 3). All abnormalities appeared to be present in the entire leukemic population. Interphase FISH testing confirmed the amplification of NUP214 (Figure 4).
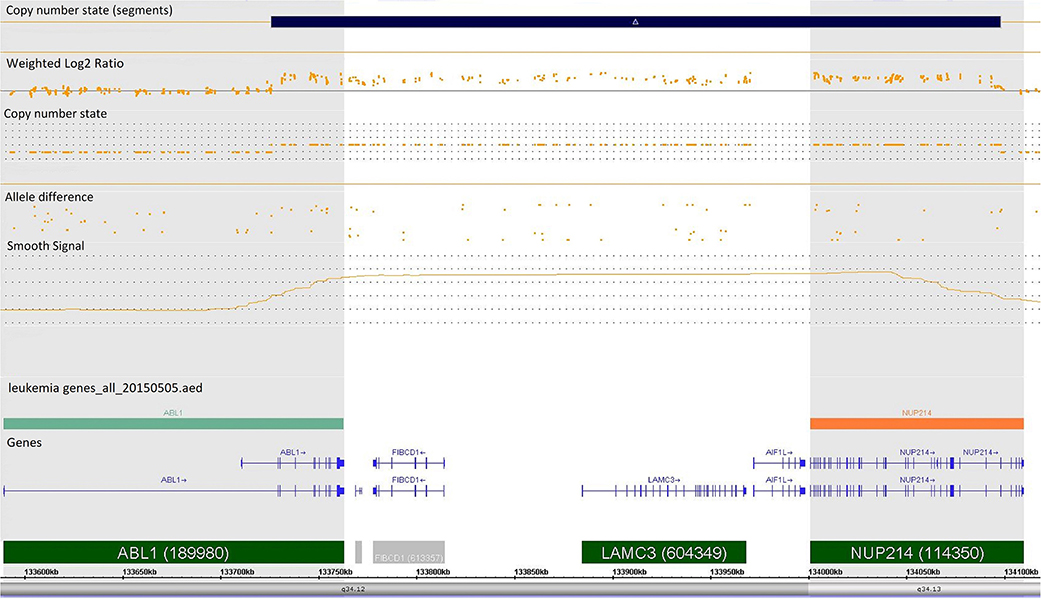
Figure 3. Single-nucleotide polymorphism (SNP) array of the amplification in 9q34 was limited by NUP214 (from exon 1 to exon 31) and ABL1 (from exon 2 to the 5′ end of the gene). Colored segmental region (top line: blue color—gains), copy number state allele difference, and smooth signal (bottom panel) aberrations by SNP array.
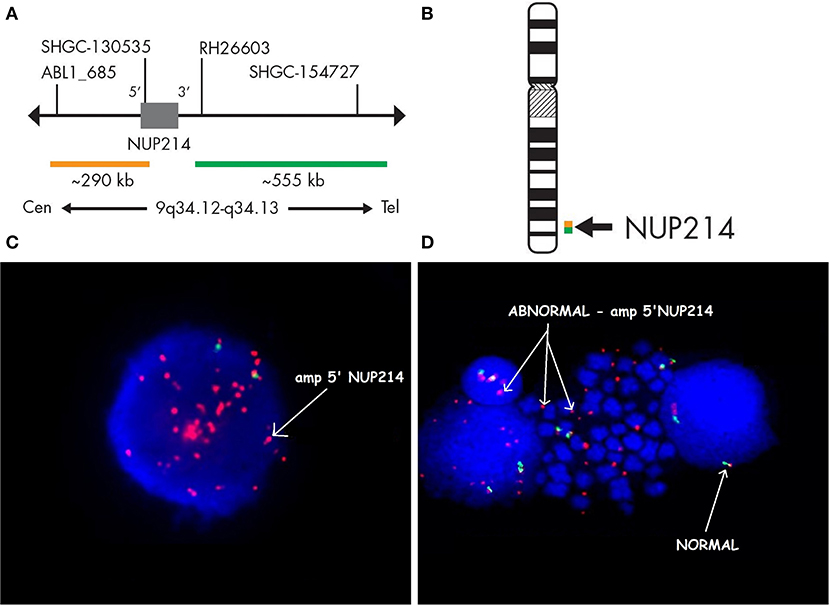
Figure 4. Fluorescence in situ hybridization revealing an amplification of NUP214. SPEC NUP214 probe map (A). Ideogram of chromosome 9 indicating the hybridization locus (B). Images of the FISH results with the ZytoLight-SPEC NUP214 Dual Color Break Apart Probe revealing NUP214 amplification (C,D). FISH was performed on both interphase (C) and metaphase cells (D). Cells displaying NUP214-ABL1 amplification are shown (arrows). Normal cells exhibited two red/green signals (arrows). Episomes are represented as small dots between chromosomes (D).
The Landscape of CNAs in Childhood T-ALL
A total of 769 CNAs, including trisomies, duplications, deletions, and segmental loss of heterozygosity, were detected in 86 analyzed samples (Figure 5). The median number of CNAs per case was 16 (mean = 16.4, range = 1–49). Copy number abnormalities >10 Mb and <10 Mb accounted for 41% (10 trisomies, 75 duplications, 200 deletions, and 28 LOHs) and 59% (28 duplications of the whole gene, 42 intragenic duplications, 185 whole-gene monoallelic deletions, 85 whole-gene biallelic deletions, and 109 intragenic monoallelic deletions of gene and seven intragenic biallelic deletions), respectively.
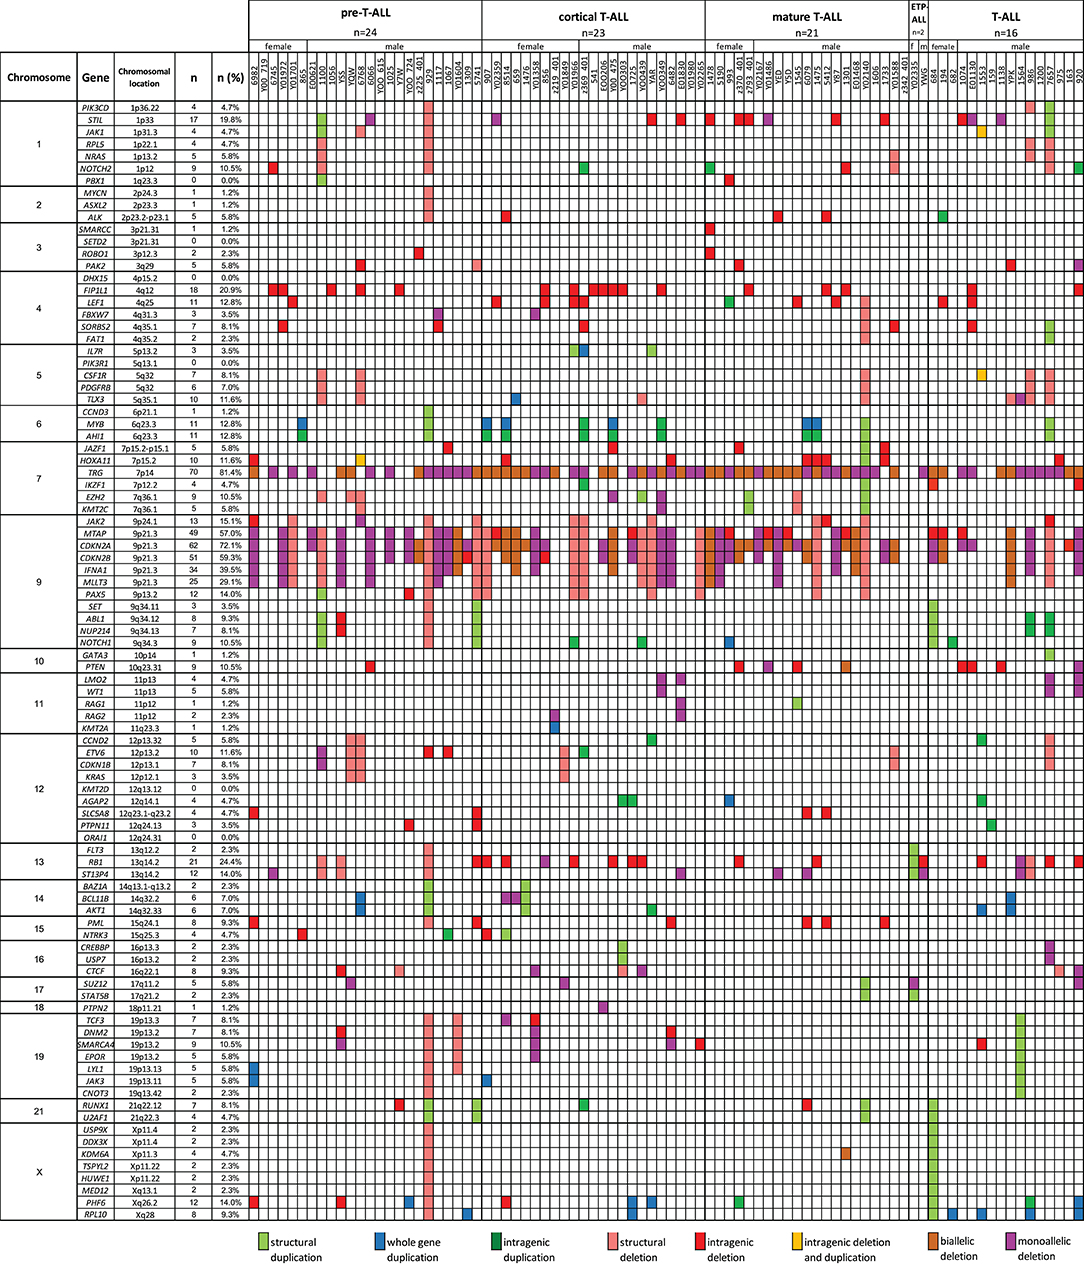
Figure 5. The frequencies of CNAs of all 92 selected genes in 86 T-ALL cases according to particular chromosomes.
We also selected a panel of 92 genes with documented roles in the pathogenesis of T-ALL and searched for CNAs within this gene panel. The results of the analysis are presented in Figure 6. In our study, CNAs in MYB and AIH1 (6q23.3) co-occurred in 11 cases (12.94%). We noticed whole-gene duplications associated with chromosomal alterations in 3 of 11 cases and intragenic duplications (from exon 3 to the 3′ end) in 2 of 11 cases. In the remaining cases, we noticed coexisting whole-gene duplications in MYB and intragenic duplications in AIH1 (from exon 27 to the 3′ end). More importantly, CNAs in MYB and AIH1 did not occur separately in any of our samples (Figure 5). In the case of DNM2 (19p13.2), CNA occurred in seven cases (8.24%). In two cases, we found duplications associated with chromosomal alterations, and in five cases, we found deletions, including two cases with deletion associated with chromosomal alteration, one monoallelic deletion, and two with intragenic monoallelic deletions (from exon 2 to 3′ end). Two cases of intragenic deletions in ROBO1 (3p12.3) were found in this study. Three cases presented deletion of exon 2 in PAK2 (3q29). In 18 samples (21.18%), intragenic deletions (from exon 6 to exon 10) in FIP1L1 (4q12) were identified. The monoallelic intragenic deletion (from upstream region 1 exon to 3 exon) occurred in LEF1 (4q25) in three cases. Monoallelic intragenic deletions covering the first exon were observed in HOXA11-7p15.2 (nine cases), in JAZF1-7p15.2-p15.1 (two cases), PTEN-10q23.31 (two cases), and in SLC5A8-12q23.1 (four cases). Monoallelic intragenic deletions of exons 3 and 4 were observed in six cases of PML (15q24.1). Moreover, monoallelic intragenic deletions involving the region from exon 16 to exon 22 of gene SORBS2 were found in five cases. Monoallelic intragenic deletions covering the last exon of genes were found in PTEN-10q23.31 (from exon 2 to 3′ end in three cases) and STIL-1 (from exon 8 or 12 to 3′ end in nine cases).
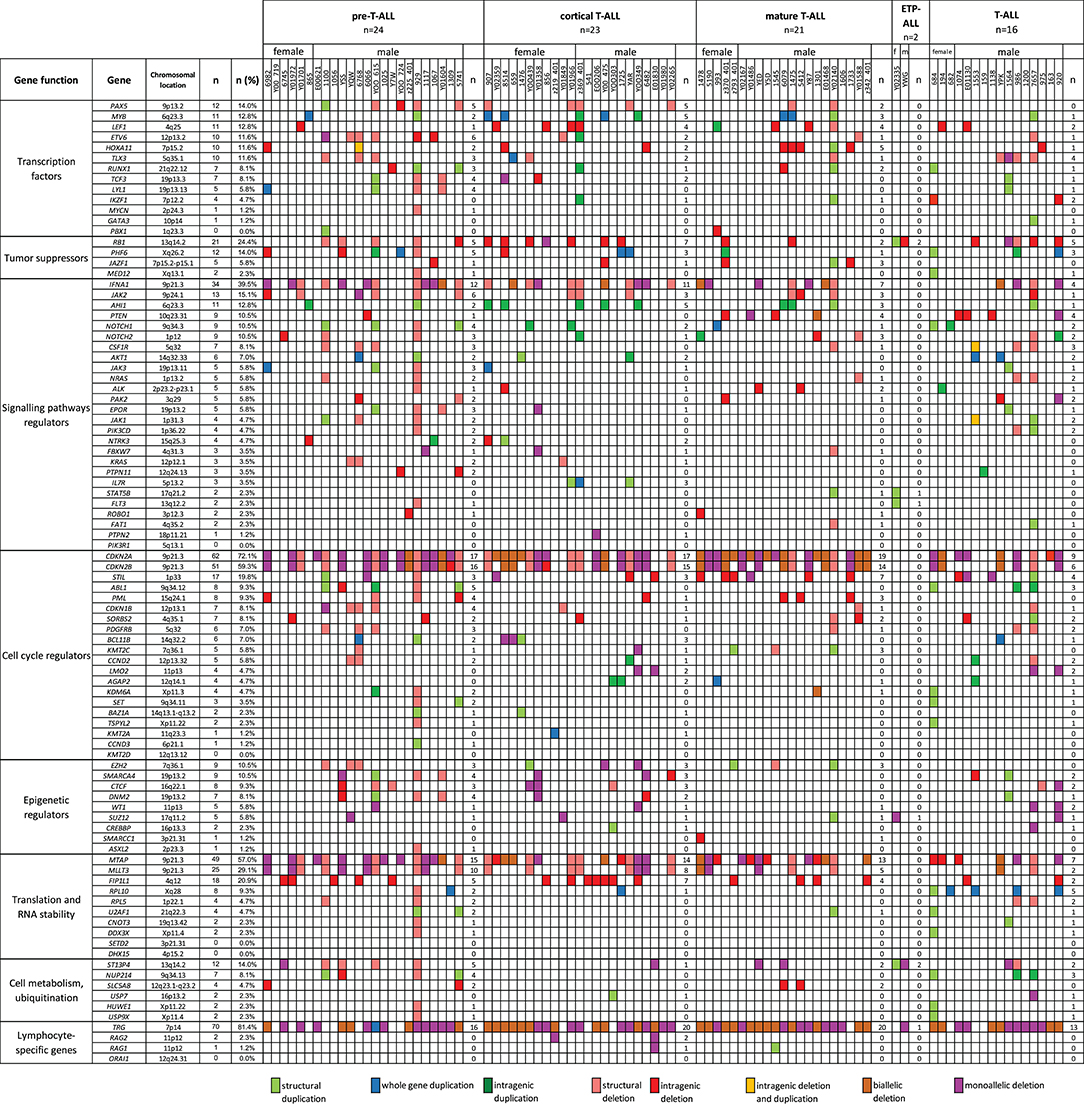
Figure 6. The frequencies of CNAs of all 92 selected genes in 86 T-ALL cases according to particular T-ALL subtypes. Owing to the small amount of data on the CNA frequency observed in T-ALL (data reported thus far are focused on the mutation status of analyzed genes), it is unclear what effects individual changes have on the pathogenesis and course of T-ALL.
Association of CNAs With Clinical Features and Response to Treatment
The relationship between microdeletions and microduplications of targeted genes (in which CNAs have been identified in at least 5% of patients), their functions, and immunophenotype is shown in Figure 7. Moreover, in some cases, multiple gene deletions occurred in the same patients. The following interactions were still significant after correction for multiple testing: CDKN2A-CDKN2B, CDKN2B-IFNA1, CDKN2B-MLLT3, PAX5-MLLT3, MTAP-CDKN2A, MTAP-CDKN2B, CDKN2A-IFNA1, IFNA1-MLLT3, MTAP-IFNA1, MTAP-MLLT3, PAX5-JAK2, JAK2-MLLT3, TRG-CDKN2A, PAX5-IFNA1, CDKN2A-MLLT3, JAK2-IFNA1, PAX5-MTAP, PAX5-CDKN2B, TRG-MTAP, STIL-PTEN, TRG-CDKN2B, JAK2-ETV6, PAX5-RB1 (Figure 8). The frequency of CNAs was analyzed depending on the pathways and gene functions: transcriptional and epigenetic activity, regulation of the cell cycle, and translation or RNA stability (Figure 9). We found no significant predominance of alterations in any of the tested genes. The biggest difference was apparent for deletion of CSF1R, which was more prevalent in boys than in girls (13.6% vs. 0.0%), but this difference was not statistically significant (p = 0.05237 without correction for multiple comparisons). We observed a significant difference in NOTCH2 (p = 0.010), ALK (p = 0.016), LEF1 (p = 0.023), TRG (p = 0.001), and SLC5A8 (p = 0.023) deletion frequencies in groups of patients with different WBC levels (p < 0.05). In our cohort, we found a difference in FIP1L1 (p = 0.004), LEF1 (p = 0.048), CSF1R (p = 0.048), PDGFRB (p = 0.025), and TLX3 (p = 0.035) deletion frequency in a group of patients with poor response to steroids, compared to a group with good response (p < 0.05). We noticed a significant difference in FIP1L1 (p = 0.015), LEF1 (p = 0.007), MTAP (p = 0.005), and CDKN2A (p = 0.016) deletion frequencies in the high-risk group of T-ALL patients in comparison to non-high-risk group (p < 0.05). We also observed a difference in FIP1L1 (p = 0.001), LEF1 (p = 0.044), PDGFRB (p = 0.034), CDKN2A (p = 0.027), CDKN2B (p = 0.020), and STAT5B (p = 0.008) deletion frequency in group of patients with MRD flow cytometry (MRD FMC) levels on day 15 below 10%, compared to the group of patients with MRD FMC levels on day 15 exceeding 10% (p < 0.05). We found a significant difference in FIP1L1 (p = 0.003), WT1 (p = 0.014), and PHF6 (p = 0.043) deletion frequency in the group of patients who relapsed in comparison to the group of patients who did not relapse (p < 0.05). We observed a difference in MTAP (p = 0.003), IFNA1 (p = 0.007), and MLLT3 (p = 0.008) deletion frequency in the group of younger patients (<10 years old), compared to the group of older patients (<10 years old) (p < 0.05) (Table 2). After adjusting for the multiple comparisons (92 genes), none of the associations between CNAs and clinical features analyzed was statistically significant.
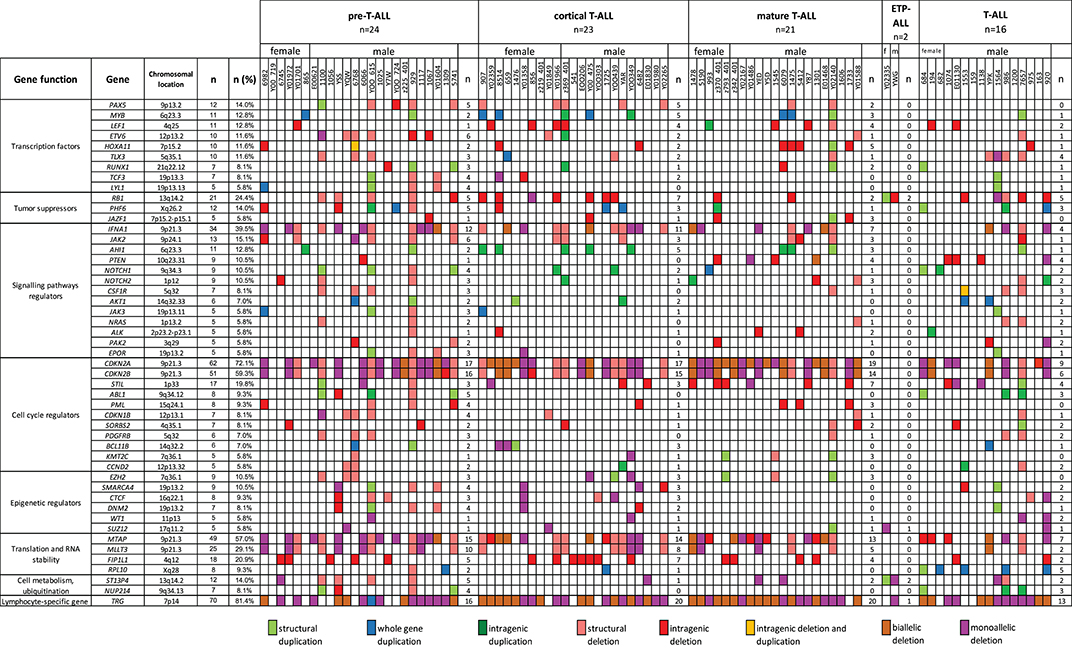
Figure 7. Overview of molecular alterations identified in 86 samples according to particular subtypes of T-ALL. Heat map represents genes in which CNAs have been identified in at least 5% of patients.
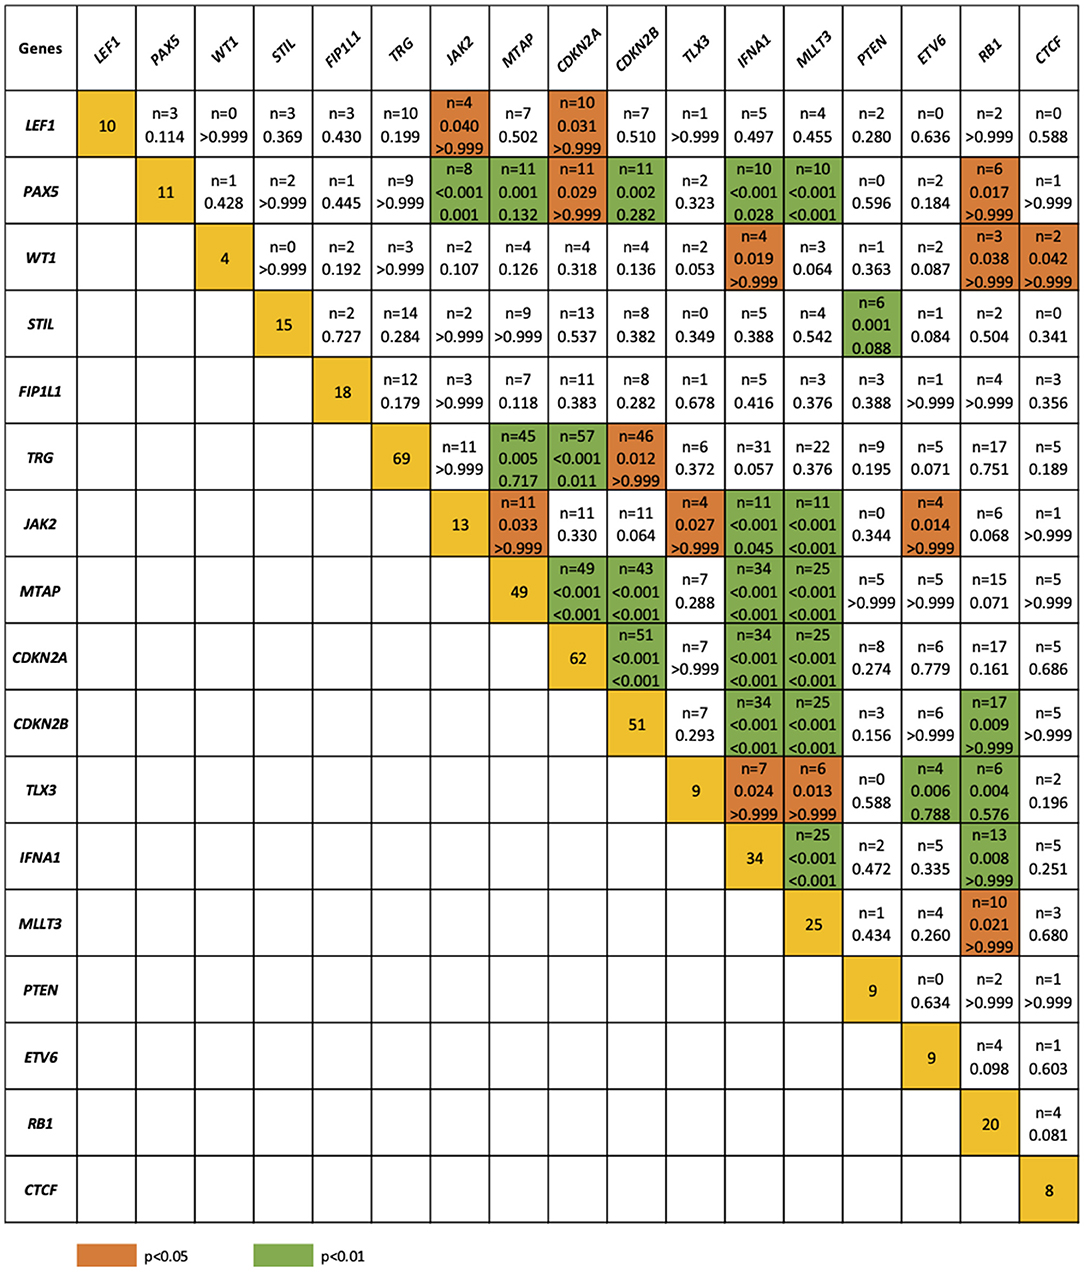
Figure 8. Concomitance of gene deletions in 86 children with T-ALL. Yellow boxes indicate the total number of patients with a deletion. Other boxes indicate the number of patients with two specific abnormalities. Orange and blue colors indicate significant overlap associations in individual comparisons (p < 0.01 or p < 0.05), respectively. If association in individual comparison of two genes was significant, p-value corrected for multiple comparisons was added.
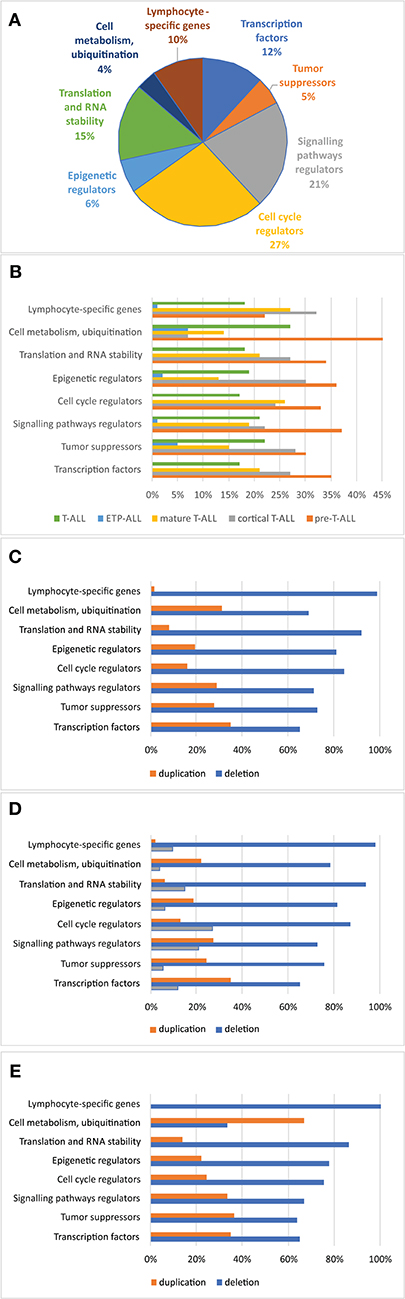
Figure 9. Frequency of copy number alterations identified in 86 T-ALL cases. The incidence of CNAs relative to specific groups of genes (A). Percentages of CNAs relative to specific groups of genes (B). Percentages of CNAs relative to specific group of genes in the group of boys (C), girls (D), and all cases (E).
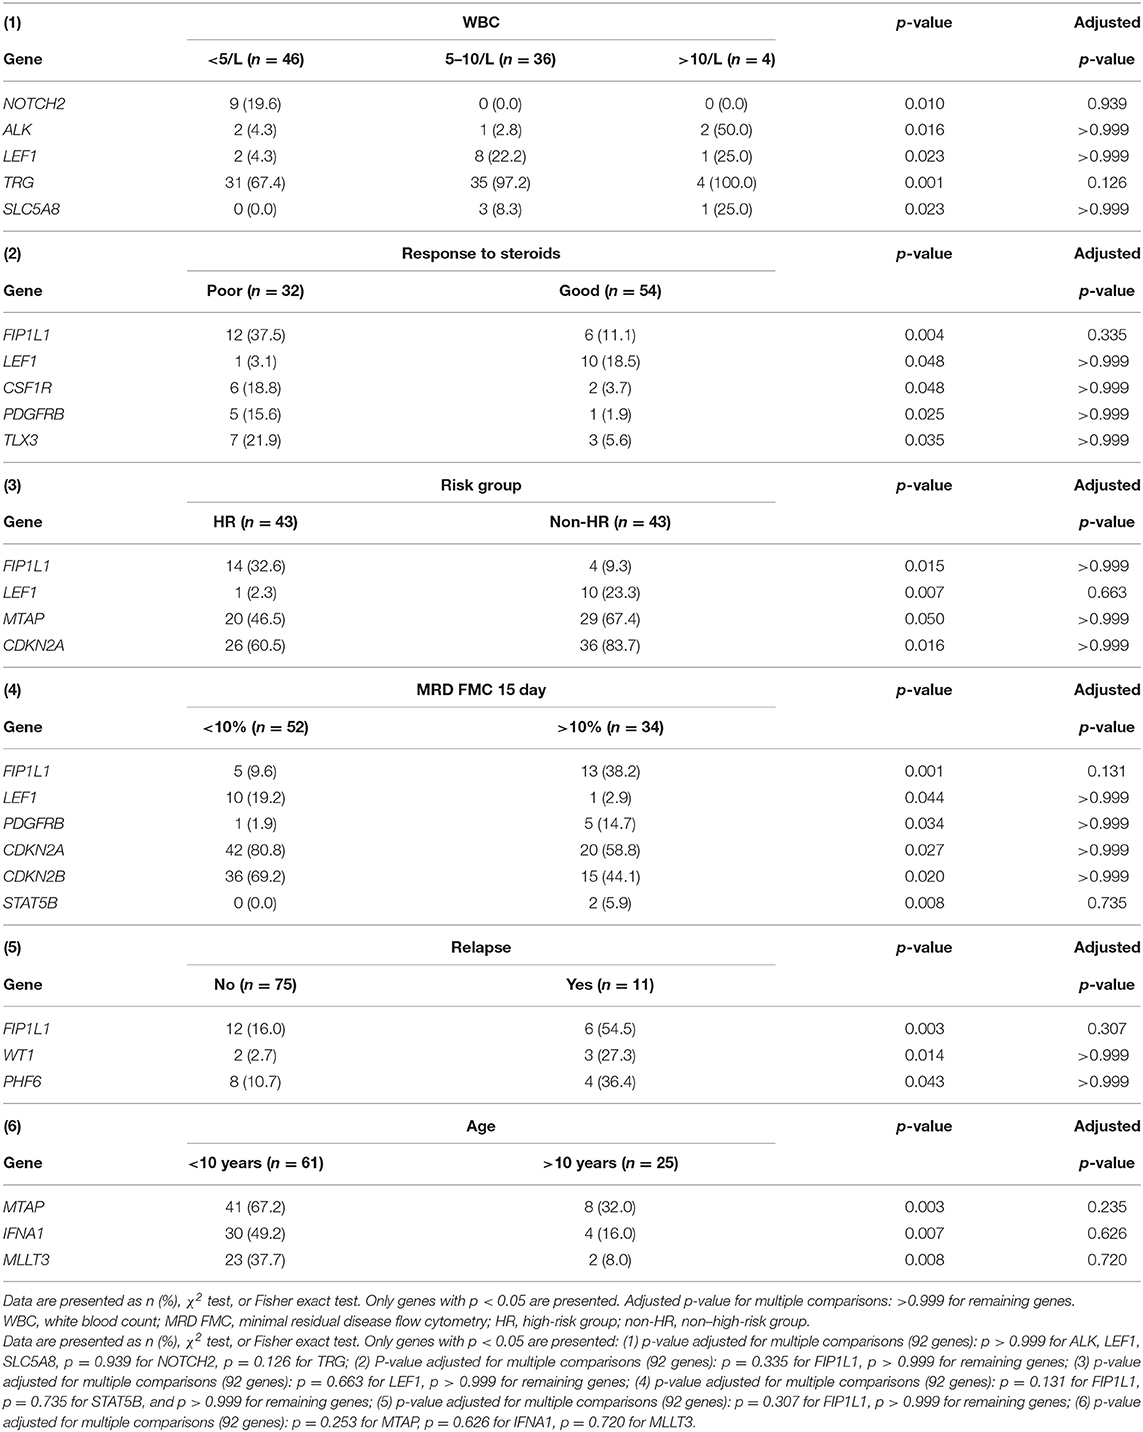
Table 2. A comparison between the presence of deletions in particular genes and clinical features of T-ALL patients.
In multivariate regression models, CNAs were predicted by following covariates: in CDKN2A by high risk (HR) (β = −1.86, p = 0.030) with HR decreasing the risk of CNAs; in FIP1L1, PHF6, and WT1 by relapse (respectively, β = 1.67, p = 0.046; β = 2.15, p = 0.032; and β = 4.66, p = 0.036) with relapse increasing the risk of CNAs; in TRG by WBC (β = 0.001, p = 0.007) with increasing risk of CNAs with growing WBC; in IFNA1 and MLLT3 by age (respectively, β = −0.12, p = 0.039; and β = −0.18, p = 0.011) with decreasing risk of CNAs with growing age (Table 3).
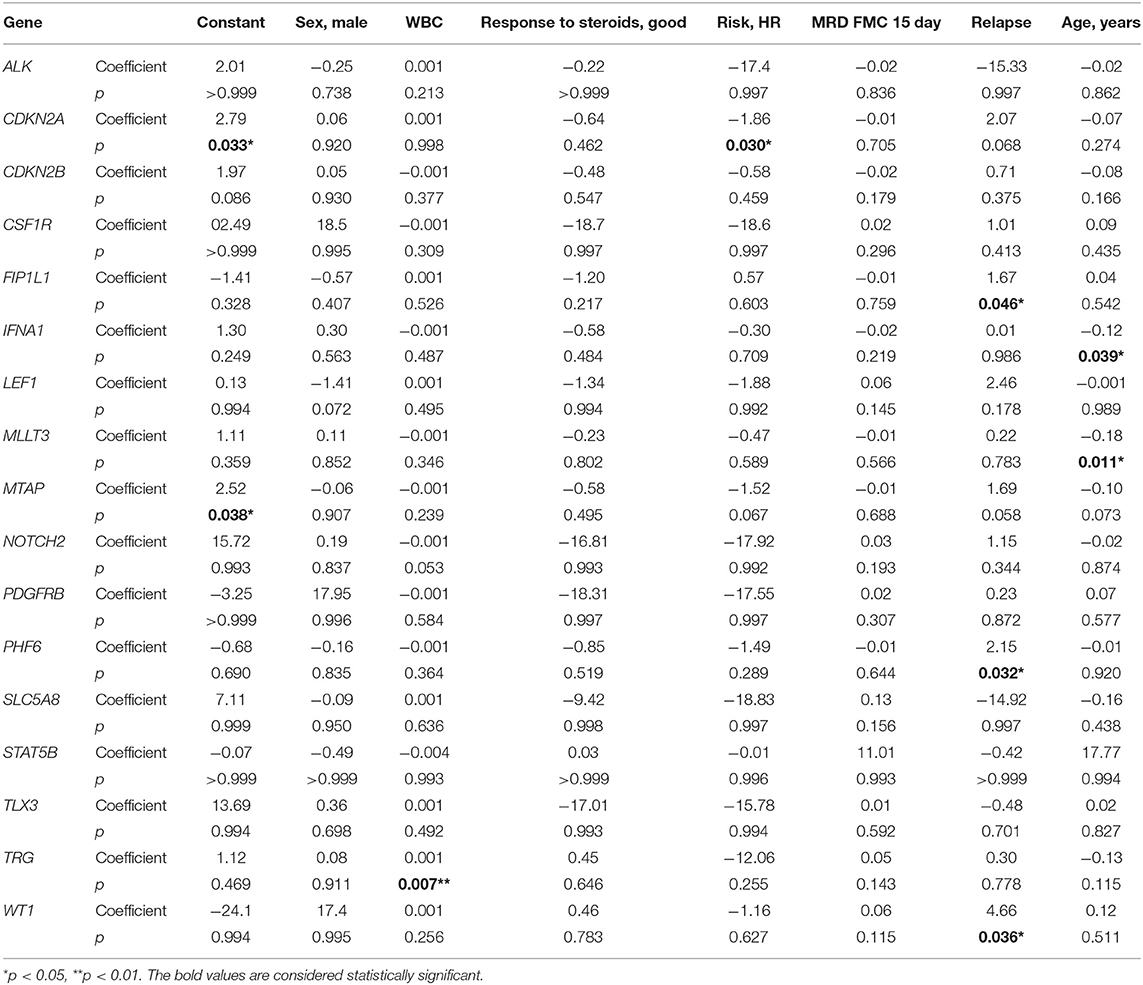
Table 3. Variables predictive of CNVs in particular genes in multivariate logistic regression coefficient–β coefficient in logistic regression model with CNVs as the outcome variable.
Discussion
In this study, we performed whole-genome characterization of CNAs in 86 pediatric patients diagnosed with T-ALL. T-cell acute lymphoblastic leukemia can be classified based on both the immunophenotype and genetic alterations. Many of these variations are not mutually exclusive, and together, they lead to dysregulation of several signaling pathways involved in cell maturation, differentiation, proliferation, and apoptosis (8, 9, 11). The deletions/duplications rates in our cohort were similar to those previously described in the literature (9). One of the limitations of this study is lack of information about point mutations and gene fusions in our T-ALL samples, which would place specific CNAs that have been detected in the leukemic genome in the context of the remaining molecular defects.
The SNP array significantly improved the molecular characterization of pediatric ALL (10). Olsson et al. (13) presented 91 and 84% abnormal karyotypes after SNP array analysis of patients with B-cell precursor (BCP)–ALL and T-ALL, respectively. In our study, karyotypes were altered in 77% of pediatric T-ALL cases. Numerical aberrations were present in only 10 patients (single trisomies). In our T-ALL cohort, we found fewer structural abnormalities >10 Mb compared to BCP-ALL, no monosomies, and only segmental LOH. These observations correspond with those of other studies (14). Whole-chromosome Uniparental Disomies (UPIDs) are very rare (<1%) in T-ALL (14, 15), in contrast to pediatric BCP-ALL, where such LOHs are observed in 5% to 10% of cases (16). Moreover, Karrman et al. (15) suggested that deletions in T-ALL are more common [100/128 (78%)] than duplications [28/128 (22%)], which is consistent with our observations. However, repeated structural abnormalities are more common in T-ALL, as is LOH within chromosome 9. Additionally, the most frequent structural changes (>10 Mb) occurred on 9p21.3, as monoallelic or biallelic deletions within 9p21.3.
In two cases, SNP arrays allowed the identification of aberrations that were not detected by conventional karyotyping. The main advantage of SNP arrays is that DNA from tumor cells is used instead of mitotically dividing cells within the cell culture. In our cohort, NUP214 and ABL1 regions were amplified in 5 to 6% of T-ALL patients (17). We detected the NUP214-ABL1 extrachromosomal (episomal) amplification of ABL1 and NUP214 and confirmed the findings by FISH. This study showed the impact of the SNP array in the detection of episomal amplification, which is undetectable using routine cytogenetic tests. The amplification of the NUP214-ABL1 gene on episomes is associated with a higher risk of relapse and chemoresistance in T-ALL. However, aberrantly expressed Abl1 kinase due to NUP214-ABL1 fusion is a target for therapy with Abl1 inhibitors. Therefore, identifying ABL1 fusions in T-ALL is extremely important from a diagnostic and therapeutic point of view (18).
Moreover, we presented a patient (z219-401) with a chromothriptic-like pattern on chromosome 11. Chromothripsis has been associated with aggressive tumor progression and poor prognosis (19). In childhood, ALL chromothripsis has been described in rare BCP-ALL cases showing intrachromosomal amplification of chromosome 21(iAMP21) (20). The biological and clinical significance of this genome instability involving the other chromosomes in ALL needs further investigation (21).
Regarding abnormalities involving genes acting as transcription factors, PAX5 was the most frequently altered gene [n = 12 (14.0%)], which is in accordance with previous studies (11, 13). PAX5 plays a key role in the development and maturation of B cells. Inactivation of PAX5 as a result of deletion or mutation is characteristic of BCP-ALL. However, the loss of PAX5 function may affect the pathogenesis of T-ALL because B-cell dedifferentiation to the progenitor cell stage with multilinear potential occurs (12, 22). A decrease in PAX5 expression in T-ALL may also be associated with an increase in promoter methylation of this gene (23).
RUNX1 genetic alterations are associated with poor prognosis because inactivation of this gene results in inhibition of T-cell transformation (24). The lack or reduced expression of RUNX1 also affects the activity of MYB, MYC, and GATA3 oncogenes, which confirms the key role of RUNX1 in the pathogenesis of T-ALL (24). In the described cohort of patients, RUNX1, MYB, and GATA3 changes affected 8.1% (n = 7), 12.8% (n = 11), and 1.2% (n = 1) of cases, respectively, which corresponds to the results that have been previously reported (4, 9, 25).
Deletion of the Wnt signaling central transcription mediator, LEF1, was found in 12.8% (n = 11) of cases. The activity of this signaling pathway is closely related to the normal course of hematopoiesis; thus, the disturbed expression of key Wnt pathway molecules is characteristic of leukemias (26). Other studies reported a similar frequency of LEF1 alterations in T-ALL (4, 27, 28). Moreover, Wang and Zhang (29) indicated that lower expression of LEF1 is associated with ETP-ALL, but we cannot compare our data to published results because of the limited number of ETP-ALL cases (n = 2) in our cohort.
The role of the tumor suppressor PHF6 in the pathogenesis of T-ALL is not fully understood, but it remains one of the most frequently altered genes in this disease. PHF6 alterations may be associated with glucocorticoid resistance (30). The number of PHF6 CNAs in the analyzed group was similar to that previously reported (14% vs. 13%) (31). Moreover, Wendorff et al. (32) reported that the promotion of self-renewal capacity of hematopoietic stem cells driven by the loss of PHF6 stimulates leukemia initiation T-ALL. Thus, PHF6 deletion may be associated with leukemia development (32). Another negative regulator of the cell cycle is RB1; its alterations were detected in 24.4% (n = 21) of cases. Another mechanism by which RB1 activity might also be inhibited in T-ALL is by increased expression of mir-150 (33). We also observed alterations in MED12 in 2.33% (n = 2) of cases. Deletion or mutation within MED12 oncogene may act as a tumor suppressor by inhibiting chemotherapy-induced apoptosis. This antiapoptotic effect by regulating the TGFβ pathway translates into an increase in resistance to anticancer drugs in the case of repression of MED12 (34). We also identified CNAs within JAZF1 in 5.81% of cases (n = 5). Chromosomal aberrations involving this gene are associated with the pathogenesis of endometrial stromal tumors, and JAZF1 itself acts as a transcription repressor (35). To date, no alterations within this gene have been described in the context of hematological diseases, including ALL.
Although NOTCH1 alterations play a key role in the pathogenesis of T-ALL (36), NOTCH1 abnormalities were detected in 10.5% (n = 9) of the leukemic cases in our cohort. However, this difference may result from the fact that we only analyzed CNAs in the NOTCH1 and NOTCH2 genes. In T-ALL cases, mutations within the NOTCH1 gene occurred much more frequently than NOTCH1 deletions or duplications (36). Impaired NOTCH1 activity may result in the activation of specific oncogenes (c-MYC, NFkB, or mTOR) or inhibition of tumor suppressor expression (FBXW7, PTEN, CDKN1B) (37). Therefore, we cannot estimate the impact of alterations within genes of NOTCH1-related signaling pathways, as we do not have data on NOTCH1 mutations (37). Similarly, we observed that FBXW7 alterations occurred much less frequently in our cohort compared to the frequency found in other studies (3.4% vs. 19–20%) (38, 39). FBXW7 controls protein turnover by participating in the ubiquitination processes of these molecules and is also a part of the NOTCH signaling pathway. Therefore, the NOTCH signaling pathway is activated most often by genetic alterations within this gene or as a result of loss of function of its negative regulator, FBXW7. The results from previous studies do not clearly indicate the prognostic value of NOTCH1 and FBXW7 lesions in T-ALL (38–41). Nevertheless, SNP arrays are not appropriate for NOTCH1 and FBXW7 mutation status assessment as a single technique, and other sequencing methods need to be used to obtain a complete profile of aberrations in these genes in T-ALL patients.
Activation of Notch1 pathway can also occur as a result of dysregulation within other signaling pathways, such as the PI3K/mTOR pathway. We identified genetic alterations involving the PI3K/mTOR pathway genes in 20 cases (PTEN: n = 10, AKT1: n = 6, PIK3CD: n = 4), which corresponded to the data previously described (42–44). PTEN is a negative regulator of Notch1 pathway, and disturbances in its activity (due to mutation or deletion) may be associated with unfavorable long-term outcomes in some cases of T-ALL (45, 46). Additionally, a change in PTEN expression secondary to NOTCH1-activating mutation may result in cellular resistance to γ-secretase inhibitors (43). A few studies have shown that PTEN alterations can affect the risk of relapse; therefore, screening of alterations of this gene could potentially improve risk group stratification (43, 44).
In the study cohort, other signaling pathways, such as the JAK/STAT pathway and RAS pathway, may be affected by CNAs within particular genes. The CNA rates of genes of these pathways are similar to data previously described (31.4% vs. 25% and 11.6% vs. 15%, respectively) (9). Impaired activity of RAS occurs as a result of NRAS and KRAS deletion or FLT3 duplication. For each of these genes, the alteration rate was similar to that previously described in childhood lymphoblastic leukemia (9).
The interferon α1 gene, IFNA1, had a mutation frequency of 39.5% (n = 34). Interferons have antiproliferative activity, and their expression influences cancer initiation or progression (47).
We observed an increased frequency of alterations within the genes involved in cell cycle regulation. CDKN2A/B deletions [n = 62 (72.1%) and n = 51 (59.3%), respectively] showed even higher prevalence than that described in other studies. CDKN2A/B acts as a tumor suppressor (48, 49). According to our results, only CDKNA2 deletions were associated with a specific mature immunophenotype of T-ALL (90.5%), in comparison with cortical–T-ALL (73.9%) and pre–T-ALL (68.0%) (p = 0.04). Our data also showed a statistically significant co-occurrence of deletions in CDKN2A and LEF, PAX5, TRG, and MTAP, as well as CDKN2B and PAX5, TRG, JAK2, and MTAP. Co-occurrence of CDKN2A and CDKN2B deletions was reported in 51 cases. Some studies estimated the effect of deletion (mono- or biallelic) of CDKN2A/B on outcome, but the results are inconclusive (50). Similar concomitance between particular gene deletions (WT1, IFNA, RB1, and CTCF) was previously reported by Zhang et al. (51). We did not observe the co-occurrence between SUZ12 and CDKN2AB alterations, although Noronha et al. (4) indicate such concomitance in their study. The study of Karrman et al. (15) revealed that CDKN2A deletions were significantly associated with a high WBC count, but we did not find a similar association in our cohort. Interestingly, the co-occurrence of CDKN2A deletions with CDKN2B, MTAP, or MLLT3 deletions in the same T-ALL patients was previously reported by Yeh et al. (52). Moreover, our results indicate similar concomitance between MTAP and CDKNAB deletions. However, in contrast to our results, Yeh et al. (52) reported no significant correlation between the status of CNAs and clinical features, such as sex, age, and WBC.
Deletions and duplications within the genes responsible for posttranscriptional processing play an important role in leukemogenesis. Copy number abnormality rate in this group of genes is comparable to the data described in the literature (9). In our cohort, the most frequently mutated gene in this group was FIP1L1 [n = 18 (20.9%)]. FIP1L1 status was significantly related to the classical prognostic factors in T-ALL. Alterations in FIP1L1 were more often associated with a worse response to prednisone and a higher MRD level on day 15 (>10%). To date, no case indicating a relationship between intragenic FIP1L1 deletion and T-ALL pathogenesis has been described. However, in myeloproliferative disorders with eosinophilia, FIP1L1-PDGFRBA fusion has been observed. The FIP1L1-PDGFRA protein is composed of the first 12 exons of FIP1L1 and from truncated exon 12 (containing the last 17 amino acids) to exon 23 of PDGFRA. The FIP1L1-PDGFRA fusion protein is a constitutively activated tyrosine kinase that joins the first 233 amino acids of FIP1L1 to the last 523 amino acids of PDGFRA (53). The presence of such a rearrangement allows the implementation of targeted treatment with the tyrosine kinase inhibitor imatinib (54, 55). In our cohort, the intragenic deletion of FIP1L1 (exons 5–8 or exons 6–10) was found. To date, there are no published data indicating the role of the FIP1L1 intragenic deletion in T-ALL pathogenesis.
Inactivation of epigenetic factors results in arresting T-cell development, which was confirmed by studies on ETP-ALL mouse models (56). Furthermore, WT1 haploinsufficiency may promote the accumulation of somatic mutations or mutations of other epigenetic factors in progenitor cells, leading to tumor transformation (57). Recurrent microduplications in T-ALL are less common. MYB (6q23.3) is gained in ~10% of cases as a focal duplication involving solely the MYB locus (12). Interestingly, in our study, CNAs in MYB exist only in association with AIH1 alterations, accounting for 12.94% of cases.
Conclusions
Our analysis shows that the profile of CNAs is associated with the immunophenotypic and clinical features of T-ALL. For the first time, we described the link between FIP1L1 deletions and the clinical features of patients with T-ALL. Moreover, we observed an increased percentage of cases with concomitant alterations within the MYB and AIH1 genes. We also characterized structural aberrations >10 Mbp, which was lower in our cohort than in BCP-ALL, and we showed that SNP array definitely improved the molecular characterization of pediatric T-ALL. In some specific cases including those harboring NUP214-ABL1, SNP array might be valuable diagnostic tool for selecting patients who may benefit from targeted therapy.
Data Availability Statement
The datasets presented in this study can be found in online repositories. The names of the repository/repositories and accession number(s) can be found below: NCBI GEO under the accession GSE147381.
Ethics Statement
The studies involving human participants were reviewed and approved by Ethics Committee of Medical University of Silesia. Written informed consent to participate in this study was provided by the participants' legal guardian/next of kin.
Author Contributions
ML planned the study. ML, AP, and WM were responsible for the conception and design of the study. JZ, ŁS, KS, OH, and TS shared patients' clinical data. BS and JT conducted the laboratory work. ML and MW were responsible for the interpretation of genetic data. MB was responsible for additional statistical analysis. ML, MW, and JZ were responsible for the acquisition of literature for the manuscript. ML and MW wrote the paper. AP, WM, JK, and TS supervised the paper. All authors have read and approved the final manuscript.
Funding
This work was supported by the National Centre for Research and Development, Poland (grant number: STRATEGMED3/304586/5/NCBR/2017). AP was supported by Polpharma Scientific Foundation (grant number: 9/XV/2016).
Conflict of Interest
The authors declare that the research was conducted in the absence of any commercial or financial relationships that could be construed as a potential conflict of interest.
Supplementary Material
The Supplementary Material for this article can be found online at: https://www.frontiersin.org/articles/10.3389/fonc.2020.01184/full#supplementary-material
References
1. Muffly L, Larson RA. Improving outcomes in childhood T-cell acute lymphoblastic leukemia: promising results from the Children's Oncology Group incorporating nelarabine into front-line therapy. Transl Pediatr. (2012) 1:120–2. doi: 10.3978/j.issn.2224-4336.2012.09.03
2. Chiaretti S, Zini G, Bassan R. Diagnosis and subclassification of acute lymphoblastic leukemia. Mediterr J Hematol Infect Dis. (2014) 6:e2014073. doi: 10.4084/mjhid.2014.073
3. Coustan-Smith E, Mullighan CG, Onciu M, Behm FG, Raimondi SC, Pei D, et al. Early T-cell precursor leukaemia: a subtype of very high-risk acute lymphoblastic leukaemia. Lancet Oncol. (2009) 10:147–56. doi: 10.1016/S1470-2045(08)70314-0
4. Noronha EP, Marques LVC, Andrade FG, Thuler LCS, Terra-Granado E, Pombo-de-Oliveira MS, et al. The profile of immunophenotype and genotype aberrations in subsets of pediatric T-cell acute lymphoblastic leukemia. Front Oncol. (2019) 9:316. doi: 10.3389/fonc.2019.00316
5. Pui CH, Robison LL, Look AT. Acute lymphoblastic leukaemia. Lancet. (2008) 371:1030–43. doi: 10.1016/S0140-6736(08)60457-2
6. Lustosa de Sousa DW, de Almeida Ferreira FV, Cavalcante Félix FH, de Oliveira Lopes MV. Acute lymphoblastic leukemia in children and adolescents: prognostic factors and analysis of survival. Rev Bras Hematol Hemoter. (2015) 37:223–9. doi: 10.1016/j.bjhh.2015.03.009
7. Hunger SP, Mullighan CG. Acute lymphoblastic leukemia in children. N Engl J Med. (2015) 373:1541–52. doi: 10.1056/NEJMra1400972
8. Mullighan CG. The molecular genetic makeup of acute lymphoblastic leukemia. Hematol Am Soc Hematol Educ Prog. (2012) 2012:389–96. doi: 10.1182/asheducation.V2012.1.389.3798360
9. Liu Y, Easton J, Shao Y, Maciaszek J, Wang Z, Wilkinson MR, et al. The genomic landscape of pediatric and young adult T-lineage acute lymphoblastic leukemia. Nat Genet. (2017) 49:1211–18. doi: 10.1038/ng.3909
10. Lejman M, Zawitkowska J, Styka B, Babicz M, Winnicka D, Zaucha-Prazmo A, et al. Microarray testing as an efficient tool to redefine hyperdiploid paediatric B-cell precursor acute lymphoblastic leukaemia patients. Leuk Res. (2019) 83:1–11. doi: 10.1016/j.leukres.2019.05.013
11. Thakral D, Kaur G, Gupta R, Benard-Slagter A, Savola S, Kumar I, et al. Rapid identification of key copy number alterations in B- and T-cell acute lymphoblastic leukemia by digital multiplex ligation-dependent probe amplification. Front Oncol. (2019) 9:871. doi: 10.3389/fonc.2019.00871
12. Karrman K, Johansson B. Pediatric T-cell acute lymphoblastic leukemia. Genes Chromosomes Cancer. (2017) 56:89–116. doi: 10.1002/gcc.22416
13. Olsson L, Lundin-Ström KB, Castor A, Behrendtz M, Biloglav A, Norén-Nyström U, et al. Improved cytogenetic characterization and risk stratification of pediatric acute lymphoblastic leukemia using single nucleotide polymorphism array analysis: a single center experience of 296 cases. Genes Chromosomes Cancer. (2018) 57:604–7. doi: 10.1002/gcc.22664
14. Kawamata N, Ogawa S, Zimmermann M, Kato M, Sanada M, Yamatomo G, et al. Molecular allelokaryotyping of pediatric acute lymphoblastic leukemias by high-resolution single nucleotide polymorphism oligonucleotide genomic microarray. Blood. (2008) 111:776–84. doi: 10.1182/blood-2007-05-088310
15. Karrman K, Castor A, Behrendtz M, Forestier E, Olsson L, Ehinger M, et al. Deep sequencing and SNP array analyses of pediatric T-cell acute lymphoblastic leukemia reveal NOTCH1 mutations in minor subclones and a high incidence of uniparental isodisomies affecting CDKN2A. J Hematol Oncol. (2015) 8:42. doi: 10.1186/s13045-015-0138-0
16. Lundin KB, Olsson L, Safavi S, Biloglav A, Paulsson K, Johansson B. Patterns and frequencies of acquired and constitutional uniparental isodisomies in pediatric and adult B-cell precursor acute lymphoblastic leukemia. Genes Chromosomes Cancer. (2016) 55:472–9. doi: 10.1002/gcc.22349
17. Papenhausen P, Kelly CA, Zhang Z, Tepperberg J, Burnside RD, Schwartz S. Multidisciplinary analysis of pediatric T-ALL: 9q34 gene fusions. Cancer Genet. (2019) 231–2:1–13. doi: 10.1016/j.cancergen.2018.12.002
18. Zhou MH, Yang QM. NUP214 fusion genes in acute leukemia. Oncol Lett. (2014) 8:959–62. doi: 10.3892/ol.2014.2263
19. Ratnaparkhe M, Hlevnjak M, Kolb T, Jauch A, Maass KK, Devens F, et al. Genomic profiling of acute lymphoblastic leukemia in ataxia telangiectasia patients reveals tight link between ATM mutations and chromothripsis. Leukemia. (2017) 31:2048–56. doi: 10.1038/leu.2017.55
20. Li Y, Schwab C, Ryan S, Papaemmanuil E, Robinson HM, Jacobs P, et al. Constitutional and somatic rearrangement of chromosome 21 in acute lymphoblastic leukaemia. Nature. (2014) 508:98–102. doi: 10.1016/S0959-8049(14)50362-0
21. Koltsova AS, Pendina AA, Efimova OA, Chiryaeva OG, Kuznetzova TV, Baranov VS. On the complexity of mechanisms and consequences of chromothripsis: an update. Front Genet. (2019) 10:393. doi: 10.3389/fgene.2019.00393
22. Cobaleda C, Jochum W, Busslinger M. Conversion of mature B cells into T cells by dedifferentiation to uncommited progenitors. Nature. (2007) 449:473–7. doi: 10.1038/nature06159
23. Hütter G, Kaiser M, Neumann M, Mossner M, Nowak D, Baldus CD, et al. Epigenetic regulation of PAX5 expression in acute T-cell lymphoblastic leukemia. Leuk Res. (2011) 35:614–19. doi: 10.1016/j.leukres.2010.11.015
24. Choi A, Illendula A, Pulikkan JA, Roderick JE, Tesell J, Yu J, et al. RUNX1 is required for oncogenic Myb and Myc enhancer activity in T-cell acute lymphoblastic leukemia. Blood. (2017) 130:1722–33. doi: 10.1182/blood-2017-03-775536
25. Chen B, Jiang L, Zhong ML, Li JF, Li BS, Peng LJ, et al. Identification of fusion genes and characterization of transcriptome features in T-cell acute lymphoblastic leukemia. Proc Natl Acad Sci USA. (2018) 115:373–8. doi: 10.1073/pnas.1717125115
26. Kirstetter P, Anderson K, Porse BT, Jacobsen SE, Nerlov C. Activation of the canonical Wnt pathway leads to loss of hematopoietic stem cell repopulation and multilineage differentiation block. Nat. Immunol. (2006) 7:1048–56. doi: 10.1038/ni1381
27. Montaño A, Forero-Castro M, Marchena-Mendoza D, Benito R, Hernández-Rivas JM. New challenges in targeting signaling pathways in acute lymphoblastic leukemia by NGS approaches: an update. Cancers. (2018) 10:110. doi: 10.3390/cancers10040110
28. Gutierrez A, Sanda T, Ma W, Zhang J, Grebliunaite R, Dahlberg S, et al. Inactivation of LEF1 in T-cell acute lymphoblastic leukemia. Blood. (2010) 115:2845–51. doi: 10.1182/blood-2009-07-234377
29. Wang M, Zhang C. Low LEF1 expression is a biomarker of early T-cell precursor, an aggressive subtype of T-cell lymphoblastic leukemia. PLoS ONE. (2020) 15:e0232520. doi: 10.1371/journal.pone.0232520
30. Xiang J, Wang G, Xia T, Chen Z. The depletion of PHF6 decreases the drug sensitivity of T-cell acute lymphoblastic leukemia to prednisolone, Biomed Pharmacother. (2019) 109:2210–17. doi: 10.1016/j.biopha.2018.11.083
31. Teachey DT, Pui CH. Comparative features and outcomes between pediatric T-cell and B-cell acute lymphoblastic leukaemia Lancet. (2019) 20:142–54. doi: 10.1016/S1470-2045(19)30031-2
32. Wendorff AA, Quinn SA, Rashkovan M, Madubata CJ, Ambesi-Impiombato A, Litzow MR, et al. Phf6 loss enhances HSC self-renewal driving tumor initiation and leukemia stem cell activity in T-ALL. Cancer Discov. (2019) 9:436–51. doi: 10.1158/2159-8290.CD-18-1005
33. Miao MH, Ji XQ, Zhang H, Xu J, Zhu H, Shao XJ. miR-590 promotes cell proliferation and invasion in T-cell acute lymphoblastic leukaemia by inhibiting RB1. Oncotarget. (2016) 7:39527–34. doi: 10.18632/oncotarget.8414
34. Huang S, Hölzel M, Knijnenburg T, Schlicker A, Roepman P, McDermott U, et al. MED12 controls the response to multiple cancer drugs through regulation of TGF-β receptor signaling. Cell. (2012) 151:937–50. doi: 10.1016/j.cell.2012.10.035
35. Tsuyoshi H, Yoshida Y. Molecular biomarkers for uterine leiomyosarcoma and endometrial stromal sarcoma. Cancer Sci. (2018) 109:1743–52. doi: 10.1111/cas.13613
36. Weng AP, Ferrando AA, Lee W, Morris JP, Silverman LB, Sanchez-Irizarry C, et al. Activating mutations of NOTCH1 in human T cell acute lymphoblastic leukemia. Science. (2004) 306:269–71. doi: 10.1126/science.1102160
37. Breit S, Stanulla M, Flohr T, Schrappe M, Ludwig WD, Tolle G, et al. Activating NOTCH1 mutations predict favorable early treatment response and longtermoutcome in childhood precursor T-cell lymphoblastic leukemia. Blood. (2006) 108:1151–7. doi: 10.1182/blood-2005-12-4956
38. Mansur MB, Hassan R, Barbosa TC, Splendore A, Jotta PY, Yunes JA, et al. Impact of complex NOTCH1 mutations on survival in paediatric T-cell leukaemia. BMC Cancer. (2012) 12:9. doi: 10.1186/1471-2407-12-9
39. Yuan L, Lu L, Yang Y, Sun H, Chen X, Huang Y, et al. Genetic mutational profiling analysis of T cell acute lymphoblastic leukemia reveal mutant FBXW7 as a prognostic indicator for inferior survival Ann Hematol. (2015) 94:1817–28. doi: 10.1007/s00277-015-2474-0
40. Natarajan V, Bandapalli OR, Rajkumar T, Sagar TG, Karunakaran N. NOTCH1 and FBXW7 mutations favor better outcome in pediatric South Indian T-cell acute lymphoblastic leukemia J Pediatr Hematol Oncol. (2015) 37:e23–30. doi: 10.1097/MPH.0000000000000290
41. Asnafi V, Buzyn A, Le Noir S, Baleydier F, Simon A, Beldjord K, et al. NOTCH1/FBXW7 mutation identifies a large subgroup with favorable outcome in adult T-cell acute lymphoblastic leukemia (T-ALL): a Group for Research on Adult Acute Lymphoblastic Leukemia (GRAALL) study. Blood. (2009) 113:3918–24. doi: 10.1182/blood-2008-10-184069
42. Zuurbier L, Petricoin EF III, Vuerhard MJ, Calvert V, Kooi C, Buijs-Gladdines JG, et al. The significance of PTEN and AKT aberrations in pediatric T-cell acute lymphoblastic leukemia. Haematologica. (2012) 97:1405–13. doi: 10.3324/haematol.2011.059030
43. Paganin M, Grillo MF, Silvestri D, Scapinello G, Buldini B, Cazzaniga G, et al. The presence of mutated and deleted PTEN is associated with an increased risk of relapse in childhood T cell acute lymphoblastic leukaemia treated with AIEOP-BFM ALL protocols. Br J Haematol. (2018) 182:705–11. doi: 10.1111/bjh.15449
44. Szarzynska-Zawadzka B, Kunz JB, Sedek Ł, Kosmalska M, Zdon K, Biecek P, et al. PTEN abnormalities predict poor outcome in children with T-cell acute lymphoblastic leukemia treated according to ALL IC-BFM protocols. Am J Hematol. (2019) 94:E93–6. doi: 10.1002/ajh.25396
45. Tesio M, Trinquand A, Ballerini P, Hypolite G, Lhermitte L, Petit A, et al. Age-related clinical and biological features of PTEN abnormalities in T-cell acute lymphoblastic leukaemia. Leukemia. (2017)31:2594–600. doi: 10.1038/leu.2017.157
46. Vicente C, Schwab C, Broux M, Geerdens E, Degryse S, Demeyer S, et al. Targeted sequencing identifies associations between IL7R-JAK mutations and epigenetic modulators in T-cell acute lymphoblastic leukemia. Haematologica. (2015)100:1301–10. doi: 10.3324/haematol.2015.130179
47. Khouri R, Silva-Santos G, Dierckx T, Menezes SM, Decanine D, Theys K, et al. A genetic IFN/STAT1/FAS axis determines CD4 T stem cell memory levels and apoptosis in healthy controls and Adult T-cell Leukemia patients. Oncoimmunology. (2018) 7:e1426423. doi: 10.1080/2162402X.2018.1426423
48. Jang W, Park J, Kwon A, Choi H, Kim J, Lee GD, et al. CDKN2B downregulation and other genetic characteristics in T-acute lymphoblastic leukemia. Exp Mol Med. (2019) 51:4. doi: 10.1038/s12276-018-0195-x
49. Genescà E, Lazarenkov A, Morgades M, Berbis G, Ruiz-Xiville N, Gomez-Marzoi P, et al. Frequency and clinical impact of CDKN2A/ARF/CDKN2B gene deletions as assessed by in-depth genetic analyses in adult T cell acute lymphoblastic leukemia. J Hematol Oncol. (2018)11:96. doi: 10.1186/s13045-018-0639-8
50. Agarwal M, Bakhshi S, Dwivedi SN, Kabra M, Shukla R, Seth R. Cyclin dependent kinase inhibitor 2A/B gene deletions are markers of poor prognosis in Indian children with acute lymphoblastic leukemia. Pediatr Blood Cancer. (2018) 65:e27001. doi: 10.1002/pbc.27001
51. Zhang L, Ding L, Holmfeldt L, Wu G, Heatley SL, Payne-Turner D, et al. The genetic basis of early T-cell precursor acute lymphoblastic leukaemia. Nature. (2012) 481:157–63. doi: 10.1038/nature10725
52. Yeh TC, Liang DC, Liu HC, Jaing TH, Chen SH, Hou JY, et al. Clinical and biological relevance of genetic alterations in pediatric T-cell acute lymphoblastic leukemia in Taiwan. Pediatr Blood Cancer. (2019) 66:e27496. doi: 10.1002/pbc.27496
53. Gotlib J, Cools J. Five years since the discovery of FIP1L1-PDGFRA: what we have learned about the fusion and other molecularly defined eosinophilias. Leukemia. (2008)22:1999–2010. doi: 10.1038/leu.2008.287
54. Reiter A, Gotlib J. Myeloid neoplasms with eosinophilia. Blood. (2016) 129:704–14. doi: 10.1182/blood-2016-10-695973
55. Olsson-Arvidsson L, Norberg A, Sjögren H, Johansson B. Frequent false-negative FIP1L1-PDGFRA FISH analyses of bone marrow samples from clonal eosinophilia at diagnosis. Br J Haematol. (2019) 188:e76–9. doi: 10.1111/bjh.16340
56. Wang C, Oshima M, Sato D, Matsui H, Kubota S, Kazumasa A, et al. Ezh2 loss propagates hypermethylation at T cell differentiation-regulating genes to promote leukemic transformation. J Clin Invest. (2018) 128:3872–86. doi: 10.1172/JCI94645
Keywords: childhood, T-cell acute lymphoblastic leukemia, SNP array, CNAs, molecular characterization
Citation: Lejman M, Włodarczyk M, Styka B, Pastorczak A, Zawitkowska J, Taha J, Sędek Ł, Skonieczka K, Braun M, Haus O, Szczepański T, Młynarski W and Kowalczyk JR (2020) Advantages and Limitations of SNP Array in the Molecular Characterization of Pediatric T-Cell Acute Lymphoblastic Leukemia. Front. Oncol. 10:1184. doi: 10.3389/fonc.2020.01184
Received: 17 March 2020; Accepted: 11 June 2020;
Published: 17 July 2020.
Edited by:
Peter Bader, University Hospital Frankfurt, GermanyReviewed by:
Yong-mi Kim, Children's Hospital of Los Angeles, United StatesKathrin Maria Bernt, Children's Hospital of Philadelphia, United States
Copyright © 2020 Lejman, Włodarczyk, Styka, Pastorczak, Zawitkowska, Taha, Sędek, Skonieczka, Braun, Haus, Szczepański, Młynarski and Kowalczyk. This is an open-access article distributed under the terms of the Creative Commons Attribution License (CC BY). The use, distribution or reproduction in other forums is permitted, provided the original author(s) and the copyright owner(s) are credited and that the original publication in this journal is cited, in accordance with accepted academic practice. No use, distribution or reproduction is permitted which does not comply with these terms.
*Correspondence: Monika Lejman, lejmanm@poczta.onet.pl