
94% of researchers rate our articles as excellent or good
Learn more about the work of our research integrity team to safeguard the quality of each article we publish.
Find out more
ORIGINAL RESEARCH article
Front. Oncol. , 21 July 2020
Sec. Cancer Genetics
Volume 10 - 2020 | https://doi.org/10.3389/fonc.2020.00900
This article is part of the Research Topic Advances in Mathematical and Computational Oncology View all 27 articles
 Gui-Qi Zhu1,2†
 Lei Yu3†
 Yu-Jie Zhou4,5†
 Jun-Xian Du6†Shuang-Shuang Dong1,2Yi-Ming Wu7Ying-Hong Shi1,2Jian Zhou1,2Jia Fan1,2
 Zhi Dai1,2*
Background: N6-methyladenosine (m6A) RNA methylation, associated with cancer initiation and progression, is dynamically regulated by the m6A RNA regulators. However, its role in liver carcinogenesis is poorly understood.
Methods: Three hundred seventy-one hepatocellular carcinoma (HCC) patients from The Cancer Genome Atlas database with sequencing and copy number variations/mutations data were included. Survival analysis was performed using Cox regression model. We performed gene set enrichment analysis to explore the functions associated with different HCC groups. Finally, we used a machine-learning model on selected regulators for developing a risk signature (m6Ascore) The prognostic value of m6Ascore was finally validated in another two GEO datasets.
Results: We demonstrated that 11 m6A RNA regulators are significantly differentially expressed among 371 HCC patients stratified by clinicopathological features (P<0.001). We then identified two distinct HCC clusters by applying consensus clustering to m6A RNA regulators. Compared with the cluster2 subgroup, the cluster1 subgroup correlates with poorer prognosis (P < 0.001). Moreover, the cell cycle, splicesome and notch signaling pathway are significantly enriched in the cluster1 subgroup. We further derived m6Ascore, using four m6A regulators, predicting HCC prognosis well at three (AUC = 0.7) or 5 years (AUC=0.7) in validation. The prognostic value of m6Ascore also was validated successfully in two GEO datasets (P < 0.05). Finally, we discovered that mutations and copy number variations of m6A regulators, conferring worse survival, are strongly associated with TP53 mutations in HCC.
Conclusions: We find a significant relationship between the alterations and different expressions causing increased m6A level and worse survival, especially in TP53-mutated HCC patients. Genetic alterations of m6A genes might cooperate with TP53 and its regulator targets in the HCC pathogenesis. Our m6Ascore may be applied in the clinical trials for patient stratification in HCC.
Hepatocellular carcinoma (HCC) is the fifth leading cause of malignant cancer and the third most common reason for cancer-specific death worldwide (1, 2). The HCC mortality is often high because of metastasis and postsurgical liver recurrence. Hence, effective treatments are eagerly awaited to hold back additional metastases to improve the disappointing HCC outcomes (2). However, advanced HCC with recurrence or low response to chemotherapy have low overall survival nowadays. The lack of effective interventions and high mortality of HCC demand a better understanding of the cancer molecular mechanism.
N6-methyladenosine (m6A), first described in 1974, the most abundant form of internal messenger RNA (mRNA) modification in higher eukaryotes, has become of great interest in recent years (3). It is known to play vital part in regulating gene expression, splicing in cellular biology, and cellular protein translation (3–5). The m6A regulators comprise “writers” such as methyltransferase like 3 (METTL3), WT1-associated protein (WTAP), METTL14, RNA binding motif protein 15 (RBM15), zinc finger CCCH domain-containing protein 13 (ZC3H13) and KIAA1429 (also known as VIRMA). “Readers” such as YTH domain-containing 1 (YTHDC1), YTH N6-methyladenosine RNA binding protein 2 (YTHDF2), YTH domain-containing 1 (YTHDC2), heterogeneous nuclear ribonucleoprotein C (HNRNPC), YTH N6-methyl-adenosine RNA binding protein 1 (YTHDF1) and ‘erasers' such as fat mass- and obesity-associated protein (FTO) and α-ketoglutarate-dependent dioxygenase alkB homolog 5 (ALKBH5) (6–12). m6A dysregulation regulated by knockdown of genes could result in decreased cell proliferation, cell death and developmental defects (3).
In recent years, increasing amounts of evidence showed that genetic changes and dysregulated expression of m6A RNA methylation genes are correlated with malignant phenotype closely in different types of cancer (7, 13–17). For example, knockout of METTL3 disturbs embryonic stem cell differentiation (18). Depletion of erasers, such as FTO and ALKBH5, can result in obesity and dysregulation of spermatogenesis (3, 9). Knockdown of m6A methyltransferase can cause regulation of the TP53 signaling pathway relevant to tumorigenesis (4). Recently, the overexpression of METTL3 result in HCC tumor progression by repressing SOCS2 through the m6A-YTHDF2 axis in HCC (19). Additionally, down-regulation of METTL14 as a dismal prognostic factor for HCC overall survival (20). Therefore, it is surprising that the profile of genetic alterations affecting m6A regulatory genes and gene expression of corresponding m6A genes have not been explored in HCC.
Hence, in our study, we systematically evaluated the genetic alterations and expression of 13 widely reported m6A RNA regulators with RNA sequencing data from The Cancer Genome Atlas (TCGA) (n = 377) datasets. We analyzed the alteration spectrum and expression of every m6A modification regulator with regards to different clinicopathological factors, including survival.
The datasets GSE14520 and GSE63898 were downloaded from the expression database GEO (Gene Expression Omnibus, http://www.ncbi.nlm.nih.gov/geo/) (21, 22). GSE14520 included a total of 488 samples, 241 samples were paired non-tumor samples, while the other 247 samples were HCC samples. Platform Information was [HG-U133A_2] Affymetrix Human Genome U133A 2.0 Array for 43 samples, and [HT_HG-U133A] Affymetrix HT Human Genome U133A Array for the other 445 samples. GSE63898 included 228 HCC and 168 cirrhotic samples, and the platform was [HG-U219] Affymetrix Human Genome U219 Array for all samples. The clinicopathological, mutation, deletion, amplification, copy number variation and/or survival data from HCC patients are available via the cBioportal (23), the TCGA data portal and/or reported in a previous publication (24). Of the 424 HCC patients in the TCGA cohort, matched mutation, deletion, amplification and copy number variation (CNV) data are available for 366 patients via cBioportal (23). We therefore included only these patients in our genetic alteration analyses. In addition, of the 424 HCC patients included in our gene expression analysis, corresponding complete clinical information are available for 236 patients from the TCGA cohort.
We first collected 16 m6A RNA methylation regulators from published literature (7, 12, 16), and we retrieved the m6A genes with available gene expression from the HCC TCGA cohort. This brought a list of 13 m6A regulators. Finally, the genetic alterations and expression of m6A RNA methylation regulators in HCC with different clinicopathological factors were compared systematically.
For gene expression analysis, to investigate the function of m6A RNA methylation gene regulators in HCC, we clustered the HCC into different groups with “ConsensusClusterPlus” (resample rate of 80%, 50 iterations and Pearson correlation, http://www.bioconductor.org/). We used PCA with the R package for R v3.5.1 to explore the gene expression profiles among various HCC patient subgroups. We performed GO and KEGG pathway analyses with the Database for Annotation, Visualization, and Integrated Discovery to annotate differentially expressed genes in various HCC subgroups. We also analyzed interactions among m6A RNA methylation regulators from the STRING database (http://www.string-db.org/). We finally applied gene set enrichment analysis (GSEA) to evaluate the functions associated with different HCC subgroups. To determine the prognostic value of m6A RNA methylation genes, we therefore performed several univariate Cox regression analyses of their gene expression in the TCGA cohort. To this end, we confirmed nine genes that were significantly associated with patient survival (P < 0.05), which we then selected for further functional analysis and development of a risk signature (m6Ascore) with the machine learning algorithm model (25). Finally, four m6A regulatory genes and their coefficients were determined by R package “Coxboost” within the training set (All patients were randomly divided 75% for training and 25% for validation) by the machine learning model (25). The m6Ascore for the signature was calculated using the formula:
where Coefi is the coefficient, and xi is the relative z-score-transformed gene expression of selected genes. We used the above formula to calculate a risk score for each HCC patient in the training (75% of TCGA patients) and internal validation (25% of TCGA patients) datasets.
Additionally, the loss and gain levels of CNVs have been confirmed using segmentation analysis and Genomic Identification of Significant Targets in Cancer algorithm (GISTIC) for CNV. To explore the clinical significance of the CNV or mutation, this TCGA cohort was divided into two HCC groups: “with mutation and/or CNV of 10 m6A regulatory” and “without CNV and mutation.” We calculated the gene expression from RNA-Seq V2 RSEM release, and used log scale before analyzing the associations between gene expression and CNVs.
Categorical variables applying the chi-square test or Fisher's exact test were compared. A Fisher-Freeman-Halton test was performed for contingency tables that are larger than 2 × 2. We used the Mann-Whitney U-test for comparing continuous variables that were not distributed normally. The Kaplan-Meier analysis and the log-rank test were used to estimate the distribution of overall (OS) and disease-free survival (DFS) and to compare differences between survival curves, respectively. We then performed multivariate analyses by applying the Cox proportional hazards regression models. Variables with P < 0.05 (log-rank test) in univariate analysis for OS were included in the further models. All statistical analyses were conducted by using the SPSS statistical package, version 24.0 (IBM, Corp.). In addition, because some comparisons were made using limited data, the statistical comparisons were correlated for multiple testing by R software. For all tests, statistical differences were considered as significant at P < 0.05 (two-sided).
Mutations of m6A regulatory genes were found in 8.5% (31/366) of HCC (Figure 1A). We identified gene variation in copy number in 23.0% (84/366) of patients (Table S1, detailed information in Table S2). A comparable frequency of copy number loss which is measured as shallow deletion by using GISTIC (n = 33) and copy number gain (n = 46) of m6A genes (Figure 1B). Copy number loss of VIRMA is the most frequent among the HCC cohort (59/366, 16%; Figure S1). Notably, 6.3% (23/366) of HCC patients obtained copy number loss and gain of more than one m6A genes simultaneously (Table S3). In seven of those 23 cases, an amplification of an m6A writer or m6A reader was investigated with a shallow or deep deletion of m6A eraser genes concomitantly (Table S3), which indicated a potential synergistic change of m6A enzymes that may result in increased levels of m6A RNA modification. Shallow deletions of ALKBH5 and FTO conferred reduced mRNA expression of these m6A genes significantly (Figures 1C,D). While copy number gain of METTL3, VIRMA, YTHDF1 and YTHDF2 conferred a significant increase in its RNA expression (Figure S2). Hence, copy number gain and shallow deletion might lead to the decreased and increased mRNA expression of m6A genes.
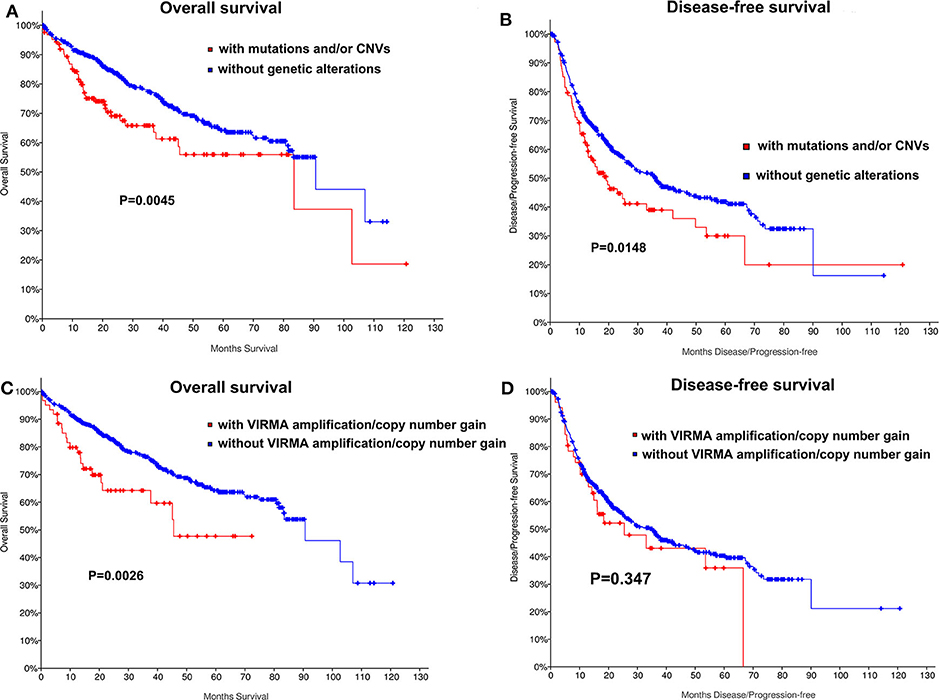
Figure 1. Genetic alterations of m6A regulatory genes in HCC. (A) Percentage of HCC samples with mutations or CNVs of the m6A regulators based on the data from TCGA. (B) Events of copy number gain or loss of m6A regulatory genes in HCC samples. (C) Relationships between Putative copy-number alterations and mRNA for FTO. (D) Relationships between Putative copy-number alterations and mRNA for ALKBH5.
It was determined whether mutations or copy number variations (CNVs) of m6A regulators are correlated with HCC clinical and molecular characteristics. Mutations or CNVs of METTL14, METTL3, VIRMA, RBM15, ZC3H13, WTAP, YTHDC1, YTHDC2, YTHDF1, YTHDF2, HNRNPC, FTO, and ALKBH5 as a subgroup were significantly correlated with lower albumin (P = 0.038, Table S1), and poorer tumor stage in HCC (P < 0.0043, Table S1). In addition, we observed a significant increase in the status of TP53 mutations (P < 0.012, Table S1), TERT mutations (P = 0.018, Table S1), and ARID1A mutations (P = 0.047, Table S1) in HCC patients obtaining genetic changes of m6A genes. These above molecular characteristics also were correlate with mutations of m6A regulators alone, except for TERT mutations (Table S1). However, TERT (P = 0.011) and ARID1A mutations (0.0037), except for TP53 mutations (26) were also correlate with CNVs of m6A regulators alone (Table S1), which might be because of the small sample sizes for mutations and CNVs associated with most mutated HCC genes.
We also determined whether shallow or deep deletion of VIRMA is correlate with the clinical and molecular characteristics. Consistent with our results for all m6A regulators, amplification/copy number gain of VIRMA was significantly correlated with poorer clinical stage and the presence of TP53 and TERT mutation in this HCC cohort (P =0.04, P = 0.027, respectively; Table S4). TP53 and TERT mutations were also present in HCC patients with amplification/copy number gain of VIRMA (Table S4). Kaplan-Meier analyses evaluating the impact of genetic changes for m6A regulators on OS and DFS in HCC patients were performed. As a group, HCC patients with the mutation of any of m6A regulators had a worse OS (P = 0.004) and DFS (P = 0.0148, Figures 2A,B). In addition, unfavorable OS were prominent in HCC patients who had amplification/copy number gain of VIRMA (Figures 2C,D).
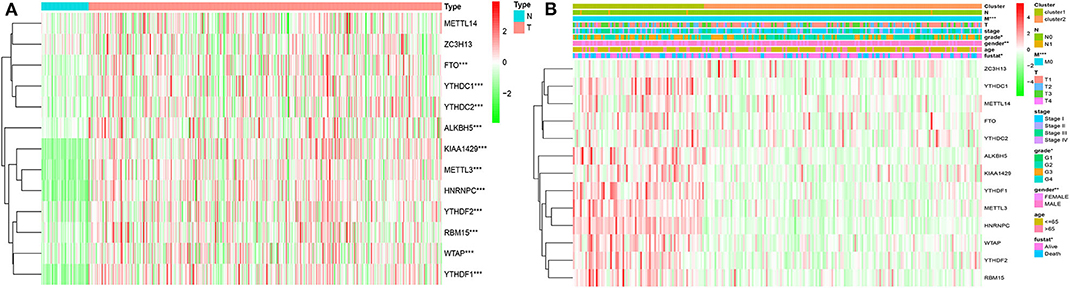
Figure 2. Kaplan-Meier curves for overall and disease-free survival of TCGA HCC patients by the presence and absence of (A,B) mutation and/or CNVs of m6A regulatory genes, (C,D) amplification/copy number gain of VIRMA.
Of all clinical and molecular characteristics regarded as the de novo HCC cohort, higher grade T classification (T>0), higher grade of stage and ARID1A, TP53 mutations and genetic alterations of any m6A genes were associated with poorer OS in univariate Cox analysis significantly (Table S5). Therefore, we investigated the impact of m6A gene mutations or CNVs on the HCC outcome with poor clinical characteristics. Changes of m6A genes as a subgroup were correlated with poorer OS in HCC patients regardless of stage, TP53, and ARID1A mutations (Table S6). These genetic alterations did not confer a worse OS in patients with higher grade T classification (T>0), tumor grade or ARID2, TERT mutations (Table S6). We then identified the HCC patients' survival according to whether they showed combined TP53 mutations and genetic changes of m6A genes. Almost half of the patients with mutated TP53 (40%, Table S1) had ≥1 genetic change of m6A gene. We further explored the gene expression of m6A regulatory genes between wild-type and mutated TP53. Interestingly, we found the m6A eraser genes showed significantly lower expression in mutated TP53 group than the wild-type group, but the m6A writer and reader genes showed significant higher expression in TP53 mutated group. It indicates that higher m6A levels among HCC patients were parallel with the mutation rates of TP53 during the carcinogenesis or initiation in HCC. The group of TP53 mutated patients had poorer OS than those patients not obtaining any of these genetic changes (Table S7).
Since mutations, amplifications, deletions, and/or CNVs of m6A genes were relatively restricted to patients with wild-type TERT and ARID1A (88.5%, Table S1), we then identified whether these genetic changes affect OS stratified by the status of TERT or ARID1A mutation. Poorer OS were seen in HCC patients with wild-type TERT who had more than one genetic change of m6A genes (P = 0.001, Table S7). Notably, these patients also have worse OS (P < 0.05) compared to those patients who had mutated TERT but had no genetic changes of m6A genes (Table S7). Genetic changes of m6A genes as a subgroup were also significantly associated with a worse OS in wild-type ARID1A patients (P = 0.009, Table S7). A combination of molecular analysis of m6A genes might be valuable to identify a worse outcome in HCC patients who had neither been classified as “poor risk” because of the presence of mutated TERT (27), nor better survival outcome conferred by ARID1A mutations (28, 29), particularly in the TP53 wild-type HCC patients. From a multivariate Cox analysis including variables correlated with worse survival, genetic changes of m6A genes, as a subgroup was not an independent factor for OS (Table S8). Genetic changes of m6A genes, however, predicted poorer OS independently (HR = 1.8; 95% CI, 1.2–4.4; P = 0.010) when the variable TP53 mutation was excluded from the original model (Table S8).
Considering the important biological functions of each m6A RNA genes in the HCC tumorigenesis, we explored the mRNA expression of each m6A regulators between tumor and normal tissues systematically. The expression level of each m6A RNA methylation regulator between tumor and normal are presented as heatmaps (Figures 3A,B), showing that the expressions of most m6A RNA methylation regulators are significantly higher in tumor than normal group (Figure 3 and Figure S3), except for METTL14 and ZC3H13 (but the expression still trends higher among tumor group than normal). We then validated these regulatory genes in our 69-paired HCC tumor and normal tissues by RT-PCR, which showed the same results as in the TCGA dataset (data were not shown).
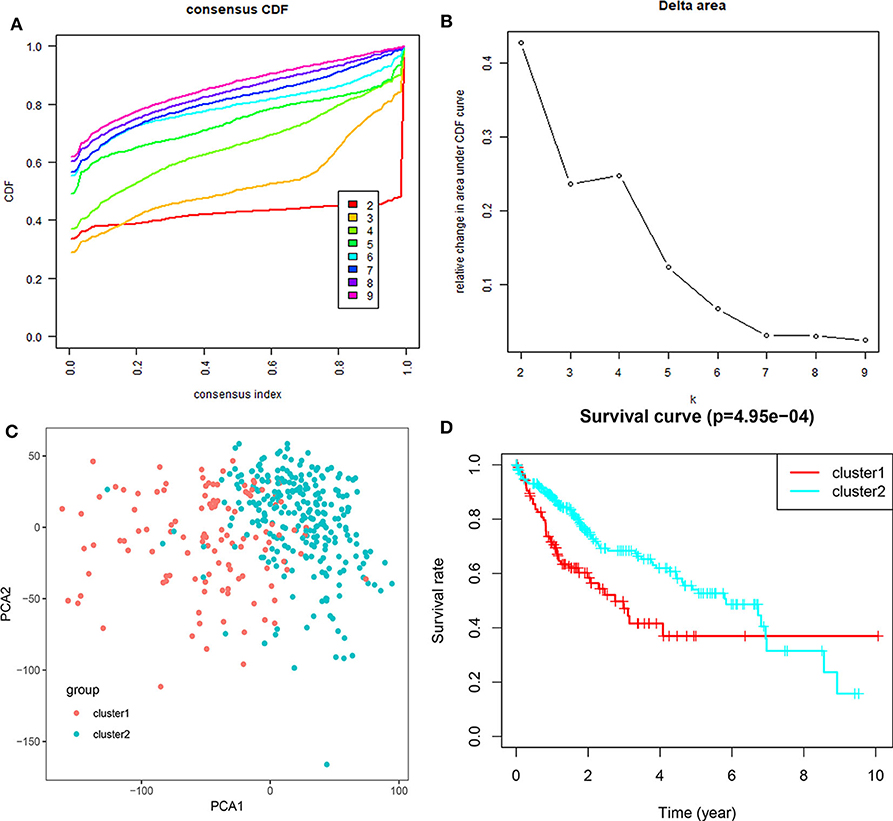
Figure 3. Expression of m6A RNA methylation regulators with different clinicopathological features in HCC. (A) stratified by tumor and normal samples; (B) stratified by cluster1/2 groups. *P < 0.01; **P < 0.001; ***P < 0.0001.
Based on the expression similarity of m6A RNA regulators, k =3 seemed to be a suitable selection with clustering stability increasing from k = 2 to 10 in the TCGA datasets (Figure 4; Figure S4). However, we found that 116 out of 371 HCC patients clustered into one of these two groups in the TCGA dataset (Figure 3B). Hence, we compared the clinical characteristics of these two groups clustered by k = 2, including cluster1 and cluster2 (Figure 4D). The cluster2 subgroup is significantly correlated with no metastasis (P < 0.0001), lower grade (P < 0.01), and lower stage (P < 0.0001; Figure 3B). The cluster1 subgroup mainly contains HCC with higher grade and clinical stage at diagnosis. In addition, we observed a shorter OS in the cluster1 subgroup than the cluster2 group (median survival: 76.1 months vs. 90.1 months) (Figure 4D).
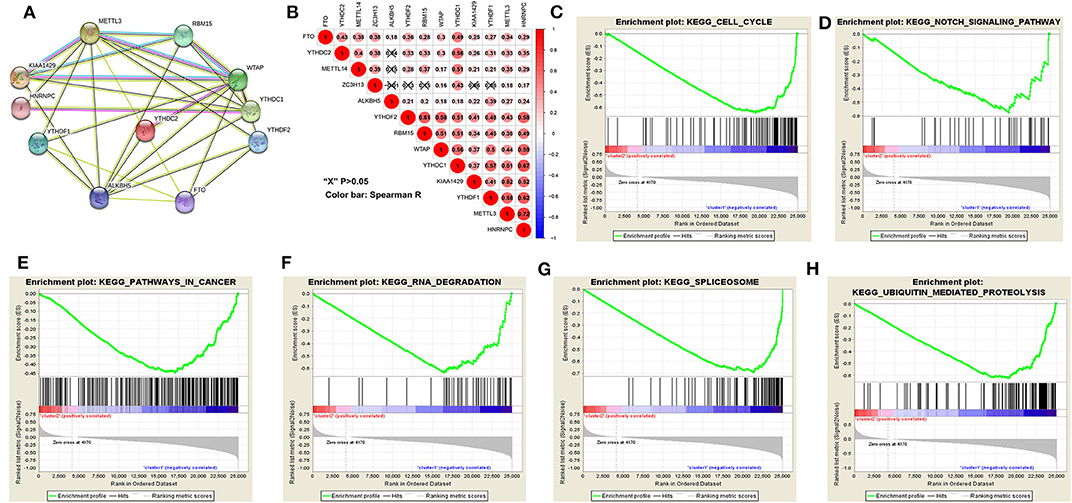
Figure 4. Differential clinicopathological features and overall survival of HCC in the cluster1/2 subgroups. (A) Consensus clustering cumulative distribution function (CDF) for k = 2–10. (B) Relative change in area under CDF curve for k = 2–10. (C) Principal component analysis of the total RNA expression profile in the TGGA dataset. (D) Kaplan–Meier overall survival (OS) curves for HCC patients according to cluster1/2.
The above results indicated that the clustering results were closely associated with the malignancy of the HCC. To better comprehend the interactions among these m6A RNA methylation regulators, which is significantly differentially expressed in tumor and normal tissues, we also analyzed the interaction (Figure 5A) and correlation (Figure 5B) among these gene regulators. WTAP, METTL3 and ALKBH5 seems to be the hub gene of the “writers” and “erasers,” and WTAP's interactions or co-expressions with RMB15, YTHDC1, YTHDF1, YTHDF2, YTHDC2, METTL3, KIAA1429, are validated by experimental data and by text mining in the String database (Figure 5A). In addition, METTL3's interactions or co-expressions with ALKBH5, WTAP, YTHDF1, RBM15, KIAA1429, YTHDC1, HNRNPC and FTO. The expression of WTAP was significantly associated with the “readers” of YTHDC1, YTHDF2, HNRNPC and YTHDF2 in HCC (Figure 5B). The expression of METTL3 was also significantly associated with “readers” of HNRNPC and YTHDC1 (P < 0.05). All these 11 differentially expressed m6A regulatory genes correlated each other, suggesting complicated mechanism underlying each interaction groups in HCC (Figure 3A), but the expressions of YTHDF2 were not significantly correlated with YTHDC2 and METTL14 in HCC (Figure 5B). Moreover, the expressions of all m6A regulatory genes were positively correlated with each other in HCC (Figure 5B). These findings were consistent with the expression levels of WTAP, METTL3, RBM15, KIAA1429, YTHDF2, YTHDF1, FTO, and ALKBH5 being positively correlated with the increasing HCC malignancy.
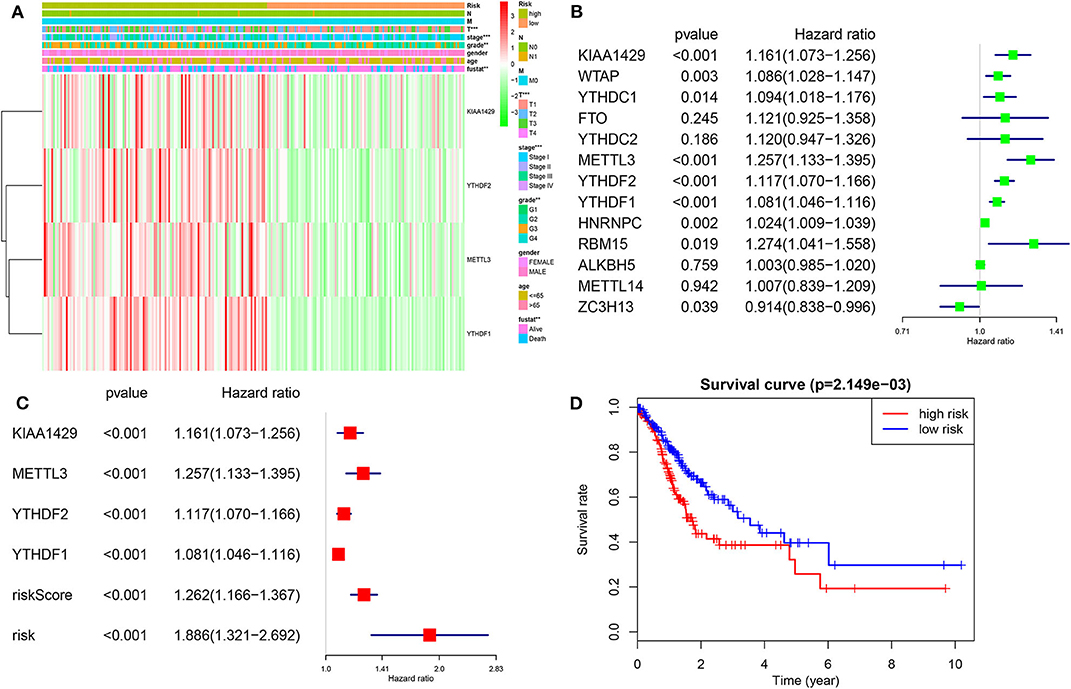
Figure 5. Interaction among m6A RNA methylation regulators and pathway analysis of HCC in cluster1/2 subgroups. (A) The m6A modification-related interactions among the 11-m6A RNA methylation regulators. (B) Spearman correlation analysis of the 13-m6A modification regulators. (C–H) GSEA revealed that genes with higher expression in cluster1 subgroup were enriched for hallmarks of malignant tumors.
We then further applied principal component analysis (PCA) to compare the transcriptional profile between cluster1 and cluster2 groups. The findings revealed a clear difference between them (Figure 4C). We determined genes that were upregulated significantly (Score (d) for SAM > 8, fold change >2, and normalized P < 0.01) or downregulated [Score(d) for SAM < −8, fold change < 0.5, and normalized P < 0.01] in the cluster1 group, and then annotated their functions by pathway analysis for biological processes (Figures 5C–H).
The gene set enrichment analysis (GSEA) showed that cell cycle, notch signaling pathway, splicesome, ubiquitin mediated proteolysis and pathways in cancer were significantly associated with the cluster1 (Figures 5C–H, Table S9), while for cluster2, GSEA results showed metabolism-related pathways, including primary bile acid biosynthesis, drug metabolism and tryptophan metabolism (Table S10). All of these results showed that the two clusters determined by consensus clustering are closely associated with the carcinogenesis of HCC.
We then investigated the prognostic value of m6A RNA regulators in HCC. We conducted a univariate Cox analysis on the gene expressions in the TCGA dataset (Figure 6). The results revealed that nine out of thirteen genes are significantly associated with OS (P < 0.05). Among these nine genes (Figure 6B), all the KIAA1429, WTAP, METLL3, YTHDC1, YTHDF2, YTHDF1, HNRNPC, RBM15, and ZC3H13 are risky genes with HR > 1. Furthermore, to better predict the HCC survivals with m6A RNA regulators, we applied the machine-learning model (Coxboost regression) to the nine prognosis-associated genes (Figure S3B) in the 75% TCGA dataset, which was used as a training cohort (Figure 6A). Four genes, including METTL3, KIAA1429, YTHDF2 and YTHDF1, were then selected to construct the risk signature according to the minimum criteria, and the coefficients derived from the Coxboost algorithm were applied to calculate the risk score for both the training dataset (75% TCGA) and the validation dataset (25% TCGA). To evaluate the prognostic value of the seven-m6A risk signature, we divided the HCC patients in the training set (n = 278) and validation set (n = 93) into low- and high-risk groups according to the median value of risk score and saw the significant differences in OS between the two clusters (both P = 0.002; Figure 6A). In addition, the prognostic value of m6Ascore are also prominent in another two GEO datasets (all P < 0.05; Figure S7). The heatmap shows the expression of the four selected m6A RNA regulators in the two groups including high- or low-risk HCC patients in the TCGA dataset (Figure 6A). The significant differences between the high and low risk groups with regards to metastasis (P < 0.001), tumor grade (P < 0.01) and clinical stage (P < 0.001) can be seen. The multivariate analysis showed the m6Ascore signature is an independent factor for OS in HCC patients (HR= 1.886, 95%CI 1.321–2.692, P < 0.001; Figure 6C). The ROC curve analysis showed that the m6Ascore can predict overall survival very well at 2,000 days (AUC = 0.70), 3-year survival (AUC = 0.69), cluster1/2 subgroups (AUC = 0.87) and TP53 mutations (AUC = 0.68; Figure S5). Furthermore, we explored whether m6Ascore could discriminate distinct survival stratified by TP53 mutations. The results showed m6Ascore can predict overall survival at 2,000 days well in TP53 mutations (AUC = 0.70) and TP53 wild-type (AUC = 0.61). These findings showed that the risk scores calculated by that signature could accurately predict HCC patient clinical outcomes and characteristics, especially for the cluster1/2 groups.
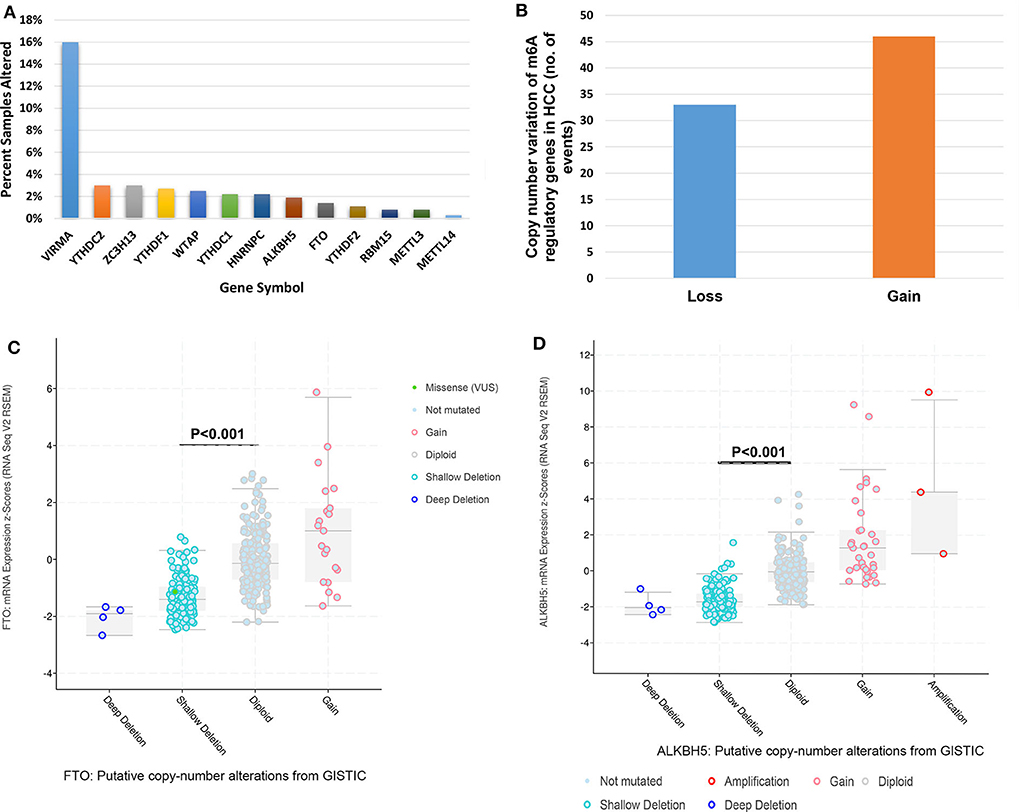
Figure 6. Risk signature with four m6A RNA methylation regulators. (A) Heatmap and clinicopathologic features of the two groups (risk low/high) defined by the m6A RNA methylation regulators consensus expression. (B) The process of building the signature containing 13 m6A RNA methylation regulators. The hazard ratios (HR), 95% confidence intervals (CI) calculated by univariate Cox regression. (C) The process of building the signature containing four m6A RNA methylation regulators calculated by machine learning model. (D) Kaplan–Meier overall survival (OS) curves for HCC patients according to m6Ascore. *P < 0.01; **P < 0.001; ***P < 0.0001.
It remains a major challenge that identifying new molecular biomarkers tutors the evolvement of anti-HCC treatments. Our findings favored an evident association between genetic changes of m6A genes and TP53 mutation. One is confounding the other in predicting the prognosis of an HCC patient, which indicates that both might be complementary in the HCC pathogenesis or maintenance. The molecular biomarkers to identify tumor subtypes and patients prognosis still demand continuous refinement (30, 31). Regarding that, the m6A modification to mRNA owned wide biological functions; its impairment might be correlated with the progression of HCC. The current WHO classification emphasized epigenetic modifiers during the process of HCC clonal evolution as being mutated (30, 32, 33). Novel genetic subgroups embrace gene mutations that encode TP53 and epigenetic modifiers (27, 30, 32, 33).
Our research is the first to identify some clinical associations and effect of genetic changes influencing m6A genes in HCC. Although one previous study has showed that some m6A regulators, such as METTL3 and YTHDF1 were upregulated in HCC, and they were independent poor prognostic factors (34), we not only demonstrated that the expression of combined m6A regulators genes is also closely correlated with the prognosis of HCC, but also showed that a remarkable correlation between genetic changes of those m6A regulators as a whole group and the status of TP53 mutations (Table S1). More importantly, genetic changes of m6A regulators correlated with poorer clinical prognosis in HCC patients, even though this might be confounded by the unfavorable effects of the status of TP53 mutations on HCC survival (35). It has been revealed that the loss of METTL3 lead to alternative mRNA splicing and mRNA expression changes of more than 20 genes which are involved in the TP53 signaling pathway including MDM2, and P21 in HCC (4, 35). It is reasonable that genetic changes of m6A genes, TP53, or its regulator/downstream-molecular targets result in complementary pathways to the HCC pathogenesis. Hence, further studies in larger HCC cohorts could help confirm our results and spur future research into the functional effects of m6A RNA modification in HCC and its association with carcinogenesis pathways, especially for TP53 signaling.
Because our study has showed genetic changes of m6A genes, giving a deeper insight into their mechanism and link to HCC tumorigenesis pathways, the expressions of regulatory genes associated with clinical characteristics and its prognostic value have not been explored. Hence, we firstly determined two HCC subgroups, cluster1/2, by consensus clustering according to the mRNA expression of m6A regulators. The subgroups of cluster1/2 not only affect the HCC prognosis but also were closely associated with functional processes and cancer signaling pathways. Additionally, we established a novel prognostic risk signature with four m6A RNA regulators, stratifying the OS with HCC into high- and low-risk groups.
Because of the tumor tissue specificity of the “writers,” “erasers,” and “readers,” these genes involved in m6A dysregulation would be diverse in different cancers (32, 36). Among the m6A RNA methylation regulators, the writer METTL3 is often highly expressed in tumors and contributes to HCC tumorigenesis (19), which is consistent with our results; while METTL14, down regulated in HCC, acts as an unfavorable prognostic factor for HCC (8, 19). The reader YTHDF2 and the eraser FTO promotes cancer cell proliferation in pancreatic cancer and glioma (17, 37, 38). These results indicated that upregulation or downregulation of any m6A methylation regulators are associated with deregulated RNAs in cancers, and the same m6A regulators might have different biological functions in various cancers (9, 20, 37, 39).
In our HCC cohort, the frequency of genetic changes of the 13-m6A genes was much higher than that showed in AML (7), suggesting that the dysregulation of m6A may play a vital role in HCC carcinogenesis. Additionally, there was a high frequency of concurrent genetic changes of two regulatory genes, suggesting that m6A writer gene and reader gene might play a synergistic role during the process of RNA m6A modification (14, 20, 37, 40). In TP53-mutated samples, the expression of writer and reader genes, such as METTL3, RBM15, YTHDF1, and YTHDF2, were higher than wild-type samples, while the eraser genes, FTO and ALKBH5 were lower than the wild-type group (Figure S6). It indicates that the levels of m6A may correlated with the rate of TP53 mutations in HCC.
Unlike the CNVs in AML, most of the CNVs in writer and reader genes lead to the gain of function with up-regulation of the corresponding genes, while CNVs of the eraser genes were mainly gaining function resulting in down-regulation of the relevant genes. Regarding the opposite effect on m6A status for those two gene groups, these genetic changes increased the m6A level in HCC. Consistent with our findings, many researches on other cancers, like colorectal and pancreatic cancer (6, 20, 31, 36, 38, 40, 41) have also observed the up-regulated m6A level. This could be explained by the associations between m6A and cellular differentiation pathways controlling cancer stem cell fate (29, 31, 42).
We also comprehensively analyzed the expression of all m6A RNA regulators in HCC with different clinical characteristics. As an m6A methylation writer, the expression of METLL3 was increased in tumor group, higher tumor grade and stage. WTAP expression was significantly increased in higher-grade and metastasis. For the m6A methylation readers, the expression of HNRNPC, YTHDF1, and YTHDF2 was also significantly increased in higher tumor grade and stage. Interestingly, the expression of FTO was decreased in no metastasis, lower tumor grade and stage. Taken together, the expression of m6A RNA regulators is closely correlated with malignant clinical characteristics in HCC. These results are also helpful for establishing new therapeutic methods through characterizing the expression of individual m6A regulators in HCC, as chemicals targeting m6A methylation are regarded as a novel method of cancer treatment (43).
Whether the expression level of m6A RNA methylation genes could be applied as a prognostic biomarker plays a vital role in the research of cancers. In this study, our HCC prognostic signature derived using four m6A RNA methylation regulators was found to stratify the OS for TP53 mutations and cluster1/2 subgroups. A similar scenario was also seen in the multivariate Cox regression analysis. This might be caused by the strong association between the m6Ascore and TP53 status.
Overall, our results systematically revealed the genetic changes, mRNA expression, potential biological function, and clinical prognostic value of m6A RNA methylation regulators in HCC. We observed a remarkable relationship between the genetic changes and different expressions lead to increased m6A level and poorer clinical prognosis. It is reasonable that genetic changes of m6A modifiers, TP53, or its regulator/downstream spots contribute in complementary pathways to the pathogenesis of HCC. Additionally, the expressions of m6A RNA methylation regulators are associated with the increased expression levels of genes significantly enriched in the biological processes and cancer signaling pathways that facilitate the HCC malignant progression. Finally, our research confers vital evidence for future investigation of the role of mRNA m6A methylation in HCC.
The datasets presented in this study can be found in online repositories. The names of the repository/repositories and accession number(s) can be found in the article/Supplementary Material.
The studies involving human participants were reviewed and approved by TCGA database. The patients/participants provided their written informed consent to participate in this study.
G-QZ, LY, Y-JZ, J-XD, Y-MW, and ZD designed the study. G-QZ, Y-MW, J-XD collected and downloaded data. LY, Y-JZ did the statistical analyses. Y-HS and S-SD prepared figures. G-QZ, LY, JF, JZ, S-SD, and Y-HS reviewed the results, interpreted data, and wrote the manuscript. All authors have made an intellectual contribution to the manuscript and approved the submission.
This work was supported by the National Natural Science Fund of China (Grant numbers: 81672330; 81871916).
The authors declare that the research was conducted in the absence of any commercial or financial relationships that could be construed as a potential conflict of interest.
The Supplementary Material for this article can be found online at: https://www.frontiersin.org/articles/10.3389/fonc.2020.00900/full#supplementary-material
Figure S1. Genetic alteration spectrum of m6A regulatory genes for HCC.
Figure S2. Relationships between putative copy-number alterations and m6A genes' mRNA expression.
Figure S3. Gene expression of m6A regulatory enzymes and booting step by machine learning model.
Figure S4. Consensus clustering cumulative distribution function (CDF) for k = 2–10.
Figure S5. ROC curves with AUCs of prognostic predictors built by m6Ascore calculated by m6A regulatory genes.
Figure S6. Gene expression of m6A regulatory genes between TP53 mutated and wild-type sample.
Figure S7. Validation of prognostic value of m6A score in two GEO datasets.
Table S1. Clinical and molecular characteristics of TCGA HCC patients according to the mutation and/or copy number variation status of genes encoding m6A regulatory enzymes.
Table S2. Genetic alterations of 13 m6A regulatory genes in HCC.
Table S3. HCC samples with a point mutation, deep deletion, amplification, shallow deletion and/or copy number gain of one or more genes encoding m6A regulatory enzymes. *Examples of potentially synergistic changes that may increase RNA m6A levels.
Table S4. Clinical and molecular characteristics of HCC patients with an amplification or copy number gain of the gene encoding an m6A writer, VIRMA.
Table S5. Univariate analysis for clinicopathological and molecular features.
Table S6. Subgroup analysis for alterations of m6A regulatory genes as a group associated with overall survival.
Table S7. Univariate analysis for overall survival of patients stratified by the status of m6A regulatory gene alterations in addition to (A) TP53, (B) TERT, and (C) ARID1A mutation status.
Table S8. Multivariate analysis for overall survival in HCC patients.
Table S9. Pathway analysis for cluster1 in HCC.
Table S10. Pathway analysis for cluster2 in HCC.
HCC, hepatocellular carcinoma; OS, overall survival; CI, confidence interval; HR, hazard risk; m6A, N6-methyladenosine RNA methylation; CNV, copy number variations; METTL3, methyltransferase like 3; WTAP, WT1-associated protein; RBM15, RNA binding motif protein 15; ZC3H13, zinc finger CCCH domain-containing protein 13; YTHDC1, YTH domain-containing 1; YTHDF1, YTH N6-methyl-adenosine RNA binding protein 1; HNRNPC, and heterogeneous nuclear ribonucleoprotein C; FTO, fat mass- and obesity-associated protein; ALKBH5, α-ketoglutarate-dependent dioxygenase alkB; TCGA, The Cancer Genome Atlas; GISTIC, Genomic Identification of Significant Targets in Cancer algorithm; DFS, disease-free survival; PCA, principal component analysis; GSEA, gene set enrichment analysis.
1. Jemal A, Bray F, Center MM, Ferlay J, Ward E, Forman D. Global cancer statistics. CA Cancer J Clin. (2011) 61:69–90. doi: 10.3322/caac.20107
2. Villanueva A. Hepatocellular carcinoma. N Eng J Med. (2019) 380:1450–62. doi: 10.1056/NEJMra1713263
3. Liu N, Pan T. N6-methyladenosine-encoded epitranscriptomics. Nat Struc Mol Biol. (2016) 23:98–102. doi: 10.1038/nsmb.3162
4. Dominissini D, Moshitch-Moshkovitz S, Schwartz S, Salmon-Divon M, Ungar L, Osenberg S, et al. Topology of the human and mouse m6A RNA methylomes revealed by m6A-seq. Nature. (2012) 485:201–6. doi: 10.1038/nature11112
5. Lin X, Chai G, Wu Y, Li J, Chen F, Liu J, et al. RNA m(6)A methylation regulates the epithelial mesenchymal transition of cancer cells and translation of snail. Nat Commun. (2019) 10:2065. doi: 10.1038/s41467-019-09865-9
6. Ding C, Zou Q, Ding J, Ling M, Wang W, Li H, et al. Increased N6-methyladenosine causes infertility is associated with FTO expression. J Cell Physiol. (2018) 233:7055–66. doi: 10.1002/jcp.26507
7. Kwok CT, Marshall AD, Rasko JE, Wong JJ. Genetic alterations of m(6)A regulators predict poorer survival in acute myeloid leukemia. J Hematol Oncol. (2017) 10:39. doi: 10.1186/s13045-017-0410-6
8. Scholler E, Weichmann F, Treiber T, Ringle S, Treiber N, Flatley A, et al. Interactions, localization, and phosphorylation of the m(6)A generating METTL3-METTL14-WTAP complex. RNA. (2018) 24:499–512. doi: 10.1261/rna.064063.117
9. Tang C, Klukovich R, Peng H, Wang Z, Yu T, Zhang Y, et al. ALKBH5-dependent m6A demethylation controls splicing and stability of long 3′-UTR mRNAs in male germ cells. Proc Natl Acad Sci USA. (2018) 115:E325–33. doi: 10.1073/pnas.1717794115
10. Wojtas MN, Pandey RR, Mendel M, Homolka D, Sachidanandam R, Pillai RS. Regulation of m(6)a transcripts by the 3′–>5′ RNA helicase YTHDC2 is essential for a successful meiotic program in the mammalian germline. Mol Cell. (2017) 68:374–87.e12. doi: 10.1016/j.molcel.2017.09.021
11. Wu R, Yao Y, Jiang Q, Cai M, Liu Q, Wang Y, et al. Epigallocatechin gallate targets FTO and inhibits adipogenesis in an mRNA m(6)A-YTHDF2-dependent manner. Int J Obesity. (2018) 42:1378–88. doi: 10.1038/s41366-018-0082-5
12. Yang Y, Hsu PJ, Chen YS, Yang YG. Dynamic transcriptomic m(6)A decoration: writers, erasers, readers and functions in RNA metabolism. Cell Res. (2018) 28:616–24. doi: 10.1038/s41422-018-0040-8
13. Cui Q, Shi H, Ye P, Li L, Qu Q, Sun G, et al. m(6)A RNA methylation regulates the self-renewal and tumorigenesis of glioblastoma stem cells. Cell Rep. (2017) 18:2622–34. doi: 10.1016/j.celrep.2017.02.059
14. Dai D, Wang H, Zhu L, Jin H, Wang X. N6-methyladenosine links RNA metabolism to cancer progression. Cell Death Dis. (2018) 9:124. doi: 10.1038/s41419-017-0129-x
15. Pan Y, Ma P, Liu Y, Li W, Shu Y. Multiple functions of m(6)A RNA methylation in cancer. J Hematol Oncol. (2018) 11:48. doi: 10.1186/s13045-018-0590-8
16. Wang S, Sun C, Li J, Zhang E, Ma Z, Xu W, et al. Roles of RNA methylation by means of N(6)-methyladenosine (m(6)A) in human cancers. Cancer Lett. (2017) 408:112–20. doi: 10.1016/j.canlet.2017.08.030
17. Zhang C, Cheng W, Ren X, Wang Z, Liu X, Li G, et al. Tumor purity as an underlying key factor in glioma. Clin Cancer Res. (2017) 23:6279–91. doi: 10.1158/1078-0432.CCR-16-2598
18. Liu J, Eckert MA, Harada BT, Liu SM, Lu Z, Yu K, et al. m(6)A mRNA methylation regulates AKT activity to promote the proliferation and tumorigenicity of endometrial cancer. Nat Cell Biol. (2018) 20:1074–83. doi: 10.1038/s41556-018-0174-4
19. Chen M, Wei L, Law CT, Tsang FH, Shen J, Cheng CL, et al. RNA N6-methyladenosine methyltransferase-like 3 promotes liver cancer progression through YTHDF2-dependent posttranscriptional silencing of SOCS2. Hepatology. (2018) 67:2254–70. doi: 10.1002/hep.29683
20. Weng H, Huang H, Wu H, Qin X, Zhao BS, Dong L, et al. METTL14 inhibits hematopoietic stem/progenitor differentiation and promotes leukemogenesis via mRNA m(6)A modification. Cell Stem Cell. (2018) 22:191–205.e9. doi: 10.1016/j.stem.2017.11.016
21. Roessler S, Jia HL, Budhu A, Forgues M, Ye QH, Lee JS, et al. A unique metastasis gene signature enables prediction of tumor relapse in early-stage hepatocellular carcinoma patients. Cancer Res. (2010) 70:10202–12. doi: 10.1158/0008-5472.CAN-10-2607
22. Villanueva A, Portela A, Sayols S, Battiston C, Hoshida Y, Mendez-Gonzalez J, et al. DNA methylation-based prognosis and epidrivers in hepatocellular carcinoma. Hepatology. (2015) 61:1945–56. doi: 10.1002/hep.27732
23. Cerami E, Gao J, Dogrusoz U, Gross BE, Sumer SO, Aksoy BA, et al. The cBio cancer genomics portal: an open platform for exploring multidimensional cancer genomics data. Cancer Discovery. (2012) 2:401–4. doi: 10.1158/2159-8290.CD-12-0095
24. Zhu Y, Qiu P, Ji Y. TCGA-assembler: open-source software for retrieving and processing TCGA data. Nat Methods. (2014) 11:599–600. doi: 10.1038/nmeth.2956
25. Singal AG, Mukherjee A, Elmunzer BJ, Higgins PD, Lok AS, Zhu J, et al. Machine learning algorithms outperform conventional regression models in predicting development of hepatocellular carcinoma. Am J Gastroenterol. (2013) 108:1723–30. doi: 10.1038/ajg.2013.332
26. Pezzuto F, Buonaguro L, Buonaguro FM, Tornesello ML. Frequency and geographic distribution of TERT promoter mutations in primary hepatocellular carcinoma. Infect Agents Cancer. (2017) 12:27. doi: 10.1186/s13027-017-0138-5
27. Lee HW, Park TI, Jang SY, Park SY, Park WJ, Jung SJ, et al. Clinicopathological characteristics of TERT promoter mutation and telomere length in hepatocellular carcinoma. Medicine. (2017) 96:e5766. doi: 10.1097/MD.0000000000005766
28. Bai Y, Yang C, Wu R, Huang L, Song S, Li W, et al. YTHDF1 regulates tumorigenicity and cancer stem cell-like activity in human colorectal carcinoma. Front. Oncol. (2019) 9:332. doi: 10.3389/fonc.2019.00332
29. Otto JE, Kadoch C. A two-faced mSWI/SNF subunit: dual roles for ARID1A in tumor suppression and oncogenicity in the liver. Cancer cell. (2017) 32:542–3. doi: 10.1016/j.ccell.2017.10.014
30. Tan PS, Nakagawa S, Goossens N, Venkatesh A, Huang T, Ward SC, et al. Clinicopathological indices to predict hepatocellular carcinoma molecular classification. Liver Int. (2016) 36:108–18. doi: 10.1111/liv.12889
31. Barbieri I, Tzelepis K, Pandolfini L, Shi J, Millan-Zambrano G, Robson SC, et al. Promoter-bound METTL3 maintains myeloid leukaemia by m(6)A-dependent translation control. Nature. (2017) 552:126–31. doi: 10.1038/nature24678
32. Bou-Nader M, Caruso S, Donne R, Celton-Morizur S, Calderaro J, Gentric G, et al. Polyploidy spectrum: a new marker in HCC classification. Gut. (2019) 69:355–64. doi: 10.1136/gutjnl-2018-318021
33. Calderaro J, Couchy G, Imbeaud S, Amaddeo G, Letouze E, Blanc JF, et al. Histological subtypes of hepatocellular carcinoma are related to gene mutations and molecular tumour classification. J Hepatol. (2017) 67:727–38. doi: 10.1016/j.jhep.2017.05.014
34. Zhou Y, Yin Z, Hou B, Yu M, Chen R, Jin H, et al. Expression profiles and prognostic significance of RNA N6-methyladenosine-related genes in patients with hepatocellular carcinoma: evidence from independent datasets. Cancer Manag Res. (2019) 11:3921–31. doi: 10.2147/CMAR.S191565
35. Lin KT, Ma WK, Scharner J, Liu YR, Krainer AR. A human-specific switch of alternatively spliced AFMID isoforms contributes to TP53 mutations and tumor recurrence in hepatocellular carcinoma. Genome Res. (2018) 28:275–84. doi: 10.1101/169029
36. Geula S, Moshitch-Moshkovitz S, Dominissini D, Mansour AA, Kol N, Salmon-Divon M, et al. Stem cells. m6A mRNA methylation facilitates resolution of naive pluripotency toward differentiation. Science. (2015) 347:1002–6. doi: 10.1126/science.1261417
37. Su R, Dong L, Li C, Nachtergaele S, Wunderlich M, Qing Y, et al. R-2HG exhibits anti-tumor activity by targeting FTO/m(6)A/MYC/CEBPA signaling. Cell. (2018) 172:90–105.e23. doi: 10.1016/j.cell.2017.11.031
38. Zhang S, Zhao BS, Zhou A, Lin K, Zheng S, Lu Z, et al. m(6)A demethylase ALKBH5 maintains tumorigenicity of glioblastoma stem-like cells by sustaining FOXM1 expression and cell proliferation program. Cancer cell. (2017) 31:591–606.e6. doi: 10.1016/j.ccell.2017.02.013
39. Vu LP, Pickering BF, Cheng Y, Zaccara S, Nguyen D, Minuesa G, et al. The N(6)-methyladenosine (m(6)A)-forming enzyme METTL3 controls myeloid differentiation of normal hematopoietic and leukemia cells. Nat Med. (2017) 23:1369–76. doi: 10.1038/nm.4416
40. Song H, Feng X, Zhang H, Luo Y, Huang J, Lin M, et al. METTL3 and ALKBH5 oppositely regulate m(6)A modification of TFEB mRNA, which dictates the fate of hypoxia/reoxygenation-treated cardiomyocytes. Autophagy. (2019) 2019:1–19. doi: 10.1080/15548627.2019.1586246
41. Wu Y, Yang X, Chen Z, Tian L, Jiang G, Chen F, et al. m(6)A-induced lncRNA RP11 triggers the dissemination of colorectal cancer cells via upregulation of Zeb1. Mol Cancer. (2019) 18:87. doi: 10.1186/s12943-019-1014-2
42. Chen J, Wang C, Fei W, Fang X, Hu X. Epitranscriptomic m6A modification in the stem cell field and its effects on cell death and survival. Am J Cancer Res. (2019) 9:752–64.
Keywords: RNA modification, m6A, hepatocellular carcinoma, TP53 mutation, prognosis
Citation: Zhu G-Q, Yu L, Zhou Y-J, Du J-X, Dong S-S, Wu Y-M, Shi Y-H, Zhou J, Fan J and Dai Z (2020) Genetic Alterations and Transcriptional Expression of m6A RNA Methylation Regulators Drive a Malignant Phenotype and Have Clinical Prognostic Impact in Hepatocellular Carcinoma. Front. Oncol. 10:900. doi: 10.3389/fonc.2020.00900
Received: 27 July 2019; Accepted: 07 May 2020;
Published: 21 July 2020.
Edited by:
Doron Levy, University of Maryland, College Park, United StatesReviewed by:
Jun Zhong, National Cancer Institute (NCI), United StatesCopyright © 2020 Zhu, Yu, Zhou, Du, Dong, Wu, Shi, Zhou, Fan and Dai. This is an open-access article distributed under the terms of the Creative Commons Attribution License (CC BY). The use, distribution or reproduction in other forums is permitted, provided the original author(s) and the copyright owner(s) are credited and that the original publication in this journal is cited, in accordance with accepted academic practice. No use, distribution or reproduction is permitted which does not comply with these terms.
*Correspondence: Zhi Dai, ZGFpLnpoaUB6cy1ob3NwaXRhbC5zaC5jbg==
†These authors have contributed equally to this work
Disclaimer: All claims expressed in this article are solely those of the authors and do not necessarily represent those of their affiliated organizations, or those of the publisher, the editors and the reviewers. Any product that may be evaluated in this article or claim that may be made by its manufacturer is not guaranteed or endorsed by the publisher.
Research integrity at Frontiers
Learn more about the work of our research integrity team to safeguard the quality of each article we publish.