- 1Central Laboratory of Stomatology, Nanjing Stomatological Hospital, Medical School of Nanjing University, Nanjing, China
- 2Department of Oral and Maxillofacial Surgery, Nanjing Stomatological Hospital, Medical School of Nanjing University, Nanjing, China
- 3Department of Oral and Maxillofacial Surgery, Affiliated Hospital of Jiangsu University, Zhenjiang, China
- 4Department of Oral Pathology, Nanjing Stomatological Hospital, Medical School of Nanjing University, Nanjing, China
Purpose: It is very important to develop potential molecular associated with oral squamous cell carcinoma (OSCC) malignant transformation and progression. Thus, the aim of our study was to determine the amino acid metabolic characteristics of OSCC patients and test their diagnostic value.
Experimental Design: Eight pairs of matched tumor and normal samples were collected for gas chromatography–mass spectrometry (GC-MS) high-throughput untargeted analysis. Another 20 cases (each case including tumor and normal tissues) were also enrolled for ultrahigh-performance liquid chromatography–tandem mass spectrometer (UHPLC-MS/MS) amino acid quantitative analysis. T-test and receiver operating characteristic (ROC) curve analysis were used to determine candidate markers. Principal component analysis, partial least squares discriminant analysis, and heat map analysis were used to verify the ability of candidate markers to distinguish tumors from normal tissues.
Results: A total of 10 amino acids biomarker were selected as OSCC candidate diagnostic biomarkers by GC-MS high-throughput untargeted metabolomics analyses [area under the curve (AUC) >0.80]. We further measured the specific concentration of these candidate amino acids biomarkers in another batch of 20 cases by UHPLC-MS/MS quantitative analysis. The result validated that nine amino acids had been detected, which had statistically significant difference (t-test, p < 0.05). Moreover, three of nine amino acid markers (glutamate, aspartic acid, and proline) displayed high sensitivity and specificity (AUC >0.90) by ROC curve analysis and obtained optimal sensitivity and specificity by binary logistic regression in the Glmnet package (AUC = 0.942).
Conclusions: In conclusion, a panel including three amino acids (glutamate, aspartic acid, and proline) was identified as potential diagnostic biomarkers of OSCC by a combination of non-targeted and targeted metabolomics methods.
Introduction
Oral squamous cell carcinoma (OSCC) is one of the most common malignant tumors in the head and neck region. Oral squamous cell carcinoma kills 6 million people worldwide every year (1); tobacco use, alcohol consumption, and human papillomavirus infection are major risk factors of oral cancer (2). Auxiliary methods for the diagnosis of oral cancer include physical examination, histopathological examination of tissue biopsies, endoscopy, computed tomography, and magnetic resonance imaging. Although diagnostic methods for OSCC have been greatly improved, survival rate remains poor due to regional and distant metastases (3).
Dysregulation in metabolic pathways was observed in almost all tumors, and the most striking feature of cancer cells is that they alter their metabolic pathways to meet cancer cell energy need. Changes in cell metabolism are benefit of tumor development. Cell metabolic phenotypes can be used to image tumors and predict patient's outcomes (4). It is very important to study the metabolic mechanism of oral cancer progression, which will help improve the diagnosis and treatment of oral cancer. Many studies have confirmed that OSCC tissues undergo significant metabolic changes compared to normal tissues, such as lactate, glycine, proline, and hydroxyproline, 3AMP, uracil, spermidine, and c-glycosyltryptophan, 2-hydroxyglutarate, and glycerol-3-monophosphate high expression in tumor tissues (21, 27). The metabolic pathways associated with oral cancer mainly include glycolysis, amino acid metabolism and pentose phosphate pathway, and RNA biosynthesis. It had been reported that cancer cells are able to gain energy from lactic acid fermentation, even when oxygen is in plentiful supply, known as the Warburg effect (5, 6). At the same time, cancer cells can get energy from other metabolic pathways, such as amino acid and lipid metabolism (7–9).
For example, glutaminolysis, deposing glutamine into glutamate, further α-ketoglutarate for maintaining tricarboxylic acid cycle, replenishes glucose metabolism and provides energy for cancer cells. It has been reported that the oncogene c-myc can regulate glutaminolysis catabolism (7).
Therefore, we concluded that metabolic changes in tumor cells were regulated by related gene.
In a word, it is urgent to develop a panel of useful biomarkers for OSCC early diagnosis (10, 11). However, metabolomics studies of OSCC are very limited up to date; many studies use serum and saliva samples (12, 13), and there is lack of research on a specific metabolic type, such as amino acid metabolism. In this study, we aim to explore tissue-based amino acids metabolite biomarkers of OSCC by untargeted and targeted metabolomics, which not only distinguish cancer cell from normal tissues, but also used as prognostic methods for early detection of OSCC.
Materials and Methods
Tumor Tissue Specimens
This study was reviewed and approved by the medical ethics committee of Nanjing Stomatological Hospital, following the Declaration of Helsinki. All cases included in the study were between 30 and 70 years old and had signed informed consent forms. Matching of collected of tumor and normal samples (eight pairs, n = 16) was performed by gas chromatography–mass spectrometry (GC-MS) high-throughput untargeted analysis. Another 20 paired cases (each case including tumor and normal tissues, Figures 1A,B) were also enrolled in this study for ultrahigh-performance liquid chromatography–tandem mass spectrometer (UHPLC-MS/MS) amino acid targeted quantitative analysis. All fresh tissues were snap-frozen in liquid nitrogen within 30 min after operation and stored at −80°C freezer until they were processed.
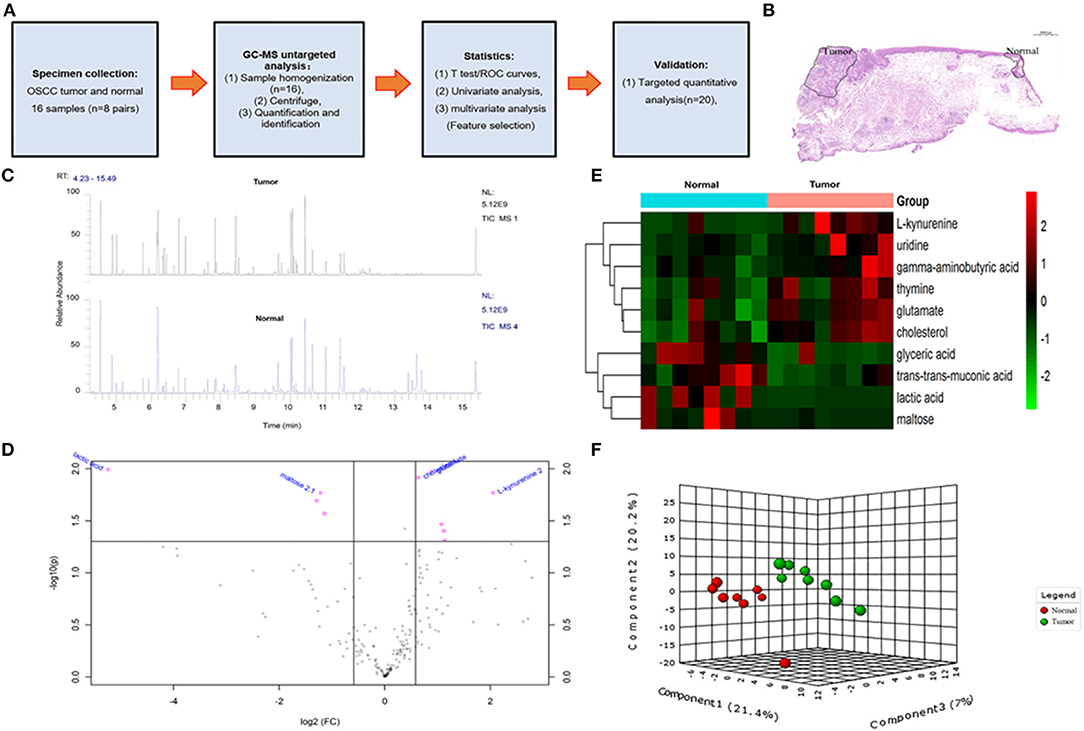
Figure 1. The overall design idea of this experiment and preliminary screening of differential metabolite in untargeted group. (A) Research flowchart: including specimen collection, GC-MS analysis untargeted analysis, data analysis, and UHPLC-MS targeted validation. (B) Schematic diagram of sample collection site, tumor, and normal tissue. (C) Mass spectrometry of the tumor and normal tissue. (D) Volcano plot analysis between tumor and normal by t-test. (E) Comparison of tumor and normal using normalized intensities of 10 significance metabolites. The mean value of 10 metabolites in each group was obtained, and then Z-score transformation generates heat map. (F) Scores plot segregated tumor and normal by PLS-DA analysis in untargeted group.
GC-MS Untargeted Analysis
The GC-MS experiment was carried out in Nanjing University of Chinese Medicine and was strongly supported by Associate Professor Xie Tong. The materials needed for the experiment were prepared by referring to the previous methods (14). The specific operation steps are shown in reference.
UHPLC-MS/MS Targeted Quantitative Analysis
Ultrahigh-performance liquid chromatography–tandem mass spectrometer targeted quantitative analysis specific operation steps refer to our previous report (15). The UHPLC separation was carried out using an Agilent 1290 Infinity II series UHPLC System (Agilent Technologies, California, USA), equipped with a Waters ACQUITY UPLC BEH Amide column (Waters Corporation, USA) (100 × 2.1 mm, 1.7 μm). Mobile phase A was 1% formic acid in water, and mobile phase B was 1% formic acid in acetonitrile. The column temperature and auto-sampler temperature were set at 35 and 4°C, respectively. An AJS–electrospray ionization interface was connected with Agilent 6460 triple quadrupole mass spectrometer (Agilent Technologies) for assay development. The MRM parameters of the target analytes are controlled by flowing injection of the standard solution of a single analyte.
Metabolomics Data Processing
For GC-MS raw data search and determination, see our previous report. Peak area ratios of metabolites in each sample were calculated with Xcalibur 2.2 (Thermo Scientific, Massachusetts, USA) by normalization to the internal standard. Specific concentrations of individual metabolites can be obtained directly by UHPLC-MS/MS analysis (nmol/g).
Statistical Analysis
Our metabonomics statistical analyses were performed using the MetaboAnalyst (https://www.metaboanalyst.ca). In the GC-MS untargeted group, the bucketed experimental data were normalized by the total spectral intensity, in addition to Pareto scale (for multivariate analysis). Differential amino acid metabolites were determined by volcano plot with fold-change threshold (>1.5) and t-test threshold (<0.05). Then, the differential metabolites were further analyzed by receiver operating characteristic (ROC) curve to determined candidate biomarkers. Univariate analysis was by Student t-test with (false discovery rate–adjusted p-value of 0.05). Multivariate analysis included unsupervised principal component analysis (PCA) and partial least squares discriminant analysis (PLS-DA). Pheatmap package was used to carry hierarchical cluster analysis.
In the UHPLC-MS/MS targeted group, the correlation coefficients of all target analytes were >0.9959, indicating that a good quantitative analysis result was obtained, which was satisfying for targeted metabolomics analysis. For specific steps and technical parameters, refer to our previous report (15). The statistical difference of quantitative analysis results was analyzed by GraphPad Prism 8 (GraphPad Software corporation, California, USA) (t-test, p < 0.05).
Results
Clinical Characteristics of the Patients in This Study
The overall flowchart of this study is shown in Figure 1A. A total of 28 cases were included in the study, eight cases (contain pair tumor and normal tissues) of which were used for GC-MS high-throughput untargeted analysis, and another 20 cases (contain pair tumor and normal tissues) were used for UHPLC-MS amino acid targeted quantitative analysis.
A total of 10 amino acids were selected as OSCC candidate diagnostic biomarkers by GC-MS untargeted metabolomics analyses.
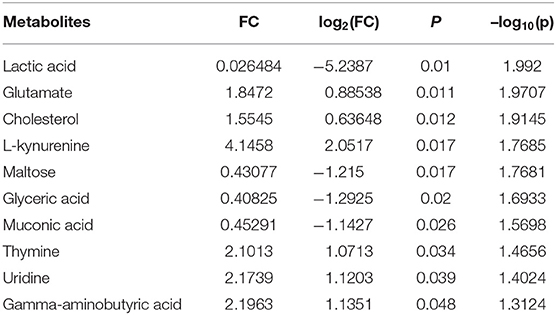
In order to determine potential metabolic markers of the OSCC, we first performed GC-MS high-throughput untargeted metabolomics analysis for eight matched pairs (n = 16) of OSCC (Figures 1B,C). The metabolites identified included amino acids, carbohydrate, lipids, and other compounds. All metabolites were first analyzed by volcano plot with fold-change threshold (>1.5) and Student t-test threshold (p < 0.05). Ten metabolites were screened out (fold change >1.5 or <0.5 and p < 0.05), including two amino acids (Figure 1D, Table 1). Additionally, heat map and PLS-DA analysis achieved great separation among tumor and normal based on the 10 metabolites (Figures 1E,F). As many literatures have reported that amino acid metabolism reprogramming is involved in tumor development, thus, our study mainly focused on OSCC amino acid metabolism (4). Receiver operating characteristic curve analysis of all metabolites revealed 10 amino acids were selected as candidate metabolic biomarkers [area under the curve (AUC) >0.80; Figure 2, Table 2]. Four of 10 amino acids had or close statistical significance [glutamate, serine, γ-aminobutyric acid (GABA), alanine], and the other six amino acids had no statistical significance (t-test), which may be related to our small samples.
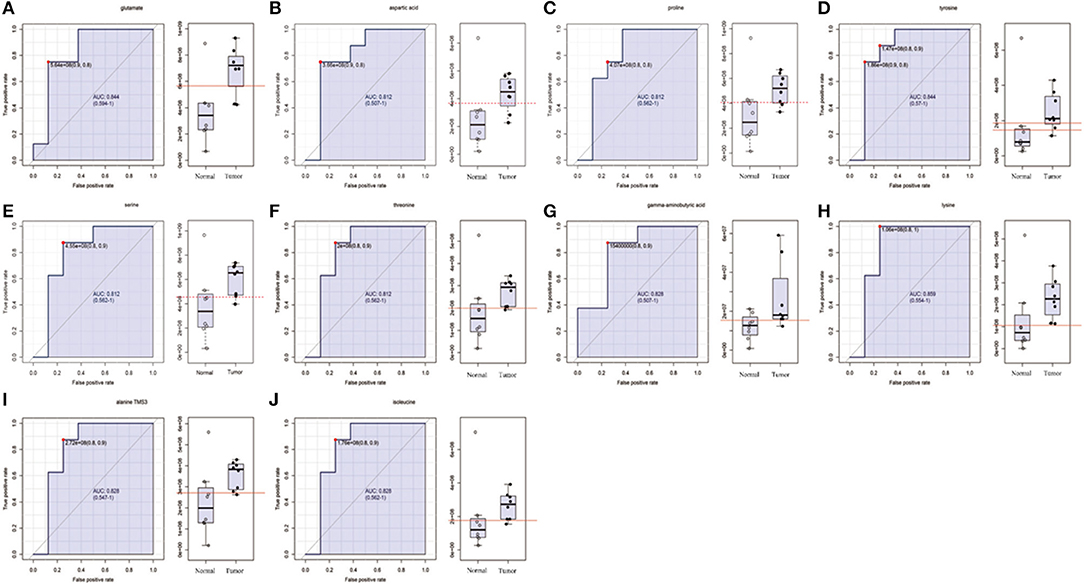
Figure 2. The list of amino acids selected as candidate tumor biomarkers by ROC curve analysis (AUC >0.80) in GC-MS untargeted group. (A–J) Individual amino acid ROC curves. AUC (0.5–0.7), low accuracy; AUC (0.7–0.9), moderate accuracy; AUC (>0.9), high accuracy.
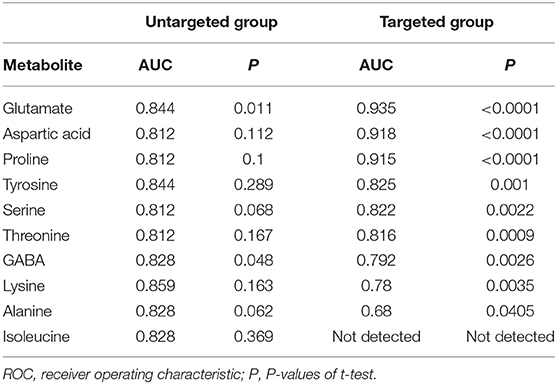
Table 2. AUC values of potential OSCC biomarkers by ROC curve analysis in development and validation group.
Identification of Three Amino Acids as OSCC Diagnostic Biomarkers by UPHLC-MS Targeted Metabolomics Analyses
In order to test whether the 10 amino acids we selected could accurately distinguish tumors from normal tissues, we used another batch of 20 cases; each case contains paired tumor and normal tissues. The specific concentration of the targeted amino acids in all samples was examined by UHPLC-MS/MS quantitative analysis. The results showed nine metabolites were detected, which had significant differences (t-test, p < 0.05; Figure 3, Table 2); one was not detected. Principal component analysis, PLS-DA, and heat map analysis achieved great separation among tumor and normal groups based on the nine metabolites (Figure 4). We tested the efficiency of more than nine amino acids by ROC curve analysis; three of nine metabolites (glutamate, aspartic acid, and proline) displayed high efficiency (AUC >0.90); six of nine amino acid markers displayed moderate efficiency (AUC = 0.70–0.90; Figures 5A–H, Table 2). Moreover, we obtained optimal sensitivity and specificity using the top three amino acids (AUC >0.90, p < 0.0001) by binary logistic regression in the Glmnet package (AUC = 0.942; Figure 5I). These results suggest that the three amino acids (glutamate, aspartic acid, and proline) could be used as OSCC potential diagnostic biomarkers.
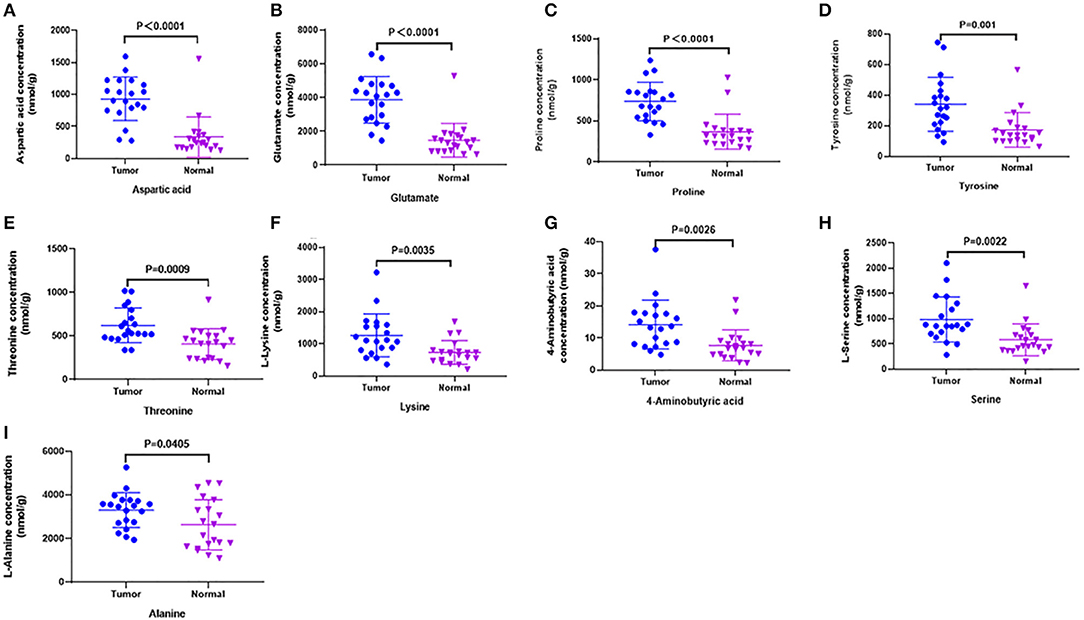
Figure 3. Candidate amino acids biomarkers (AUC > 0.80) identified by UHPLC-MS/MS quantitative analysis in another batch of 20 cases (targeted group). (A–I) The results showed 9 of 10 were consistent with untargeted group (threshold, t-test, P < 0.05), which had significant differences between tumor and normal.
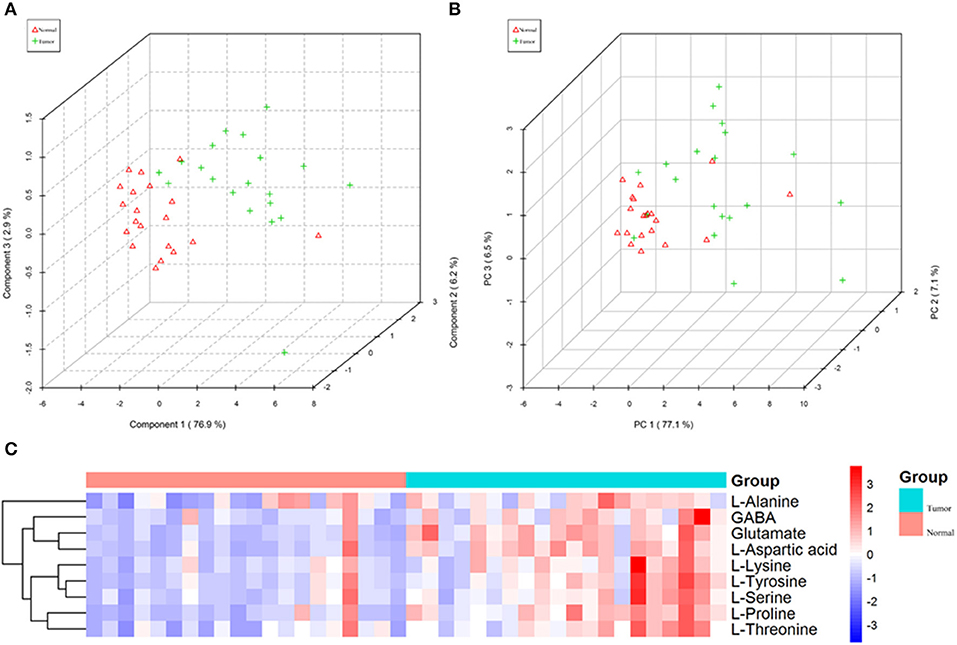
Figure 4. The nine amino acids identified by quantitative analysis can significantly distinguish tumors from normal tissues in the targeted group. (A) Scores plot accurately distinguishes tumor and normal by PLS-DA analysis in the targeted group. (B) Scores plot distinguishes tumor and normal by PCA analysis in the targeted group. (C) Comparison of tumor and normal using normalized intensities of nine significance metabolites in the targeted group. The mean value of nine metabolites in each group was obtained, and then Z-score transformation generates heat map.
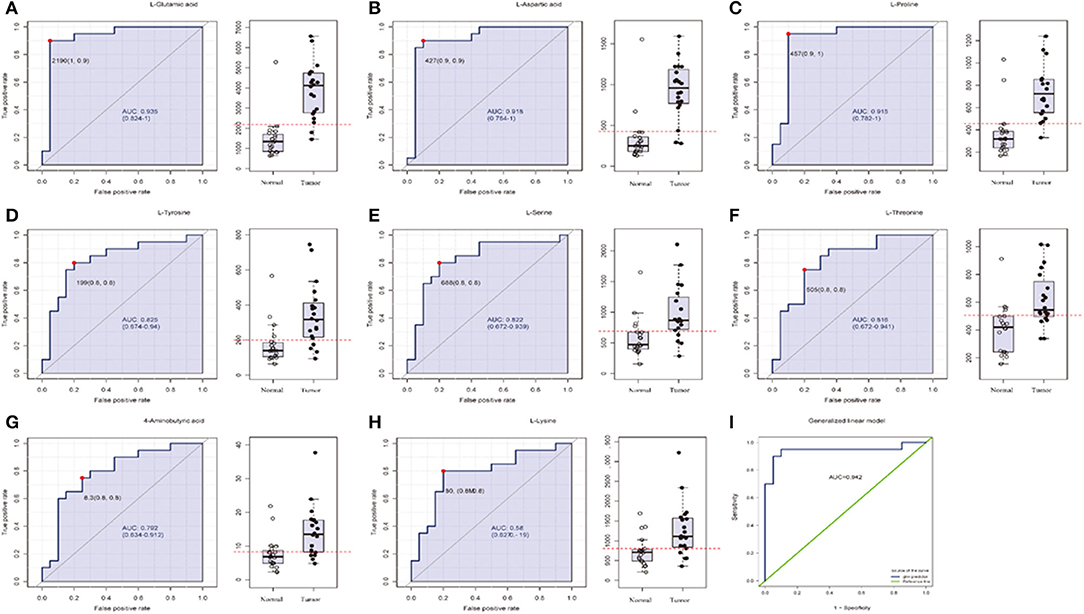
Figure 5. The list of three amino acids (AUC > 0.90) selected as potential tumor biomarkers by ROC curve analysis and binary logistic regression in targeted group. (A–H) Individual amino acid ROC curves (AUC > 0.70). (I) Analyses for three amino acids (aspartic acid, glutamate, proline, AUC > 0.90, t-test P < 0.0001) were performed by binary logistic regression in Glmnet package; optimal sensitivity and specificity in targeted group were obtained (AUC = 0.942). AUC (0.5–0.7), low accuracy; AUC (0.7–0.9), moderate accuracy; AUC (>0.9), high accuracy.
Discussion
Metabolic change was one of the hallmarks of cancer cells, in which regulatory networks were altered to adapt to the metabolic pressures and provide energy for cancer cells growth, namely, metabolic reprogram (16, 17). Compared to other “omics” (such as proteome/genome/transcriptome), most metabolites are small molecular compounds, are highly conservative, and have stable performance. The statistical analysis of metabolomics data is more convenient; the results are easier to understand and more accurate. The study on metabolomics of cancer tissue specimens is helpful to improve the diagnosis and treatment of OSCC. Currently, metabolomics studies of oral cancer use primarily biological fluids (e.g., plasma, urine, saliva) and cell lines (18–22), because biofluids and cell lines are readily available. Most biofluids-based metabolomics studies are relatively quantitative, without in-depth study on a specific metabolic type and a specific metabolite, such as amino acid metabolism and the specific content of a certain amino acid. Therefore, we urgently need to use tumor tissue and normal tissue samples to conduct systematic studies on a certain subtype of metabolomics (such as amino acid metabolomics) and finally develop a panel of markers for the early diagnosis of OSCC.
In this study, we first performed GC-MS high-throughput untargeted analysis of OSCC tumor tissue and matched normal tissue samples, 10 differential metabolites were selected by t-test to distinguish tumors from normal tissue. Many literatures have reported that amino acid metabolism reprogramming is involved in tumor development; moreover, the quantitative analysis of amino acids is convenient. Therefore, we focused on the amino acid metabolism of OSCC. A total of 10 amino acids (such as glutamate, GABA, lysine, aspartic acid, tyrosine, serine, threonine, alanine, proline, isoleucine) were selected as candidate biomarkers by ROC curve analysis (AUC >0.80) in GC-MS untargeted group.
In order to further accurately determine the oncogenic metabolites that distinguish tumors from normal tissues, UHPLC-MS/MS targeted quantitative analysis was performed on another batch of 20 cases (each case contains tumor and normal tissues). We measured the specific concentration of the above 10 amino acids in all samples. The results validated that 9 of 10 were detected, which had statistical differences between tumor and normal (t-test, p < 0.05). Glutamate, aspartic acid, and proline displayed high sensitivity and specificity (AUC >0.90) by ROC curve analysis. Moreover, obtaining optimal sensitivity and specificity uses the three amino acids by binary logistic regression in the Glmnet package. These results suggest that the three amino acids (glutamate, aspartic acid, and proline) could be used as OSCC potential biomarkers. It had been reported that OSCC tumor tissues had higher amino acid levels than normal tissues (22, 23); our research has produced similar results. However, there were reports that revealed a lower relative concentration of amino acids as compared to healthy groups in some cancers, such as breast, pancreatic, oral, and colorectal cancers (24–26). This anomaly suggests that cancer cells build a second metabolic pathway to generate energy for rapid growth, which needs more glucogenic amino acids.
It is famously known that cancer cells favor the “Warburg effect,” that is, the enhanced glycolysis or aerobic glycolysis, even when the ambient oxygen supply is sufficient. In addition, deregulated anabolism/catabolism of fatty acids and amino acids, especially glutamine, serine, and glycine, has been identified to function as metabolic regulators in supporting cancer cell growth (7, 28, 29). In addition to being utilized as substrates for protein synthesis, amino acids have been documented by mounting studies that they function as metabolites and metabolic regulators in supporting cancer cell growth, among which research on glutamine, serine, and glycine has been focused (30). It also revealed that cancer cells undergo biosynthesis during proliferation, which requires a large amount of amino acids, resulting in an increase in the concentration of amino acids in cells during the synthesis process and a decrease in the concentration of amino acids at the end of synthesis. Altered cell metabolism enables tumors to sustain their increased energetic and biosynthetic needs. Our results suggest that the three amino acids (glutamate, aspartic acid, and proline) could be used as OSCC potential biomarkers and may be involved in the progression of OSCC.
However, because of the limited size of the patients, our study is a preliminary study, and the accuracy of the diagnostic values of our identified panels (glutamate, aspartic acid, and proline) remained to be verified by more samples. The molecular mechanism of amino acid metabolism promoting OSCC and related metabolic pathways deserve further study.
Conclusion
The results from this study were based on GS-MS untargeted metabolomics analysis and UHPLC-MS targeted quantitative analysis revealing three amino acids (glutamate, aspartic acid, and proline) as potential biomarkers of OSCC.
Data Availability Statement
All datasets generated for this study are included in the article/supplementary material.
Ethics Statement
This study was reviewed and approved by the medical ethics committee of Nanjing Stomatological Hospital, Medical School of Nanjing University, and carried out according to the recommendations of the Declaration of Helsinki. All cases included in the study were between 30 and 70 years old and had signed informed consent forms.
Author Contributions
X-HY, Q-GH, and Y-HN: investigation and project administration. SC and LZ: software application. X-HY, FD, and SW: data analysis. X-XZ and YJ: methodology and supervision. Y-HN and YJ: validation data. X-HY and Y-HN: wrote the draft. Q-GH: writing-review and editing.
Funding
Jiangsu Provincial Key Medical Discipline (since 2017), Nanjing Municipal Key Medical Laboratory Constructional Project Funding (Since 2016), Center of Nanjing Clinical Medicine of tumor project (Since 2014), National Natural Science Foundation of China (No. 81772880 and 81902759), Nanjing Medical Science and Technique Development Foundation (QRX17083, ZKX18035, YKK17138, and YKK18123). The funders had no role in study design, data collection and analysis, decision to publish, or preparation of the manuscript.
Conflict of Interest
The authors declare that the research was conducted in the absence of any commercial or financial relationships that could be construed as a potential conflict of interest.
References
1. Petersen PE. Strengthening the prevention of oral cancer: the WHO perspective. Community Dent Oral Epidemiol. (2005) 33:397–9. doi: 10.1111/j.1600-0528.2005.00251.x
2. Marur S, D'Souza G, Westra WH, Forastiere AA. HPV-associated head and neck cancer: a virus-related cancer epidemic. Lancet Oncol. (2010) 11:781–9. doi: 10.1016/S1470-2045(10)70017-6
3. Pignon JP, le Maitre A, Maillard E, Bourhis J. Meta-analysis of chemotherapy in head and neck cancer (MACH-NC): an update on 93 randomised trials and 17,346 patients. Radiother Oncol. (2009) 92:4–14. doi: 10.1016/j.radonc.2009.04.014
4. Vander Heiden MG, DeBerardinis RJ. Understanding the intersections between metabolism and cancer biology. Cell. (2017). 168:657–69. doi: 10.1016/j.cell.2016.12.039
5. Warburg O. On the origin of cancer cells. Science. (1956) 123:309–14. doi: 10.1126/science.123.3191.309
6. Ferreira LM. Cancer metabolism: the Warburg effect today. Exp Mol Pathol. (2010) 89:372–80. doi: 10.1016/j.yexmp.2010.08.006
7. Wise D, DeBerardinis RJ, Mancuso A, Sayed N, Zhang XY, Pfeiffer HK, et al. Myc regulates a transcriptional program that stimulates mitochondrial glutaminolysis and leads to glutamine addiction. Proc Natl Acad Sci USA. (2008) 105:18782–7. doi: 10.1073/pnas.0810199105
8. Yang C, Sudderth J, Dang T, Bachoo RG, McDonald JG, DeBerardinis RJ. Glioblastoma cells require glutamate dehydrogenase to survive impairments of glucose metabolism or Akt signaling. Cancer Res. (2009) 69:7986–93. doi: 10.1158/0008-5472.CAN-09-2266
9. Cairns RA, Harris IS, Mak TW. Regulation of cancer cell metabolism. Nat Rev Cancer. (2011) 11:85–95. doi: 10.1038/nrc2981
10. Masthan K, Babu NA, Dash KC, Elumalai M. Advanced diagnostic aids in oral cancer. Asian Pac J Cancer Prev. (2012) 13:3573–6. doi: 10.7314/APJCP.2012.13.8.3573
11. Santosh AB, Jones T, Harvey J. A review on oral cancer biomarkers: understanding the past and learning from the present. J Cancer Res Ther. (2016) 12:486–92. doi: 10.4103/0973-1482.176414
12. Saraswat M, Mäkitie A, Tohmola T, Dickinson A, Saraswat S, Joenväärä S, et al. Tongue cancer patients can be distinguished from healthy controls by specific N-glycopeptides found in serum. Proteomics Clin Appl. (2018) 12:e1800061. doi: 10.1002/prca.201800061
13. Lohavanichbutr P, Zhang Y, Wang P, Gu H, Gowda GAN, Djukovic D, et al. Salivary metabolite profiling distinguishes patients with oral cavity squamous cell carcinomafrom normal controls. PLoS ONE. (2018) 13:e0204249. doi: 10.1371/journal.pone.0204249
14. Xie HH, Xu JY, Xie T, Meng X, Lin LL, He LL, et al. Effects of Pinellia ternata (Thunb.) Berit. on the metabolomic profiles of placenta and amniotic fluid in pregnant rats. J Ethnopharmacol. (2016) 183:38–45. doi: 10.1016/j.jep.2016.02.030
15. Yang XH, Zhang XX, Jing Y, Ding L, Fu Y, Wang S, et al. Amino acids signatures of distance-related surgical margins of oral squamous cell carcinoma. Ebiomedicine. (2019) 48:81–91. doi: 10.1016/j.ebiom.2019.10.005
16. Ward PS, Thompson CB. Metabolic reprogramming: a cancer hallmark even Warburg did not anticipate. Cancer Cell. (2012) 21:297–308. doi: 10.1016/j.ccr.2012.02.014
17. Hanahan D, Weinberg RA. Hallmarks of cancer: the next generation. Cell. (2011) 144:646–74. doi: 10.1016/j.cell.2011.02.013
18. Kamarajan P, Rajendiran TM, Kinchen J, Bermúdez M, Danciu T, Kapila YL, et al. Head and neck squamous cell carcinoma metabolism draws on glutaminolysis, and stemnessis specifically regulated by glutaminolysis via aldehyde dehydrogenase. J Proteome Res. (2017) 16:1315–26. doi: 10.1021/acs.jproteome.6b00936
19. Ishikawa S, Sugimoto M, Kitabatake K, Sugano A, Nakamura M, Kaneko M, et al. Identification of salivary metabolomic biomarkers for oral cancer screening. Sci Rep. (2016) 6:31520. doi: 10.1038/srep31520
20. Tripathi P, Kamarajan P, Somashekar BS, MacKinnon N, Chinnaiyan AM, Kapila YL, et al. Delineating metabolic signatures of head and neck squamous cell carcinoma: phospholipase A2, a potential therapeutic target. Int J Biochem Cell Biol. (2012) 44:1852–61. doi: 10.1016/j.biocel.2012.06.025
21. Musharraf SG, Shahid N, Naqvi SMA, Saleem M, Siddiqui AJ, Ali A. Metabolite profiling of preneoplastic and neoplastic lesions of oral cavity tissue samplesrevealed a biomarker pattern. Sci Rep. (2016) 6:38985. doi: 10.1038/srep38985
22. Somashekar BS, Kamarajan P, Danciu T, Kapila YL, Chinnaiyan AM, Rajendiran TM, et al. Magic angle spinning NMR-based metabolic profiling of head and neck squamous cell carcinoma tissues. J Proteome Res. (2011) 10:5232–41. doi: 10.1021/pr200800w
23. Chen X, Yu D. Metabolomics study of oral cancers. Metabolomics. (2019) 15:22. doi: 10.1007/s11306-019-1483-8
24. Leichtle AB, Nuoffer JM, Ceglarek U, Kase J, Conrad T, Witzigmann H, et al. Serum amino acid profiles and their alterations in colorectal cancer. Metabolomics. (2012) 8:643–53. doi: 10.1007/s11306-011-0357-5
25. Qiu Y, Cai G, Su M, Chen T, Zheng X, Xu Y, et al. Serum metabolite profiling of human colorectal cancer using GC-TOFMS UPLC-QTOFMS. J Proteome Res. (2009) 8:4844–50. doi: 10.1021/pr9004162
26. Sugimoto M, Wong DT, Hirayama A, Soga T, Tomita M. Capillary electrophoresis mass spectrometry-based saliva metabolomics identified oral, breast and pancreatic cancer-specific profiles. Metabolomics. (2010) 6:78–95. doi: 10.1007/s11306-009-0178-y
27. Ogawa T, Washio J, Takahashi T, Echigo S, Takahashi N. Glucose and glutamine metabolism in oral squamous cell carcinoma: insight from a quantitativemetabolomic approach. Oral Surg Oral Med Oral Pathol Oral Radiol. (2014) 118:218–25. doi: 10.1016/j.oooo.2014.04.003
28. Togashi Y, Arao T, Kato H, Matsumoto K, Terashima M, Hayashi H, et al. Frequent amplification of ORAOV1 gene in esophageal squamous cell cancer promotes an aggressive phenotype via proline metabolism and ROS production. Oncotarget. (2014) 5:2962–73. doi: 10.18632/oncotarget.1561
29. Feun LG, Kuo MT, Savaraj N. Arginine deprivation in cancer therapy. Curr Opin Clin Nutr Metab Care. (2015) 18:78–82. doi: 10.1097/MCO.0000000000000122
Keywords: oral squamous cell carcinoma, non-targeted metabolomics, targeted metabolomics, amino acid markers, diagnosis
Citation: Yang X-H, Jing Y, Wang S, Ding F, Zhang X-X, Chen S, Zhang L, Hu Q-G and Ni Y-H (2020) Integrated Non-targeted and Targeted Metabolomics Uncovers Amino Acid Markers of Oral Squamous Cell Carcinoma. Front. Oncol. 10:426. doi: 10.3389/fonc.2020.00426
Received: 10 December 2019; Accepted: 10 March 2020;
Published: 15 April 2020.
Edited by:
Cristian Scatena, University of Pisa, ItalyReviewed by:
Daniel Pereira Bezerra, Oswaldo Cruz Foundation (Fiocruz), BrazilMariafrancesca Scalise, University of Calabria, Italy
Copyright © 2020 Yang, Jing, Wang, Ding, Zhang, Chen, Zhang, Hu and Ni. This is an open-access article distributed under the terms of the Creative Commons Attribution License (CC BY). The use, distribution or reproduction in other forums is permitted, provided the original author(s) and the copyright owner(s) are credited and that the original publication in this journal is cited, in accordance with accepted academic practice. No use, distribution or reproduction is permitted which does not comply with these terms.
*Correspondence: Yan-Hong Ni, bml5YW5ob25nMTJAMTYzLmNvbQ==; Qin-Gang Hu, cWluZ2FuZ2h1QGhvdG1haWwuY29t
 Xi-Hu Yang
 Yue Jing1
 Yan-Hong Ni