- 1Jiangsu Clinical Medicine Center of Tissue Engineering and Nerve Injury Repair and Department of Neurosurgery, The Affiliated Hospital of Nantong University, Nantong, China
- 2Department of Neurosurgery, Shanghai Jiao Tong University School of Medicine Affiliated Renji Hospital, Shanghai, China
- 3Department of Clinic Research Center, The Affiliated Hospital of Nantong University, Nantong, China
- 4Department of Neurosurgery, Chuzhou Clinical College of Anhui Medical University, The First Peoples Hospital Chuzhou, Chuzhou, China
- 5Medical Image Center, The Affiliated Hospital of Nantong University, Nantong, China
The aim of the present study was to explore the expression profiles of lncRNAs and mRNAs in glioma patients and to elucidate any potential relationship between lncRNAs and mRNAs in glioma. High-throughput transcriptome sequencing of mRNAs and lncRNAs from six normal tissues and 16 glioma tissues (grade II, six cases; grade III, four cases; and grade IV, six cases) was performed. Series test of cluster (STC) analysis was used to screen significant trending models associated with glioma. Gene co-expression networks were constructed for the differentially expressed lncRNAs and mRNAs, and gene-ontology (GO) and pathway-enrichment analyses were further performed. Quantitative real-time PCR was performed to validate the five most differentially expressed lncRNAs and mRNAs. After filtering the raw sequencing data, we found 578 lncRNAs and 3,216 mRNAs that were significantly dysregulated in glioma (fold change ≥ 2, p < 0.05). Twenty model profiles of lncRNA and 10 model profiles of mRNA were summarized, and three patterns of lncRNAs and two patterns of mRNAs were of clinical significance. Three gene co-expression networks between mRNAs and lncRNAs were built to clarify the relationship between lncRNAs and mRNAs in glioma. GO and pathway analyses indicated that the differentially expressed lncRNAs and mRNAs were enriched in several biological processes and signaling pathways associated with tumorigenesis. Both lncRNAs and mRNAs exhibited dynamic differential expression profiles that indicated their potential roles in different degrees of glioma malignancy. A series of bioinformatics analyses indicated that most of these lncRNAs and mRNAs are involved in important biological processes and pathways associated with the pathogenesis of glioma. These results provide potential directions and valuable resources for future investigations via the comprehensive integration of these lncRNAs and mRNAs.
Introduction
Gliomas are the most common type of primary brain tumor (1) representing 75% of all malignant primary central-nervous-system (CNS) tumors in adults (2). In the updated 2016 version of the World Health Organization (WHO) classification of CNS tumors, gliomas are divided into circumscribed gliomas (WHO grade I) and diffusely-infiltrating gliomas (whether astrocytic or oligodendroglial, WHO grades II–IV) (3). Compared to circumscribed gliomas, diffusely-infiltrating gliomas exhibit a more relentless malignant progression, a reduced efficacy to various therapeutic approaches, and a higher risk of recurrence (4). Despite efforts to promote various new therapies and advances in the research of tumor biology, the prognosis for patients with gliomas, especially diffusely-infiltrating gliomas, is still bleak (2, 5). This is mainly due to a lack of accurate biomarkers and a poor understanding of the pathogenesis of gliomas, which leads to delayed diagnoses and ineffective therapeutic outcomes. Therefore, there is an urgent need to better understand the mechanisms underlying glioma and to find potential biomarkers and accurate therapeutic targets.
Long non-coding RNAs (lncRNAs) account for a major class of non-coding RNAs (ncRNAs) and measure a length >200 nucleotides (6, 7). Recent studies have demonstrated that lncRNAs may be involved in gene expression via four different processes: epigenetic regulation, translational regulation, transcriptional regulation, and post-transcriptional regulation (8–12). Increasing evidence has suggested that lncRNAs are vital epigenetic regulators of mRNA expression and constitute an important fraction of the human transcriptome. Furthermore, there is a growing number of studies that have reported that lncRNAs play important roles in tumor genesis, progression, and metastasis, as well as many other cellular processes (13–16). Aberrant expression of lncRNAs may contribute to glioma pathogenesis, including cellular proliferation, apoptosis, and metastasis (17–20). The dysregulation of lncRNAs may serve as diagnostic biomarkers of early stages of glioma and could be exploited as therapeutic targets (21–23). However, the potential pathological and biological roles of lncRNAs and mRNAs in different degrees of glioma malignancy have yet to be elucidated.
Recently, the deep sequencing of transcriptomes is being utilized with a higher sensitivity for the identification of differential expression. Advances in next-generation, deep-sequencing technology have identified a number of ncRNAs. Here, we performed high-throughput transcriptome sequencing of glioma tissues and normal tissues to determine lncRNA and mRNA profiles, to investigate novel tumor-related lncRNAs and mRNAs in glioma, and to generate model profiles for future studies. We constructed a gene co-expression network for the differentially expressed lncRNAs and mRNAs in glioma tissues to further investigate the relationship between lncRNAs and mRNAs. We also conducted gene-ontology (GO) enrichment analysis and pathway-enrichment analysis for the differentially expressed lncRNAs and mRNAs. In addition, the five most differentially expressed lncRNAs and mRNAs were verified by quantitative real-time PCR (qRT-PCR).
Materials and Methods
Patients and Samples
We recruited 50 patients diagnosed with glioma or epilepsy and collected their tumor or normal tissues from March 2014 to December 2018. All the tumor patients were explicitly diagnosed with glioma by histopathological examination after surgery and were classified as grade II, grade III, and grade IV according to the CNS tumor-classification criteria (fourth edition) published by the WHO in 2016. Six normal tissues and 16 glioma tissues (grade II, six cases; grade III, four cases; and grade IV, six cases) were selected at random for high-throughput transcriptome sequencing, and qRT-PCR analysis was performed in the other samples. All the patients had no prior chemotherapy or radiotherapy and did not have any other serious diseases. The brain tissues for RNA-sequencing were transferred to −80°C storage within 60 min of resection. This experiment was approved by the Ethics committee of Nantong University, and all patients provided informed consent.
RNA Library Construction and RNA Sequencing
Total RNA was extracted from the brain tissue samples using Trizol reagent (Invitrogen, Cat no.15596-026, USA), following the manufacturer's protocol. Ribosomal RNA was removed from the total RNA samples using Ribo-Zero rRNA Removal Kits (Illumina, USA), as per the manufacturer's instructions. RNA libraries were constructed using rRNA-depleted RNAs with TruSeq Stranded Total RNA Library Prep Kit (Illumina, USA), according to the manufacturer's instructions. The libraries were controlled for quality and quantified using the BioAnalyzer 2,100 system (Agilent Technologies, USA). Then, the 10-pM libraries were denatured as single-stranded DNA molecules, captured on Illumina flow cells, amplified in situ as clusters, and finally amplified (150 cycles) and sequenced on an Illumina HiSeq Sequencer, according to the manufacturer's instructions.
The high-quality reads generated were aligned to the human reference genome (UCSC hg19) with hisat2 software. Then, guided by the Ensembl gene-annotation file, cuffdiff software (part of cufflinks) was used to reveal the expression profile of the lncRNAs and mRNAs in terms of Fragments Per Kilobase of transcript per Million mapped reads (FPKM) values, from which the fold change between groups and the corresponding p-values were calculated. Subsequently, differentially expressed lncRNAs and mRNAs were identified and lncRNA target genes were predicted by their locations to nearby genes.
Series Test of Clusters (STC)
STC analysis was used to screen the significant trending models associated with glioma and their corresponding differentially expressed mRNAs and lncRNAs. Fisher's exact test was used to identify significant profiles, and p ≤ 0.05 was used as a threshold of significance.
Gene Co-expression Analyses
To explore the interactions between the DEGs and differentially expressed lncRNAs, gene co-expression networks were build based on their co-expression patterns. The lncRNAs with a related coefficient of R ≥ 0.95 or R ≤ −0.95 were screened for functional analysis.
Gene Ontology (GO) Analysis
All differentially expressed genes (DEGs) were mapped to GO terms in the GO database (http://www.geneontology.org/). A hypergeometric test was applied to find significantly enriched GO terms in the input list of DEGs, based on “GO::TermFinder” (http://smd.stanford.edu/help/GO-TermFinder/GO_TermFinder_help.shtml).
A Bonferroni correction was applied to adjust the p-value. The false discovery rate (FDR)-adjusted p ≤ 0.05 was used as a threshold and GO terms fulfilling this condition were defined as significantly enriched.
Pathway Analysis
Pathway analysis was used to identify pathways involving the DEGs, according to the Kyoto Encyclopedia of Genes and Genomics (KEGG). Pathways with FDR-adjusted p ≤ 0.05 were defined as significantly enriched. Cytoscape was used to generate graphical representations of the pathways.
Quantitative Real-Time Polymerase Chain Reaction (qRT-PCR)
Reverse transcription was performed with the High-Capacity cDNA Reverse Transcription Kits (Applied Biosystems, Foster City, USA), according to the manufacturer's instructions. qRT-PCR was performed on an ABI 7500 thermocycler (Applied Biosystems, Foster City, CA, USA) by using SYBR Green Real-Time PCR Master Mix (Toyobo, Japan). GAPDH was used for normalization. All qPCR reactions were performed in biological triplicates. Primer sequences are listed in Supplemental Table 1.
Statistical Analysis
Student's t-tests and one-way analyses of variance (ANOVA) with Bonferroni corrections for multiple comparisons were performed to determine significant differences between different groups. A false discovery rate (FDR)-adjusted p ≤ 0.05 was regarded as statistically significant. All statistical details are specified in the figure legends.
Results
Differentially Expressed lncRNAs and mRNAs in Glioma Tissues Compared With Normal Tissues
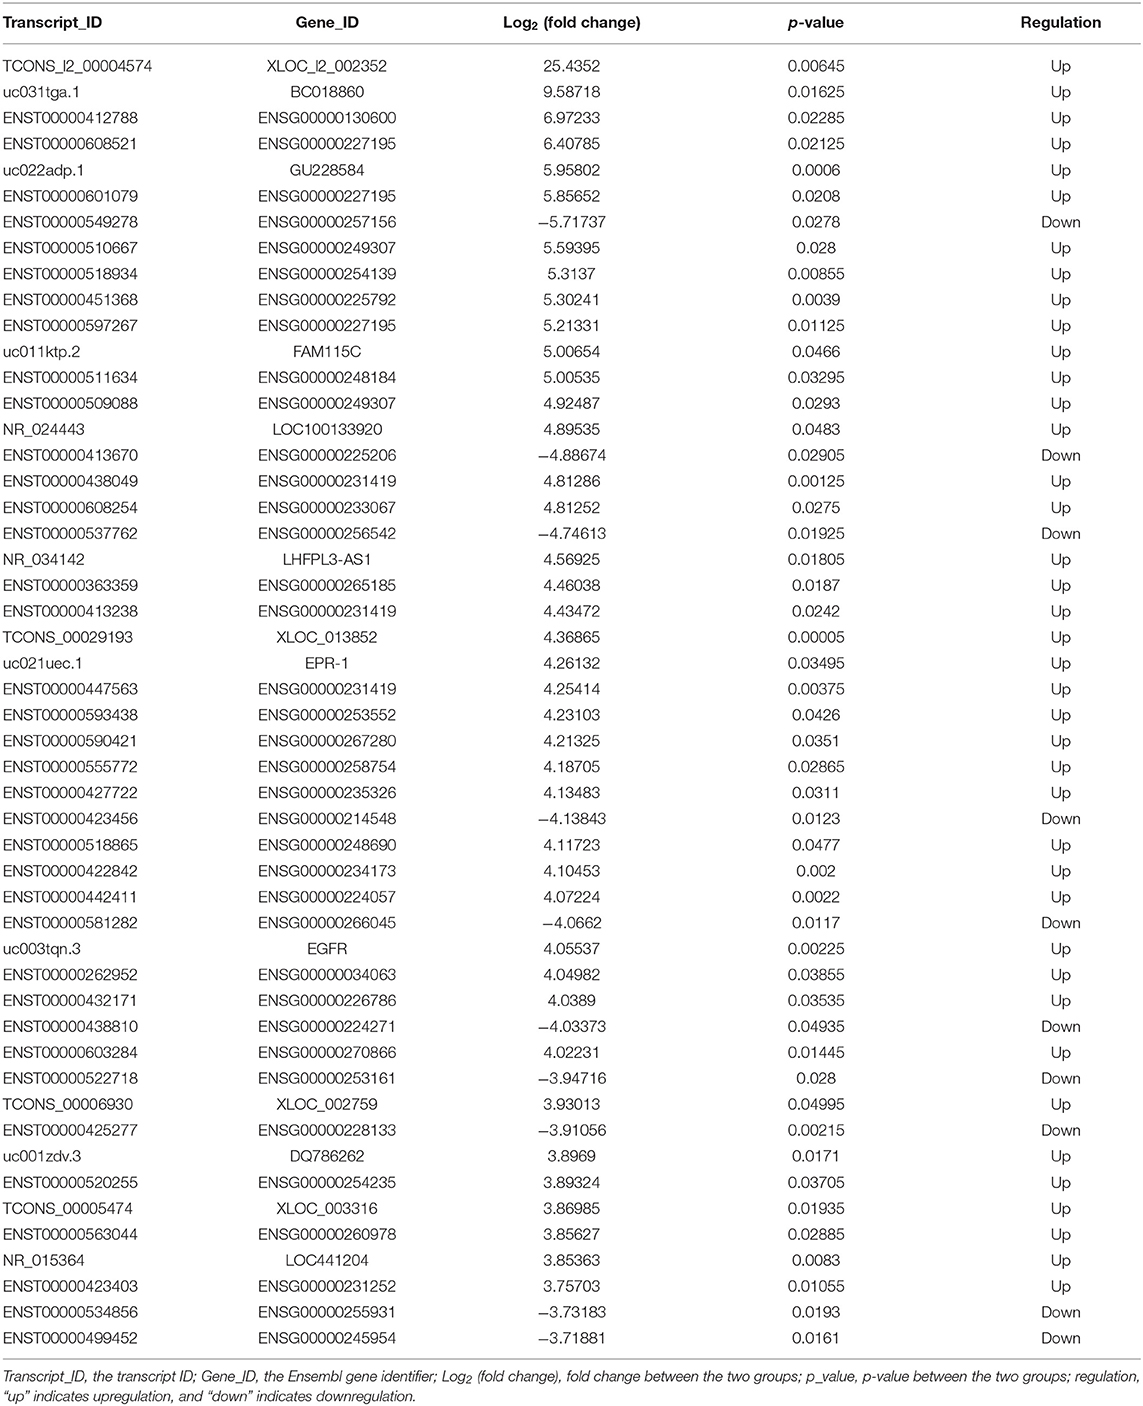
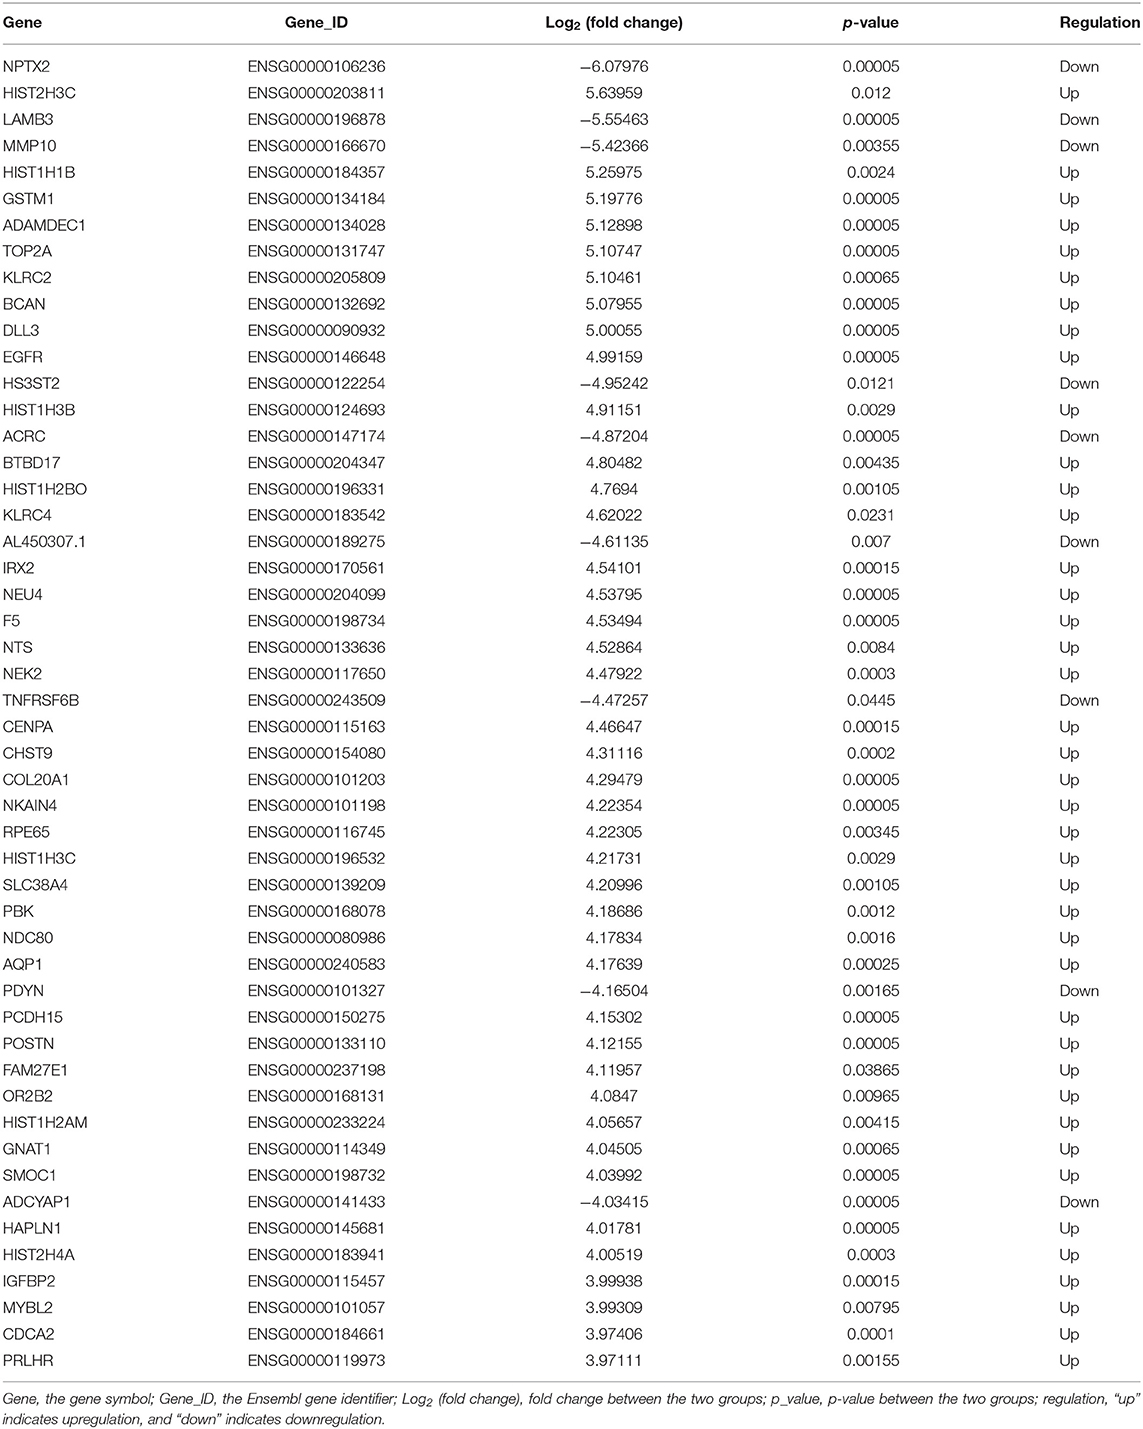
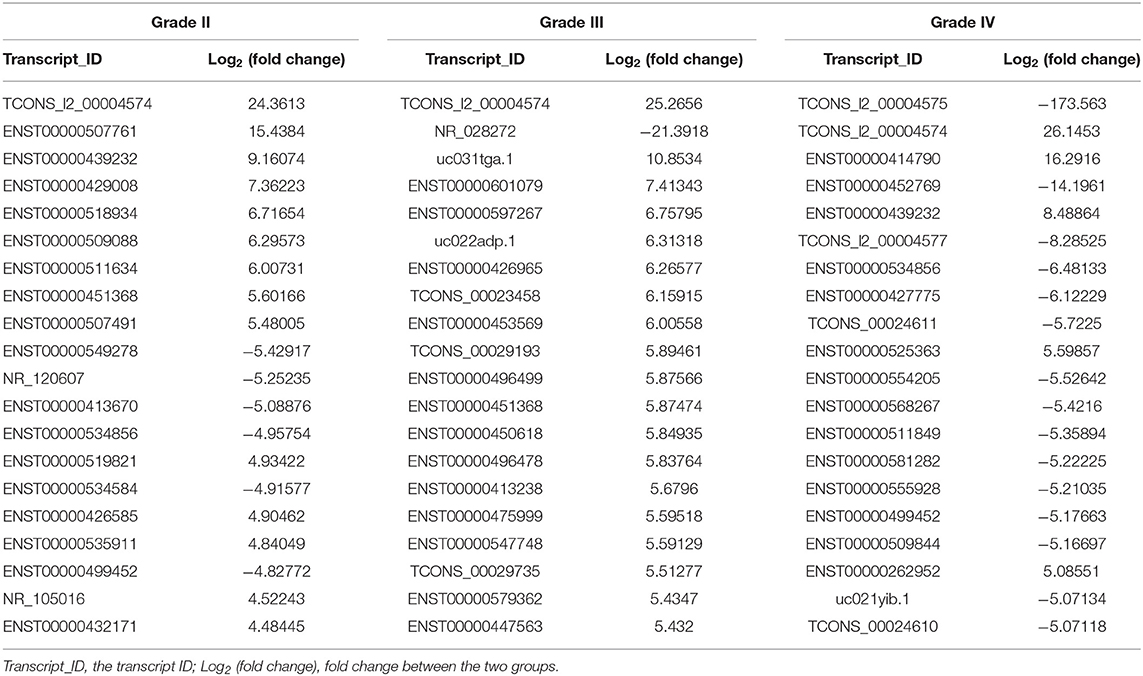
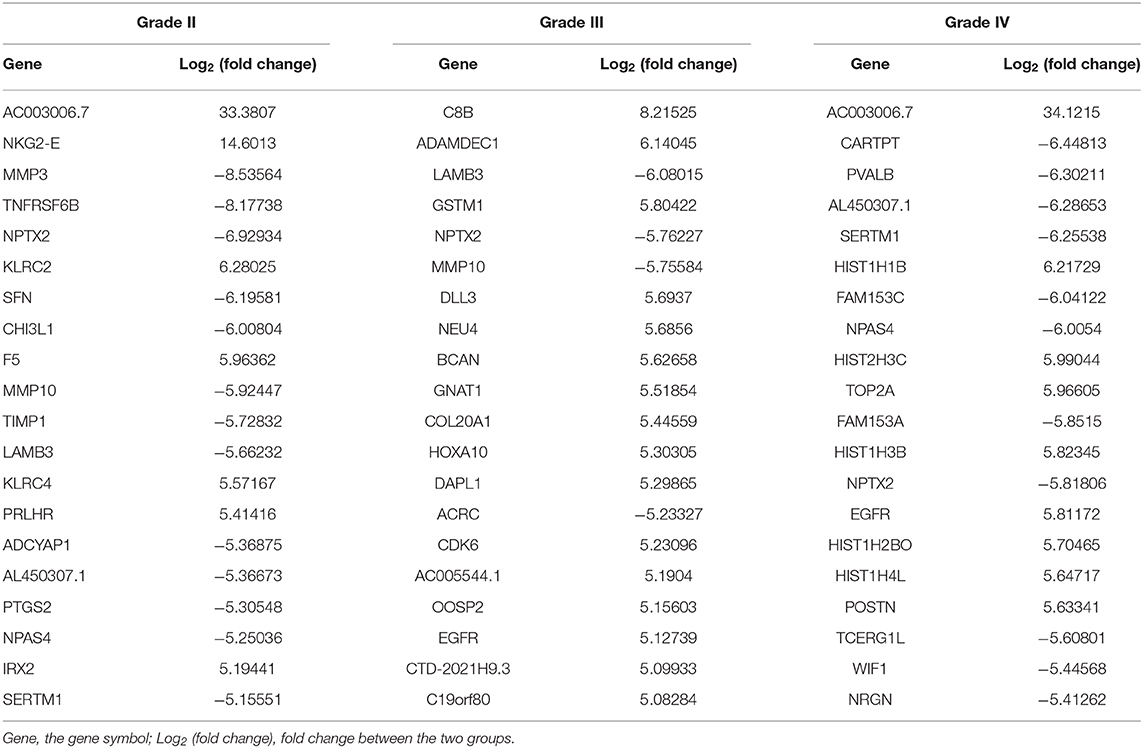
The lncRNA and mRNA expression levels were compared in glioma tissues and normal tissues. We found 578 lncRNAs and 3,216 mRNAs that were significantly dysregulated in glioma tissues. Among these, 509 lncRNAs and 2,282 mRNAs were upregulated and 69 lncRNAs and 934 mRNAs were downregulated (fold change ≥ 2.0, p < 0.05). We then used hierarchical-clustering analysis to reveal between-group comparisons of lncRNA and mRNA expression levels (Figures 1A,B). In addition, the variation of differential lncRNAs and mRNAs between the glioma and normal groups is shown in a scatter plot (Figures 1C,D). The 30 most significantly differentially expressed lncRNAs and mRNAs are listed in Tables 1, 2. The 20 most significantly differentially expressed lncRNAs and mRNAs in Grade II, III, and IV are listed in Tables 3, 4.
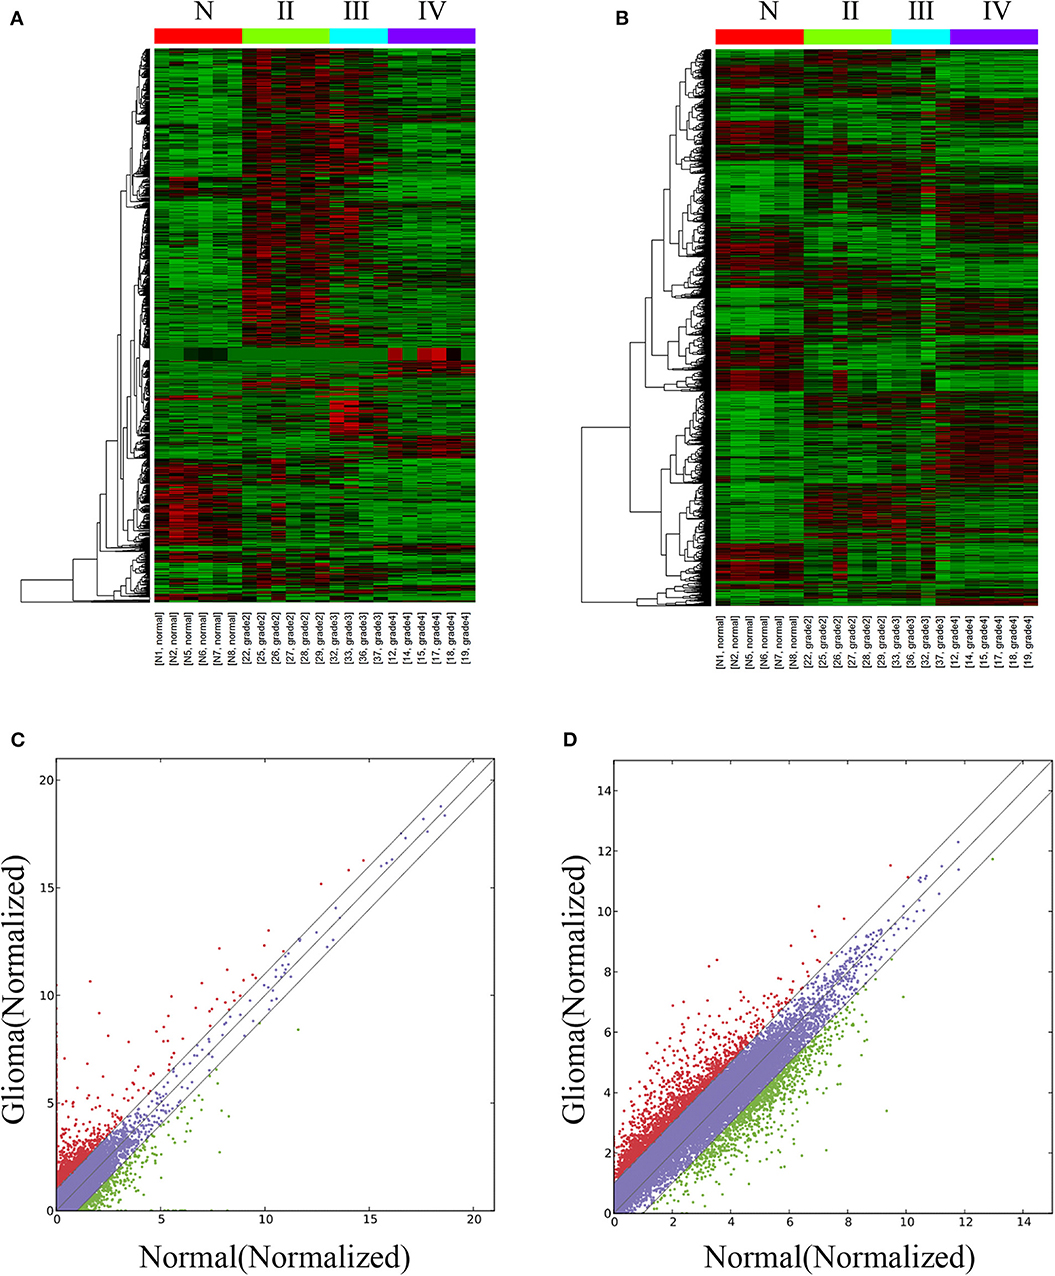
Figure 1. Differentially expressed lncRNAs and mRNAs in glioma tissues and normal tissues. The hierarchical clustering and heat map show differential lncRNA (A) and mRNA (B) expression profiles of all targets among samples: red represents high relative expression, and green represents low relative expression. The variation of differential lncRNAs and mRNAs between the glioma and normal groups is shown in a scatter plot (C,D). The red dots and green dots denote a fold change >2.
Model Profile Analysis of lncRNAs and mRNAs in Glioma Tissues and Normal Tissues
To narrow down the number of highly significant differentially expressed lncRNAs and mRNAs, we further analyzed their specific expression patterns. Twenty model profiles of lncRNAs and 10 model profiles of mRNAs were summarized. Among the 20 patterns, we identified nine patterns of lncRNAs that exhibited significant p-values (Figure 2A; p-values in red boxes).
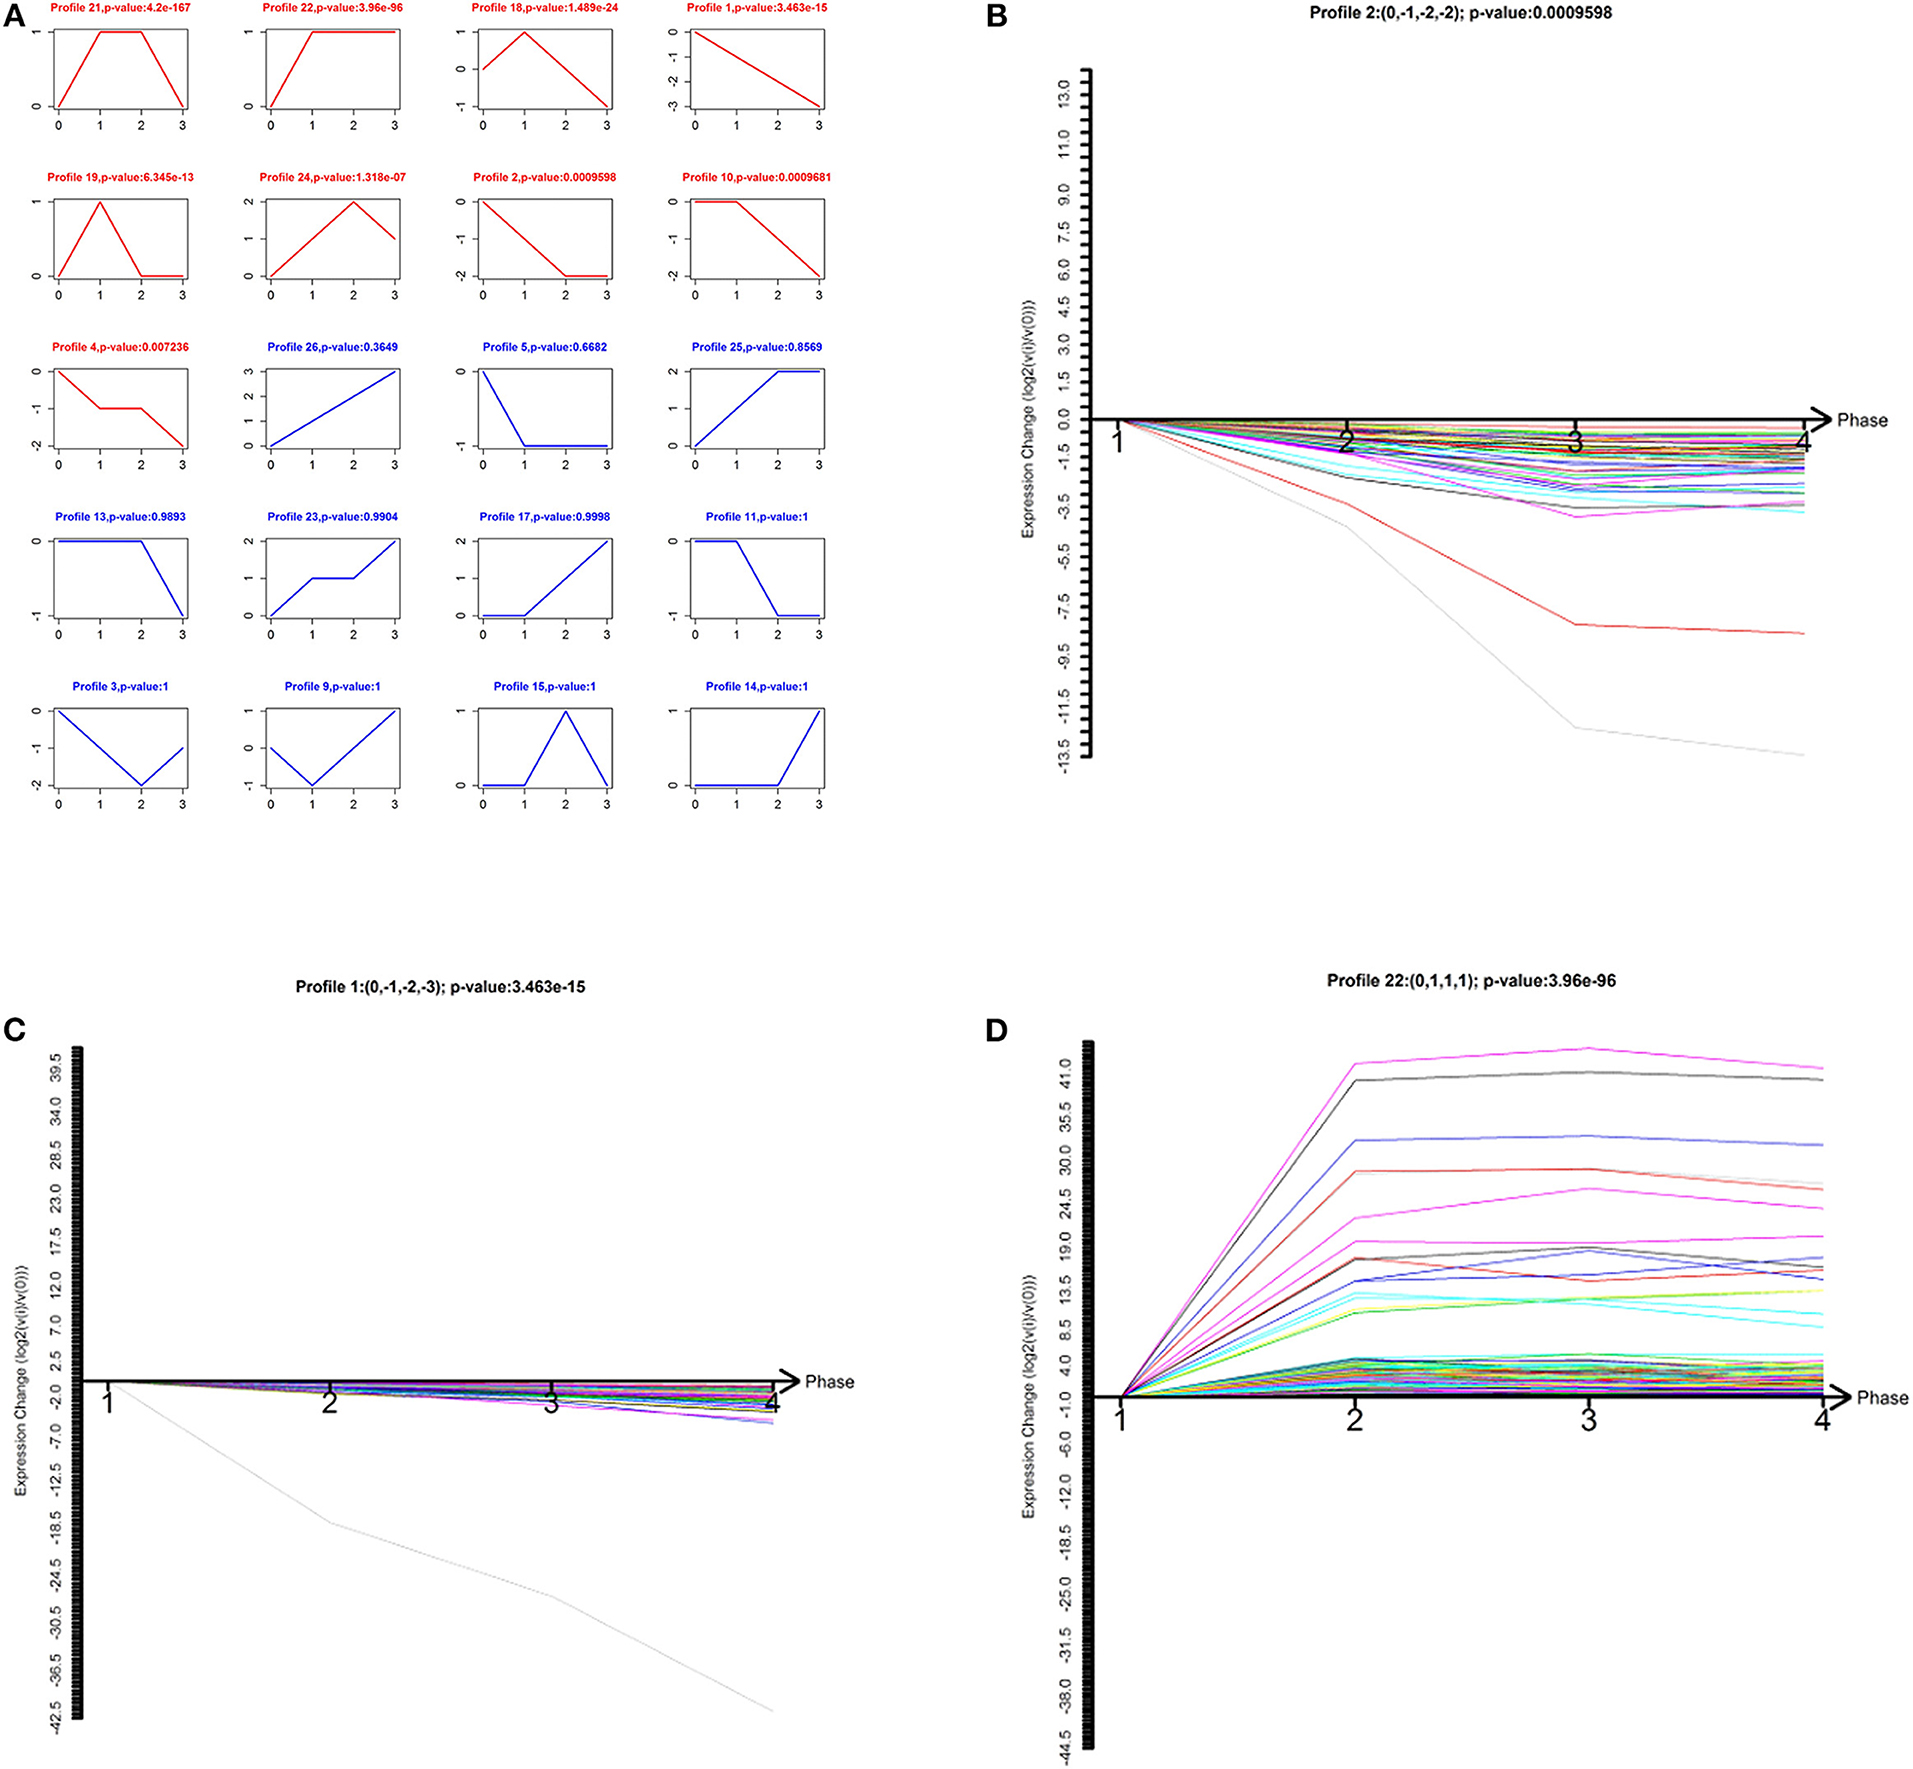
Figure 2. Model-profile analysis for differentially expressed lncRNAs associated with the malignancy-grades of gliomas. (A) The expression patterns of differentially expressed lncRNAs were analyzed and 20 model profiles were summarized. Each model-expression profile is represented by a box. In total, nine expression patterns of lncRNAs exhibited significant p-values (p < 0.05) and the red boxes denote the changing trend of these significant profiles. (B–D) The patterns of profiles that have clinical significance are presented.
Among the nine significant patterns, the expression of lncRNAs in profile No. 1, 2, and 22 were of clinical significance (Figures 2B–D). The lncRNA model profile No.1 and No. 2 contained 78 lncRNAs and 58 lncRNAs, respectively, the expressions of which were decreased consistently in glioma tissues (grades II–IV). Additionally, lncRNA profile No. 22 was constructed with 457 lncRNAs, which exhibited consistently up-regulated expression in glioma tissues (grades II–IV).
Establishment of the Gene Co-expression Network for lncRNAs and mRNAs in Glioma Tissues
To clarify the relationship between lncRNAs and mRNAs in glioma, we performed correlation analyses for lncRNAs and mRNAs in terms of their expression values in glioma tissues. Additionally, a gene co-expression network between mRNAs and lncRNAs was constructed (Figures 3–5). In profile No. 22, there were 83 square nodes and 287 circular nodes that represented lncRNAs and mRNAs, respectively. Moreover, the edges showed the interaction between the lncRNAs and mRNAs. These results indicated that lncRNAs may play vital roles in the pathogenesis of glioma.
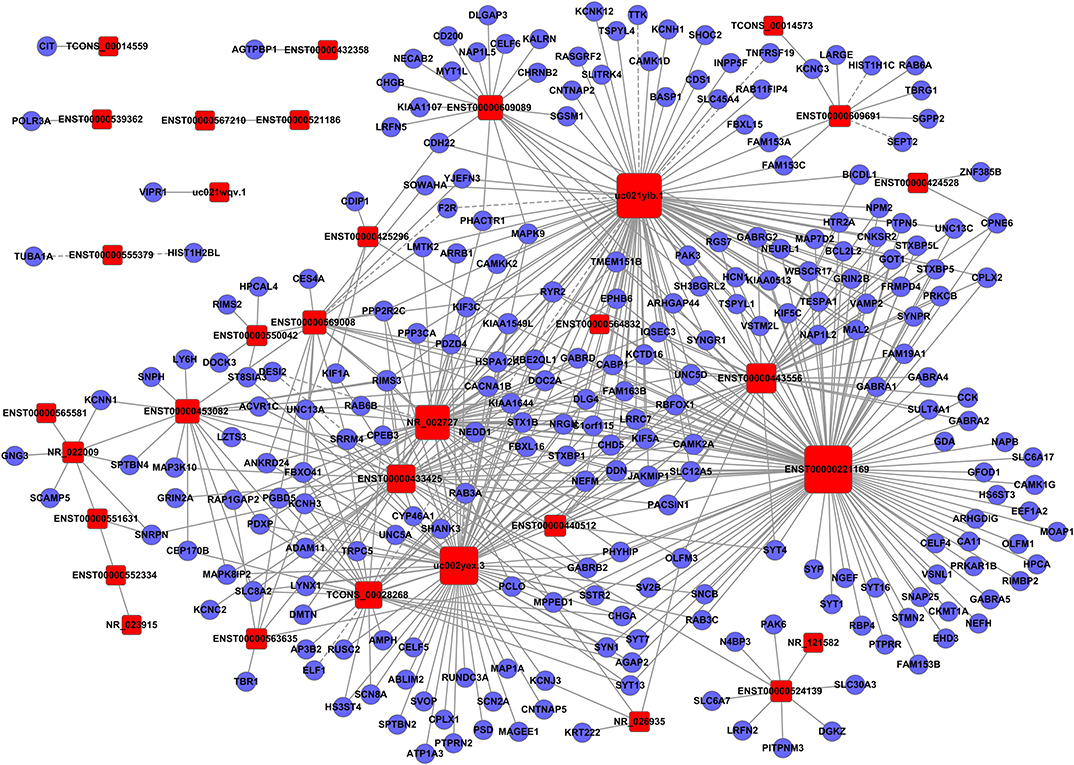
Figure 3. Establishment of the gene co-expression network for lncRNAs in profile No. 1 and the corresponding mRNAs. Here, 33 square nodes and 244 circular nodes represent lncRNAs and mRNAs, respectively. The edges show the interaction between the lncRNAs and mRNAs.
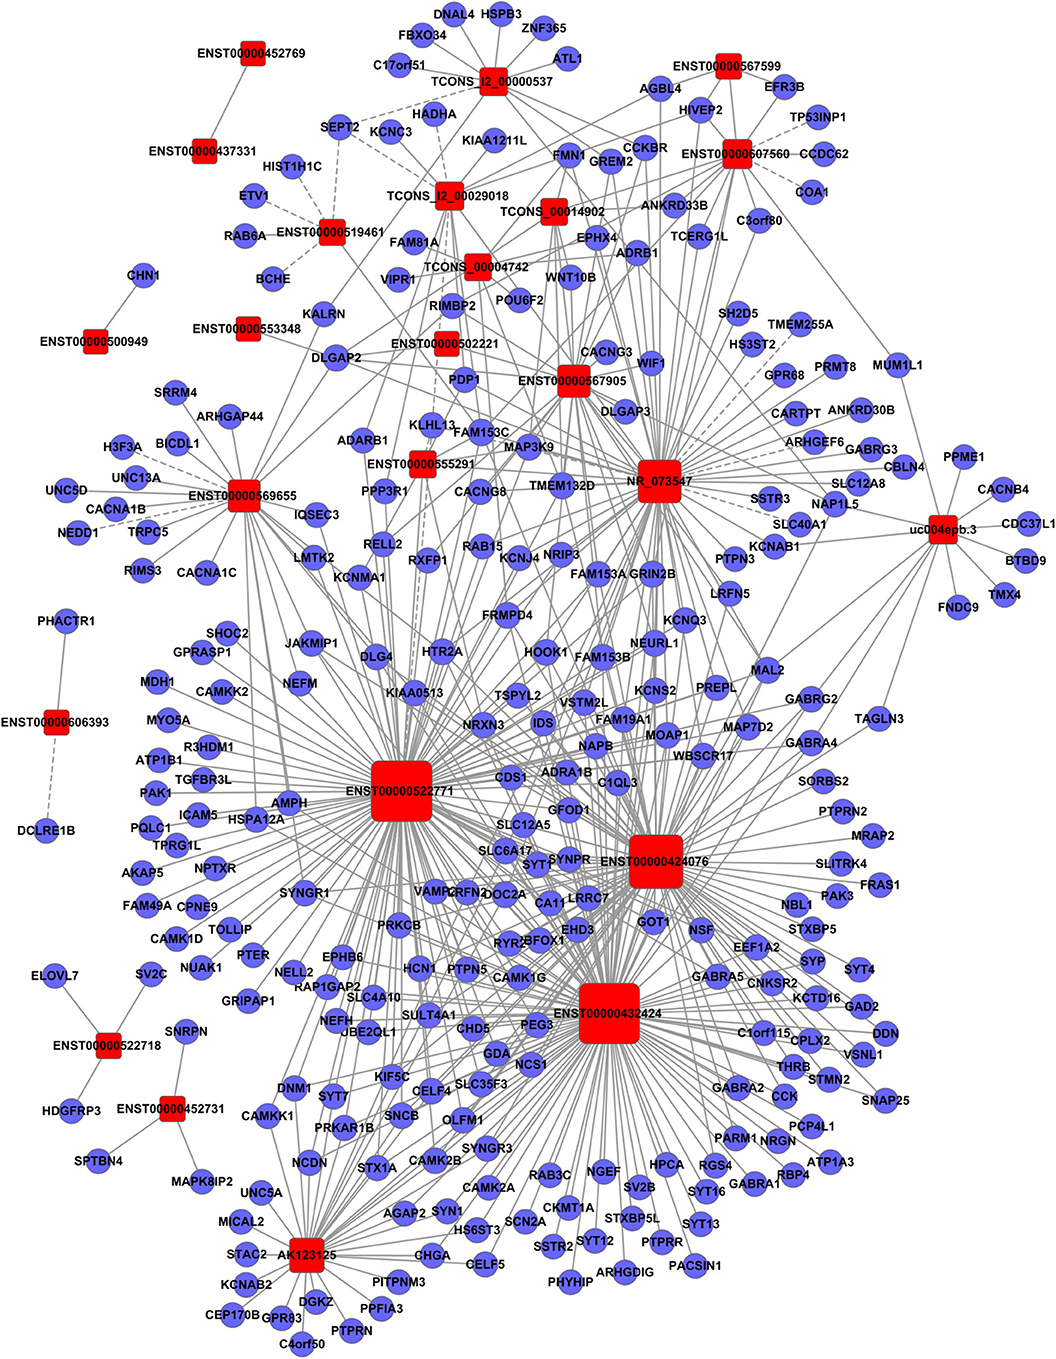
Figure 4. Establishment of the gene co-expression network for lncRNAs in profile No. 2 and the corresponding mRNAs. Here, 24 square nodes and 258 circular nodes represent lncRNAs and mRNAs, respectively. The edges show the interaction between the lncRNAs and mRNAs.
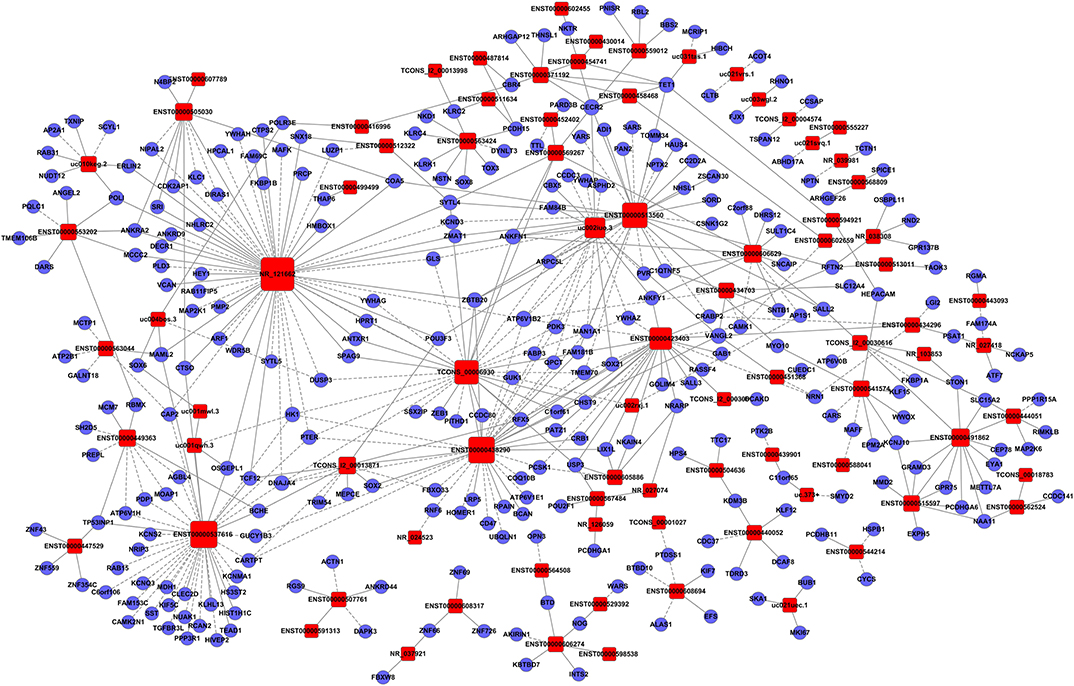
Figure 5. Establishment of the gene co-expression network for lncRNAs in profile No. 22 and the corresponding mRNAs. Here, 83 square nodes and 287 circular nodes represent lncRNAs and mRNAs, respectively. The edges show the interaction between the lncRNAs and mRNAs.
GO- and Pathway-Enrichment Analyses of Differentially Expressed lncRNAs
To further identify the functional roles of these differential lncRNAs found to be dysregulated in the tumor group, we conducted GO-enrichment and pathway-enrichment analyses. The GO analysis returned terms associated with three categories: molecular function (MF), cellular component (CC), and biological process (BP). The number of lncRNAs in profile No. 22 found associated with each GO term was counted and are shown in a pie chart (Figure 6). The 10 most enriched GO terms (in descending order of enrichment score) within the three categories are shown in Figures 6D–F.
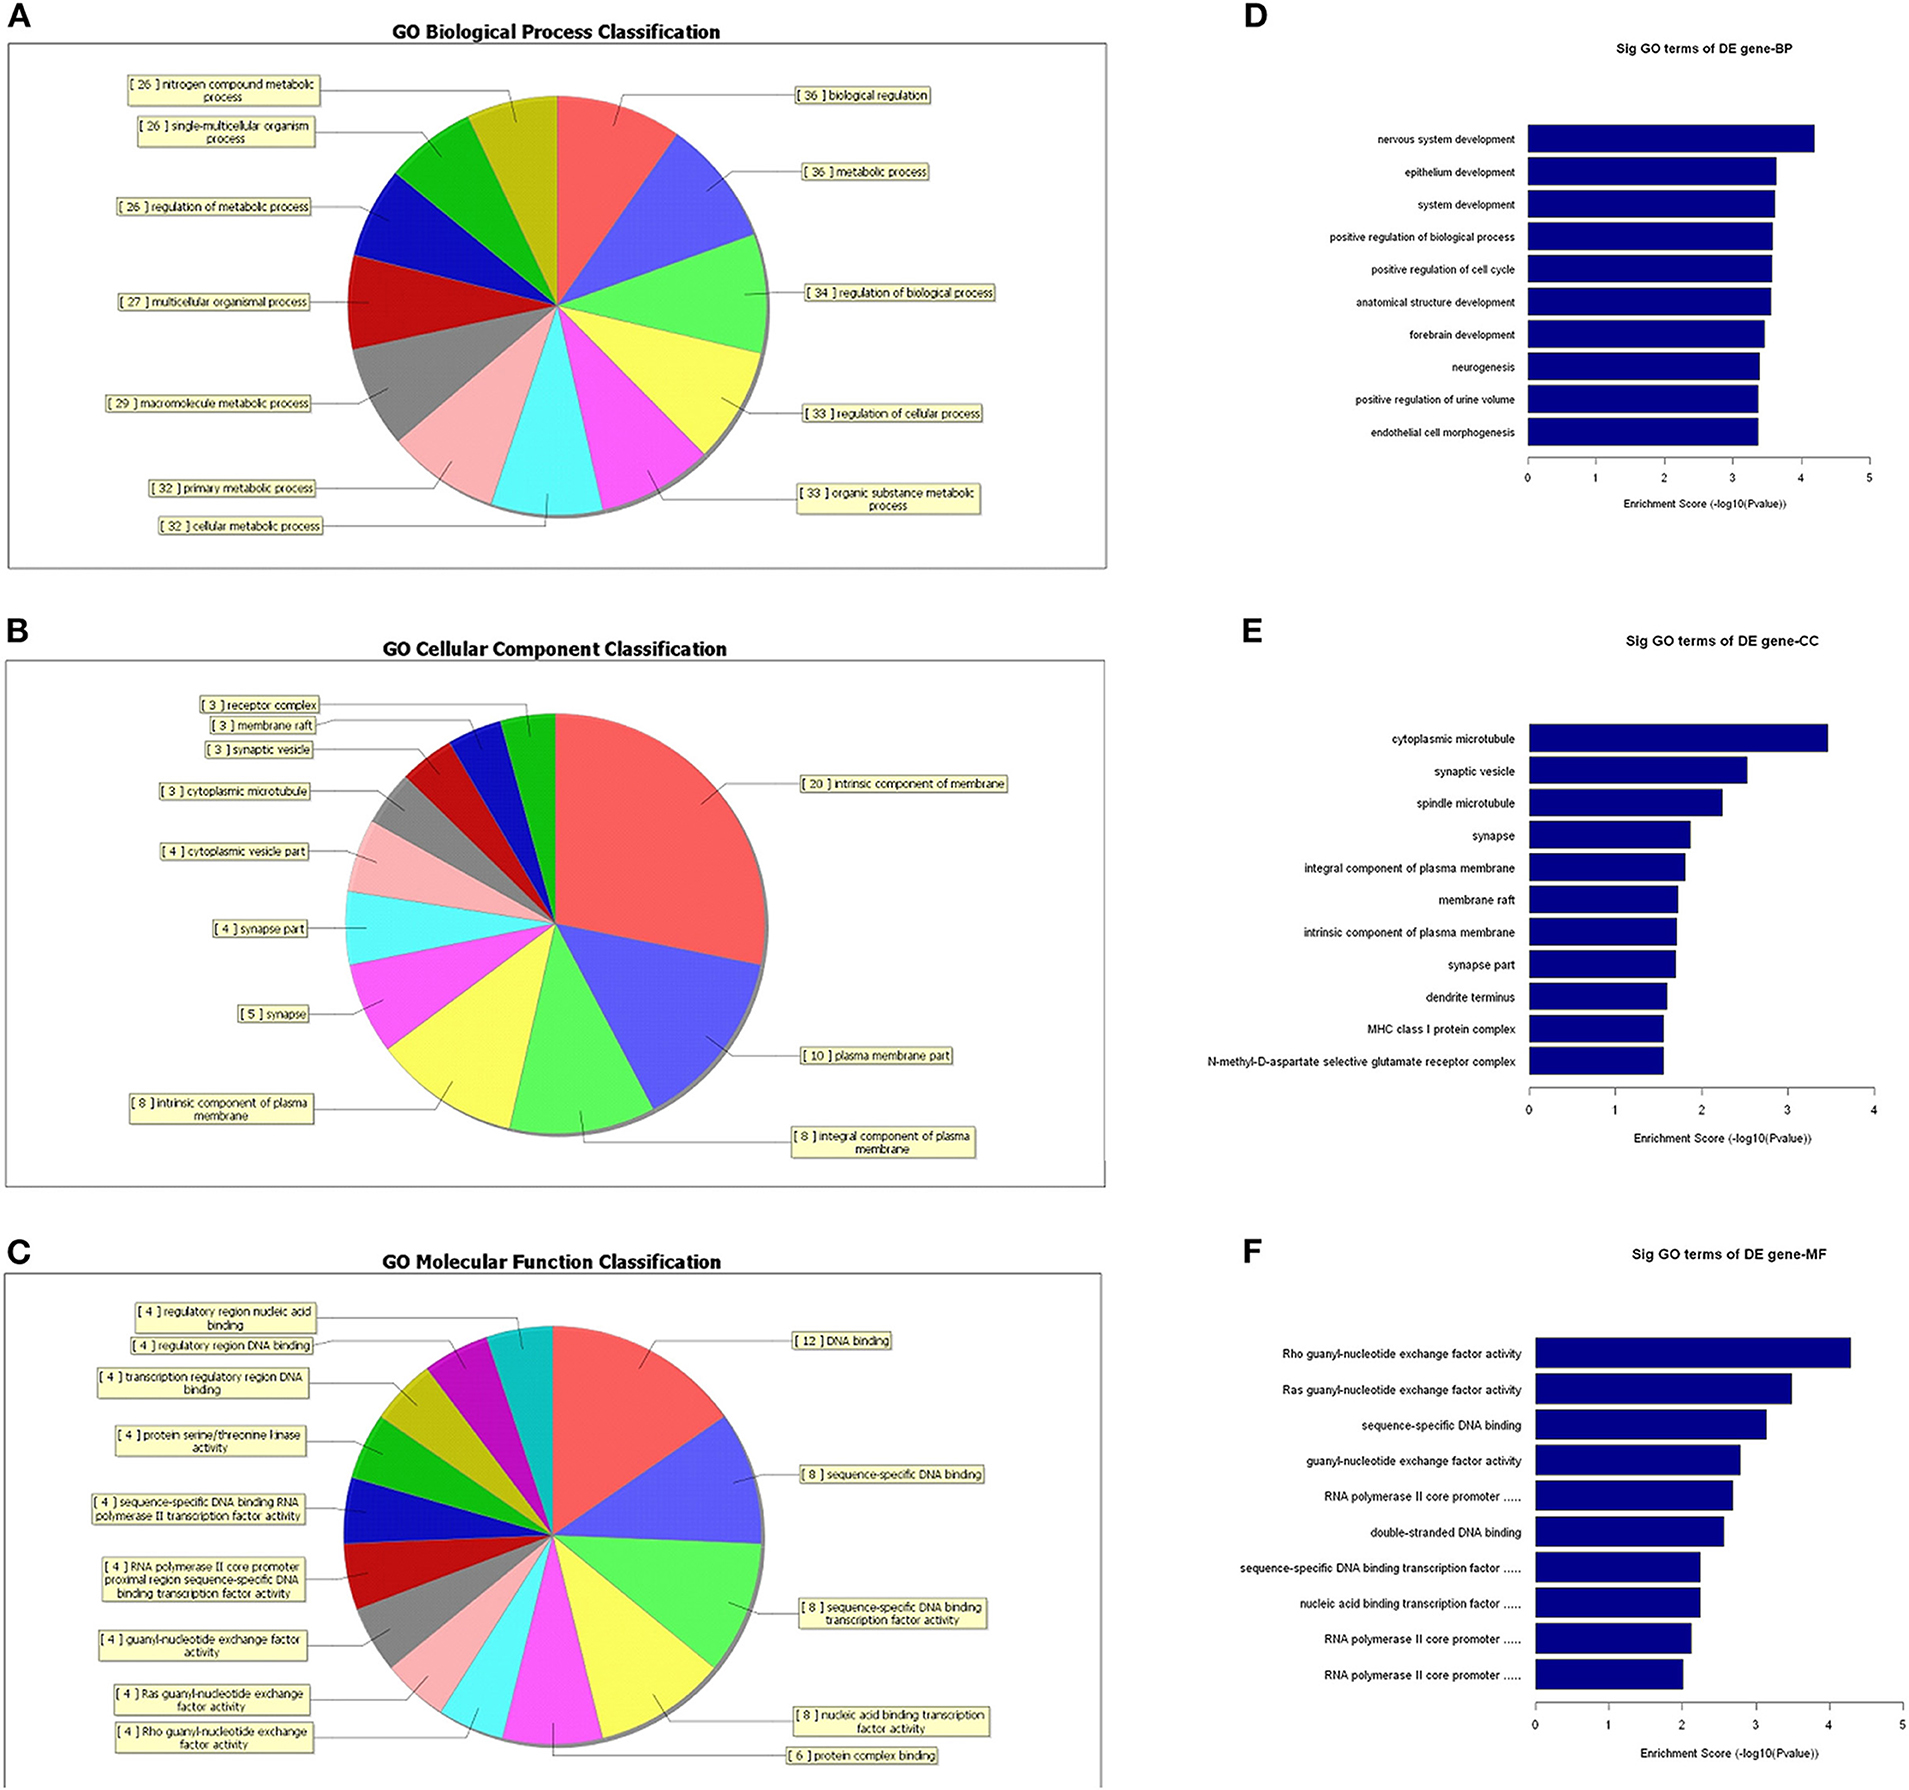
Figure 6. GO-enrichment analysis of differentially expressed lncRNAs. Each category (BP, CC, and MF) has its classifications and the lncRNAs associated with each category were counted and visualized as pie charts (A–C). The 10 most enriched GO terms (in descending order of enrichment score) in the three categories are shown (D–F).
Furthermore, KEGG pathway analysis demonstrated that the differentially expressed lncRNAs were significantly enriched in various important pathways. The dot plot in Figure 7A shows the eight highest enrichment scores (lowest log10 p-values) of the significant pathways (Figure 7A), and Figure 7B shows the regulatory roles of the lncRNAs involved in cancer pathways.
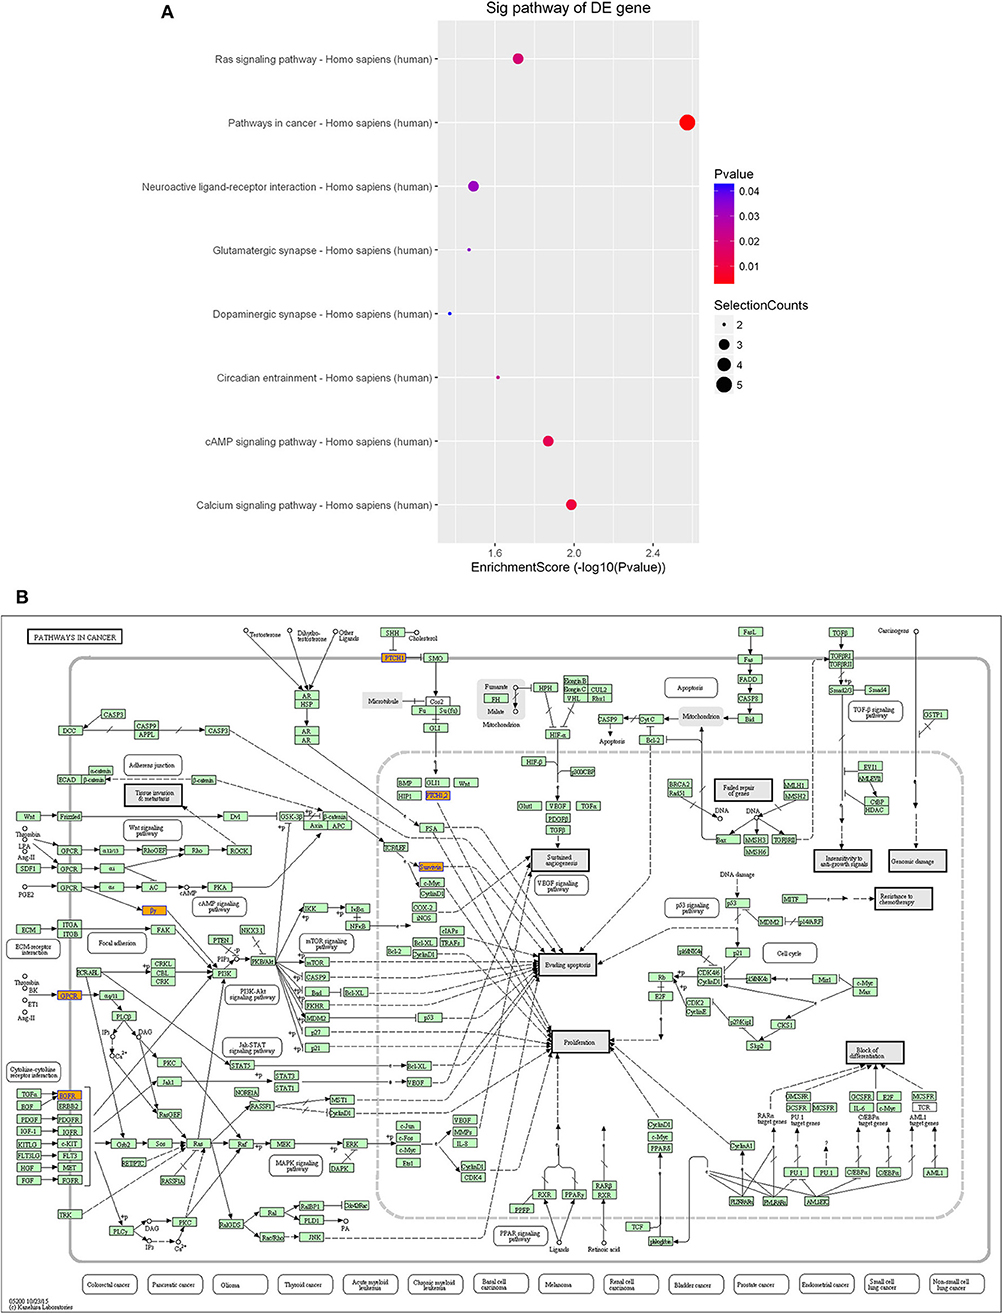
Figure 7. Pathway-enrichment analysis of differentially expressed lncRNAs. The dot plot shows the top-eight enrichment scores (–log10 p-value) of the significantly enriched pathways (A) and the regulatory roles of the lncRNAs involved in the pathways in cancer. (B) Nodes in orange are associated with up-regulated enriched genes, whereas green nodes denote genes that showed no statistical significance.
GO- and Pathway-Enrichment Analyses of Differentially Expressed mRNAs
Since the functions of the differentially expressed mRNAs are different from those of the lncRNAs, we conducted independent GO-enrichment and pathway-enrichment analyses for the mRNAs. Figure 8 shows the number of mRNAs associated with each GO term (Figures 8A–C), and the 10 most enriched GO terms (in descending order of enrichment score) in each of the three categories are shown in Figures 8D–F.
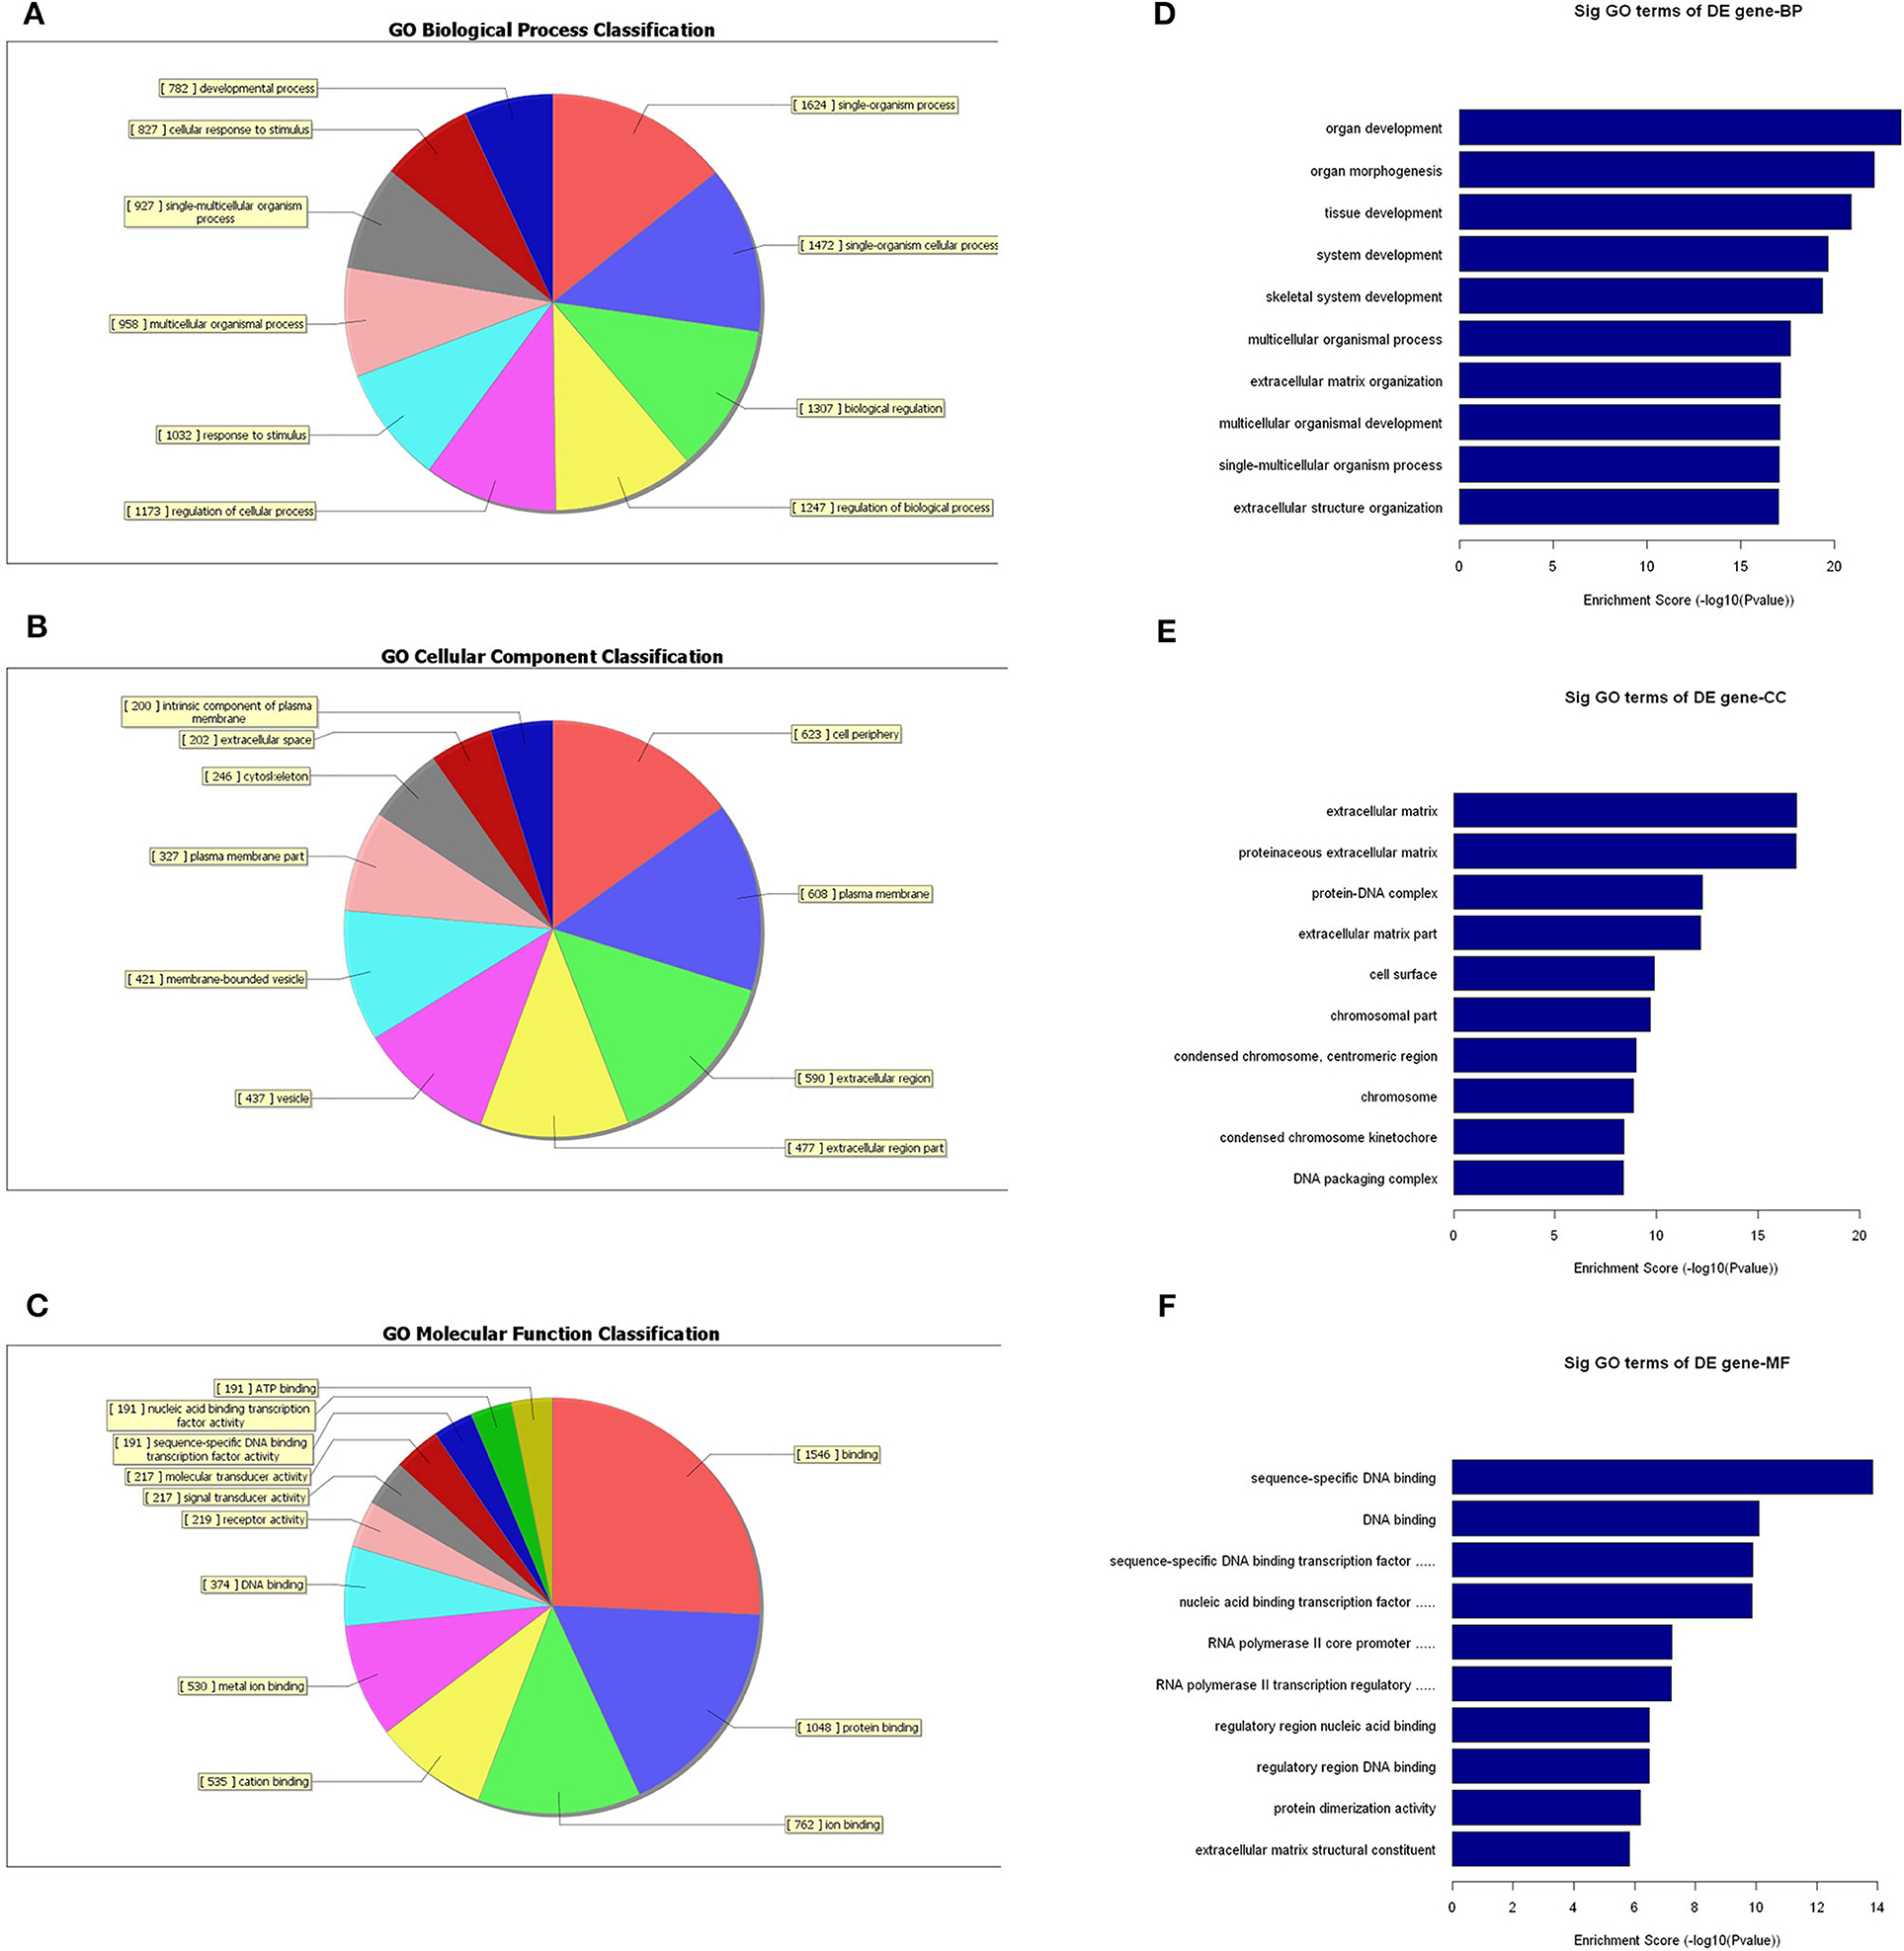
Figure 8. GO-enrichment analysis of differentially expressed mRNAs. Each GO category has many different related terms and the mRNAs associated with each term were counted and visualized as pie charts. (A–C) The 10 most enriched GO terms (in descending order of enrichment score) of the three categories are shown (D–F).
As observed with the lncRNAs, KEGG pathway analysis demonstrated that the differentially expressed mRNAs were significantly enriched in various important pathways. The dot plot shows the eight most significantly enriched pathways (enrichment score = –log10 p-value) (Figure 9A), and the regulatory roles of the mRNAs involved in systemic lupus erythematosus and the staphylococcus aureus infections are shown in Figure 9B.
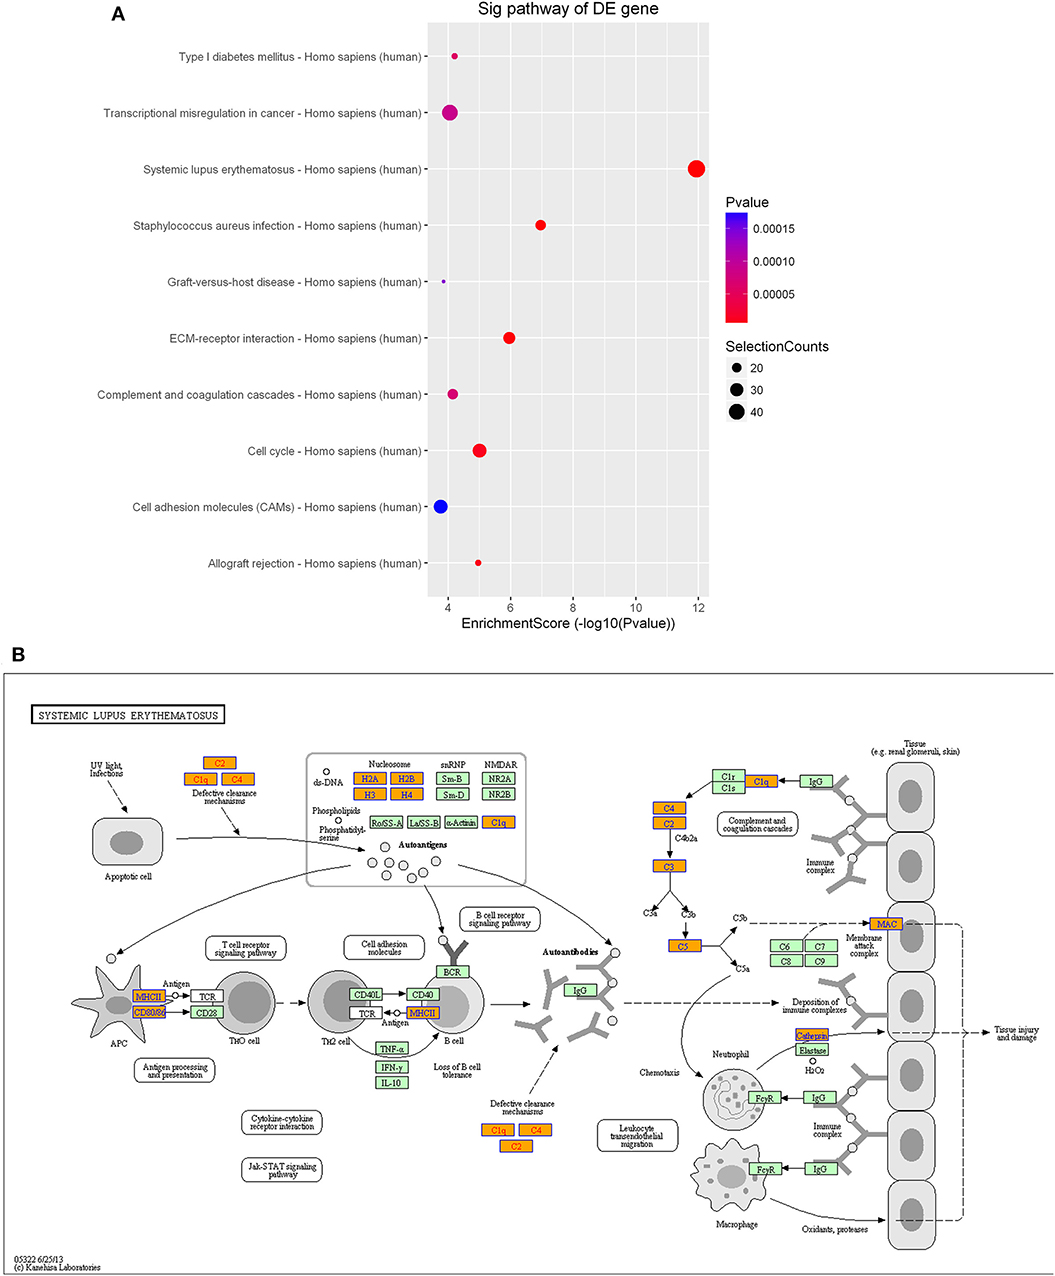
Figure 9. Pathway-enrichment analysis of differentially expressed mRNAs. The dot plot shows the top-ten enrichment scores (–log10 p-values) of the significantly enriched pathways (A) and the regulatory roles of the mRNAs involved in systemic lupus erythematosus. (B) Orange nodes are associated with up-regulated enriched genes, whereas green nodes denote genes that showed no statistical significance.
Validation of Sequencing Results by qRT-PCR
To validate the sequencing data and bioinformatic results, the five most differentially expressed lncRNAs (TCONS_l2_00004574, uc031tga.1, ENST00000412788, ENST00000608521, and uc022adp.1) and mRNAs (NPTX2, HIST2H3C, LAMB3, MMP10, and HIST1H1B) were selected for qRT-PCR. In agreement with our sequencing results, three of the five lncRNAs (TCONS_l2_00004574, uc031tga.1, and uc022adp.1) and four of the five mRNAs (NPTX2, HIST2H3C, MMP10, and HIST1H1B) were found to be differentially expressed in the glioma samples (P < 0.05; Figure 10).

Figure 10. Validation of sequencing results by qRT-PCR. Three of the five lncRNAs (TCONS_l2_00004574, uc031tga.1, and uc022adp.1) (A) and four of the five mRNAs (NPTX2, HIST2H3C, MMP10, and HIST1H1B) (B) were found to be differentially expressed in the glioma samples, which were in agreement with our sequencing results. *P < 0.05, **P < 0.01, ***P < 0.001.
Discussion
As new research techniques have developed, a growing number of high-throughput platforms have been used to analyze gene expression in glioma. However, previous studies mostly focused on mRNA, DNA, or protein levels in glioblastoma or high-grade glioma using proteomics or microarrays (24–26). In the present study, we assessed the significantly differentially expressed lncRNAs and mRNAs between normal tissues and glioma tissues using high-throughput sequencing. To our knowledge, this study is the first to identify the pathological grade-associated transcriptome profiles of lncRNAs and mRNAs in glioma. We identified 578 lncRNAs and 3,216 mRNAs that were significantly dysregulated in glioma tissues. Among these, 509 lncRNAs and 2,282 mRNAs were upregulated, whereas 69 lncRNAs and 934 mRNAs were downregulated (fold change ≥ 2, p < 0.05). This result indicated that these lncRNAs and mRNAs may be involved in glioma initiation and/or progression. However, further research is required to elucidate the detailed mechanisms of the involvement of these lncRNAs and mRNAs in glioma.
The lncRNAs and mRNAs that dynamically changed with differing degrees of glioma malignancy may play crucial biological roles in the disease process (27, 28). Through model-profile analysis, the dynamic expression profiles of lncRNAs and mRNAs were obtained, and the nine significant dynamic expression profiles of lncRNAs were then screened. The three profiles of clinical significance were profiles No. 1, No. 2, and No. 22. Each of these profiles contained a large number of lncRNAs that were consistently down- or up-regulated in the different grades of glioma tissues. In the most significant profile (No. 22), seven lncRNAs were identified to be involved in viral carcinogenesis. The lncRNAs with significant dynamic-expression changes may be more correlated with the malignancy of glioma and, hence, may play vital roles in the regulation of glioma initiation and progression.
To further discern the key lncRNAs associated with glioma, we integrated lncRNA and mRNA co-expression networks in profiles No. 1, No. 2, and No. 22. In total, 83 lncRNAs and 287 mRNAs were identified to play vital regulatory roles in model profile No. 22. Many studies have reported that a large number of lncRNAs, such as ZEB1-AS1 and PCNA-AS1 (29, 30) played important roles in the accurate and complicated co-expression networks. We screened a number of lncRNAs and mRNAs that included key genes that are closely associated with the pathogenesis of glioma. For example, SOX21 has been reported to be closely related to the tumorigenesis of glioblastoma, hepatocellular carcinoma, and colorectal cancer (31–33). This suggests that these co-expressed lncRNAs and mRNAs may participate in cancer-related pathways. It was also found that most lncRNAs can be co-expressed with various mRNAs, indicating that each lncRNA may regulate many mRNAs.
A growing number of lncRNAs have been identified in tumors (34, 35); however, the various functions of lncRNAs still remain poorly characterized. To infer the functional roles of the lncRNAs in glioma, GO and pathway analyses were performed for these differentially expressed lncRNAs. The GO analysis indicated that these lncRNAs are most significantly enriched in domains of “biological regulation,” “metabolic process,” and “regulation of biological process,” which are strongly associated with glioma. In addition, the pathway analysis revealed that “pathway in cancer,” “calcium signaling pathway,” “cAMP signaling pathway,” and “Ras signaling pathway” are related with the pathogenic process of glioma.
In addition, there were also some limitations of our present study. Regardless of the technology performed to detect expression levels and the sample sizes that are used, the actual gene expression levels vary among individuals because expression is a random process. Consequently, the analysis data may not be powerful enough to reflect these actual expression levels across individuals. However, biological variability will decrease with the increase of the scale of samples. Therefore, we will perform further studies with more samples in the future.
Conclusions
In summary, we characterized the expression profiles of lncRNAs and mRNAs in normal tissues and glioma tissues (WHO grades II–IV). Then, we analyzed the dynamic differentially expressed profiles of lncRNAs and mRNAs, which indicated their potential vital roles in gliomas with different degrees of malignancy. A series of bioinformatics analyses indicated that most of these lncRNAs and mRNAs are involved in important biological processes and pathways associated with the pathogenesis of glioma. These results provide potential directions and valuable resources for future studies via the comprehensive integration of these lncRNAs and mRNAs.
Data Availability Statement
The datasets generated for this study can be found in GenBank (SRA accession: PRJNA604108).
Ethics Statement
The studies involving human participants were reviewed and approved by the Ethics committee of Nantong University. The patients/participants provided their written informed consent to participate in this study.
Author Contributions
All authors listed have made a substantial, direct and intellectual contribution to the work, and approved it for publication.
Funding
This study was supported by grants from the Young Medical Talent Project in Jiangsu Province (Grant Number: QNRC2016691), the Natural Science Foundation of Jiangsu Province (Grant Number: BK20191203), and Jiangsu Province 333 Project (Grant Number: BRA2017233).
Conflict of Interest
The authors declare that the research was conducted in the absence of any commercial or financial relationships that could be construed as a potential conflict of interest.
Acknowledgments
The authors have no conflicts of interest to declare. We thank LetPub (www.letpub.com) for its linguistic assistance during the preparation of this manuscript.
References
1. Lapointe S, Perry A. Primary brain tumours in adults. Lancet. (2018) 392:432–46. doi: 10.1016/S0140-6736(18)30990-5
2. Ostrom QT, Gittleman H, Liao P, Vecchione-Koval T, Wolinsky Y, Kruchko C, et al. CBTRUS statistical report:primary brain and other central nervous system tumors diagnosed in the United States in 2010–2014. Neuro Oncol. (2017) 19:1–88. doi: 10.1093/neuonc/nox158
3. Louis DN, Ohgaki H, Wiestler OD, Cavenee WK. WHO Classification of Tumours of the Central Nervous System. 4th ed. Lyon: World Health Organization (2016).
4. Georgakis MK, Panagopoulou P, Papathoma P, Tragiannidis A, Ryzhov A, Zivkovic-Perisic S, et al. Central nervous system tumours among adolescents young adults (15–39 years) in Southern Eastern Europe:registration improvements reveal higher incidence rates compared to the US. Eur J Cancer. (2017) 86:46–58. doi: 10.1016/j.ejca.2017.08.030
5. Torre LA, Bray F, Siegel RL, Ferlay J, Lortet-Tieulent J, Jemal A. Global cancer statistics, 2012. CA Cancer J Clin. (2015) 65:87–108. doi: 10.3322/caac.21262
6. Rinn JL, Chang HY. Genome regulation by long noncoding RNAs. Annu Rev Biochem. (2012) 81:145–66. doi: 10.1146/annurev-biochem-051410-092902
7. Mercer TR, Dinger ME, Mattick JS. Long non-coding RNAs:insights into functions. Nat Rev Genet. (2009) 10:155–9. doi: 10.1038/nrg2521
8. Sun W, Yang Y, Xu C, Guo J. Regulatory mechanisms of long noncoding RNAs on gene expression in cancers. Cancer Genet. (2017) 216–7:105–10. doi: 10.1016/j.cancergen.2017.06.003
9. Batista PJ, Chang HY. Long noncoding RNAs:cellular address codes in development and disease. Cell. (2013) 152:1298–307. doi: 10.1016/j.cell.2013.02.012
10. Klingenberg M, Groß M, Goyal A, Polycarpou-Schwarz M, Miersch T, Ernst AS, et al. The lncRNA CASC9 and RNA binding protein HNRNPL form a complex and co-regulate genes linked to AKT signaling. Hepatology. (2018) 68:1817–32. doi: 10.1002/hep.30102
11. Cheetham SW, Gruhl F, Mattick JS, Dinger ME. Long noncoding RNAs and the genetics of cancer. Br J Cancer. (2013) 108:2419–25. doi: 10.1038/bjc.2013.233
12. Guttman M, Rinn JL. Modular regulatory principles of large non-coding RNAs. Nature. (2012) 482:339–46. doi: 10.1038/nature10887
13. Beltran AS, Graves LM, Blancafort P. Novel role of engrailed 1 as a prosurvival transcription factor in basal-like breast cancer and engineering of interference peptides block its oncogenic function. Oncogene. (2014) 33:4767–77. doi: 10.1038/onc.2013.422
14. Chen D, Sun Q, Cheng X, Zhang L, Song W, Zhou D, et al. Genome-wide analysis of long noncoding RNA (lncRNA) expression in colorectal cancer tissues from patients with liver metastasis. Cancer Med. (2016) 5:1629–39. doi: 10.1002/cam4.738
15. Ngoc PCT, Tan SH, Tan TK, Chan MM, Li Z, Yeoh AEJ, et al. Identification of novel lncRNAs regulated by the TAL1 complex in T-cell acute lymphoblastic leukemia. Leukemia. (2018) 32:2138–51. doi: 10.1038/s41375-018-0110-4
16. Arase M, Horiguchi K, Ehata S, Morkawa M, Tsutsumi S, Aburatani H, et al. Transforming growh factor-β-induced lncRNA-Smad7 inhibits apoptosis of mouse breast cancer JygMC(A) cells. Cancer Sci. (2014) 105:974–82. doi: 10.1111/cas.12454
17. Zhang M, Zhao K, Xu X, Yang Y, Yan S, Wei P, et al. A peptide encoded by circular form of LINC-PINT suppresses oncogenic transcriptional elongation in glioblastoma. Nat Commun. (2018) 9:4475. doi: 10.1038/s41467-018-06862-2
18. Bian EB, Li J, Xie YS, Zong G, Li J, Zhao B. LncRNAs:new players in gliomas, with special emphasis on the interaction of lncRNAs with EZH2. J Cell Physiol. (2015) 230:496–503. doi: 10.1002/jcp.24549
19. Zhang XQ, Leung GK. Long non-coding RNAs in glioma:functional roles and clinical perspectives. Neurochem Int. (2014) 77:78–85. doi: 10.1016/j.neuint.2014.05.008
20. Wang P, Ren Z, Sun P. Overexpression of the long non-coding RNA MEG3 impairs in vitro glioma cell proliferation. J Cell Biochem. (2012) 113:1868–74. doi: 10.1002/jcb.24055
21. Sun Y, Wang Z, Zhou D. Long non-coding RNAs as potential biomarkers and therapeutic targets for gliomas. Med Hypothesis. (2013) 81:319–21. doi: 10.1016/j.mehy.2013.04.010
22. Wang Q, Zhang J, Liu Y, Zhang W, Zhou J, Duan R, et al. A novel cell cycle-associated lncRNA, HOXA11-AS, is transcribed from the 5-prime end of the HOXA 11-AS, is transcribed from the 5-prime end of the HOXA transcript and is a biomarker of progression in glioma. Cancer Lett. (2016) 373:251–9. doi: 10.1016/j.canlet.2016.01.039
23. Han Y, Wu Z, Wu T, Huang Y, Cheng Z, Li X, et al. Tumor-suppressive function of long noncoding RNA MALAT1 in glioma cells by downregulation of MMP2 and inactivation of ERK/MAPK signaling. Cell Death Dis. (2016) 7:e2123. doi: 10.1038/cddis.2015.407
24. Xie C, Xu M, Lu D, Zhang W, Wang L, Wang H, et al. Candidate genes and microRNAs for glioma pathogenesis and prognosis based on gene expression profiles. Mol Med Rep. (2018) 18:2715–23. doi: 10.3892/mmr.2018.9231
25. Zhang BL, Dong FL, Guo TW, Gu XH, Huang LY, Gao DS. MiRNAs mediate GDNF-induced proliferation and migration of glioma cells. Cell Physiol Biochem. (2017) 44:1923–38. doi: 10.1159/000485883
26. Vastrad B, Vastrad C, Godavarthi A. Molecular mechanisms underlying gliomas and glioblastoma pathogenesis revealed by bioinformatics analysis of microarray data. Med Oncol. (2017) 34:182. doi: 10.1007/s12032-017-1043-x
27. Vastrad C. Bioinformatics analysis of gene expression profiles to diagnose crucial and novel genes in glioblastoma multiform. Pathol Res Pract. (2018) 214:1395–461. doi: 10.1016/j.prp.2018.07.015
28. Yuan Y, Jiaoming L, Xiang W, Yanhui L, Shu J, Maling G, et al. Analyzing the interactions of mRNAs, miRNAs, lncRNAs and circRNAs to predict competing endogenous RNA networks in glioblastoma. J Neurooncol. (2018) 137:493–502. doi: 10.1007/s11060-018-2757-0
29. Xu P, Yang J, Liu J, Yang X, Liao J, Yuan F, et al. Identification of glioblastoma gene prognosis modules based on weighted gene co-expression network analysis. BMC Med Genomics. (2018) 11:96. doi: 10.1186/s12920-018-0407-1
30. Wei C, Wang H, Xu F, Liu Z, Jiang R. LncRNA SOX21-AS1 is associated with progression of hepatocellular carcinoma and predicts prognosis through epigenetically silencing p21. Biomed Pharmacother. (2018) 104:137–44. doi: 10.1016/j.biopha.2018.05.010
31. Wei AW. Long non-coding RNA SOX21-AS1 sponges miR-145 to promote the tumorigenesis of colorectal cancer by targeting MYO6. Biomed Pharmacother. (2017) 96:953–9. doi: 10.1016/j.biopha.2017.11.145
32. Zhang E, He X, Zhang C, Su J, Lu X, Si X, et al. A novel long noncoding RNA HOXC-AS3 mediates tumorigenesis of gastric cancer by binding to YBX1. Genome Biol. (2018) 19:154. doi: 10.1186/s13059-018-1523-0
33. Kim J, Piao HL, Kim BJ, Yao F, Han Z, Wang Y, et al. Long noncoding RNA MALAT1 suppresses breast cancer metastasis. Nat Genet. (2018) 50:1705–15. doi: 10.1038/s41588-018-0252-3
34. Li T, Xie J, Shen C, Cheng D, Shi Y, Wu Z, et al. Upregulation of long noncoding RNA ZEB1-AS1 promotes tumor metastasis and predicts poor prognosis in hepatocellular carcinoma. Oncogene. (2016) 35:1575–84. doi: 10.1038/onc.2015.223
Keywords: glioma, mRNA, lncRNA, high-throughput sequencing, transcriptome
Citation: Sun J, Jiang R, Song M, Yao J, Hou S, Zhu Y, Ji X, Sheng H, Tang Z, Liu Q, Jia Z, Shi W and Shi J (2020) Pathological Grade-Associated Transcriptome Profiling of lncRNAs and mRNAs in Gliomas. Front. Oncol. 10:253. doi: 10.3389/fonc.2020.00253
Received: 21 August 2019; Accepted: 14 February 2020;
Published: 10 March 2020.
Edited by:
Liam Chen, Johns Hopkins University, United StatesReviewed by:
Pengfei Xu, Nanjing Medical University, ChinaAlireza Mansouri, Pennsylvania State University (PSU), United States
Copyright © 2020 Sun, Jiang, Song, Yao, Hou, Zhu, Ji, Sheng, Tang, Liu, Jia, Shi and Shi. This is an open-access article distributed under the terms of the Creative Commons Attribution License (CC BY). The use, distribution or reproduction in other forums is permitted, provided the original author(s) and the copyright owner(s) are credited and that the original publication in this journal is cited, in accordance with accepted academic practice. No use, distribution or reproduction is permitted which does not comply with these terms.
*Correspondence: Jinlong Shi, amlubG9uZy5zaGlAaG90bWFpbC5jb20=; Wei Shi, Znlzd0BudHUuZWR1LmNu
†These authors have contributed equally to this work
 Junlong Sun1,2,3†
 Jinlong Shi