 Nicolas Borisov1*
 Anton Buzdin1,2,3
- 1Department of Personalized Medicine, I.M. Sechenov First Moscow State Medical University (Sechenov University), Moscow, Russia
- 2Department of Genomics and Postgenomic Technologies, Shemyakin-Ovchinnikov Institute of Bioorganic Chemistry, Moscow, Russia
- 3Department of Bioinformatics and Molecular Networks, OmicsWay Corporation, Walnut, CA, United States
Introduction
Personalized medicine has a huge potential of transforming healthcare standards when selection of therapies according to standard guidelines often fails, which can be the case in oncology (1, 2), endocrinology (3, 4), neurology (3), treatment of infectious diseases (5, 6) and hemostatic disorders (7, 8). Nowadays, personalized approach can be based on a solid fundament of big biomedical data obtained for an individual patient, analyzed vs. comparable datasets for other individual cases with known clinical outcome. This can help, for example, developing new criteria for predicting response of a cancer patient to a certain treatment.
The analysis of Big Data in oncology can benefit significantly from being empowered by machine learning (ML) techniques (9–13) tailored for solving this “P vs. N” problem. ML is usually defined as the study of algorithmically-built mathematical models that have been fitted for the portion of data called the training dataset, to make predictions for the similarly-obtained and similarly structured data called the test or validation dataset. Major principles of ML have been formulated more than half a century ago and transformed methodology in many areas such as engineering, physics, banking, defense, agriculture, and meteorology (11, 14). Efficiencies of ML-based predictor/classifier models are described by specific quality metrics such as sensitivity (Sn), specificity (Sp), area under ROC curve (AUC), accuracy rate (ACC), Matthews correlation coefficient (MCC), or by p-values from statistical tests distinguishing one class from another (15).
However, it was only in the beginning of XXI century when such ML on Big Data became possible in biomedicine, still not having a groundbreaking effect (16). This delay is most probably due to relatively recent emergence of experimental methods generating big biomedical data connected with the sufficiently developed IT infrastructure. Among those game-changing experimental methods the major role was played by next-generation sequencing (NGS) and novel mass-spectrometry approaches which enabled performing whole genome-, transcriptome-, proteome-, and metabolome analyses relatively fast and cheap (17–19), see Figure 1A. This allowed to feed ML methods with big biomedical data thus generating beneficial outputs, also in the field of clinical medicine. For example, over 150 scientific papers have been indexed in the PubMed repository during last 24 months mentioning machine learning and drug sensitivity1.
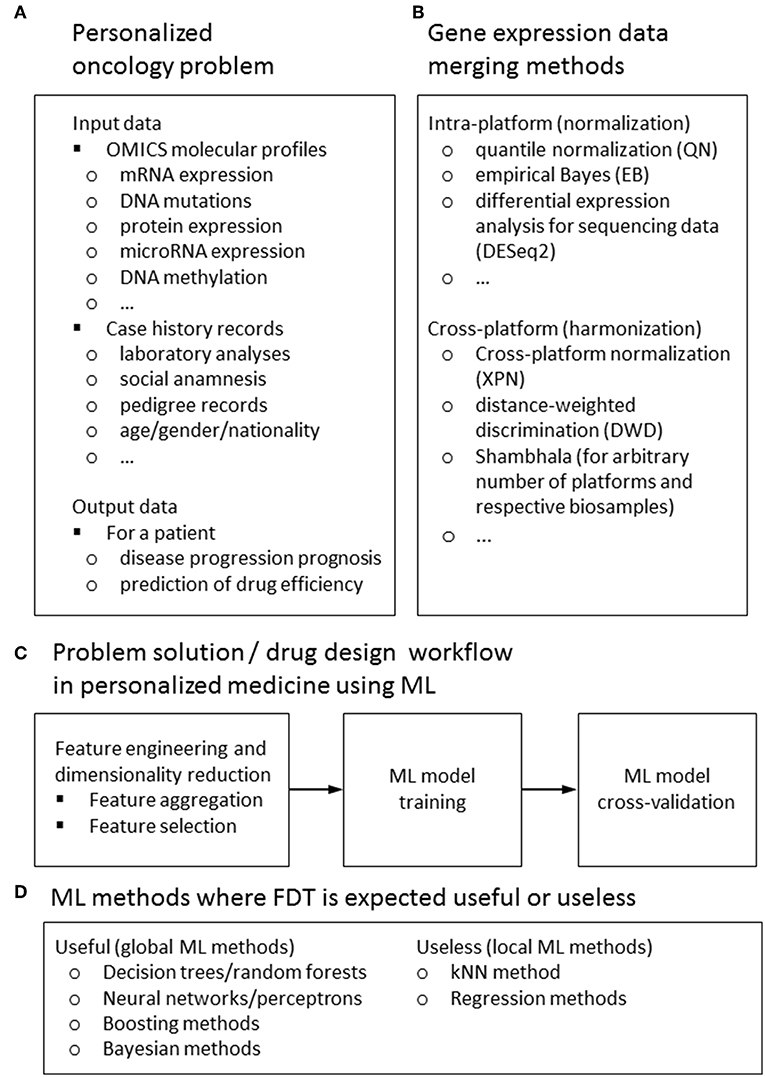
Figure 1. Input and output data types (A) methods for feature harmonization (B) general workflow (C) for a ML-assisted solution of typical problem in personalized medicine; ML methods for those FDT is expected to be useful or useless (D).
Here we will focus on applying ML for personalized medicine, primarily oncology, dealing with attempts to generate as much as possible treatment response biomarkers from mediocre datasets. From the point of view of classical ML approaches, most if not all of the available clinical genetic datasets are insufficient for solving the task of differentiating, e.g., treatment responders from non-responders (9, 20). Numbers of features measured by NGS (e.g., mutations or gene expression values) are far greater than numbers of individual patients with traced clinical outcomes involved in each respective dataset. To generate statistically significant predictions, this requires extensive reduction of a pool of features to be considered, to make their number not exceeding the number of individuals analyzed (16). To increase the number of individuals, the datasets can be merged using cross-dataset harmonization. Different methods can be used to harmonize data obtained using the same (21, 22) or different experimental platforms (23, 24), or even using multiple platforms (25) (Figure 1).
ML Input Data and Workflow
For ML applications dealing with prediction of patient's individual response(s) on drugs and different treatment regimens, two types of data are most frequently used (Figure 1A):
1. Various multi-omics data, i.e., mRNA, microRNA, and protein expression levels, mutations in genomic DNA and epigenetic profiles (primarily DNA methylation) (26, 27). These data may be compared with the analogous types of data obtained on cell cultures in relation to sensitivity to therapeutics/treatment regimens, such as the data taken from the Broad Institute (28) and CancerRxGene (29) projects. These examples include, respectively, either changes of gene expression profiles influenced by the addition of drugs to cell culturing media, or gene expression and polymorphism/mutation profiles for many cell lines linked with their measured sensitivities to cancer drugs (30). These datasets are regarded plausible models for training ML drug sensitivity classifiers because they have thousands of individual “cases”—pairs cell culture/drug, each profiled in several replicates.
2. Alternatively, other types of data can be used including gender, age, results of clinical laboratory tests, functional diagnostics data (ECG, EEG etc.), risk factors, social anamnesis, and other electronic health records.
A typical workflow of ML drug sensitivity assay includes the following steps (Figure 1C):
1. Data reduction, feature selection, and building on the training dataset. Usually, in the collected raw data, the number of features (NF) exceeds the number of cases (NC), so that to provide a robust ML model, one must reduce the data to make the number of selected features (NS) lower than NC or at least comparable to it. This goal can be achieved in several ways. The raw data may be aggregated, e.g., in molecular pathways (2); or co-expressed/co-mutated clusters (31). Sometimes, the co-expression- and pathway topology-based analysis may be combined (32).Alternatively, they can be filtered according to specific functional of statistical traits (e.g., only the genes coding for tyrosine kinases are left; or genes with the highest abilities to discriminate responders from non-responders in training datasets) (33). The statistical methods for feature selection may include Pearson chi-squared test (34) or correlation test (34, 35). Other options are variance thresholding (VT), genetic algorithms (36), univariate feature selection (UFE), recursive feature elimination (RFE), principal component analysis (PCA) (35), CUR matrix (37) decomposition (27) and covariate regression (38).
2. Applying ML algorithm. The following methods may be used: support vector machines, SVM (2, 27, 39), k nearest neighbors, kNN (39), decision trees, DT (34, 39) or random forest, RF (39, 40). Alternatively, one can use artificial neural network, ANV (39), elastic net (41), back propagation networks (42), naïve Bayesian (27), logistic (27, 39), penalized (43), and lasso (43) regression models. In some cases, the hybrid global-local approaches, like combination of decision trees, random forests/SVM with kNN are used (2, 33, 39, 44, 45).
3. Cross-validation and performance quality check. The data obtained with the training dataset are then validated using independent validation dataset. For the cross-validation of machine learning methods, 5- or 10-fold cross validations are most commonly used. For datasets with smaller number of preceding cases (NC) the leave-one-out (LOO) scheme is preferable (2, 33, 43).
Shifting the Paradigm
The demonstrated performance of ML classifiers was high for problems like age recognition based on biochemical markers (41), but significantly lower for predictions of drug response in cancer patients (27, 46), with the exception of few reports based on very small patient cohorts (43).
A new paradigm recently emerged of considering flexible rather than fixed sets of features that are fitted individually for every comparison of a biosample with the pool of controls/training datasets (33). This can be done by means of data trimming2—sample-specific removal of features. The irrelevant features in a sample that don't have significant number of neighboring hits in the training dataset are removed from further analyses. In a pilot application for the SVM method of ML and high throughput gene expression data, this enabled to dramatically increase number and quality of biomarkers predicting responses to chemotherapy treatments for 10/10 cohorts of 46–235 cancer patients (33). Among them, in 3/10 cases basic ML applications were impossible to generate biomarkers of a sufficient quality.
The application of flexible data trimming (FDT) procedure prevents ML classifier from extrapolation by excluding non-informative features. Contrary to other complex data transfer techniques, this approach is heuristic, based on a common geometrical sense. For each point of a validation dataset, it takes into account only the proximal points of the training dataset. Thus, for every point of a validation dataset, the training dataset is adjusted to form a floating window. That was why we called (33) our FDT method FLOating Window Projective Separator (FloWPS).
Discussion
Certainly, FloWPS is not the only possible method of data reduction for ML in oncology. In the pilot study, a simple PCA-based alternative was tried, which was less successful (33).
One of the major limitations of FloWPS is that it can be time-consuming at the level of optimization of data trimming parameters. The required computational time for such optimization grows cubically with the number of preceding cases in the training dataset. For example, for a 31 Gb RAM and 8·4.20 GHz CPUs computer running the Python FloWPS code for a dataset of 46 samples (33) takes ~20 s, whereas for a bigger dataset of 235 samples (33) it requires already few hours.
SVM is one of the most popular methods of ML nowadays (9, 48). However, using data trimming procedure has dramatically improved its performance for the task of classification cancer drug responders and non-responders. This means that it can be highly beneficial for the other ML methods as well. The FDT method simultaneously combines the advantages of both global (like SVM) and local (like kNN) methods of ML, and successfully acts even when purely local and global approaches fail. Due to its hybrid (global + local) nature, we expect that FloWPS may be also effective for other global ML methods such as decision trees/random forests, neural networks/multi-layer perceptrons, decision trees/random forests and boosting or Bayesian methods for ML, but may be useless for purely local approaches such as kNN or regression models (Figure 1D).
In its first published application, the data trimming could operate with high throughput gene expression or mutation profiles (33). However, it can be used for any type of Big Data in biomedicine, but not only. In this opinion paper, we speculate that this new concept has a potential to broadly introduce the use of ML in personalized oncology and, possibly, significantly expand its presence in many other fields.
Availability of Code
The R package flowpspkg.tar.gz for FloWPS method and README manual are available at GitLab through the link: https://gitlab.com/borisov_oncobox/flowpspkg.
Author Contributions
All authors listed have made a substantial, direct and intellectual contribution to the work, and approved it for publication.
Funding
This publication was supported by the Russian Science Foundation grant no. 18-15-00061.
Conflict of Interest Statement
The authors declare that the research was conducted in the absence of any commercial or financial relationships that could be construed as a potential conflict of interest.
Acknowledgments
The authors wish to acknowledge Victor Tkachev (Omicsway Corp.) for insightful discussion on perspectives of ML for biomedicine and Constantin Borisov (National Research University—Higher School of Economics, Moscow, Russia) for preparing the code for R package flowpspkg.tar.gz.
Footnotes
1. ^This is the result of a PubMed query: https://www.ncbi.nlm.nih.gov/pubmed/?term=machine+learning+drug+sensitivity
2. ^Data trimming is the process of removing or excluding extreme values, or outliers, from a dataset (47).
References
1. Artemov A, Aliper A, Korzinkin M, Lezhnina K, Jellen L, Zhukov N, et al. A method for predicting target drug efficiency in cancer based on the analysis of signaling pathway activation. Oncotarget. (2015) 6:29347–56. doi: 10.18632/oncotarget.5119
2. Borisov N, Tkachev V, Suntsova M, Kovalchuk O, Zhavoronkov A, Muchnik I, et al. A method of gene expression data transfer from cell lines to cancer patients for machine-learning prediction of drug efficiency. Cell Cycle. (2018) 17:486–91. doi: 10.1080/15384101.2017.1417706
3. Hokama M, Oka S, Leon J, Ninomiya T, Honda H, Sasaki K, et al. Altered expression of diabetes-related genes in Alzheimer's disease brains: the Hisayama study. Cereb Cortex. (2014) 24:2476–88. doi: 10.1093/cercor/bht101
4. Kaizer EC, Glaser CL, Chaussabel D, Banchereau J, Pascual V, White PC. Gene expression in peripheral blood mononuclear cells from children with diabetes. J Clin Endocrinol Metab. (2007) 92:3705–11. doi: 10.1210/jc.2007-0979
5. De Maio F, Squeglia F, Goletti D, Delogu G. The mycobacterial HBHA protein: a promising biomarker for tuberculosis. Curr Med Chem. (2019) 26:2051–60. doi: 10.2174/0929867325666181029165805
6. Sanchez-Schmitz G, Stevens CR, Bettencourt IA, Flynn PJ, Schmitz-Abe K, Metser G, et al. Microphysiologic human tissue constructs reproduce autologous age-specific BCG and HBV primary immunization in vitro. Front Immunol. (2018) 9:2634. doi: 10.3389/fimmu.2018.02634
7. Lewis DA, Stashenko GJ, Akay OM, Price LI, Owzar K, Ginsburg GS, et al. Whole blood gene expression analyses in patients with single versus recurrent venous thromboembolism. Thromb Res. (2011) 128:536–40. doi: 10.1016/j.thromres.2011.06.003
8. Lewis DA, Suchindran S, Beckman MG, Hooper WC, Grant AM, Heit JA, et al. Whole blood gene expression profiles distinguish clinical phenotypes of venous thromboembolism. Thromb Res. (2015) 135:659–65. doi: 10.1016/j.thromres.2015.02.003
9. Bartlett P, Shawe-Taylor J. Generalization performance of support vector machines and other pattern classifiers. In: Bernhard S, Christopher JCB, Alexander JS, editors. Advances in Kernel Methods: Support Vector Learning. Cambridge, MA: MIT Press (1999). p. 43–54.
10. Minsky ML, Papert SA. Perceptrons - Expanded Edition: An Introduction to Computational Geometry. Boston, MA: MIT press Boston (1987).
12. Tikhonov AN, Arsenin VI. Solutions of Ill-posed Problems. Washington, DC; New York, NY; Winston; distributed solely by Halsted Press (1977).
13. Toloşi L, Lengauer T. Classification with correlated features: unreliability of feature ranking and solutions. Bioinformatics. (2011) 27:1986–94. doi: 10.1093/bioinformatics/btr300
14. Rozonoer L, Mirkin B, Muchnik I eds. Braverman readings in machine learning. In: Key Ideas from Inception to Current State: International Conference Commemorating the 40th Anniversary of Emmanuil Braverman's Decease, Boston, MA Invited Talks. Cham: Springer International Publishing (2018).
15. Chicco D. Ten quick tips for machine learning in computational biology. BioData Min. (2017) 10:35. doi: 10.1186/s13040-017-0155-3
16. Robin X, Turck N, Hainard A, Lisacek F, Sanchez J-C, Müller M. Bioinformatics for protein biomarker panel classification: what is needed to bring biomarker panels into in vitro diagnostics? Expert Rev Proteomics. (2009) 6:675–89. doi: 10.1586/epr.09.83
17. Chu Y, Corey DR. RNA sequencing: platform selection, experimental design, and data interpretation. Nucleic Acid Ther. (2012) 22:271–4. doi: 10.1089/nat.2012.0367
18. Cox J, Mann M. Quantitative, high-resolution proteomics for data-driven systems biology. Ann Rev Biochem. (2011) 80:273–99. doi: 10.1146/annurev-biochem-061308-093216
19. Pettersson E, Lundeberg J, Ahmadian A. Generations of sequencing technologies. Genomics. (2009) 93:105–11. doi: 10.1016/j.ygeno.2008.10.003
20. Bishop CM. Pattern Recognition and Machine Learning. Corrected at 8th printing 2009. New York, NY: Springer (2009).
21. Love MI, Huber W, Anders S. Moderated estimation of fold change and dispersion for RNA-seq data with DESeq2. Genome Biol. (2014) 15:550. doi: 10.1186/s13059-014-0550-8
22. Bolstad BM, Irizarry RA, Astrand M, Speed TP. A comparison of normalization methods for high density oligonucleotide array data based on variance and bias. Bioinformatics. (2003) 19:185–93. doi: 10.1093/bioinformatics/19.2.185
23. Huang H, Lu X, Liu Y, Haaland P, Marron JS. R/DWD: distance-weighted discrimination for classification, visualization and batch adjustment. Bioinformatics. (2012) 28:1182–3. doi: 10.1093/bioinformatics/bts096
24. Shabalin AA, Tjelmeland H, Fan C, Perou CM, Nobel AB. Merging two gene-expression studies via cross-platform normalization. Bioinformatics. (2008) 24:1154–60. doi: 10.1093/bioinformatics/btn083
25. Borisov N, Shabalina I, Tkachev V, Sorokin M, Garazha A, Pulin A, et al. Shambhala: a platform-agnostic data harmonizer for gene expression data. BMC Bioinformatics. (2019) 20:66. doi: 10.1186/s12859-019-2641-8
26. Buzdin A, Sorokin M, Garazha A, Sekacheva M, Kim E, Zhukov N, et al. Molecular pathway activation - new type of biomarkers for tumor morphology and personalized selection of target drugs. Semin Cancer Biol. (2018) 53:110–24. doi: 10.1016/j.semcancer.2018.06.003
27. Turki T, Wei Z. Learning approaches to improve prediction of drug sensitivity in breast cancer patients. In: 2016 38th Annual International Conference of the IEEE Engineering in Medicine and Biology Society (EMBC). Orlando, FL: IEEE (2016). p. 3314–20.
28. Barretina J, Caponigro G, Stransky N, Venkatesan K, Margolin AA, Kim S, et al. The cancer cell line encyclopedia enables predictive modelling of anticancer drug sensitivity. Nature. (2012) 483:603–7. doi: 10.1038/nature11003
29. Yang W, Soares J, Greninger P, Edelman EJ, Lightfoot H, Forbes S, et al. Genomics of Drug Sensitivity in Cancer (GDSC): a resource for therapeutic biomarker discovery in cancer cells. Nucleic Acids Res. (2013) 41:D955–61. doi: 10.1093/nar/gks1111
30. Venkova L, Aliper A, Suntsova M, Kholodenko R, Shepelin D, Borisov N, et al. Combinatorial high-throughput experimental and bioinformatic approach identifies molecular pathways linked with the sensitivity to anticancer target drugs. Oncotarget. (2015) 6:27227–38. doi: 10.18632/oncotarget.4507
31. Tarca A, Draghici S, Bhatti G, Romero R. Down-weighting overlapping genes improves gene set analysis. BMC Bioinformatics. (2012) 13:136. doi: 10.1186/1471-2105-13-136
32. Ozerov IV, Lezhnina KV, Izumchenko E, Artemov AV, Medintsev S, Vanhaelen Q, et al. In silico pathway activation network decomposition analysis (iPANDA) as a method for biomarker development. Nat Commun. (2016) 7:13427. doi: 10.1038/ncomms13427
33. Tkachev V, Sorokin M, Mescheryakov A, Simonov A, Garazha A, Buzdin A, et al. FLOating-window projective separator (FloWPS): a data trimming tool for support vector machines (SVM) to improve robustness of the classifier. Front Genetics. (2019) 9:717. doi: 10.3389/fgene.2018.00717
34. Cho H-J, Lee S, Ji YG, Lee DH. Association of specific gene mutations derived from machine learning with survival in lung adenocarcinoma. PLoS ONE. (2018) 13:e0207204. doi: 10.1371/journal.pone.0207204
35. Wang Z, Yang H, Wu Z, Wang T, Li W, Tang Y, et al. In silico prediction of blood-brain barrier permeability of compounds by machine learning and resampling methods. ChemMedChem. (2018) 13:2189–201. doi: 10.1002/cmdc.201800533
36. Soufan O, Kleftogiannis D, Kalnis P, Bajic VB. DWFS: a wrapper feature selection tool based on a parallel genetic algorithm. PLoS ONE. (2015) 10:e0117988. doi: 10.1371/journal.pone.0117988
37. Mahoney MW, Drineas P. CUR matrix decompositions for improved data analysis. Proc Natl Acad Sci USA. (2009) 106:697–702. doi: 10.1073/pnas.0803205106
38. Menden MP, Casale FP, Stephan J, Bignell GR, Iorio F, McDermott U, et al. The germline genetic component of drug sensitivity in cancer cell lines. Nat Commu. (2018) 9:3385. doi: 10.1038/s41467-018-05811-3
39. Yosipof A, Guedes RC, García-Sosa AT. Data mining and machine learning models for predicting drug likeness and their disease or organ category. Front Chem. (2018) 6:162. doi: 10.3389/fchem.2018.00162
40. Mamoshina P, Kochetov K, Putin E, Cortese F, Aliper A, Lee W-S, et al. Population specific biomarkers of human aging: a big data study using South Korean, Canadian and Eastern European patient populations. J Gerontol Series A Biol. Sci. Med. Sci. (2018) 73:1482–90. doi: 10.1093/gerona/gly005
41. Mamoshina P, Volosnikova M, Ozerov IV, Putin E, Skibina E, Cortese F, et al. Machine learning on human muscle transcriptomic data for biomarker discovery and tissue-specific drug target identification. Front. Genet. (2018) 9:242. doi: 10.3389/fgene.2018.00242
42. Zhang L, Zhang H, Ai H, Hu H, Li S, Zhao J, et al. Applications of machine learning methods in drug toxicity prediction. Curr Top Med Chem. (2018) 18:987–97. doi: 10.2174/1568026618666180727152557
43. Kim YR, Kim D, Kim SY. Prediction of acquired taxane resistance using a personalized pathway-based machine learning method. Cancer Res Treat. (2018) 51:672–84. doi: 10.4143/crt.2018.137
44. Borisov N, Tkachev V, Muchnik I, Buzdin A. Individual drug treatment prediction in oncology based on machine learning using cell culture gene expression data. In: Proceedings of the 2017 International Conference on Computational Biology and Bioinformatics. Newark, NJ: ACM Press (2017). pp. 1–6.
45. Borisov N, Tkachev V, Buzdin A, Muchnik I. Prediction of drug efficiency by transferring gene expression data from cell lines to cancer patients. In: Rozonoer L. Mirkin B, Muchnik I, editors Braverman Readings in Machine Learning. Key Ideas from Inception to Current State, Cham: Springer International Publishing (2018). pp. 201–12.
46. Mulligan G, Mitsiades C, Bryant B, Zhan F, Chng WJ, Roels S, et al. Gene expression profiling and correlation with outcome in clinical trials of the proteasome inhibitor bortezomib. Blood. (2007) 109:3177–88. doi: 10.1182/blood-2006-09-044974
Keywords: bioinformatics, personalized medicine, oncology, P vs. N problem, machine learning
Citation: Borisov N and Buzdin A (2019) New Paradigm of Machine Learning (ML) in Personalized Oncology: Data Trimming for Squeezing More Biomarkers From Clinical Datasets. Front. Oncol. 9:658. doi: 10.3389/fonc.2019.00658
Received: 22 May 2019; Accepted: 05 July 2019;
Published: 17 July 2019.
Edited by:
Steven M. Lipkin, Weill Cornell Medicine, Cornell University, United StatesReviewed by:
Shicheng Guo, Marshfield Clinic Research Institute, United StatesParvin Mehdipour, Tehran University of Medical Sciences, Iran
Michele Milella, University of Verona, Italy
Copyright © 2019 Borisov and Buzdin. This is an open-access article distributed under the terms of the Creative Commons Attribution License (CC BY). The use, distribution or reproduction in other forums is permitted, provided the original author(s) and the copyright owner(s) are credited and that the original publication in this journal is cited, in accordance with accepted academic practice. No use, distribution or reproduction is permitted which does not comply with these terms.
*Correspondence: Nicolas Borisov, Ym9yaXNvdkBvbmNvYm94LmNvbQ==