
94% of researchers rate our articles as excellent or good
Learn more about the work of our research integrity team to safeguard the quality of each article we publish.
Find out more
ORIGINAL RESEARCH article
Front. Oncol., 19 July 2019
Sec. Cancer Molecular Targets and Therapeutics
Volume 9 - 2019 | https://doi.org/10.3389/fonc.2019.00640
 Tej H. Patel1†
 Lucas Norman1†
 Steven Chang1
 Sina Abedi1Catherine Liu1,2Marilyn Chwa1Shari R. Atilano1Kunal Thaker1Stephanie Lu1,3
 S. Michal Jazwinski4
 Michael V. Miceli4Nitin Udar1Daniela Bota5
 M. Cristina Kenney1,6*
Background: Cisplatin, a powerful antitumor agent, causes formation of DNA adducts, and activation of apoptotic pathways. Presently, cisplatin resistance develops in up to 70% of patients but the underlying molecular mechanism(s) are unclear and there are no markers to determine which patients will become resistant. Mitochondria play a significant role not only in energy metabolism but also retrograde signaling (mitochondria to nucleus) that modulates inflammation, complement, and apoptosis pathways. Maternally inherited mitochondrial (mt) DNA can be classified into haplogroups representing different ethnic populations that have diverse susceptibilities to diseases and medications.
Methods: Transmitochondrial cybrids, where all cell lines possess identical nuclear genomes but either the H (Southern European) or J (Northern European) mtDNA haplogroups, were treated with cisplatin and analyzed for differential responses related to viability, oxidative stress, and expression levels of genes associated with cancer, cisplatin-induced nephrotoxicity and resistance, apoptosis and signaling pathways.
Results: The cisplatin-treated-J cybrids showed greater loss of cell viability along with lower levels of reactive oxygen species and mitochondrial membrane potential compared to cisplatin-treated-H cybrids. After cisplatin treatment, J cybrids showed increased gene expression of BAX, CASP3, and CYP51A, but lower levels of SFRP1 compared to untreated-J cybrids. The cisplatin-treated-H cybrids had elevated expression of CDKN1A/P21, which has a role in cisplatin toxicity, compared to untreated-H cybrids. The cisplatin-treated H had higher transcription levels of ABCC1, DHRS2/HEP27, and EFEMP1 compared to cisplatin-treated-J cybrids.
Conclusions: Cybrid cell lines that contain identical nuclei but either H mtDNA mitochondria or J mtDNA mitochondria respond differently to cisplatin treatments suggesting involvement of the retrograde signaling (from mitochondria to nucleus) in the drug-induced cell death. Varying toxicities and transcription levels of the H vs. J cybrids after cisplatin treatment support the hypothesis that mtDNA variants play a role in the expression of genes affecting resistance and side effects of cisplatin.
Cisplatin is a non-specific alkylating agent used for decades to successfully treat various cancers. However, cisplatin has dose-dependent toxicity and resistance often develops (1, 2). Mitochondrial dynamics play an important role in resistance to chemotherapy and severity of side effects. Many anti-cancer medications can cause mitochondrial dysfunction and DNA damage, and cells depleted of mtDNA show increased resistance to chemotherapeutic agents. Cisplatin is a pro-apoptotic drug that damages mitochondria, contributing to the toxicities in gastrointestinal, auditory, and kidney proximal tubule cells (3–5). Cisplatin treatment of head and neck squamous cell carcinoma and Chinese hamster ovarian cells significantly increases adduct formation in mitochondrial (mt) DNA compared to nuclear (n) DNA (6). Furthermore, mtDNA is more likely to remain damaged after cisplatin exposure because mitochondria lack the nucleotide-excision repair mechanisms found in nDNA. The severity of cancer drug side effects and incidence of induced resistance to chemotherapy drugs vary amongst individuals but the mechanism(s) are still not fully understood.
Cisplatin side effects include nausea, vomiting, myelosuppression, nephrotoxicity, neurotoxicity, cognitive dysfunction retinopathy, and hearing loss. Intravenous delivery of cisplatin commonly causes mild to moderate pigmentary retinopathy, along with intra-retinal hemorrhages, exudates, and cotton wool spots (7). In addition, significant vision loss can occur with both systemic and local delivery methods of the drug (7). However, it is unclear which individuals are going to be susceptible to this toxicity. The decision to continue a drug regimen depends not only on the effectiveness in treating the malignancy, but also on a person's tolerance to the drug and the risks of end-organ damage. Thus, insight into the mechanisms of cisplatin toxicity is valuable to patient care and therefore, a model using human retinal pigment epithelial (RPE) cells was developed to study mechanisms of cytotoxic damage.
Mitochondria are unique organelles that play essential roles in ATP production, calcium homeostasis, apoptosis, and cell signaling. The mtDNA are maternally inherited and can be classified into different haplogroups based on patterns of single nucleotide polymorphisms (SNPs) that have accumulated over thousands of years. The mtDNA haplogroups represent populations from different geographic origins and subsequently, can be used to characterize different ethnic groups. Clinically, different ethnic populations show dissimilar susceptibilities to diseases and drug responses (8–10), and it has been suggested that mtDNA haplogroups may play important roles in these differences (11). Specific mtDNA haplogroups have also been associated with renal, prostate, breast, and lung cancers (12–15). In addition, somatic and germline mtDNA mutations, as well as levels of mtDNA copy numbers, have been associated with increased risk of cancer and different responses to anti-cancer drugs (16). These studies demonstrate how polymorphisms and/or variants in mtDNA can lead to significant changes at the molecular and cellular levels and can be associated with increased cancer risk.
One method to characterize the functional consequences of cells having specific mtDNA haplogroups is through transmitochondrial cybrids (cells with identical nuclei but different mtDNA). Previously, we demonstrated that H cybrids (Southern European maternal origin mtDNA) vs. J cybrids (Northern European maternal origin mtDNA) have significantly different cellular homeostasis. Although all cybrids had identical nuclei and culture conditions, cells containing the J mtDNA had increased rates of growth along with higher lactate and glycolysis levels, but showed significantly lower MT-RNA expression and ATP levels compared to the H cybrids (17, 18). Interestingly, even though the J cybrids were created in a non-cancerous human retinal cell line (ARPE-19), the behavior of these cells was characteristic of the Warburg Effect, which described cancerous cells to be more glycolytic, using less oxidative phosphorylation, and producing high amounts of lactate in the presence of oxygen (aerobic glycolysis).
Using a HeLa cybrid model, Amo et al. was able to demonstrate that resistance to cisplatin was conferred via alterations of the mtDNA within the control region and that cisplatin-resistant clones possessed shorter OriB variants within a 16184-16193 region enriched with cytosine repeats (19). Interestingly, alterations of the nuclear genome were not involved in the cisplatin resistance. These findings support the hypothesis that the SNP differences that define the different haplogroups would be important for the responses to cisplatin and as the H and J haplogroup populations possess disparate SNP patterns, then their cybrids would show different responses.
In the present study, we compared the effects of cisplatin on human RPE cell cybrids that possessed either H or J haplogroup mtDNA and found differential responses in levels of cell viability, reactive oxygen species production, mitochondrial membrane potential, and gene expression levels in pathways related to cell signaling, apoptosis, and cisplatin resistance.
All subjects read and signed an informed consent (IRB #2003-3131) from the Institutional Review Board of the University of California, Irvine. All clinical investigations and protocols were conducted according to the principles of the Declaration of Helsinki and approved by the appropriate investigational review boards (University of California, Irvine). Cybrids were generated as described previously (17, 18). H and J cybrids were created by polyethylene glycol fusion of platelets with the Rho0 (mtDNA free) ARPE-19 cells, which had been treated by low dosage ethidium bromide as described by Miceli and Jazwinski (20). H and J cybrids were cultured to the fifth passage using DMEM-F12 containing 10% dialyzed fetal bovine serum, 100 unit/ml penicillin and 100 μg/ml streptomycin, 2.5 μg/ml fungizone, 50 μg/ml gentamycin, and 17.5 mM glucose. Figure 1 provides description of the background of the subjects used in this study. The ages for the H mtDNA subjects (n = 7 cybrids) were 30.57 ± 3.39 years old, while ages for the J mtDNA subjects (n = 7 cybrids) were 36.14 ± 5.47 years (P = 0.4) (Figure 1A). There were 4 males and 3 females for the J haplogroup subjects and 5 males and 2 females in the H haplogroup subjects. Figures 1B,C show the haplogroup defining SNPs in the mtDNA for the J cybrids and H cybrids used in this study (see sequencing method below).
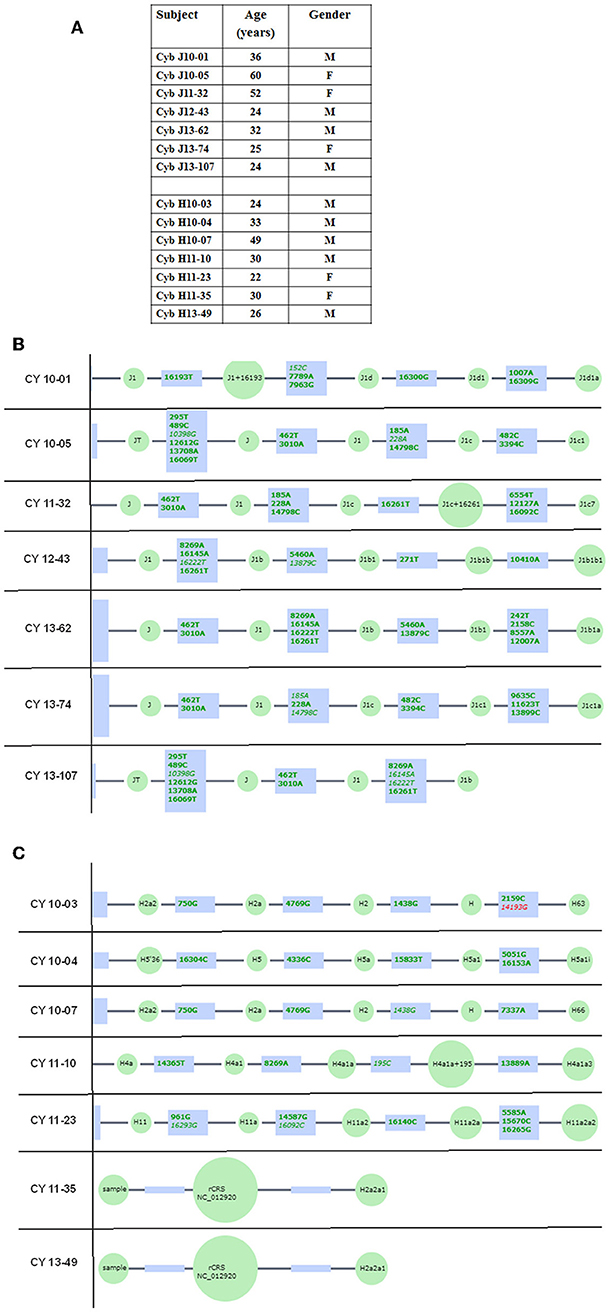
Figure 1. (A) Age and gender profiles for the J haplogroup (n = 7) and H haplogroup (n = 7) subjects. (B) Schematic derived from Haplogrep (https://haplogrep.uibk.ac.at) showing the SNPs that define the J mtDNA haplogroups for subjects used in this study. (C) Schematic derived from Haplogrep (https://haplogrep.uibk.ac.at) showing the SNPs that define the H mtDNA haplogroups for subjects used in the study. Red font, Haplogroup associated polymorphism missing. Green font, Polymorphisms associated with haplogroup.
DNA was extracted from the individual cybrids (n = 7 for H cybrids and n = 7 for J cybrids) using a kit (DNeasy Blood and Tissue Kit, Qiagen, Germantown, MD). Next Generation Sequencing (NGS) technology that sequences both strands of mtDNA independently in both directions was used to quantitate the haplogroup-defining SNPs, private SNPs (not defining haplogroups), and low frequency heteroplasmy SNPs across the entire mitochondrial genome.
Primers were designed across the entire human mitochondrial genome. A total of 171 primer pairs were designed that overlapped each other to capture the intervening sequences. A total of 100 ng of DNA per sample was used to construct NGS libraries using the TruSeq Custom Amplicon kit (Illumina, San Diego, CA). Two independent sets of primer pools were synthesized. The two primer pools had primers that were complementary. The two primer pools would interrogate the two strands of the mitochondrial genome independently. The two independent libraries had 48 samples each. NGS sequencing was done using 96 libraries (for 48 samples X 2 pools) that were loaded in 2 lanes for a 2 × 225 run on a HiSeq instrument (Illumina). After sequencing, somatic variant analysis was carried out using the variant caller—Pisces (21). Variant calls from each pool were combined to get a list of “true” variants. True variants are defined as variants present on both strands of the DNA. The true variant list was used for final haplogroup analyses using Haplogrep (http://haplogrep.uibk.ac.at). Variants present on only one strand may represent DNA modification events or other artifacts especially at low frequency and therefore were eliminated from the final haplogroup analysis. This method is capable of deep sequencing (average sequencing depth of 30,000; range 1,000–100,000) and accurately differentiates low frequency mtDNA heteroplasmy SNPs from DNA modification artifacts. The amino acid changes and association with diseases resulting from some of the SNPs variants were verified using www.MitoMap.org (22, 23). In some cases, the www.Phylotree.org (24) was used to verify the positions of specific SNPs within the Haplogroup H or Haplogroup J, and also determine if the SNPs were elsewhere in the entire mtDNA tree Build 17. The rs numbers were identified using www.ncbi.nlm.nih.gov/snp. The website www.hmtvar.uniba.it, a database with over 40K human mtDNA variants (25), was utilized to search for specific variants using the Query Tab and inputting the SNP value into the Position field to determine Mutation, Amino Acid Change (if any), and Locus, as well as the link to external resources such as dbSNP for rs numbers. All of the SNPs identified had a Quality Score of 100 (A Phred-scaled quality score assigned by the variant caller) and PASSed all of the Filters.
H and J cybrids were plated in 96-well plates (10,000 cells/well), incubated for 24 h, and then treated with 0, 20, 40, 60, 80, 100, or 120 μM of cisplatin. The cybrids were incubated for another 48 h before having their cell viabilities measured with MTT reagent (Cat. # 30006, Biotium, CA) and absorbance measured with an ELx808 spectrophotometer (Biotek) at 570 nm with reference wavelength at 630 nm. The background absorbance was subtracted from the signal absorbance and values normalized to the untreated specimen of each cell line. Each treatment was analyzed with eight replicates. An IC-50 analysis was performed to determine the concentration of cisplatin required to inhibit the cell viability by 50% (GraphPad Prism Software, Inc., San Diego, CA).
H and J cybrids were plated in six-well plates (500,000 cells/well) and incubated for 24 h. Then cisplatin was added to media at concentrations of 0, 25, or 50 μM and incubated for another 48 h. Cells were counted using a Cell Viability Analyzer (ViCell, Beckman Coulter, Miami, FL) that incorporates a Trypan blue dye exclusion method. Cell numbers were normalized to H untreated and analyzed using the two-tailed t-test (GraphPad Prism). Experiments were analyzed in triplicate replicates and the entire experiment was repeated twice.
H and J cybrids were plated in 24-well plates (100,000 cells/well) were incubated for 24 h and treated with 0 or 40 μM of cisplatin for another 48 h. JC-1 reagent (5,5′,6,6′-tetrachloro-1,1′,3,3′- tetraethylbenzimidazolylcarbocyanine iodide) (Biotium, Hayward, CA) was added to cultures for 15 min. Fluorescence was measured using a Gemini XPS Microplate Reader (Molecular Devices) for red (excitation 550 nm and emission 600 nm) and green (excitation 485 nm and emission 545 mm) wavelengths. Intact mitochondria with normal ΔΨm appeared red, while cells with decreased ΔΨm were in a green fluorescent state. Experiments were analyzed in quadruplicate and the entire experiment was repeated three separate times. Cisplatin-treated values were compared to untreated values for statistical significance (P ≤ 0.05, GraphPad Prism Software, Inc.).
H and J cybrids were plated in 24-well plates (100,000 cells/well) and incubated for 24 h. Cells were treated with 0 or 40 μM of cisplatin for another 24 or 48 h. ROS levels were measured with fluorescent dye 2,7-dichlorodihydrofluorescin diacetate (H2DCFDA, Invitrogen-Molecular Probes, Carlsbad, CA) on a fluorescence plate reader using 490 nm for emission and 520 nm for excitation wavelengths (Gemini XPS Microplate Reader, Molecular Devices, Sunnyvale, CA).
Our previous studies have shown that the J cybrids grow more rapidly than H cybrids (17) so the ROS levels were normalized per cell number. Simultaneously to the ROS experiments, H and J cybrids were plated in 6 well-plates (500,000 cells/plate), incubated 24 or 48 h, and treated in the identical fashion as described above. Cell viabilities were assessed by the Beckman Coulter ViCell Counter, allowing us to determine ROS levels per cell numbers. Differences in cisplatin-treated cells compared to untreated cells were analyzed (Prism, GraphPad Software Inc.) and were considered to be statistically significant when P ≤ 0.05. Experiments were analyzed in quadruplicate replicates and the entire experiment repeated three separate times.
H and J cells were plated (500,000 cells/well) and incubated for 24 h in six-well plates. Cells were treated with culture media containing either 0 or 40 μM of cisplatin for another 48 h. Trypsinized cells were pelleted and RNA isolated following the manufacturer's protocol (RNeasy Kit, Qiagen, Valencia, CA). After RNA quantification (Nanodrop 1000, Thermoscientific, Wilmington, DE), the cDNA was transcribed from 100 ng of RNA (Qiagen), and then used for quantitative reverse transcription-PCR (qRT-PCR) (StepOnePlus instrument; Applied Biosystems, Carlsbad, CA). SYBR Green-based primers were used (Qiagen). Table 2A shows the GenBank Accession numbers and functions for 23 genes that were investigated. Cancer-related genes were Type 1 Cell-Surface Receptor for TGF-beta ligand superfamily (ALK1), Cytochrome P450, DNA Repair associated (BRCA1), Family 51, Subfamily A, Polypeptide 1 (CYP51A), Dehydrogenase/Reductase Member 2 (DHRS2/HEP27), Epidermal Growth Factor Receptor (EGFR), Erb-b2 Receptor Tyrosine Kinase 2 (ERBB2), Excision Repair Cross-Complementation Group 1 (ERCC1), and Secreted frizzled-related protein 1 (SFRP1). We also examined genes involved in cisplatin-induced nephrotoxicity and resistance (26, 27): ATP-Binding Cassette, Sub-Family C (ABCC1), Eukemia viral BMI-1 oncogene (BMI1), Cyclin-dependent kinase 2 (CDK2), Cyclin-dependent kinase inhibitor 1A (CDKN1A/P21), Lysine acetyltransferase 5 (KAT5/TIP60), and Tumor protein p53 (TP53).
Apoptosis genes were BCL2-associated X protein (BAX), BCL2 Binding Component 3 (BBC3), BCL2-Like-13 (BCL2L13), Caspase-3 (CASP3), and Caspase-9 (CASP9). Signaling genes include EGF-Containing Fibulin-Like Extracellular Matrix Protein-1 (EFEMP1), Mitogen-activated protein kinase 8 (MAPK8), Mitogen-activated protein kinase 10 (MAPK10), and Forkhead Box M1 (FOXM1). Target cycle thresholds (Ct) values were initially compared to the Ct values of reference genes and subsequently, comparisons between untreated and cisplatin-treated values (ΔΔCt) were evaluated for statistical significance. Fold differences were calculated using the equation 2(ΔΔCt).
Statistical analysis of the data was performed by ANOVA (GraphPad Prism, version 5.0). Newman-Keuls multiple-comparison or the two-tailed t-tests were used to compare the data within each experiment. P ≤ 0.05 was considered statistically significant. Error bars in the graphs represent standard error of the mean (SEM).
The entire mtDNA from the J and H cybrids were sequenced using NGS technology. Figure 1A shows the age and gender of person in this study. The private SNPs are those that do not define the J or H haplogroups (non-haplogroup defining). The unique SNPs are not listed in www.MitoMap.org or other programs. Table 1A shows the SNPs in the J haplogroup cybrids. There were 11 private SNPS in the mtDNA regions of the J cybrids: CYB 10-01 with m.2305T>C (unique, no rs#, MT-RNR2, unique) and m.10654C>T (no rs#, MT-ND4L, Ala62Val); CYB 10-05 with m.7226G>A (rs369835151, MT-CO1, Syn:Ser441); m.13143 (rs386829174, MT-ND5, Syn:Asn269); and with m.16209T>C (rs386829278, MT-CR, NonCoding); CYB 11-32 with m.6734G>A (rs41413745, MT-CO1, Syn:Met332); CYB 13-43 with m.3847T>C (no rs#, MT-ND1, Syn:Leu181); m7805G>A (no rs#, MT-CO2, Val74Ile) and m.14208A>G (no rs#, MT-ND6, Thr156Ala); m.16263T>A (rs386829294, CR;HV1, NonCoding); CYB 13-62 with m.6899GA (no rs#, MT-CO1, Syn:Met332); and CYB 13-107 with m.8200T>C (no rs#, MT-CO2, Syn:Ser205) (Table 1A). The non-coding Control Region (CR) of the J cybrids possessed 17 SNPs and 10 of those defined the J haplogroup. The NGS methodology allowed identification of heteroplasmic SNPs in the J cybrids. The 13 heteroplasmy SNPs showed a range from 3.1 to 17.29% occurrence in five of the seven cybrids. CYB 10-05 and CYB 13-74 lacked heteroplasmy in the mtDNA.
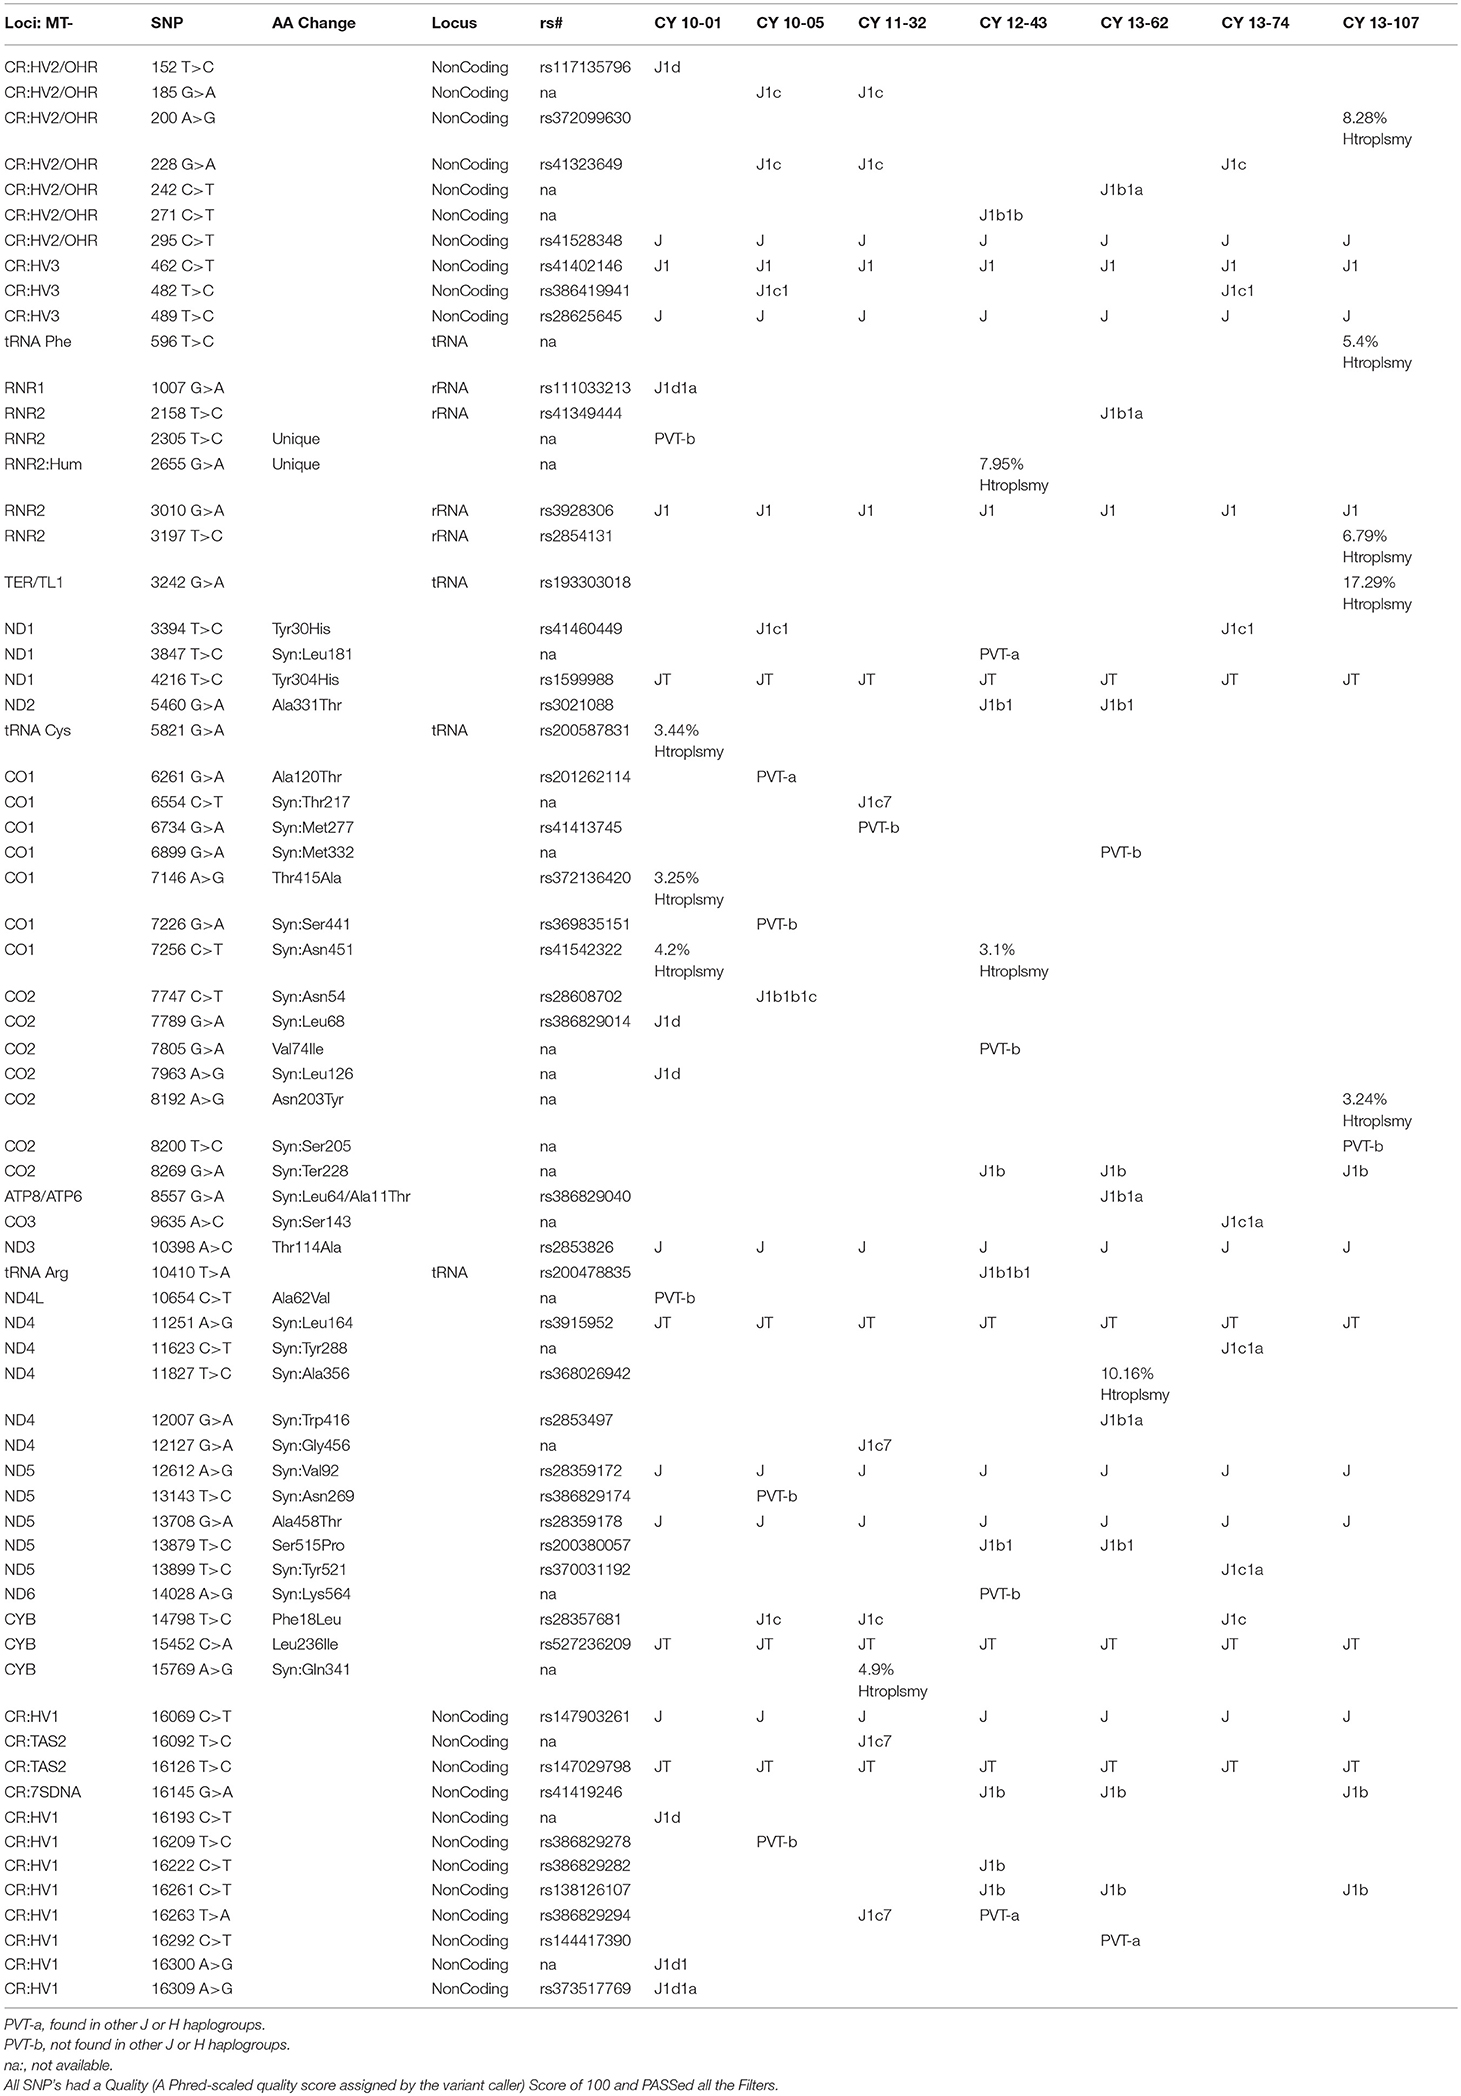
Table 1A. SNPs found by NGS in J Haplogroup Cybrids.
Table 1B shows the SNPs in the H haplogroup cybrids. There were 12 private SNPS in the mtDNA regions of the H cybrids: CYB 10-03 with m.1198A>G (no rs#, MT-RNR1), m.1477T>C, (no rs#, MT-RNR1) m.4483C>G (unique, no rs#, MT-ND2), m.9305G>A, (no rs%, MT-CO3, Syn:Met33), m.9771T>C, (unique, no rs#, MT-CO3, Ser189Pro); m.16093T>C (rs2853511, CR:TAS2, NonCoding); CYB 11-23, with m.1750G>A, (rs28491689, MT-RNR2); m.3010G>A (rs3928306, MT-RNR2); m.11587C>T, (no rs#, MT-ND4, Syn:Cys276); CYB 11-35 with m.3010G>A, (rs3928306, MT-RNR2); and CYB 13-49 with m.13911A>G, (no rs#, MT-ND5, Syn:Met525); and m.14025T>C (no rs#, MT-ND5, Syn:Pro563). There were 8 SNPs in the non-coding Control Region with seven of those defining the H haplogroup. Four of the cybrids (CYB 10-07, CYB 11-10, CYB 11-23, and CYB 13-49) possessed heteroplasmy that ranged from 4.39 to 14.22%. The SNP variants associated with human diseases are listed in Table 1C. The m.3010G>A variant (found in all seven of the J haplogroup cybrids and three of the H haplogroup cybrids) is associated with cyclic vomiting syndrome and migraines. The other SNP variants listed are found in either the J cybrids or the H cybrids but not both.
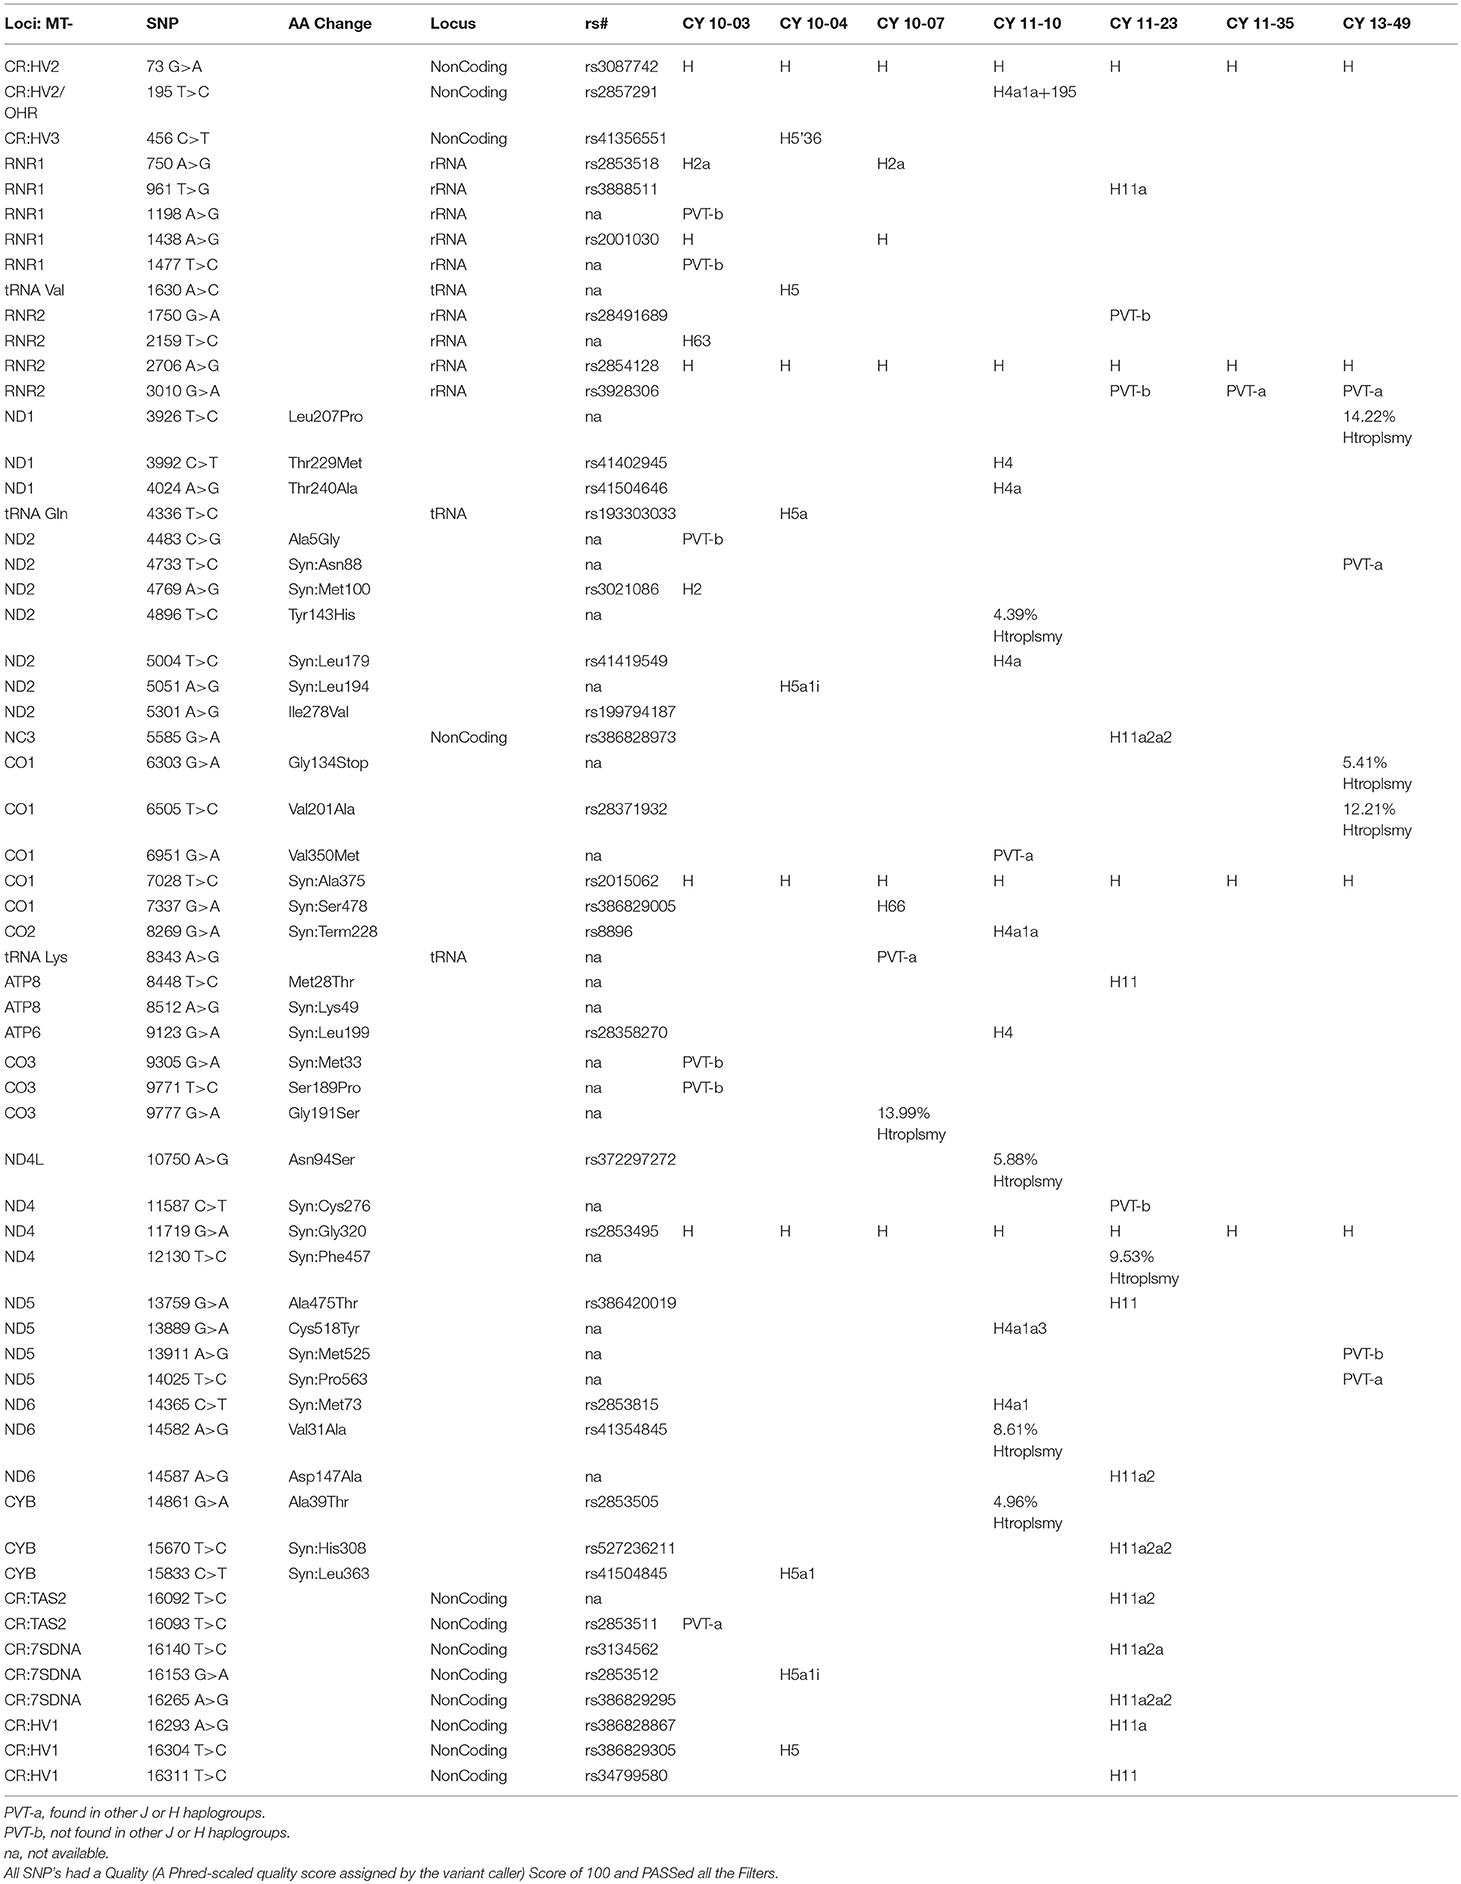
Table 1B. SNPs found by NGS in H Haplogroup Cybrids.

Table 1C. Diseases associated with SNPs* Identified in the J and H Cybrids.
IC-50 analyses were performed to determine the concentration of cisplatin required to inhibit the cell viability by 50% (Figure 2). The Goodness of Fit values were R2 = 0.8388 and R2 = 0.8828 for the H and J cybrids, respectively. The IC-50 values for cybrid-H were 47.13 μM (95% confidence interval 38.62–57.53 μM) and for cybrid-J were 41.06 μM (95% confidence interval 29.49 and 57.18 μM).
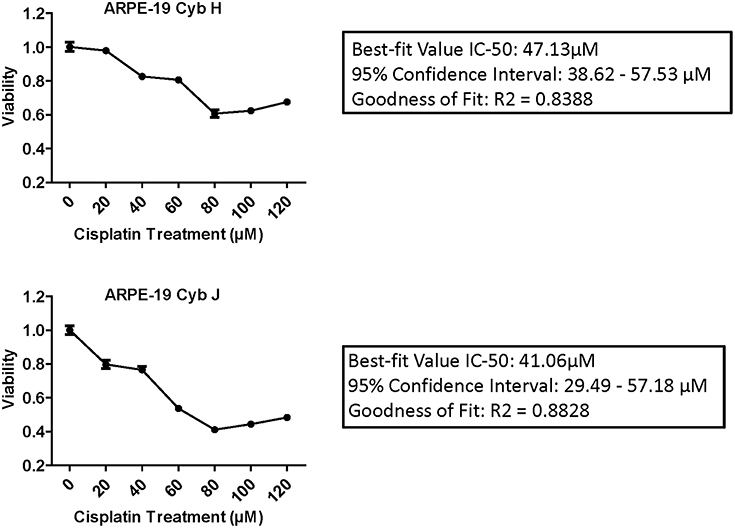
Figure 2. The IC-50 values for the J cybrids were lower (41.06 μM) compared to the H cybrids (47.13 μM). H and J cybrids were plated in 96-well plates, treated with 0, 20, 40, 60, 80, 100, or 120 μM of cisplatin and the cell viabilities measured with MTT reagent. The Goodness of Fit values for the H cybrids were R2 = 0.8388 and 95% confidence interval 38.62–57.53 μM. The J cybrid Goodness of Fit values were R2 = 0.8828 and 95% confidence interval 29.49–57.18 μM. Each treatment was analyzed with eight replicates.
The H and J cybrids were treated for 48 h with either 0, 25, or 50 μM cisplatin and cell viabilities measured using a Trypan Blue dye exclusion assay. The cell viability for the untreated J cybrid (Cyb J Unt) was normalized to the untreated H cybrids (Cyb H Unt, 100.0% ± 16.3). Without treatment, the J cybrids grew at a faster rate than H cybrids (226.5% ± 30.7 vs. 100.0% ± 16.3, P = 0.001, Figure 3A). Cell viability of H cybrids decreased 13% (P = 0.58) after 25 μM cisplatin treatment and to 38% (P = 0.05) after 50 μM cisplatin treatment compared to untreated-H cybrids (100.0% ± 16.3). Compared to untreated-J cybrids, viability decreased 35% (P = 0.04) and 65% (P = 0.002) for the 25 and 50 μM cisplatin-treated-J cybrids, respectively. Thus, cell viabilities of J cybrids were more sensitive to cisplatin treatment than those of H cybrids.
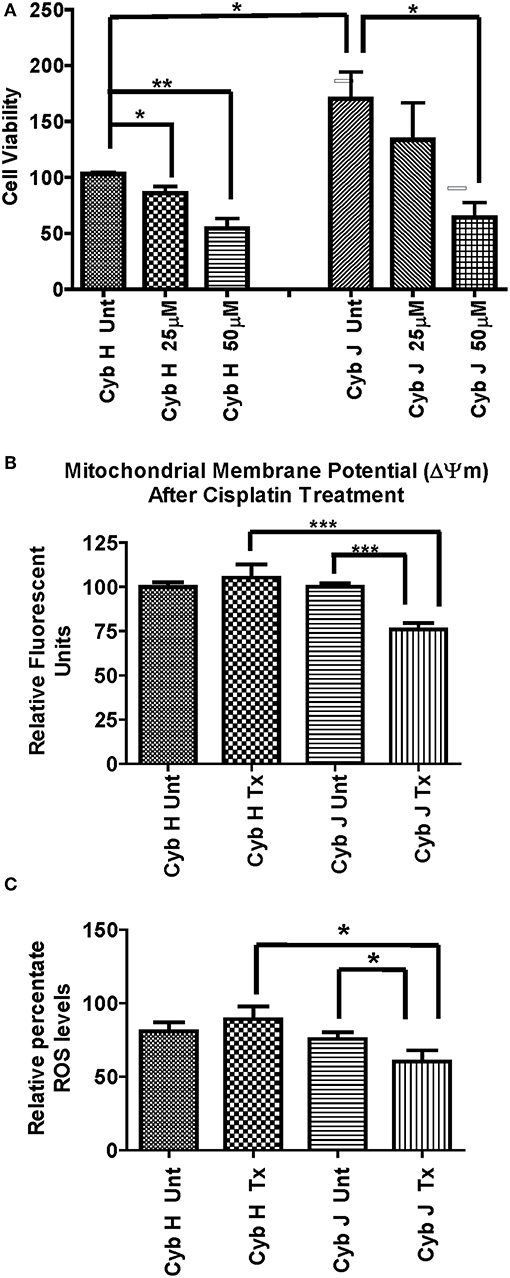
Figure 3. (A) The J cybrids were more sensitive to cisplatin treatment than the H cybrid cultures. Cell viabilities of the untreated and cisplatin-treated cybrids were measured using the trypan blue dye exclusion assay and normalized to the untreated-H cybrid sample (Cyb H Unt, 100.0 ± 16.3). The viability in untreated-J cybrids increased at 2.26-fold higher rate than the untreated-H cybrids (P = 0.001). The viability declined in the 25 μM cisplatin-treated-H cybrids (13%, P = 0.58) and 50 μM cisplatin-treated-H cybrids (38%, P = 0.05) compared to the untreated-H cybrids. The viability decreased in the 25 μM cisplatin-treated-J cybrids (35%, P = 0.05) and 50 μM cisplatin-treated-J cybrids (65%, P = 0.002) compared to the untreated-J cybrids. Each experiment was repeated twice and analyzed in triplicate. (B) J cybrids have a greater loss of mitochondrial membrane potential (ΔΨm) after cisplatin treatment than H cybrids. The ΔΨm values in cisplatin-treated-J cybrids were significantly decreased compared to the untreated-J cybrids (P = 0.0001) and also the cisplatin-treated H cybrids (P = 0.0005). In contrast, the cisplatin-treated and untreated-H cybrids showed similar levels to each other (P = 0.51). ΔΨm, mitochondria membrane potential; RFU, relative fluorescent units. *P < 0.05; **P < 0.01; ***P < 0.001. (C) Cisplatin-treated-H cybrids produced higher levels of ROS compared to the cisplatin-treated-J cybrids. The ROS levels, as measured in relative percentile, were compared between the H and J cybrids without and with cisplatin treatments after 48 h. The cisplatin-treated-J cybrids had significantly lower ROS levels compared to the untreated-J cybrids (P = 0.03) and also compared to the cisplatin-treated-H cybrids (P = 0.006). The ROS levels for the untreated H and cisplatin-treated H were similar to each other (P = 0.37). RFU = relative fluorescent units. *P < 0.05.
The effects of cisplatin on the ΔΨm of H and J cybrids were analyzed after 48 h incubation (Figure 3B). The cisplatin-treated-H cybrids showed similar ΔΨm compared to the untreated-H cybrids (105.3% ± 7.45 vs. 100.0% ± 2.6, P = 0.51, respectively). The cisplatin-treated-J cybrids showed a significant reduction of ΔΨm compared to the untreated-J cybrids (75.9% ± 3.6 vs. 100.0% ± 2.0, P = 0.0001, respectively). In addition, cisplatin-treated-J cybrids showed a 29.4% decrease in Relative Fluorescent Units (RFU) compared to cisplatin-treated-H cybrids (75.9% ± 3.6 vs. 105.3% ± 7.5, P = 0.0005). These findings indicate that J cybrids have a greater loss of ΔΨm after cisplatin treatment than H cybrids.
The ROS levels, measured in RFU, were compared between the H and J cybrids with and without cisplatin treatments after 48 h incubation (Figure 3C). The cisplatin-treated-J cybrids showed significantly lower ROS compared to the untreated-J cybrids (56.79% ± 7.731 vs. 78.33% ± 4.24, P = 0.03, respectively) and also compared to cisplatin-treated-H cybrids (98.26% ± 8.66, P = 0.03). There was no difference between the cisplatin-treated-H cybrids and untreated-H cybrids after 48 h incubation (P = 0.37). Since ROS production levels had been normalized to cell viability for each condition, our findings showed that after cisplatin treatment, the J cybrid cultures showed significantly less ROS production compared to H treated cybrid cultures.
The CYP51A gene expression levels were similar in untreated-H and untreated-J cybrids (1.14 ± 0.14-fold, P = 0.63, Table 2B). However, after cisplatin treatment, the J-treated cybrids showed increased transcription levels compared to untreated-J cybrids (1.94 ± 0.12-fold, P = 0.0057) while the cisplatin-treated-H cybrids were similar to untreated-H cybrids (P = 0.12).
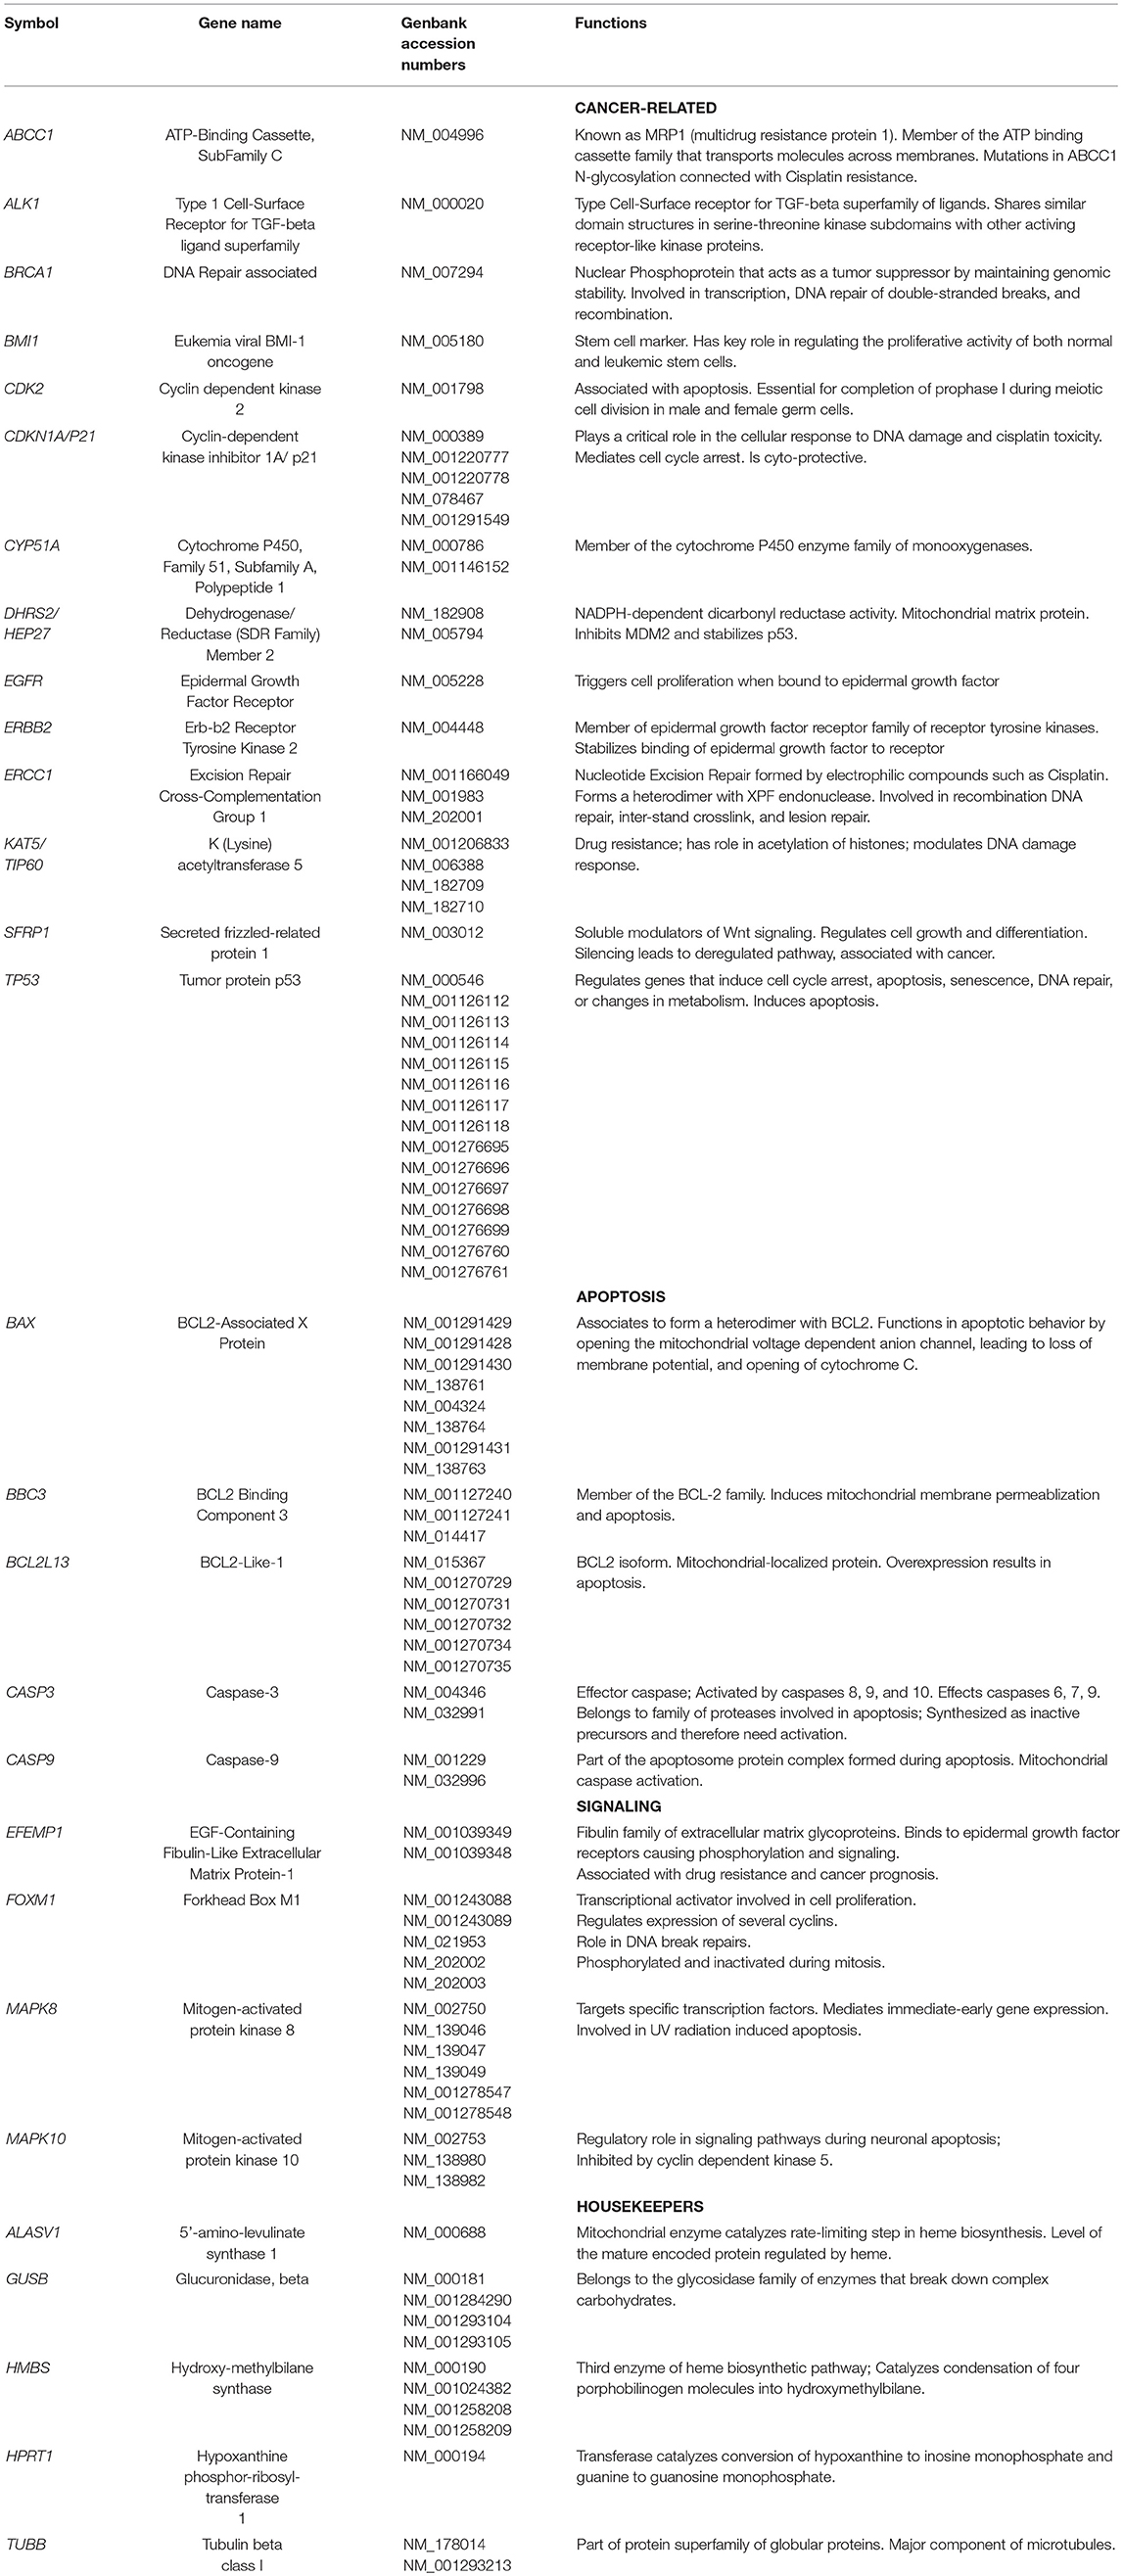
Table 2A. Description of genes analyzed in cisplatin treated H and J cybrids.
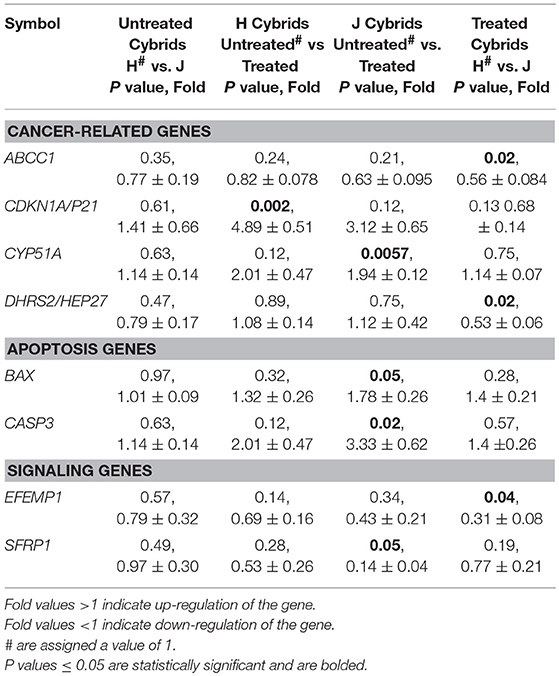
Table 2B. Expression levels in cisplatin treated H and J cybrids.
Levels of CDKN1A/p21 were similar in untreated-J and H cybrids (P = 0.61) but the cisplatin-treated-H cybrids showed significant upregulation compared to the untreated-H cybrid (4.89 ± 0.51-fold, P = 0.002; Table 2B). The CDKN1A/p21 levels in cisplatin-treated-J cybrids trended higher, but were not significant (3.12-fold, P = 0.12). Gene expression levels of both ABCC1 and DHRS2/HEP27 in cisplatin-treated-J cybrids were significantly lower than that of cisplatin-treated-H cybrids (0.56 ± 0.084-fold, P = 0.02 and 0.53 ± 0.06-fold, P = 0.02, respectively). The cisplatin-treated-J cybrids had decreased SFRP1 gene expression levels compared to untreated-J cybrids (0.14 ± 0.04-fold, P = 0.05). In contrast, the untreated-H and cisplatin-treated-H cybrids were SFRP1 levels were similar to each other (P = 0.28). These findings demonstrate that expression levels of ABCC1, CYP51A, CDKN1A/p21, DHRS2/HEP27, and SFRP1 genes are differentially influenced in cells containing H vs. J mtDNA profiles.
The levels of ALK, BRCA1, BMI1, CDK2, EGFR, ERBB2, ERCC1, KAT5/TIP60, and TP53 were not different from each other in the H and J cybrids under any conditions (with or without cisplatin treatment; data not shown).
Untreated-H and untreated-J cybrids expressed similar levels of BAX (1.01-fold, P = 0.97). After cisplatin exposure, BAX, and CASP3 levels increased in cisplatin-treated-J cybrids compared to the untreated-J cybrids (1.78 ± 0.26-fold, P = 0.05 and 3.33 ± 0.62-fold, P = 0.02, respectively). In contrast, the treated and untreated-H cybrids were not significantly different from each other (BAX, P = 0.32 and CASP3, P = 0.12). The BBC3, BCL2L13, and CASP9 gene levels were similar in H and J cybrids with or without cisplatin treatment, indicating that cisplatin did not affect these apoptotic genes. These findings indicate that in the J cybrids, cisplatin-induced apoptosis upregulation of BAX and CASP3.
The cisplatin-treated-J cybrids demonstrated lower EFEMP1 gene expression levels than cisplatin-treated-H cybrids (0.31 ± 0.08-fold, P = 0.04). The MAPK8, MAPK10, and FOXM1 expression levels were not different between H and J cybrids, nor were they affected by cisplatin treatment (data not shown).
The entire control regions of H (n = 6) and J (n = 7) cybrids were sequenced (Table 3) and analyzed for the numbers of GG stretches, which are known to be target DNA sequences for cisplatin (28). The MT-Dloop was analyzed because it is the region controlling replication and transcription for mtDNA. In H cybrids (n = 6) and J cybrids (n = 7) there were three GGG stretches (nt16455-16457; nt16516-16518, and nt34-36), one GGGGG stretch (nt16470-16474), and one GGGGGG stretch (nt66-71) site. One H cybrid had a GGGG stretch (nt322-325) that was lacking in any of other H or J cybrids. Greatest variability was found in regions of GG stretches: nucleotides (nt) 184-185 (5/7 in J cybrids); nt228-229 (4/7 in J cybrids); nt322-323 (5/6 in H cybrids); nt513-514 (1/6 H cybrids); and nt526-527 (1/6 H cybrids). A difference in GG stretch patterns of H vs. J cybrids may potentially lead to variations in numbers of cisplatin-mtDNA adducts. However, we believe additional studies will be needed to clarify mechanisms of interaction between the mtDNA and cisplatin that might affect cellular responses.
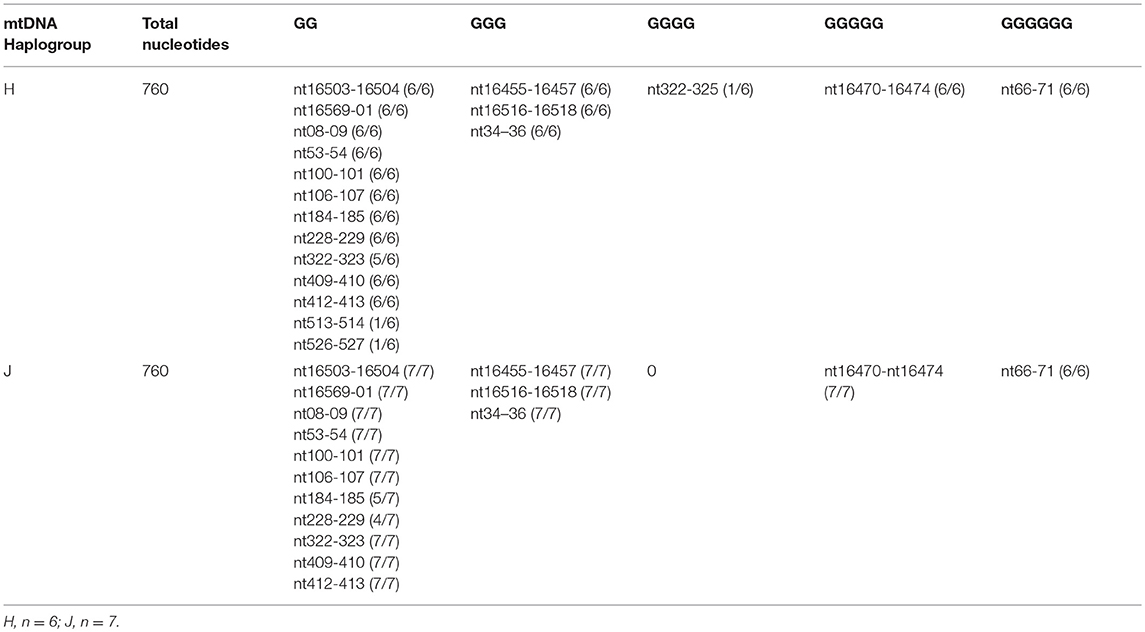
Table 3. Total numbers of GG stretches in the MT-Dloop (nt16441 to nt601) of H cybrids vs. J cybrids.
Although cybrids have identical nuclei and culture conditions, the cell lines with J haplogroup mtDNA exhibit different responses to cisplatin than cybrids with H haplogroup mtDNA. The untreated-J cybrids have significantly increased rates of growth compared to untreated-H cybrids (226 vs. 100%, P = 0.001), a finding consistent with a previous study (17). After treatment with cisplatin, J cybrids show a dose-dependent decrease in cell viability with a 35% decline at 25 μM cisplatin (P = 0.044) and 58% decline at 50 μM cisplatin (P = 0.0023) compared to the untreated-J cultures. In contrast, H cybrids had non-significant 12% decrease at 25 μM and 38% decline at 50 μM (P = 0.05) compared to the untreated-H cybrids. The large decline in cell viability for J cybrids may be because cisplatin, similar to many anti-cancer drugs, is more effective on rapidly growing cells (1), which is the status of cells containing J mtDNA haplogroup patterns (17, 29). Alternatively, it may be that the differential effects of cisplatin are related to J cybrids having lower oxygen consumption, ATP levels, and mitochondrial membrane potential (17, 30). Interestingly, Ghelli et al. reported that Leber's Hereditary Optic Neuropathy (LHON) cell lines with the J haplogroup showed increased sensitivity to 2,5-hexanedione (2,5-HD), a toxic solvent that causes neurological and retinal pathology after exposure (31).
The ΔΨm decreased significantly in cisplatin-treated-J cybrids but not in cisplatin-treated-H cybrids compared to their untreated controls. The decline in ΔΨm represents early changes that can lead to downstream events such as apoptosis. The release of cytochrome C and induction of intracellular apoptosis are mediated through the voltage-dependent anion channel (VDAC) and cisplatin binds to cysteine and methionine sites of the VDAC (32). The mitochondrial size, shape, and degree of fragmentation can affect binding capacity of BAX, causing changes in mitochondrial outer membrane permeability and apoptosis. The lower ΔΨm levels in cisplatin-treated-J cybrids are consistent with qRT-PCR results showing increased apoptotic gene expressions (BAX and CASP3) compared to untreated-J cybrids, while the levels in H cybrids did not vary after cisplatin treatment. Our findings show that the mtDNA variants within cells can mediate cisplatin-induced pro-apoptosis events that might contribute to the degrees of toxicity and/or resistance in different individuals.
The cisplatin-treated-H cybrids showed higher ROS levels compared to the cisplatin-treated-J cybrids, which is not completely surprising because the H cybrids utilize OXPHOS, a system that can generate endogenous ROS, while J cybrids use predominantly glycolysis (17). In addition, there are reports that cisplatin reduces mitochondrial respiration complexes I-IV activity by 15–55%, resulting in higher ROS generation in porcine proximal tubular cells (33). A similar stimulus of ROS production may occur in H cybrids because of their reliance on the OXPHOS bioenergetics.
The RPE cell line used in this study is non-cancerous (ARPE-19) and cancer cells genomes may respond differently to cisplatin treatment. One side effect of cisplatin therapy is mild to moderate pigmentary retinopathy (abnormalities of the RPE cells) that occurs in some patients but not in others. Our findings demonstrate that in vitro the human RPE cells are affected deleteriously by cisplatin treatment but depending upon the mtDNA haplogroup (H vs. J), the responses are differentially expressed. This differential response may contribute to the pigmentary retinopathy found in some patients but lacking in other subjects (7).
We looked at several genes involved with apoptosis: BAX, BBC3, BCL2L13, CASP9, and CASP3. RNA levels for BAX and CASP3 were upregulated in cisplatin-treated-J cybrids compared to untreated-J cybrids, but the H treated cybrids remained similar to untreated controls. Cisplatin-induced upregulation of CASP3, the downstream effector gene for apoptosis, has also been reported in carcinoma cells (34). Consistent with elevated apoptosis genes, RNA levels for BAX were upregulated after cisplatin treatment in J cybrids in comparison to untreated-J cybrids. BAX proteins help form porous defects in the mitochondrial outer membrane, leading to release of apoptotic factors (26). In a mouse model, cisplatin has been shown to induce BAX in renal tubular cells (35). Mice deficient of BAX show less cytochrome C release from mitochondria, lower levels of renal tubular apoptosis, and increased resistance to cisplatin (35). Further studies into the mechanisms of BAX and CASP3 upregulation in our cybrids are needed.
SFRP1 levels were not significantly changed after cisplatin treatment in H cybrids. In contrast, the SFRP1 levels were lower in cisplatin-treated-J cybrids compared to untreated-J cybrids (P = 0.05). This is significant because all nuclei and culture conditions are identical, indicating that cisplatin has different effects on cells depending on whether they contain H or J mtDNA. SFRP1 is an extracellular inhibitor of the WNT pathway and acts as a tumor suppressor. Lower SFRP1 levels, as seen in the cisplatin-treated-J cybrids, can be associated with resistance to cisplatin and poorer patient survivability (36).
The CDKN1/p21 gene levels were higher after cisplatin treatment in H cybrids compared to untreated-H cybrids (P = 0.002). In contrast, the CDKN1/p21 gene levels were not changed in the J cybrids after treatment (P = 0.12). Higher levels of CDKN1/p21 are significant because of its role in cellular responses to DNA damage and cell cycle arrest. Overexpression of p21 inhibits colony formation of tumor cells (37). In addition, Duensing et al. reported that abnormal expression of p21 is associated with chromosomal instability as seen in tumor cells (38). Usually, induction of CDKN1A mRNA level is dependent on Tp53 (39) but in our H and J cybrids, the Tp53 expression levels were not changed in response to cisplatin treatment (data not shown). This suggests that upregulation of CDKN1A/p21, as seen in cisplatin-treated-H cybrids, is independent of Tp53 expression.
There was an interesting disparity in the J and H cybrids after cisplatin treatment. The untreated-H and J cybrids had similar expression levels for ABCC1, DHRS2/HEP27, and EFEMP1 but after cisplatin-treatment, the treated-J cybrids showed lower expression levels compared to the untreated-J cybrids (P = 0.02, P = 0.02, and P = 0.04, respectively), while the cisplatin-treated-H were similar to the H-untreated. After cisplatin treatment, higher expression levels of DHRS2/HEP27 were found in the cisplatin-treated-H cybrids compared to the cisplatin-treated-J cybrids. An accumulation of DHRS2/HEP27 pre-protein in the mitochondria matrix can lead to mature DHRS2/HEP27 translocating to the nucleus, where it eventually binds and inhibits MDM2, leading to stabilization of the Tp53 pathway and indirect tumor repressor functions within the cell. Higher levels of DHRS2/HEP27 gene expression in cisplatin-treated-H cybrids could be associated with MDM2-mediated breakdown of the Tp53 gene, and ultimately stabilization of cellular homeostasis (40).
ABCC1 functions as a transporter, mediates export of drugs from the cytoplasm, and also confers resistance to anti-cancer drugs (41, 42). In osteosarcoma cells, ABCC1 was the most relevant transporter associated with drug resistance, along with the ABCB1 transporter (27). After cisplatin treatment, up-regulations of ABCC1 and EFEMP1 were found in the cisplatin-treated-H cybrids compared to the cisplatin-treated-J cybrids. The higher ABCC1 levels in H cybrids suggest these cells may be more likely to become resistant to anticancer drugs than cells with J mtDNA. If our in vitro findings represent in vivo events, then patients with J haplogroup mtDNA might be less likely to become resistant to anticancer drugs while the H haplogroup patients are more likely. EFEMP1 is a gene associated with the production of EGF-containing fibulin-like extracellular matrix protein 1. Overexpression of this gene has been linked to in vivo and in vitro chemotherapeutic drug resistance in cases used to treat glioblastoma tumor growth. The higher EFEMP1 gene expression levels in H cybrids may be a precursor to drug resistant cybrid cells treated with cisplatin (43). Future studies should be conducted to determine if there is correlation between mtDNA haplogroup patterns and cisplatin resistance.
Based upon our findings, it is apparent that after cisplatin treatment, cells containing J haplogroups (Northern European) variants show different biological behavior and gene expression patterns compared to those cells possessing the Southern European H haplogroup mtDNA. At this time, it is not clear how the H vs. J mtDNA profiles influence the nuclear gene expression in cybrids. The effects may be not strictly related to the haplogroup mtDNA as a whole but rather the presence of specific SNPs, which in this case, are defining the J haplogroup. For example, the m10398A>G polymorphism (MT-ND3, ALA-THR) defines the J haplogroup (www.MitoMap.org). The m10398A>G has been associated with breast cancer in African-American women (44), although no association was found in another study (45). Another J haplogroup-defining SNP, m13708G>A (MT-ND5, ALA-THR), has also been associated with breast cancer (46). Even though these SNPs were located in different mtDNA encoding genes, each of these has an amino acid change from Alanine, a non-polar, neutral amino acid to the polar, neutral Threonine, which could change bonding and function of proteins. In contrast, when mtDNA from H cybrids were sequenced, there were no mtDNA variant/mutations that have been associated with human cancers (47). One can speculate that one or all of these J haplogroup-defining SNPs can contribute to changes in retrograde signaling between the mtDNA and nuclear genomes. While further work is needed to identify mechanisms and pathways, our findings support the hypothesis that an individual's mtDNA background can contribute to the response to cisplatin, which is important for the drug's efficacy, level of side effect and development of resistance.
In summary of the gene expression studies, the effects of cisplatin on gene expression fell into five categories (Figure 4). The first category was that cisplatin did not change gene expression in either cisplatin-treated-J or cisplatin-treated-H cybrids (MAPK8, MAPK10, FOXM1, BBC3, BCL2L13, CASP9, ALK1, BRCA1, EGFR, ERBB2, ERCC1, CDK2, TP53, BMI1, and KAT5/TIP60). The second category was that cisplatin-treated-J cybrids were downregulated (SFRP1) and the third category showed upregulation (CYP51A, BAX, or CASP3) compared to the untreated-J cybrids. The fourth category was that cisplatin-treated-H cybrids showed increased transcription of CDKN1A/p21 gene compared to untreated-H cybrids, while the J cybrid levels were not affected. Finally, that cisplatin-treated-J cybrids showed lower levels of gene expression compared to cisplatin-treated-H cybrids (DHRS2/HEP27, ABCC1, and EFEMP1).
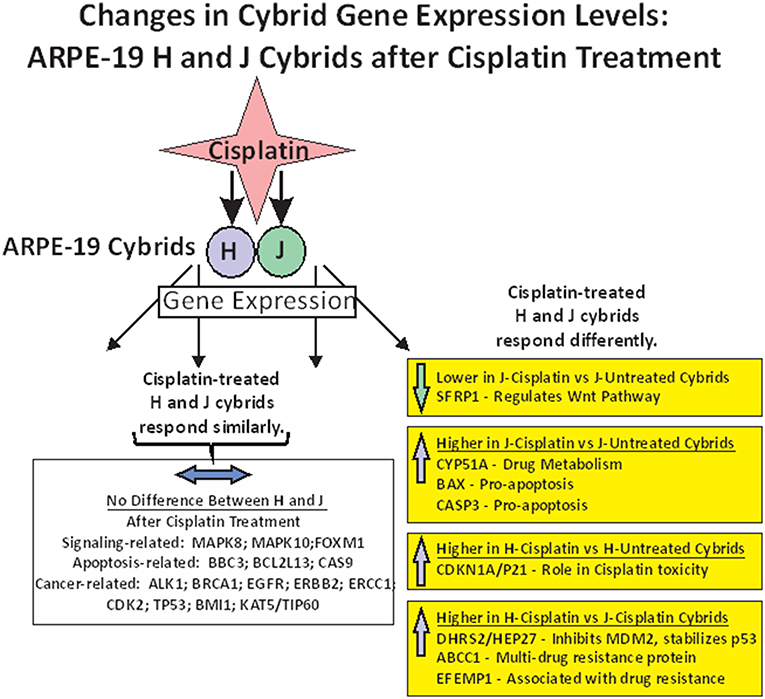
Figure 4. Schematic showing the changes in gene expression levels for H and J cybrids after cisplatin treatment fall into different categories: (1) there are no differences in the expression levels between the untreated and cisplatin-treated cybrids (MAPK8, MAPK10, FOXM1, BBC3, BCL2L13, CASP9, ALK1, BRCA1, EGFR, ERBB2, ERCC1, CDK2, TP53, BMI1, and KAT5/TIP60). (2) Lower expression levels of SFRP1 are found in the cisplatin-treated-J cybrid compared to the untreated-J cybrid; (3) Upregulation of CYP51A, BAX, and CASP3 in the cisplatin-treated-J cybrids compared to the untreated-J cybrids; (4) Higher levels of CDKN1A/P21 are found in the cisplatin-treated H cybrids compared to the untreated H cybrids; (5) The H-cisplatin cybrids showed higher expression levels of DHRS2/HEP2, ABCC1, and EFEMP1 compared to the cisplatin-treated-J cybrids.
NGS analyses performed on the mtDNA from each of the H and J cybrids showed that the majority of the SNPs identified were haplogroup defining. The private SNPs (non-haplogroup defining), unique SNPs (not listed in www.MitoMap.org), and heteroplasmy SNPs were found in individual cybrids and not throughout all of the H or J cybrids. This suggests that the differential retrograde signaling between the H and J mtDNA haplogroups is due to the accumulation of the haplogroup defining SNPs rather than a single mutation or private SNP. Our findings are consistent with the sequencing results from another cybrid study that used allelic discrimination and Sanger sequencing to identify the mtDNA haplogroups (48). The advancement of NGS for mtDNA analyses allowed deep sequencing in ranges from 1,000 to 100,000 with an average depth of 30,000 so that low level heteroplasmy could be reliably identified. In addition, our method allowed for both strands of mtDNA to be independently sequenced and in both directions, which helps to distinguish between artifact and low level heteroplasmy. The mechanisms of retrograde signaling for the different mtDNA haplogroups are under investigation and likely include as of yet unidentified pathways.
Our previous report related to the MT-DLoop region showed the greatest SNP variations in J vs. H mtDNA were in (a) the nucleotides (np) 263–461 region; (b) Conserved Sequence Block 2 region (np 299-315); (c), H Strand Origin region (np 110-441); (4) Hypervariable Segment 2 region (np 57-372); and (5) the np 310–321 region that had high variability with C insertions (48). However, H and J mtDNA had similar total numbers of CpG and non-CpG methylation sites in the MT-DLoop. The mtDNA is a target for epigenetic modifications and altered methylation patterns have been associated with diseases, drug exposure and aging (49–51). However, the degree of mtDNA methylation is still controversial and some have suggested that the methylation levels are very low to absent in mtDNA (52, 53). Cisplatin causes DNA damage by adduct formation at intra-strand d(GpG) crosslink sites. The rate of DNA adduct formation increases in acidic conditions (28, 54) and higher numbers of GG stretches may lead to more binding of cisplatin to the mtDNA. Importantly, our previous bioenergetic studies showed that J cybrids preferentially use glycolysis and have higher levels of extracellular acidification rates (ECAR) than the cybrids with H haplogroup mtDNA (48), leading to the possibility that the H and J mtDNA MT-DLoop may possess different levels of GG sites. However, we found that within the MT-Dloop regions, the numbers of GG stretches (GG, GGG, GGGG, and GGGGG) were similar in H and J cybrids. Therefore, the environmental microenvironment may be playing a bigger role in cisplatin-related adduct formation rather than the numbers of GG stretches in the mtDNA but further work is needed to clarify this question.
This study was carried out in accordance with the recommendations from the Institutional Review Board (#2003-3131) of the University of California Irvine with written informed consent from all patients. All subjects gave written informed consent in accordance with the Declaration of Helsinki. The protocol was approved by the University of California Irvine.
TP designed experiments, interpreted data, wrote manuscript. LN, CL, and KT interpreted data, wrote manuscript. SC, SA, SL, SJ, MM, and DB interpreted data. MC designed experiments, interpreted data. SRA and NU designed and performed the sequencing experiments and interpreted data. MK designed experiments, Interpreted data, wrote manuscript, provided funding resources.
This work was supported by the Discovery Eye Foundation, Polly and Michael Smith, Iris and B. Gerald Cantor Foundation, Max Factor Family Foundation, Einstein Family Foundation, and Guenther Foundation. Supported in part by an Unrestricted Departmental Grant from Research to Prevent Blindness. We acknowledge the support of the Institute for Clinical and Translational Science (ICTS) at University of California Irvine.
MK: Discovery Eye Foundation is a 501(c)3 that has supported her mitochondrial research. She serves as a Board Member for DEF. The terms of this arrangement have been reviewed and approved by the University of California, Irvine in accordance with its conflict of interest policies. MK: Consultant for Allegro, Ophthalmics.
The remaining authors declare that the research was conducted in the absence of any commercial or financial relationships that could be construed as a potential conflict of interest.
We wish to thank the subjects who participated in this study.
1. Florea AM, Büsselberg D. Cisplatin as an anti-tumor drug: cellular mechanisms of activity, drug resistance and induced side effects. Cancers. (2011) 3:1351–71. doi: 10.3390/cancers3011351
2. Gottesman MM, Lavi O, Hall MD, Gillet JP. Toward a better understanding of the complexity of cancer drug resistance. Annu Rev Pharmacol Toxicol. (2016) 56:85–102. doi: 10.1146/annurev-pharmtox-010715-103111
3. Yáñez JA, Teng XW, Roupe KA, Fariss MW, Davies NM. Chemotherapy induced gastrointestinal toxicity in rats: involvement of mitochondrial DNA, gastrointestinal permeability and cyclooxygenase−2. J Pharm Pharm Sci. (2003) 6:308–14.
4. Devarajan P, Savoca M, Castaneda MP, Park MS, Esteban-Cruciani N, Kalinec G, et al. Cisplatin-induced apoptosis in auditory cells: role of death receptor and mitochondrial pathways. Hear Res. (2002) 174:45–54. doi: 10.1016/S0378-5955(02)00634-2
5. Park MS, De Leon M, Devarajan P. Cisplatin induces apoptosis in LLC-PK1 cells via activation of mitochondrial pathways. J Am Soc Nephrol. (2002) 13:858–65.
6. Yang Z, Schumaker LM, Egorin MJ, Zuhowski EG, Guo Z, Cullen KJ. Cisplatin preferentially binds mitochondrial DNA and voltage-dependent anion channel protein in the mitochondrial membrane of head and neck squamous cell carcinoma: possible role in apoptosis. Clin Cancer Res. (2006) 12:5817–25. doi: 10.1158/1078-0432.CCR-06-1037
7. Liu CY, Francis JH, Brodie SE, Marr B, Pulido JS, Marmor MF, et al. Retinal toxicities of cancer therapy drugs: biologics, small molecule inhibitors, and chemotherapies. Retina. (2014) 34:1261–80. doi: 10.1097/IAE.0000000000000242
8. O'Donnell PH, Dolan ME. Cancer pharmacoethnicity: ethnic differences in susceptibility to the effects of chemotherapy. Clin Cancer Res. (2009) 15:4806–14. doi: 10.1158/1078-0432.CCR-09-0344
9. Tan DS, Mok TS, Rebbeck TR. Cancer genomics: diversity and disparity across ethnicity and geography. J Clin Oncol. (2016). 34:91–101. doi: 10.1200/JCO.2015.62.0096
10. Jing L, Su L, Ring BZ. Ethnic background and genetic variation in the evaluation of cancer risk: a systematic review. PLoS ONE. 2014 9:e97522. doi: 10.1371/journal.pone.0097522
11. Kenney MC, Chwa M, Atilano SR, Falatoonzadeh P, Ramirez C, Malik D, et al. Molecular and bioenergetic differences between cells with African versus European inherited mitochondrial DNA haplogroups: Implications for population susceptibility to diseases. Biochim Biophys Acta. (2014) 1842:208–19. doi: 10.1016/j.bbadis.2013.10.016
12. Booker LM, Habermacher GM, Jessie BC, Sun QC, Baumann AK, Amin M, et al. North American white mitochondrial haplogroups in prostate and renal cancer. J Urol. (2006) 175:468–72; discussion 472-3. doi: 10.1016/S0022-5347(05)00163-1
13. Czarnecka AM, Bartnik E. The role of the mitochondrial genome in ageing and carcinogenesis. J Aging Res. (2011) 2011:136435. doi: 10.4061/2011/136435
14. Blein S, Bardel C, Danjean V, McGuffog L, Healey S, Barrowdale D, et al. An original phylogenetic approach identified mitochondrial haplogroup T1a1 as inversely associated with breast cancer risk in BRCA2 mutation carriers. Breast Cancer Res. (2015) 17:61.
15. Fang Y, Yang HY, Shi YH, Cui JH, Li LY, Xu YC, et al. Mitochondrial DNA haplogroups and somatic mutations are associated with lung cancer in patients from Southwest China. Genet Mol Res. (2015) 14:5031–43. doi: 10.4238/2015.May.12.6
16. van Gisbergen MW, Voets AM, Starmans MH, de Coo IF, Yadak R, Hoffmann RF, et al. How do changes in the mtDNA and mitochondrial dysfunction influence cancer and cancer therapy? Challenges, opportunities and models. Mutat Res Rev Mutat Res. (2015) 764:16–30. doi: 10.1016/j.mrrev.2015.01.001
17. Kenney MC, Chwa M, Atilano SR, Pavlis JM, Falatoonzadeh P, Ramirez C, et al. Mitochondrial DNA variants mediate energy production and expression levels for CFH, C3 and EFEMP1 genes: implications for age-related macular degeneration. PLoS ONE. (2013) 8:e54339. doi: 10.1371/journal.pone.0054339
18. Kenney MC, Chwa M, Atilano SR, Falatoonzadeh P, Ramirez C, Malik D, et al. Inherited mitochondrial DNA variants can affect complement, inflammation and apoptosis pathways: insights into mitochondrial-nuclear interactions. Hum Mol Genet. (2014) 23:3537–51. doi: 10.1093/hmg/ddu065
19. Amo T, Kamimura N, Asano H, Asoh S, Ohta S. Cisplatin selects short forms of the mitochondrial DNA OriB variant (16184-16193 poly-cytosine tract), which confer resistance to cisplatin. Sci Rep. (2017) 7:46240. doi: 10.1038/srep46240
20. Miceli MV, Jazwinski SM. Nuclear gene expression changes due to mitochondrial dysfunction in ARPE-19 cells: implications for age-related macular degeneration. Invest Ophthalmol Vis Sci. (2005) 46:1765–73. doi: 10.1167/iovs.04-1327
21. Dunn T, Berry G, Emig-Agius D, Jiang Y, Lei S, Iyer A, et al. Pisces: an accurate and versatile variant caller for somatic and germline next-generation sequencing data. Bioinformatics. (2019) 35:1579–81. doi: 10.1093/bioinformatics/bty849
22. Chinnery PF, Hudson G. Mitochondrial genetics. Br Med Bull. (2013) 106:135–59. doi: 10.1093/bmb/ldt017
23. McCormick EM, Muraresku CC, Falk MJ. Mitochondrial genomics: a complex field now coming of age. Curr Genet Med Rep. (2018) 6:52–61. doi: 10.1007/s40142-018-0137-x
24. van Oven M, Kayser M. Updated comprehensive phylogenetic tree of global human mitochondrial DNA variation. Hum Mutat. (2009) 30:E386–94. doi: 10.1002/humu.20921
25. Preste R, Vitale O, Clima R, Gasparre G, Attimonelli M. HmtVar: a new resource for human mitochondrial variations and pathogenicity data. Nucleic Acids Res. (2019) 47:D1202–10. doi: 10.1093/nar/gky1024
26. Pabla N, Dong Z. Cisplatin nephrotoxicity: mechanisms and renoprotective strategies. Kidney Int. (2008) 73:994–1007. doi: 10.1038/sj.ki.5002786
27. Fanelli M, Hattinger CM, Vella S, Tavanti E, Michelacci F, Gudeman B, et al. Targeting ABCB1 and ABCC1 with their Specific Inhibitor CBT-1(R) can Overcome Drug Resistance in Osteosarcoma. Curr Cancer Drug Targets. (2016) 16:261–74. doi: 10.2174/1568009616666151106120434
28. Kohno K, Wang KY, Takahashi M, Kurita T, Yoshida Y, Hirakawa M, et al. Mitochondrial transcription factor a and mitochondrial genome as molecular targets for cisplatin-based cancer chemotherapy. Int J Mol Sci. (2015) 16:19836–50. doi: 10.3390/ijms160819836
29. Malik D, Hsu T, Falatoonzadeh P, Cáceres-del-Carpio J, Tarek M, Chwa M, et al. Human retinal transmitochondrial cybrids with J or H mtDNA haplogroups respond differently to ultraviolet radiation: implications for retinal diseases. PLoS ONE. (2014) 9:e99003. doi: 10.1371/journal.pone.0099003
30. Gómez-Durán A, Pacheu-Grau D, Martínez-Romero I, López-Gallardo E, López-Pérez MJ, Montoya J, et al. Oxidative phosphorylation differences between mitochondrial DNA haplogroups modify the risk of Leber's hereditary optic neuropathy. Biochim Biophys Acta. (2012) 1822:1216–22. doi: 10.1016/j.bbadis.2012.04.014
31. Ghelli A, Porcelli AM, Zanna C, Vidoni S, Mattioli S, Barbieri A, et al. The background of mitochondrial DNA haplogroup J increases the sensitivity of Leber's hereditary optic neuropathy cells to 2,5-hexanedione toxicity. PLoS ONE. (2009). 4:e7922. doi: 10.1371/journal.pone.0007922
32. Cullen KJ, Yang Z, Schumaker L, Guo Z. Mitochondria as a critical target of the chemotheraputic agent cisplatin in head and neck cancer. J Bioenerg Biomembr. (2007) 39:43–50. doi: 10.1007/s10863-006-9059-5
33. Kruidering M, Van de Water B, de Heer E, Mulder GJ, Nagelkerke JF. Cisplatin-induced nephrotoxicity in porcine proximal tubular cells: mitochondrial dysfunction by inhibition of complexes I to IV of the respiratory chain. J Pharmacol Exp Ther. (1997) 280:638–49.
34. Basu S, Ma R, Mikulla B, Bradley M, Moulton C, Basu M, et al. Apoptosis of human carcinoma cells in the presence of inhibitors of glycosphingolipid biosynthesis: I. Treatment of Colo-205 and SKBR3 cells with isomers of PDMP and PPMP. Glycoconj J. (2004) 20:157–68. doi: 10.1023/B:GLYC.0000024254.64450.8b
35. Wei Q, Dong G, Franklin J, Dong Z. The pathological role of Bax in cisplatin nephrotoxicity. Kidney Int. (2007) 72:53–62. doi: 10.1038/sj.ki.5002256
36. Kongkham PN, Northcott PA, Croul SE, Smith CA, Taylor MD, Rutka JT. The SFRP family of WNT inhibitors function as novel tumor suppressor genes epigenetically silenced in medulloblastoma. Oncogene. (2010) 29:3017–24. doi: 10.1038/onc.2010.32
37. el-Deiry WS, Tokino T, Velculescu VE, Levy DB, Parsons R, Trent JM, et al. WAF1, a potential mediator of p53 tumor suppression. Cell. (1993) 75:817–25. doi: 10.1016/0092-8674(93)90500-P
38. Duensing A, Ghanem L, Steinman RA, Liu Y, Duensing S. p21(Waf1/Cip1) deficiency stimulates centriole overduplication. Cell Cycle. (2006) 5:2899–902. doi: 10.4161/cc.5.24.3567
39. Bendjennat M, Boulaire J, Jascur T, Brickner H, Barbier V, Sarasin A, et al. UV irradiation triggers ubiquitin-dependent degradation of p21(WAF1) to promote DNA repair. Cell. (2003) 114:599–610. doi: 10.1016/j.cell.2003.08.001
40. Deisenroth C, Thorner AR, Enomoto T, Perou CM, Zhang Y. Mitochondrial Hep27 is a c-Myb target gene that inhibits Mdm2 and stabilizes p53. Mol Cell Biol. (2010) 30:3981–93. doi: 10.1128/MCB.01284-09
41. Cole SP. Multidrug resistance protein 1 (MRP1, ABCC1), a “multitasking” ATP-binding cassette (ABC) transporter. J Biol Chem. (2014) 289:30880–8. doi: 10.1074/jbc.R114.609248
42. Cihalova D, Staud F, Ceckova M. Interactions of cyclin-dependent kinase inhibitors AT-7519, flavopiridol and SNS-032 with ABCB1, ABCG2 and ABCC1 transporters and their potential to overcome multidrug resistance in vitro. Cancer Chemother Pharmacol. (2015) 76:105–16. doi: 10.1007/s00280-015-2772-1
43. Tannous BA, Kerami M, Van der Stoop PM, Kwiatkowski N, Wang J, Zhou W, et al. Effects of the selective MPS1 inhibitor MPS1-IN-3 on glioblastoma sensitivity to antimitotic drugs. J Natl Cancer Inst. (2013) 105:1322–31. doi: 10.1093/jnci/djt168
44. Canter JA, Kallianpur AR, Fowke JH. Re: north American white mitochondrial haplogroups in prostate and renal cancer. J Urol. (2006) 176:2308–9; author reply 2309. doi: 10.1016/j.juro.2006.07.067
45. Setiawan VW, Chu LH, John EM, Ding YC, Ingles SA, Bernstein L, et al. Mitochondrial DNA G10398A variant is not associated with breast cancer in African-American women. Cancer Genet Cytogenet. (2008) 181:16–9. doi: 10.1016/j.cancergencyto.2007.10.019
46. Sanchez-Cespedes M, Parrella P, Nomoto S, Cohen D, Xiao Y, Esteller M, et al. Identification of a mononucleotide repeat as a major target for mitochondrial DNA alterations in human tumors. Cancer Res. (2001) 61:7015–9.
47. Chatterjee A, Mambo E, Sidransky D. Mitochondrial DNA mutations in human cancer. Oncogene. (2006) 25:4663–74. doi: 10.1038/sj.onc.1209604
48. Atilano SR, Malik D, Chwa M, Cáceres-Del-Carpio J, Nesburn AB, Boyer DS, et al. Mitochondrial DNA variants can mediate methylation status of inflammation, angiogenesis and signaling genes. Hum Mol Genet. (2015) 24:4491–503. doi: 10.1093/hmg/ddv173
49. Iacobazzi V, Castegna A, Infantino V, Andria G. Mitochondrial DNA methylation as a next-generation biomarker and diagnostic tool. Mol Genet Metab. (2013) 110:25–34. doi: 10.1016/j.ymgme.2013.07.012
50. Mishra M, Kowluru RA. DNA methylation-a potential source of mitochondria DNA base mismatch in the development of diabetic retinopathy. Mol Neurobiol. (2019) 56:88–101. doi: 10.1007/s12035-018-1086-9
51. Kowluru RA. Mitochondrial stability in diabetic retinopathy: lessons learned from epigenetics. Diabetes. (2019) 68:241–7. doi: 10.2337/dbi18-0016
52. Bellizzi D, D'Aquila P, Scafone T, Giordano M, Riso V, Riccio A, et al. The control region of mitochondrial DNA shows an unusual CpG and non-CpG methylation pattern. DNA Res. (2013) 20:537–47. doi: 10.1093/dnares/dst029
53. Mechta M, Ingerslev LR, Fabre O, Picard M, Barrès R. Evidence suggesting absence of mitochondrial DNA methylation. Front Genet. (2017) 8:166. doi: 10.3389/fgene.2017.00166
Keywords: cisplatin, mitochondria, cybrids, drug resistance, mtDNA haplogroups
Citation: Patel TH, Norman L, Chang S, Abedi S, Liu C, Chwa M, Atilano SR, Thaker K, Lu S, Jazwinski SM, Miceli MV, Udar N, Bota D and Kenney MC (2019) European mtDNA Variants Are Associated With Differential Responses to Cisplatin, an Anticancer Drug: Implications for Drug Resistance and Side Effects. Front. Oncol. 9:640. doi: 10.3389/fonc.2019.00640
Received: 10 December 2018; Accepted: 01 July 2019;
Published: 19 July 2019.
Edited by:
Kuzhuvelil B. Harikumar, Rajiv Gandhi Centre for Biotechnology, IndiaReviewed by:
Russell H. Swerdlow, University of Kansas, United StatesCopyright © 2019 Patel, Norman, Chang, Abedi, Liu, Chwa, Atilano, Thaker, Lu, Jazwinski, Miceli, Udar, Bota and Kenney. This is an open-access article distributed under the terms of the Creative Commons Attribution License (CC BY). The use, distribution or reproduction in other forums is permitted, provided the original author(s) and the copyright owner(s) are credited and that the original publication in this journal is cited, in accordance with accepted academic practice. No use, distribution or reproduction is permitted which does not comply with these terms.
*Correspondence: M. Cristina Kenney, bWtlbm5leUB1Y2kuZWR1
†These authors have contributed equally to this work
Disclaimer: All claims expressed in this article are solely those of the authors and do not necessarily represent those of their affiliated organizations, or those of the publisher, the editors and the reviewers. Any product that may be evaluated in this article or claim that may be made by its manufacturer is not guaranteed or endorsed by the publisher.
Research integrity at Frontiers
Learn more about the work of our research integrity team to safeguard the quality of each article we publish.