
95% of researchers rate our articles as excellent or good
Learn more about the work of our research integrity team to safeguard the quality of each article we publish.
Find out more
ORIGINAL RESEARCH article
Front. Oncol. , 15 January 2019
Sec. Hematologic Malignancies
Volume 8 - 2018 | https://doi.org/10.3389/fonc.2018.00669
This article is part of the Research Topic The Minimal Residual Disease in Hematology: the Impact of the New Technologies View all 9 articles
 Hong Yuen Wong1Anthony D. Sung2†Katherine E. Lindblad1†Sheenu Sheela1Gregory W. Roloff1David Rizzieri2
 Meghali Goswami1Matthew P. Mulé1Nestor R. Ramos1Jingrong Tang1Julie Thompson1Christin B. DeStefano1Kristi Romero2Laura W. Dillon1Dong-Yun Kim3Catherine Lai1
 Christopher S. Hourigan1*
Measurable residual disease (MRD) testing after initial chemotherapy treatment can predict relapse and survival in acute myeloid leukemia (AML). However, it has not been established if repeat molecular or genetic testing during chemotherapy can offer information regarding the chemotherapy sensitivity of the leukemic clone. Blood from 45 adult AML patients at day 1 and 4 of induction (n = 35) or salvage (n = 10) cytotoxic chemotherapy was collected for both quantitative real-time PCR (qPCR) assessment (WT1) and next generation sequencing (>500 × depth) of 49 gene regions recurrently mutated in MDS/AML. The median age of subjects was 62 (23–78); 42% achieved a complete response. WT1 was overexpressed in most patients tested but was uninformative for very early MRD assessment. A median of 4 non-synonymous variants (range 0–7) were detected by DNA sequencing of blood on day 1 of therapy [median variant allele frequency (VAF): 29%]. Only two patients had no variants detectable. All mutations remained detectable in blood on day 4 of intensive chemotherapy and remarkably the ratio of mutated to wild-type sequence was often maintained. This phenomenon was not limited to variants in DNMT3A, TET2, and ASXL1. The kinetics of NPM1 and TP53 variant burden early during chemotherapy appeared to be exceptions and exhibited consistent trends in this cohort. In summary, molecular testing of blood on day 4 of chemotherapy is not predictive of clinical response to cytotoxic induction therapy in AML. The observed stability in variant allele frequency suggests that cytotoxic therapy may have a limited therapeutic index for clones circulating in blood containing these mutations. Further validation is required to confirm the utility of monitoring NPM1 and TP53 kinetics in blood during cytotoxic therapy.
The use of high sensitivity techniques to measure residual leukemic burden in patients achieving a complete remission by cytomorphological criteria is increasingly considered part of the standard of care for acute myeloid leukemia (AML) (1–4). While testing for measurable residual disease (MRD) in AML is typically performed using multi-parameter flow cytometry (MPFC) or real-time quantitative PCR (qPCR) there is increasing recent research interest in the potential of sequencing-based approaches(5–14). The results of MRD testing in AML appear prognostic when measured at key landmark timepoints following initial therapy, typically after 1–2 cycles of induction therapy or before allogeneic transplantation (15–21). It is currently not known if testing changes in residual leukemic burden at earlier timepoints, for example during initial induction therapy, would have clinical utility.
We used two independent molecular techniques for AML MRD quantification, WT1 expression by qPCR and targeted DNA sequencing for common MDS/AML variants. The Wilms tumor gene WT1 is expressed in approximately 90% of cases of AML and has been extensively tested and standardized as a method of MRD detection in AML (22, 23). The utility of WT1 testing is limited to a subset of AML MRD cases and more recently the quantitative assessment by DNA sequencing of variants in genes known to be recurrently mutated in myeloid malignancies has been proposed as a more broadly applicable measure of AML MRD (6, 9, 14). We used both these molecular techniques to determine if early assessment of blood from AML patients during the first 4 days of intensive cytotoxic therapy can predict subsequent clinical response.
Blood was collected daily from day 1 through at least day 5 of intensive cytotoxic therapy from 45 adult AML patients with a median age of 62 years-old (range: 23–78) following informed consent on IRB-approved protocols (Figure 1 and Table 1, Tables S1, S2).
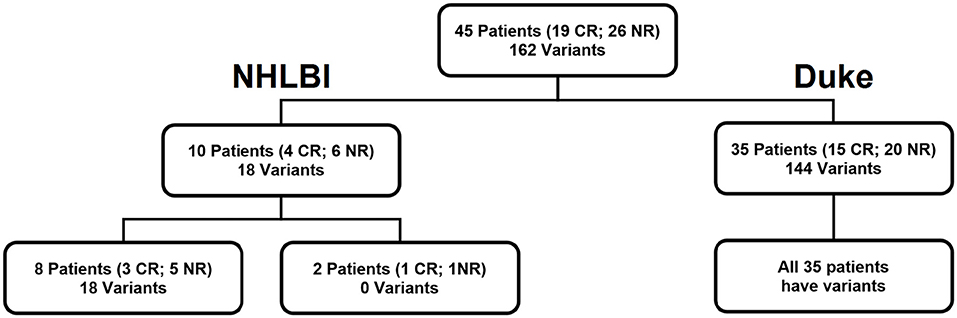
Figure 1. Cohort of 45 patients. Our patient cohort consisted of 10 patients who received salvage chemotherapy at NHLBI, NIH (NCT02527447) and 35 newly diagnosed patients who received induction chemotherapy at Duke University School of Medicine. Variants refers to the number of targets identified by DNA sequencing.
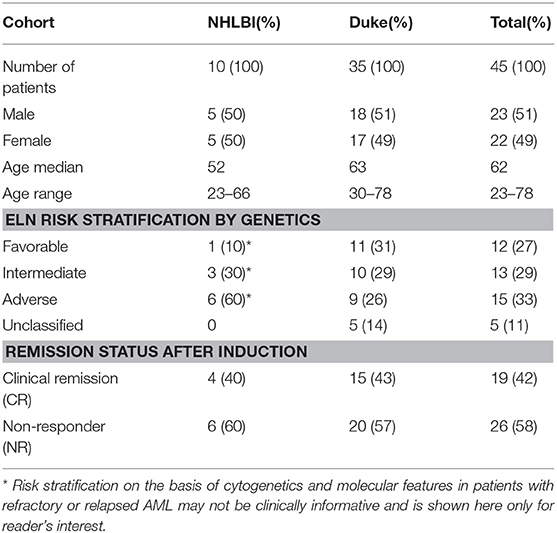
Table 1. Patient characteristics.
Ten patients (median age: 52, range: 23–66) had relapsed or refractory AML (RR-AML) and were recruited to the National Heart, Lung, and Blood Institute (NHLBI) at the National Institutes of Health to receive salvage chemotherapy (NCT02527447). Nine of these patients were treated with EMA (cytarabine 500 mg/m2 CI days 1–3 and days 8–10, mitoxanthrone 12 mg/m2 days 1–3, and etoposide 200 mg/m2 CI days 8–10) with the other receiving G-CLAC (G-CSF, clorafabine and high dose cytarabine) (Table S2).
Thirty-five patients (median age: 63, range: 30–78) were treated at Duke University School of Medicine with induction chemotherapy (“7+3,” 7 days of continuous infusion cytarabine with 3 days of anthracycline) for newly diagnosed AML.
In addition, research samples from clinically indicated bone marrow examinations and post-induction follow-up visits were available for a subset of 22 patients.
Blood was also collected from healthy adult donor subjects following informed consent on an IRB-approved protocol.
Samples were processed with NucleoSpin Blood QuickPure kits (Machery-Nagel) and NucleoSpin RNA Blood kits (Machery-Nagel), as per manufacturer's instructions (NIH) or stored in PAXgene Blood/Marrow RNA tubes (PreAnalytiX) at Duke and shipped frozen to the NIH. Upon thawing PAXgene tubes, 2 mL for gDNA isolation were pelleted and resuspended in PBS then processed with the QIAamp DNA blood mini kit (QIAGEN), as per manufacturer's instructions. The remaining volume was processed with the PAXgene. Blood RNA Kit (PreAnalytiX) as per manufacturer's instructions (for yields see Figure S1).
RNA (130–260 ng) was reverse transcribed using the RT2 First Strand kit (330404, QIAGEN). When necessary, RNA was concentrated with a Savant SVC-100H centrifugal evaporator. Resultant cDNA was loaded into a Custom RT2 Profiler PCR Array containing lyophilized qPCR primers for WT1 and ABL1 using the QIAgility System (QIAGEN). qPCR was performed (hold 2 m at 50°C, hold 10 m at 95°C, then 50 cycles of 15 s at 95°C and 60 s at 60°C) on the Rotor-Gene Q Platform (QIAGEN) and Ct values were collected with a threshold of 0.06. Healthy levels of WT1 expression were established based on upper limit observed in blood of 34 healthy donors.
A total of 49 gene or gene regions recurrently mutated in MDS and/or AML were sequenced using amplicon-based targeted DNA sequencing (RainDance, Billerica, MA). This included genes with functions in methylation, chromatin-cohesin, signaling, transcription as well as TP53, NPM1, and others (see Table S3). Libraries were prepared from 100 ng of gDNA and paired-end 300 bp sequencing was performed on the MiSeq instrument (Ilumina), as per manufacturer's instructions. Results were analyzed using the NextGENe v2.4.2.1 software (SoftGenetics, PA). Sequences were aligned to human genome build v37 (hg19). Non-coding and synonymous variants, along with known sequencing artifacts and regions with <500-fold coverage were removed. Remaining variants (i.e., missense, in-frame, frameshift, and non-sense mutations) with variant allele frequencies (VAFs) above 5% at either day 1 or 4 were considered in subsequent analyses.
In order to track variants in longitudinal blood samples in 2 patients, a custom DNA sequencing assay was designed (DB0188, VariantPlex, ArcherDX). Libraries were prepared from 400 ng gDNA; using paired-end 150 bp sequencing on MiSeq instrument (Ilumina), as per manufacturer's instructions. Archer Analysis software version 5.1.3 was used for analysis.
All statistical analyses were performed using Prism v7.02 (GraphPad Software, CA). The Wilcoxson signed-rank test was performed on paired D1/D4 VAFs. Additive (D4–D1, with denominator of D1 or D4) and multiplicative (D4/D1) differences between D1 and D4 were calculated, then the Wilcoxson rank-sum test was performed on these differences between CR/NR groups. The Chi-square test was performed based on whether the additive difference was positive or negative between CR and NR groups. The unpaired t-test was performed on relative expression levels of WT1. For all statistical tests, P < 0.05 was considered significant.
Full demographics, risk classification, treatment and responses are listed in Table 1, Tables S1,S2. Overall, 19 of 45 patients achieved a complete remission (CR) after intensive therapy (42%). Average white blood cell count was 10 K/ul (range: 0.3–60) on day 1 decreasing to 2.3 K/ul (range: 0.2–26) by treatment day 4. Obtaining sufficient quantities of nucleic acid from blood is the limiting factor for molecular testing during these early time points of cytotoxic chemotherapy in AML. All 45 patients had sufficient DNA for sequencing but only 34/45 patients had enough RNA from paired day 1 and 4 samples for qPCR analysis. There was insufficient RNA and DNA yields from blood beyond day 4 in most patients (Figure S1).
WT1 gene expression (normalized to ABL1 expression) was determined in 34 patients with sufficient RNA for qPCR analysis isolated from blood on days 1 and 4 of treatment. Compared with the upper limit of expression observed in healthy donors (Figure 2A) 31 of 34 patients overexpressed WT1 on Day 1 (91%) consistent with prior reports (22, 23). By day 4 of induction therapy 23 patients had WT1 over-expression. 7 of 13 (54%) patients achieving a CR had at least a 4-fold reduction in WT1 expression, although notably 6 of these 7 patients remained overexpressed compared with healthy donors on day 4 (Figure 2B). Seven of 21 (33%) patients who were non-responders (NR) also had at least a 4-fold reduction in WT1 expression. Two NR patients with undetectable WT1 on day 1 had low level expression on day 4 (Figure 2C). Overall, changes in WT1 expression in blood between day 1 and 4 of intensive cytotoxic chemotherapy for AML appear uninformative as a biomarker for clinical response in this cohort.
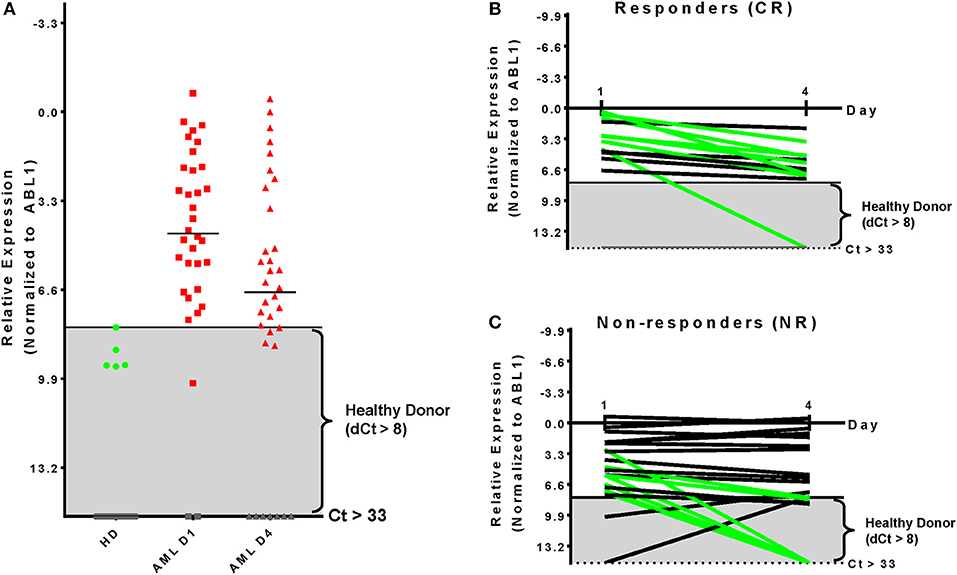
Figure 2. Kinetics of WT1 expression during chemotherapy is uninformative for clinical response. (A) Thresholds for WT1 overexpression in blood for this assay were established based on the upper limit observed by qPCR in 34 healthy donors and were consistent with previous reports (24). AML patient blood samples showed overexpressed WT1 levels in 31 (91%) on Day 1 and 23 (68%) at Day 4. (B) Patients achieving a complete remission after therapy had at least a 4-fold reduction of WT1 expression during therapy in 7 of 13 cases evaluated by qPCR (54%); 5/13 (38%) had <4-fold reduction; 1/13 (8%) had undetectable WT1 levels. (C) Non-responding patients had at least a 4-fold reduction of WT1 expression in 7 of 21 evaluated by qPCR (33%) NR; 14/21 (67%) had less than a 4-fold change. Two patients initially had WT1 levels that were not overexpressed, but became so by treatment day 4. qPCR, quantitative real-time PCR; Green, at least 4-fold decrease; Black, <4-fold change; Gray, undetectable; Gray box indicates healthy donor range.
All patients had targeted DNA sequencing (Table S3) of blood taken on day 1 and 4 of chemotherapy. An average of 4 coding variants (range 0–7) were identified per patient, and only two patients had no variants suitable for disease tracking available (Figure 3). A total of 163 variants were found in 43 patients and some patients had multiple variants found within a single gene (considering multiple variants in one gene in the same patient as single event results in a total of 140 mutated genes). The most frequently mutated gene regions were consistent with those previously reported (25, 26) (see Figure 3, Figures 4A,B). There was no difference in the number of coding variants detectable at baseline in CR vs. NR patients (Figure 3). Variant allele frequencies (VAF) on day 1 were a median of 29% (range: 0.2–71%) with 75% having a VAF <40% (Figure 4C) on day 1. Consistent with current prognostic risk classifications (1), the TP53 and NPM1 mutation classes had predictive significance, with 9 of 9 patients with TP53 mutations not achieving remission while all 5 of 5 patients with NPM1 mutations achieved CR.
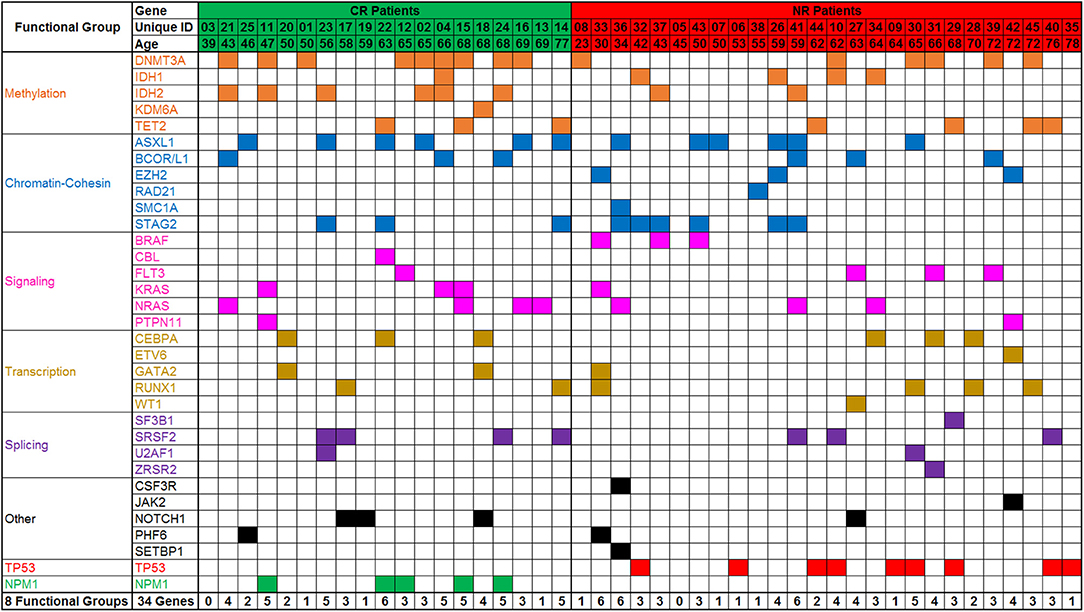
Figure 3. Targeted DNA sequencing of AML patient blood from day 1 of treatment. Variants were detected in 43 of 45 patients assessed. A total of 162 variants were identified in 34 genes or gene regions of 49 assessed. Genes with variants are grouped by gene function/class. Frequency of mutations and patterns of co-mutation are consistent with previous reports. CR, complete remission; NR, non-responder.
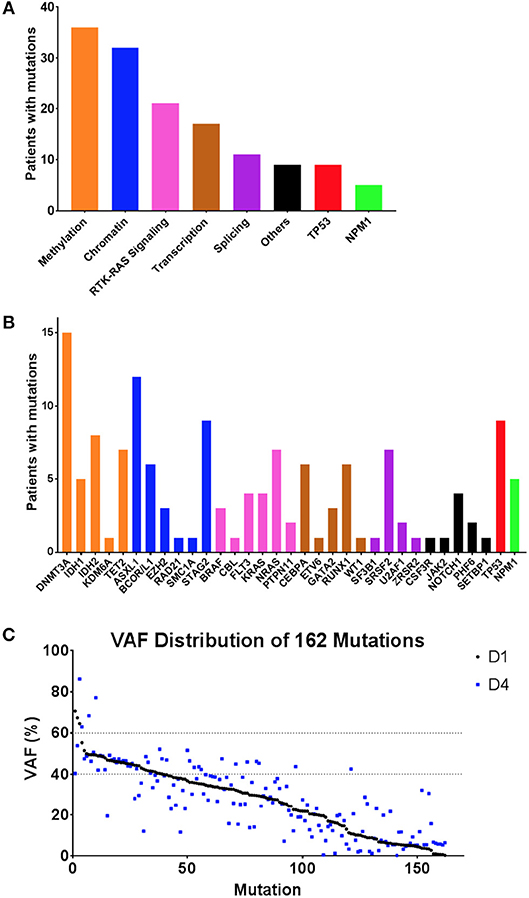
Figure 4. Summary of variants observed by DNA sequencing. (A,B) Frequency of variants summarized by gene function/class (A) and by individual gene name (B). (C) Variant allele frequency (VAF) distribution of variants detected in 43 patients by targeted DNA sequencing, sorted by VAF on day 1 (black), with VAF of same variant in same patient from day 4 also shown (blue). Day 1 variants had a median VAF of 29.24% (range: 0.19–78.94%) whereas Day 4 variants had a median VAF of 27% (range:0.14–86.28%).
Of the 43 patients with at least 1 variant detected in blood at day 1, 18 (42%) achieved CR and 25 (58%) were NR after induction therapy. Although white blood cell (WBC) count decreased 75% on average in the first 4 days of therapy Figure S1A), all variants detected in the blood on day 1 of chemotherapy remained detectable in blood on day 4.
Variant allele frequencies (VAFs) on day 1 and 4 were compared based on the hypothesis that changes in detectable mutation burden in blood very early during intensive cytotoxic treatment may correlate with clinical response as later assessed by morphological examination of bone marrow at count recovery (i.e.,: approximately 30 days later). Day 1 and 4 VAFs, at both the genetic functional class level and individual gene level, were compared using the Wilcoxon Sign Test, for all patients and also for the subgroups achieving either CR or NR (Figures 5, 6). TP53 mutations were only detected in NR patients and showed a significant difference in VAF between days 1 and 4 (P < 0.05) with a mean increase of 34% (n = 9; range: −2 to 94%). NPM1 mutations were observed only in CR patients with a mean decrease of −44% (n = 5; range: −2 to −98%) (P = 0.0625). Furthermore, additional testing for 2-sample statistical significance of the additive and multiplicative differences was assessed between Day 1 and 4 VAFs at the genetic functional class level between the CR and NR patient groups, all of which were non-significant.
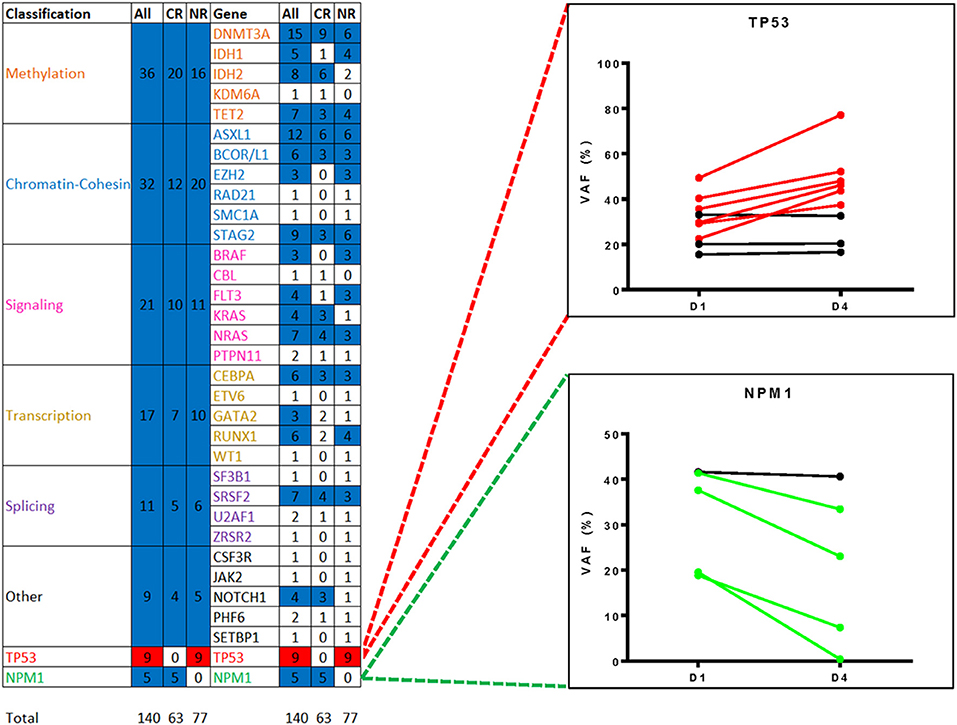
Figure 5. Changes in variant frequency during chemotherapy. All variants identified by targeted DNA sequencing in blood from day 1 of treatment (median VAF of 29%, range: 0.2–71%) were also detectable in blood from day 4 (median VAF 27%, range: 0.1–86%). Heatmap shows statistically significant changes in VAF between day 1 and 4 by either gene functional class or by individual gene/gene region, for all patients or just those with complete remission (CR) or non-responder (NR). Variants were only counted once per gene region per patients. Mutated TP53, detected only in NR patients, was significantly different (red, P < 0.05) and mutated NPM1, detected only in CR patients, demonstrated a consistent trend (blue, P = 0.0625). The remaining functional groups and individual genes were either non-significant (blue) or had too few data points for analysis (white). VAF, variant allele frequency.
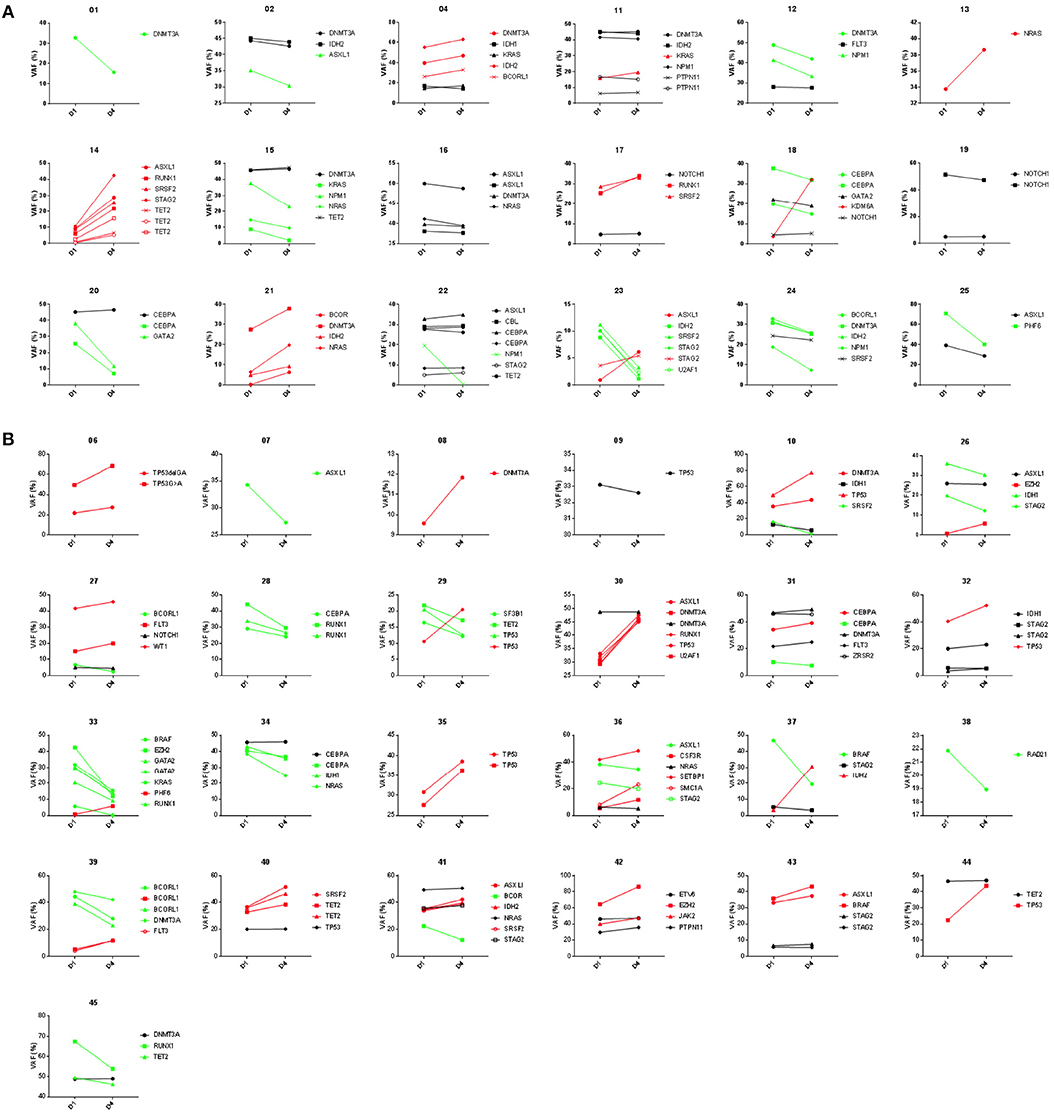
Figure 6. Variant frequency kinetics in blood from day 1 to 4 of AML chemotherapy. Results of targeted DNA sequencing on paired day 1 and 4 samples shown for 18 patients achieving complete remission (A) and 25 patients not responding (B) after induction chemotherapy. Trendlines highlight variants increasing (red) or decreasing (green) during induction therapy.
Somatic mutations in DNMT3A, TET2, and ASXL1 (referred to as “DTA” mutations) are commonly found in AML patients but are also seen in clinically asymptomatic individuals with increased prevalence with aging (27–30). Mutations in these genes are known to not be useful in measuring residual disease in AML (6, 12). Patients with and without DTA mutations were therefore analyzed separately (Figure 7). Overall, 27 patients (60%) had a DTA mutation, and this observation was consistent between the NHLBI relapsed/refractory (median age: 52) and Duke newly diagnosed (median age: 63) AML cohorts. DTA patients expressed significantly lower levels of WT1 than non-DTA patients (median dCT of 4.8 compared to 3.1 P < 0.05) but had greater decrease in WT1 levels by day 4 (median dCT 7.6 vs. 3.6, P < 0.05). 48% of DTA patients achieved CR compared with 33% of non-DTA patients. NPM1 mutations (n = 5) were seen exclusively in DTA patients while TP53 mutations were seen in both DTA (n = 5) and non-DTA (n = 4) patients. Only the transcription-related gene class, in non-DTA patients, showed significant difference between day 1 and 4 VAF levels (Figure 7).
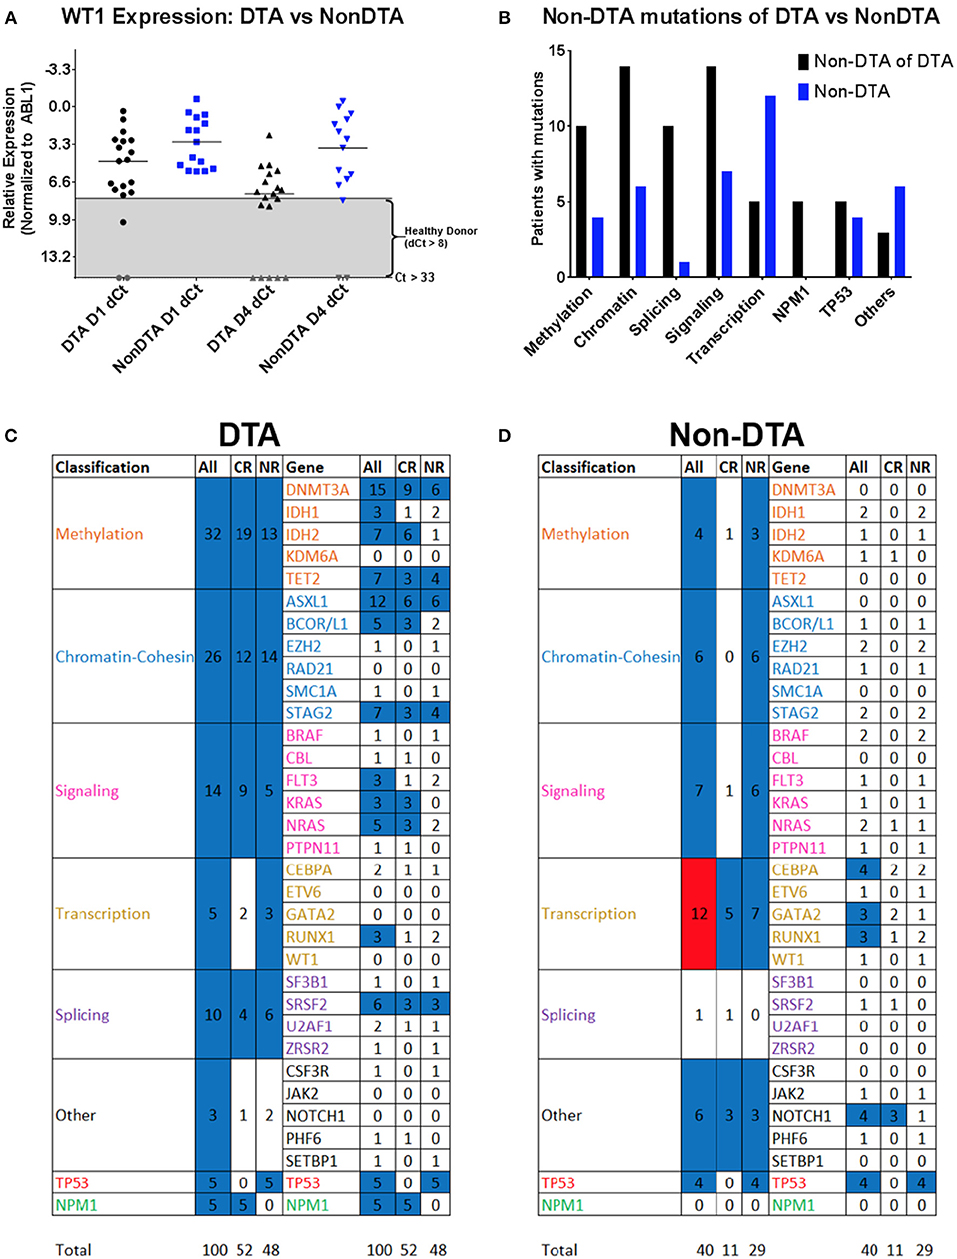
Figure 7. WT1 expression and gene variants in DTA and non-DTA patients. Patients were separated into groups based on detection of at least one DTA (DNMT3A, TET2, and ASXL1) mutation. The 34 genes in which variants were identified were classified into eight functional groups and Day 1 vs. 4 VAFs were analyzed with the Wilcoxon signed rank test. 162 coding variants were condensed into 140 by averaging the VAFs of multiple variants in the same gene in the same patient. The DTA group had 100 variants and the non-DTA group had 40 variants. (A) WT1 expression was higher in non-DTA patients compared to DTA patients. Out of the 34 patients with complete WT1 expression data, 19 patients were DTA patients and 15 were non-DTA. Here, non-DTA patients had higher relative WT1 expression than DTA patients at both D1 (median relative expression 3.07 compared to 4.75, P < 0.05) and D4 (median relative expression 3.59 compared to 7.60, P < 0.05). (B) Variants observed in DTA vs. non-DTA patients. NPM1 mutations were detected in DTA patients only and more DTA patients have variants in all functional gene groups compared to non-DTA patients except for transcription genes. (C,D) Heatmap of statistical significance between D1 vs. D4 VAFs of mutated genes in functional groups for both DTA and non-DTA patients. The “All Transcription” group in non-DTA patients was significant (P < 0.05, red) and NPM1, detected only in CR DTA patients, was marginally significant (blue, P = 0.0625). The remaining functional groups and individual genes were either nonsignificant (blue) or had too few data points to be analyzed (white). DTA, mutations in DNMT3A, TET2, or ASXL1; qPCR, quantitative real-time PCR; NGS: Targeted DNA sequencing. Gray, undetectable; Gray box indicates healthy donor range; VAF, variant allele frequency; CR, complete remission; NR, non-responder; DX, Day X.
Given the inability of targeted DNA sequencing of blood early during therapy to predict response to a cycle of intensive chemotherapy, we also investigated the utility of this technique in predicting post-remission relapse. Longitudinal blood samples were available from two patients from this cohort both of whom achieved CR. The first patient had no change in the ratios of wild type to mutated sequence of five genes between day 1 and 4 of therapy, despite decreasing WBC count from 60,000 to 10,000/μl during this period and subsequently achievement of a durable CR. Mutation levels remained negligible however during a durable remission lasting at least two years (Figure 8A). In the second patient, detectable KRAS mutant in blood decreased during the first 4 days of therapy while the DNMT3A mutant remained stable. During remission however both mutations were undetectable, returning at the time of relapse together with the emergence of a second KRAS mutation (Figure 8B).
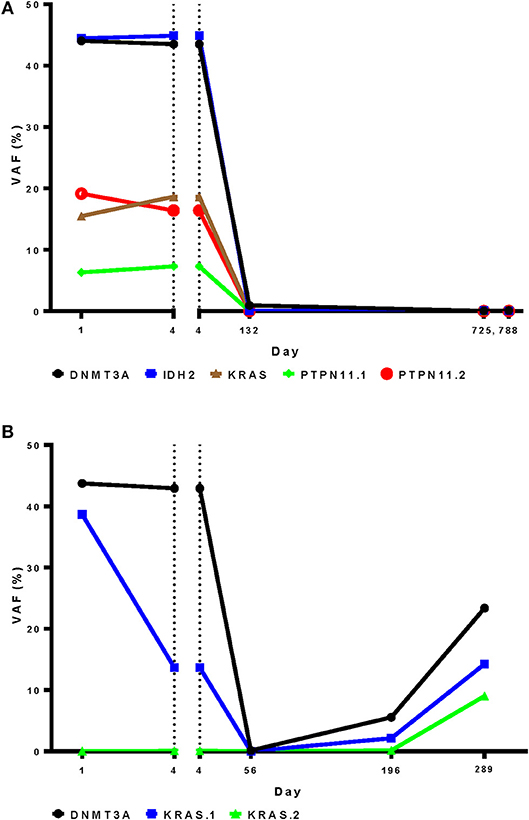
Figure 8. Targeted DNA sequencing for residual disease may be more informative after, rather than during, initial chemotherapy. A DNA sequencing panel customized to patient-specific variants was used to for analysis of longitudinal blood samples from during and after induction therapy in two patients who achieved complete remission. (A) Variant frequency was unchanged in the first patient between day 1 and 4 during therapy, despite achievement of a durable complete remission (B). In the second patient a DNMT3A variant changed little during therapy, in contrast to a KRAS variant that was markedly reduced. Relapse occurred on day 154. Both mutations were detected In blood from day 196 followed by the emergence of an second KRAS mutation on day 289. VAF, variant allele frequency.
In a subset of 22 patients confirmatory sequencing was also performed on pre-treatment bone marrow samples (10/10 NHLBI, 12/35 Duke). Concordance between the number of variants identified and the VAF of each detected variant in blood compared with bone marrow was assessed (Figure 9A). In the 15 patients with a pre-treatment WBC of at least 2,500/μl only a single variant identified from bone marrow was not detected from blood (of 41 variants identified in total, i. e., 98%). Notably, there was good correlation in the VAF determined for each variant from both tissue sources in these patients. Conversely, five variants were identified only from blood and not from bone marrow.
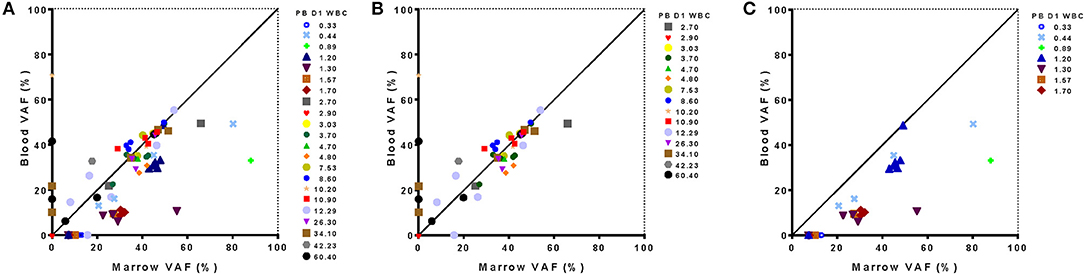
Figure 9. Relationship between sequence variants detected from blood and marrow samples in AML patients. Results of targeted DNA sequencing at day 1 of treatment show good concordance with outliers associated to extremes of white blood cell (WBC) count in blood. Variant allele frequency detected from in blood and marrow is shown for all 22 patients evaluated (A), just those patients with WBC >2,500/μl (B) or just those patients with WBC <2,500/μl in blood (C). Leukopenic patients had lower VAF in blood for variants identified from marrow. One patient had no detectable mutations in either blood or marrow. PB D1 WBC, White blood cell count in blood on Day 1; VAF, variant allele frequency.
Interestingly, the presence or absence of mutations in the blood vs. bone marrow was often correlated with WBC. Two patients with high pre-treatment WBC (34,100 and 60,400/μl) accounted for four of the five variants variants observed in the blood but not the bone marrow (Figure 9B). Likewise, for 7 patients with pre-treatment WBC <2,500/μl, only 20 out of a total of 27 variants detected in bone marrow were also detected from blood (74%), with the consequence that 5 of 7 leukopenic AML patients had an incomplete mutational characterization by DNA sequencing when using blood alone (Figure 9C). Those variants found in marrow but not identified in blood could however be identified in the raw sequencing data but were filtered out by the 5% VAF threshold for variant calling. For all 20 variants identified in both tissues the VAF was lower in blood than marrow in these leukopenic patients.
As we strive to personalize treatments to cancer patients, both in terms of the genetic basis of their cancer and their response to therapy, there is a great interest in earlier assessments of disease burden and characteristics (31, 32). Acute myeloid leukemia (AML) offers a unique opportunity to study the validity of blood-based assessments of residual tumor, as both the primary site of disease (bone marrow) and blood are repeatedly sampled as part of the clinical standard of care. It is increasingly recognized that blood, except in cases of leukopenia or low circulating blast count, may substitute for marrow examination in some circumstances for morphology, cytogenetics, and molecular testing in AML patients (33–35). We show here that blood, even after 3 days of intensive cytotoxic chemotherapy, can be used to identify most of the MDS/AML-associated DNA variants detectable by targeted sequencing in pre-treatment bone marrow aspirate, providing that pre-treatment white blood cell count was within or above normal range.
Complete remission is a necessary, but often insufficient, step toward long-term cure in AML. Given that the outcome of patients with relapsed and refractory AML is generally poor (36, 37) there is great interest in early interim assessments of likely response to optimize therapy in AML. While the role of bone marrow examination on day 14 of induction therapy remains unclear (35, 38–41), there has been considerable interest in kinetics of early blast clearance in blood during induction therapy as a prognostic factor (40, 42–44). Persistence of variants detected by targeted sequencing in AML patients in CR after treatment has significant independent prognostic value for both relapse and survival (6). It was therefore intriguing to consider if such molecular assessments, performed during cytotoxic therapy and prior to any response assessment, could offer a “real-time” evaluation of treatment efficacy and extremely early identification of treatment failure. We show that molecular testing of blood on treatment day 4, by either qPCR assessment of WT1 expression or DNA sequencing for common MDS/AML variants, is not predictive of clinical response to intensive cytotoxic therapy in AML. Surprisingly, all variants found by DNA sequencing in blood on day 1 remained detectable on the fourth day of intensive chemotherapy. Remarkably the ratio of mutated to wild-type sequence was often maintained during this therapy despite considerable reductions in white blood cell count. This finding of stability was not limited to potential germline mutants or to variants in DNMT3A, TET2, and ASXL1. The observed stability in VAF during cytotoxic therapy may suggest a limited therapeutic index for clones circulating in blood containing these mutations, although similar studies in patients receiving highly effective and specific therapy would be needed to prove this definitively. The kinetics of NPM1 and TP53 variant burden early during chemotherapy however did appear to exhibit consistent trends during therapy in this cohort and are markers potentially worthy of future study. Ultimately DNA sequencing may have greater utility for tracking of AML MRD post-treatment rather than predicting response during therapy.
This study has several limitations. Firstly, we did not perform germline sequencing to allow categorization of identified variants by DNA sequencing as somatic. This was intentional, given the translational nature of this study, we wished to replicate testing as commonly performed in clinical practice. Importantly germline mutations would not be expected to change during chemotherapy so they would not be informative for, or contribute to, variant kinetic analysis. Additionally, the majority of variants identified had a VAF of <40%, and 42 of 43 assessed patients had at least one variant with VAF <40% detectable in blood at baseline. Secondly, AML represents a wide range of myeloid malignancies with many patterns of genetic etiology whereas we used a targeted sequencing panel designed to detect just 49 commonly mutated genes or gene regions in MDS/AML (Table S3). While more comprehensive approaches have been used to characterize potential genetic variants associated with the leukemic clone that may be detectable before and after therapy (11), we felt assessment of the most recurrently observed mutated regions was most easily translatable. Finally, we demonstrate consistent observations in two independent cohorts, at two different stages of disease treated with different intensive chemotherapy regimens. Given the genetic heterogeneity of this disease however it is possible that larger cohorts of patients would identify additional trends and will certainly be needed to quantify any benefit associated with tracking the two targets, TP53 and NPM1, we identify as potential candidates for monitoring during intensive therapy.
In conclusion, our study demonstrates that molecular testing of peripheral blood during the first 3 days of AML intensive chemotherapy does not appear to be predictive of clinical response. Indeed, we show that the majority of variants identified prior to treatment are still present and often at similar ratios of mutant to wild-type often despite considerable cytotoxic effect of therapy. Validation in a larger cohort is needed to confirm the utility of monitoring NPM1 and TP53 variant kinetics in blood early during AML treatment in addition to their current use as pre-treatment predictive markers. Consistent with reports using other modalities we show that blood may substitute for bone marrow for targeted DNA sequencing in AML patients, although this approach may be suboptimal in those with leukopenia pre-treatment. Longitudinal assessment of molecular MRD during follow-up time points after completion of initial cytotoxic induction therapy may have greater clinical utility than evaluation of very early time points during AML treatment.
Ten subjects were recruited to clinical protocol (NCT02527447). All subjects gave written informed consent in accordance with the Declaration of Helsinki. The protocol was approved by the NHLBI IRB. Samples from thirty-five patients were collected on a Duke IRB approved protocol and transferred to NIH as coded clinically annotated samples via a material transfer agreement judged exempt from NIH IRB by the NIH OHSRP.
HW, AS, and CH, contributed conception and design of the study. HW, KL, SS, GR, MG, MM, JTa, and LD performed laboratory research. AS, SS, DR, NR, JTh, CD, KR, CL, and CH performed clinical research. HW and D-YK performed the statistical analysis. HW wrote the first draft of the manuscript. All authors contributed to manuscript revision, read, and approved the submitted version.
CH receives laboratory research funding from Merck and Sellas.
The remaining authors declare that the research was conducted in the absence of any commercial or financial relationships that could be construed as a potential conflict of interest.
This work was supported by the Intramural Research Program of the National Heart, Lung, and Blood Institute of, and grant 5KL2TR001115-03 from, the National Institutes of Health. We wish to acknowledge the assistance of Dr. Yuesheng Li and his team at the NHLBI Sequencing and Genomics Core, Dr. Yanqin Yang for bioinformatics support, Elena Cho, Therese Intrater, Sophie Grasmeder, Tat'Yana Worthy, and Debbie Draper for research nurse support, Dr. Qingguo Liu, Lemlem Alemu and Aasheen Qadri for laboratory technical support and to thank the clinical teams, regulatory staff, and patients at NIH and Duke.
The Supplementary Material for this article can be found online at: https://www.frontiersin.org/articles/10.3389/fonc.2018.00669/full#supplementary-material
1. Dohner H, Estey E, Grimwade D, Amadori S, Appelbaum FR, Buchner T, et al. Diagnosis and management of AML in adults: 2017 ELN recommendations from an international expert panel. Blood (2017) 129:424–47. doi: 10.1182/blood-2016-08-733196
2. Schuurhuis GJ, Heuser M, Freeman S, Bene MC, Buccisano F, Cloos J, et al. Minimal/measurable residual disease in AML: a consensus document from the European LeukemiaNet MRD Working Party. Blood (2018) 131:1275–91. doi: 10.1182/blood-2017-09-801498
3. Arber DA, Borowitz MJ, Cessna M, Etzell J, Foucar K, Hasserjian RP, et al. Initial diagnostic workup of acute leukemia: guideline from the College of American Pathologists and the American Society of Hematology. Arch Pathol Lab Med. (2017):1342–93. doi: 10.5858/arpa.2016-0504-CP
4. Hourigan CS, Karp JE. Minimal residual disease in acute myeloid leukaemia. Nat Rev Clin Oncol. (2013) 10:460–71. doi: 10.1038/nrclinonc.2013.100
5. Zhou Y, Othus M, Walter RB, Estey EH, Wu D, Wood BL. Deep NPM1 sequencing following allogeneic hematopoietic cell transplantation improves risk assessment in adults with NPM1-mutated AML. Biol Blood Marrow Transplant. (2018) 24:1615–20. doi: 10.1016/j.bbmt.2018.04.017
6. Jongen-Lavrencic M, Grob T, Hanekamp D, Kavelaars FG, Al Hinai A, Zeilemaker A, et al. Molecular minimal residual disease in acute myeloid leukemia. N Engl J Med. (2018) 378:1189–99. doi: 10.1056/NEJMoa1716863
7. Malmberg EB, Stahlman S, Rehammar A, Samuelsson T, Alm SJ, Kristiansson E, et al. Patient-tailored analysis of minimal residual disease in acute myeloid leukemia using next-generation sequencing. Eur J Haematol. (2017) 98:26–37. doi: 10.1111/ejh.12780
8. Gaksch L, Kashofer K, Heitzer E, Quehenberger F, Daga S, Hofer S, et al. Residual disease detection using targeted parallel sequencing predicts relapse in cytogenetically normal acute myeloid leukemia. Am J Hematol. (2018) 93:23–30. doi: 10.1002/ajh.24922
9. Morita K, Kantarjian HM, Wang F, Yan Y, Bueso-Ramos C, Sasaki K, et al. Clearance of somatic mutations at remission and the risk of relapse in acute myeloid leukemia. J Clin Oncol. (2018) 36:1788–97. doi: 10.1200/JCO.2017.77.6757
10. Rothenberg-Thurley M, Amler S, Goerlich D, Kohnke T, Konstandin NP, Schneider S, et al. Persistence of pre-leukemic clones during first remission and risk of relapse in acute myeloid leukemia. Leukemia (2018) 32:1598–608. doi: 10.1038/s41375-018-0034-z
11. Klco JM, Miller CA, Griffith M, Petti A, Spencer DH, Ketkar-Kulkarni S, et al. Association between mutation clearance after induction therapy and outcomes in acute myeloid leukemia. JAMA (2015) 314:811–22. doi: 10.1001/jama.2015.9643
12. Debarri H, Lebon D, Roumier C, Cheok M, Marceau-Renaut A, Nibourel O, et al. IDH1/2 but not DNMT3A mutations are suitable targets for minimal residual disease monitoring in acute myeloid leukemia patients: a study by the Acute Leukemia French Association. Oncotarget (2015) 6:42345–53. doi: 10.18632/oncotarget.5645
13. Dillon LW, Hayati S, Roloff GW, Tunc I, Pirooznia M, Mitrofanova A, et al. Targeted RNA-sequencing for the quantification of measurable residual disease in acute myeloid leukemia. Haematologica (2018). doi: 10.3324/haematol.2018.203133. [Epub ahead of print].
14. Thol F, Gabdoulline R, Liebich A, Klement P, Schiller J, Kandziora C, et al. Measurable residual disease monitoring by NGS before allogeneic hematopoietic cell transplantation in AML. Blood (2018) 132:1703–13. doi: 10.1182/blood-2018-02-829911
15. Hourigan CS, Gale RP, Gormley NJ, Ossenkoppele GJ, Walter RB. Measurable residual disease testing in acute myeloid leukaemia. Leukemia (2017) 31:1482–90. doi: 10.1038/leu.2017.113
16. Terwijn M, van Putten WL, Kelder A, van der Velden VH, Brooimans RA, Pabst T, et al. High prognostic impact of flow cytometric minimal residual disease detection in acute myeloid leukemia: data from the HOVON/SAKK AML 42A study. J Clin Oncol. (2013) 31:3889–97. doi: 10.1200/JCO.2012.45.9628
17. Ivey A, Hills RK, Simpson MA, Jovanovic JV, Gilkes A, Grech A, et al. Assessment of minimal residual disease in standard-risk AML. N Engl J Med. (2016) 374:422–33. doi: 10.1056/NEJMoa1507471
18. Freeman SD, Hills RK, Virgo P, Khan N, Couzens S, Dillon R, et al. Measurable residual disease at induction redefines partial response in acute myeloid leukemia and stratifies outcomes in patients at standard risk without NPM1 mutations. J Clin Oncol. (2018) 36:1486–97. doi: 10.1200/JCO.2017.76.3425
19. Buckley SA, Wood BL, Othus M, Hourigan CS, Ustun C, Linden MA, et al. Minimal residual disease prior to allogeneic hematopoietic cell transplantation in acute myeloid leukemia: a meta-analysis. Haematologica (2017) 102:865–73. doi: 10.3324/haematol.2016.159343
20. Araki D, Wood BL, Othus M, Radich JP, Halpern AB, Zhou Y, et al. Allogeneic hematopoietic cell transplantation for acute myeloid leukemia: time to move toward a minimal residual disease-based definition of complete remission? J Clin Oncol. (2016) 34:329–36. doi: 10.1200/JCO.2015.63.3826
21. Hourigan CS, Goswami M, Battiwalla M, Barrett AJ, Sheela S, Karp JE, et al. When the minimal becomes measurable. J Clin Oncol. (2016) 34:2557–8. doi: 10.1200/JCO.2016.67.6395
22. Cilloni D, Renneville A, Hermitte F, Hills RK, Daly S, Jovanovic JV, et al. Real-time quantitative polymerase chain reaction detection of minimal residual disease by standardized WT1 assay to enhance risk stratification in acute myeloid leukemia: a European LeukemiaNet study. J Clin Oncol. (2009) 27:5195–201. doi: 10.1200/JCO.2009.22.4865
23. Goswami M, Hensel N, Smith BD, Prince GT, Qin L, Levitsky HI, et al. Expression of putative targets of immunotherapy in acute myeloid leukemia and healthy tissues. Leukemia (2014) 28:1167–70. doi: 10.1038/leu.2014.14
24. Goswami M, McGowan KS, Lu K, Jain N, Candia J, Hensel NF, et al. A multigene array for measurable residual disease detection in AML patients undergoing SCT. Bone Marrow Transplantat. (2015) 50:642–51. doi: 10.1038/bmt.2014.326
25. Cancer Genome Atlas Research Network, Ley TJ, Miller C, Ding L, Raphael BJ, Mungall AJ, et al. Genomic and epigenomic landscapes of adult de novo acute myeloid leukemia. N Engl J Med. (2013) 368:2059–74. doi: 10.1056/NEJMoa1301689
26. Papaemmanuil E, Gerstung M, Bullinger L, Gaidzik VI, Paschka P, Roberts ND, et al. Genomic classification and prognosis in acute myeloid leukemia. N Engl J Med. (2016) 374:2209–21. doi: 10.1056/NEJMoa1516192
27. Genovese G, Kahler AK, Handsaker RE, Lindberg J, Rose SA, Bakhoum SF, et al. Clonal hematopoiesis and blood-cancer risk inferred from blood DNA sequence. N Engl J Med. (2014) 371:2477–87. doi: 10.1056/NEJMoa1409405
28. Zink F, Stacey SN, Norddahl GL, Frigge ML, Magnusson OT, Jonsdottir I, et al. Clonal hematopoiesis, with and without candidate driver mutations, is common in the elderly. Blood (2017) 130:742–52. doi: 10.1182/blood-2017-02-769869
29. Shlush LI. Age-related clonal hematopoiesis. Blood (2018) 131:496–504. doi: 10.1182/blood-2017-07-746453
30. Jaiswal S, Fontanillas P, Flannick J, Manning A, Grauman PV, Mar BG, et al. Age-related clonal hematopoiesis associated with adverse outcomes. N Engl J Med. (2014) 371:2488–98. doi: 10.1056/NEJMoa1408617
31. Ravandi F, Walter RB, Freeman SD. Evaluating measurable residual disease in acute myeloid leukemia. Blood Adv. (2018) 2:1356–66. doi: 10.1182/bloodadvances.2018016378
32. Grimwade D, Freeman SD. Defining minimal residual disease in acute myeloid leukemia: which platforms are ready for “Prime Time”? Blood (2014) 124:3345–55. doi: 10.1182/blood-2014-05-577593.
33. Weinkauff R, Estey EH, Starostik P, Hayes K, Huh YO, Hirsch-Ginsberg C, et al. Use of peripheral blood blasts vs bone marrow blasts for diagnosis of acute leukemia. Am J Clin Pathol. (1999) 111:733–40. doi: 10.1093/ajcp/111.6.733
34. Tong WG, Sandhu VK, Wood BL, Hendrie PC, Becker PS, Pagel JM, et al. Correlation between peripheral blood and bone marrow regarding FLT3-ITD and NPM1 mutational status in patients with acute myeloid leukemia. Haematologica (2015) 100:e97–8. doi: 10.3324/haematol.2014.118422
35. Percival ME, Lai C, Estey E, Hourigan CS. Bone marrow evaluation for diagnosis and monitoring of acute myeloid leukemia. Blood Rev. (2017) 31:185–92. doi: 10.1016/j.blre.2017.01.003
36. Breems DA, Van Putten WL, Huijgens PC, Ossenkoppele GJ, Verhoef GE, Verdonck LF, et al. Prognostic index for adult patients with acute myeloid leukemia in first relapse. J Clin Oncol. (2005) 23:1969–78. doi: 10.1200/JCO.2005.06.027
37. Ramos NR, Mo CC, Karp JE, Hourigan CS. Current approaches in the treatment of relapsed and refractory acute myeloid leukemia. J Clin Med. (2015) 4:665–95. doi: 10.3390/jcm4040665
38. Morris TA, DeCastro CM, Diehl LF, Gockerman JP, Lagoo AS, Li Z, et al. Re-induction therapy decisions based on day 14 bone marrow biopsy in acute myeloid leukemia. Leukemia Res. (2013) 37:28–31. doi: 10.1016/j.leukres.2012.09.016
39. Hussein K, Jahagirdar B, Gupta P, Burns L, Larsen K, Weisdorf D. Day 14 bone marrow biopsy in predicting complete remission and survival in acute myeloid leukemia. Am J Hematol. (2008) 83:446–50. doi: 10.1002/ajh.21133
40. Yanada M, Borthakur G, Ravandi F, Bueso-Ramos C, Kantarjian H, Estey E. Kinetics of bone marrow blasts during induction and achievement of complete remission in acute myeloid leukemia. Haematologica (2008) 93:1263–5. doi: 10.3324/haematol.12825
41. Yezefski T, Xie H, Walter R, Pagel J, Becker PS, Hendrie P, et al. Value of routine ‘day 14’ marrow exam in newly diagnosed AML. Leukemia (2015) 29:247–9. doi: 10.1038/leu.2014.268
42. Kern W, Haferlach T, Schoch C, Loffler H, Gassmann W, Heinecke A, et al. Early blast clearance by remission induction therapy is a major independent prognostic factor for both achievement of complete remission and long-term outcome in acute myeloid leukemia: data from the German AML Cooperative Group (AMLCG) 1992 Trial. Blood (2003) 101:64–70. doi: 10.1182/blood-2002-02-0532
43. Gianfaldoni G, Mannelli F, Baccini M, Antonioli E, Leoni F, Bosi A. Clearance of leukaemic blasts from peripheral blood during standard induction treatment predicts the bone marrow response in acute myeloid leukaemia: a pilot study. Br J Haematol. (2006) 134:54–7. doi: 10.1111/j.1365-2141.2006.06100.x
Keywords: acute myeloid leukemia (AML), MRD, remission, measurable residual disease (MRD), WT1 = Wilms tumor 1, somatic mutations in cancer, Next Gen Sequencing (NGS)
Citation: Wong HY, Sung AD, Lindblad KE, Sheela S, Roloff GW, Rizzieri D, Goswami M, Mulé MP, Ramos NR, Tang J, Thompson J, DeStefano CB, Romero K, Dillon LW, Kim D-Y, Lai C and Hourigan CS (2019) Molecular Measurable Residual Disease Testing of Blood During AML Cytotoxic Therapy for Early Prediction of Clinical Response. Front. Oncol. 8:669. doi: 10.3389/fonc.2018.00669
Received: 02 October 2018; Accepted: 18 December 2018;
Published: 15 January 2019.
Edited by:
Sara Galimberti, University of Pisa, ItalyReviewed by:
Leland Metheny, University Hospitals of Cleveland, United StatesThis work is authored by Wong, Sung, Lindblad, Sheela, Roloff, Rizzieri, Goswami, Mulé, Ramos, Tang, Thompson, DeStefano, Romero, Dillon, Kim, Lai and Hourigan on behalf of the U.S. Government and, as regards Wong, Sung, Lindblad, Sheela, Roloff, Rizzieri, Goswami, Mulé, Ramos, Tang, Thompson, DeStefano, Romero, Dillon, Kim, Lai and Hourigan, and the U.S. Government, is not subject to copyright protection in the United States. Foreign and other copyrights may apply. This is an open-access article distributed under the terms of the Creative Commons Attribution License (CC BY). The use, distribution or reproduction in other forums is permitted, provided the original author(s) and the copyright owner(s) are credited and that the original publication in this journal is cited, in accordance with accepted academic practice. No use, distribution or reproduction is permitted which does not comply with these terms.
*Correspondence: Christopher S. Hourigan, aG91cmlnYW5AbmloLmdvdg==
†These authors have contributed equally to this work
Disclaimer: All claims expressed in this article are solely those of the authors and do not necessarily represent those of their affiliated organizations, or those of the publisher, the editors and the reviewers. Any product that may be evaluated in this article or claim that may be made by its manufacturer is not guaranteed or endorsed by the publisher.
Research integrity at Frontiers
Learn more about the work of our research integrity team to safeguard the quality of each article we publish.