 Jiahui Zhang1
 Pingzhao Hu
- 1Division of Biostatistics, Dalla Lana School of Public Health, University of Toronto, Toronto, ON, Canada
- 2Department of Community Health Science, Rady Faculty of Health Sciences, Max Rady College of Medicine, University of Manitoba, Winnipeg, MB, Canada
- 3School of Public Health, Fudan University, Shanghai, China
- 4Department of Biostatistics, Princess Margaret Cancer Centre, Toronto, ON, Canada
- 5Department of Biochemistry and Medical Genetics, Faculty of Health Sciences, College of Medicine, University of Manitoba, Winnipeg, MB, Canada
- 6Research Institute in Oncology and Hematology, Winnipeg, MB, Canada
Background: Non-hodgkin lymphoma (NHL) is one of the most common and deadly cancers. There is limited analysis of gene-environment interactions for the risk of NHL. This study intends to explore the interactions between genetic variants and environmental factors, and how they contribute to NHL risk.
Methods: A case-control study was performed in Shanghai, China. The cases were diagnosed between 2003 and 2008 with patients aged 18 years or older. Samples and SNPs which did not satisfy quality control were excluded from the analysis. Weighted and unweighted genetic risk scores (GRS) and environmental risk scores were generated using clustering analysis algorithm. Univariate and multivariable logistic regression analyses were conducted. Moreover, genetics and environment interactions (G × E) were tested on the NHL cases and controls.
Results: After quality control, there are 22 SNPs, 11 environmental variables and 5 demographical variables to be explored. For logistic regression analyses, 5 SNPs (rs1800893, rs4251961, rs1800630, rs13306698, rs1799931) and environmental tobacco smoking showed statistically significant associations with the risk of NHL. Odds ratio (OR) and 95% confidence interval (CI) was 10.82 (4.34–28.88) for rs13306698, 2.84 (1.66–4.95) for rs1800893, and 2.54 (1.43–4.58) for rs4251961. For G × E analysis, the interaction between smoking and dichotomized weighted GRS showed statistically significant association with NHL (OR = 0.23, 95% CI = [0.09, 0.61]).
Conclusions: Several genetic and environmental risk factors and their interactions associated with the risk of NHL have been identified. Replication in other cohorts is needed to validate the results.
Introduction
NHL is the eighth most frequent type of cancers in men and the eleventh in women worldwide (1). American Cancer Society estimates that 74,680 people will be diagnosed with NHL, and 19,910 NHL deaths will occur in 2018 (2). Canadian Cancer Society estimates that 8,300 people will be diagnosed with NHL, and 2,700 will die from the disease (3). Studies showed that the overall incidence rate has increased for both males and females from 1973 to 2010 in Shanghai, China (4, 5).
NHL occurs more often in males than in females. It is most frequently diagnosed in the 65–74 age group. The known risk factors for developing NHL include weakened immune system, previous cancer treatment; such as radiation therapy and chemotherapy, hepatitis C virus (HCV) and hepatitis B virus (HBV) infection (6). Some possible causes of NHL disease might include chemical exposure and medical treatments (7). Environmental risk factors, such as experience of benzene exposure that exceeds 810 days, daily welding and activity of radio operator, were associated with NHL from a previous case- control study taken place in France (8).
Genetic factors were also associated with the risk of NHL. For example, a hospital-based study conducted in China showed that rs1800893 in IL-10, rs4251961 in IL-1RN, rs1800630 in TNF- a and rs2229094 in TNF- a had association with an increased risk of overall NHL (4). Another genome-wide association study (GWAS) in a Chinese population showed two SNPs (rs872071 in IRF4 and rs2647012 in HLA class II) were associated with increased risk of NHL (9). Previous studies found that environmental factors and genetic variants interaction may affect risk of complex diseases (10, 11). A U.S. study suggested that usage of hair dye before 1980 increased the risk of NHL due to genetic variation in NAT1 and NAT2 genes (12). A G × E interaction analysis conducted by Gathany et al. suggested that sun exposure and sensitivity increased risk of NHL, which is interceded by IRF 4 (13). A more subtype specific study suggested several statistically significant interaction terms between risk factors and gene (14). This study focused on statistical analysis of genetic and environmental factors and their interactions with the risk of NHL. Previous research of NHL had examined the association between genetic variants in some candidate genes and the risk of NHL in Shanghai, China [e.g., (4)]. We conducted this study to gain new insight into the G × E effect on the risk of NHL.
Method
The data analysis flow is shown in Figure 1. Below we briefly summarized each of the analysis steps.
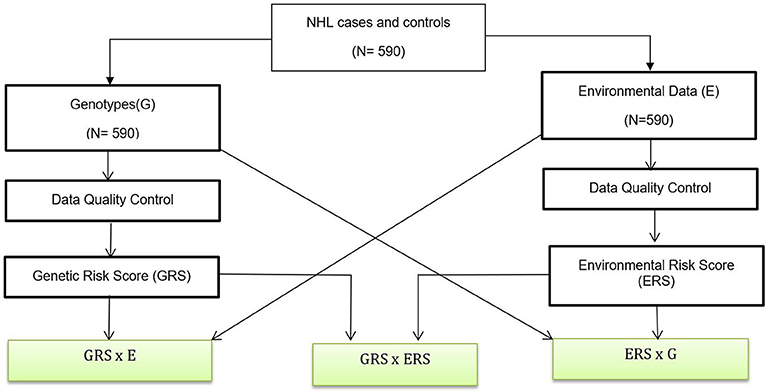
Figure 1. Data Analysis Flow. A genetic association analysis with 590 NHL and control participants and their biological samples were gathered. Data quality control are performed for both genotypes and environmental variables. We also created GRSs and ERS for interaction analysis. Boxes with green fill are interaction analysis.
Study Samples
The participants in this study were from Shanghai, China. This study included 169 NHL cases and 421 controls. NHL patients in this longitudinal population-based study were diagnosed in a span of 5 years (from 2003 to 2008) and were aged 18 years or older. Controls were randomly recruited from the same hospital in Shanghai, China, and matched by age and gender group frequency of cases (4). Those controls with cancers or non-malignant lymphatic or hematopoietic diseases, or having family connections to the samples were excluded. Each participant completed a questionnaire containing various questions which formed the environmental variables used in the study. Peripheral blood, bone marrow aspirates, tissue and core biopsies of the subjects were collected and sent to the laboratory for analyses. RFLP (Restriction Fragment Length Polymorphism) was used for DNA genotyping of the blood samples on an ABI 7900HT sequence detection system at the State Key Laboratory of Genetics in Fudan University, China. This study has been approved by the Ethical Review Committee of Fudan University in China. Informed consent was obtained from all individual participants in the study.
Environmental and Genetic Data Quality Control
Quality control analysis was performed for environmental and genetic variables, which are detailed below. PLINK tool was used to perform genetic data quality control and genetic association analysis (15). R programming tool was used to perform all the environmental and other demographical and epidemiological data quality control and other association analyses (16).
Hardy-Weinberg Equilibrium (HWE) Check
The deviation of HWE can indicate genotyping errors. HWE test had been applied to the control group (17). The p-value threshold was 0.0001, which means the SNPs with p-value of HWE test <0.0001 were excluded for the follow-up analysis.
SNP Missing Rate Check
SNP missing rate is defined as the number of missing genotypes divided by the total number of participants in the study. SNPs with high missing rate might cause higher false positive rate. Therefore, we removed SNPs with missing rate higher than 0.1 from the study.
Environment Data Quality Control
For environmental variables, we mainly focused on 21 variables that are potentially relevant to NHL (4). In this analysis, environmental variables with missing rate higher than 0.05 were excluded. For categorical variables, we used chi-square test to evaluate the significance of the association between each variable and NHL outcomes. For continuous variables, we used t-test and Wilcoxon test to assess the significance of the association between each variable and NHL outcomes.
Statistical Methods
We summarized environmental variables for all samples, case group and control group. For continuous variables; mean, standard deviation, median, range, and missing number were displayed. For categorical variables, frequency and proportion were presented. When calculating proportion of each variable, we did not include missing number (Table 1). Two-sided test was used and significance level was set as 0.05. Benjamini and Hochberg (BH) procedure was applied to adjust for multiple comparisons (18). Logistic regression analysis was implied to calculate OR and corresponding 95% confidence interval (19).
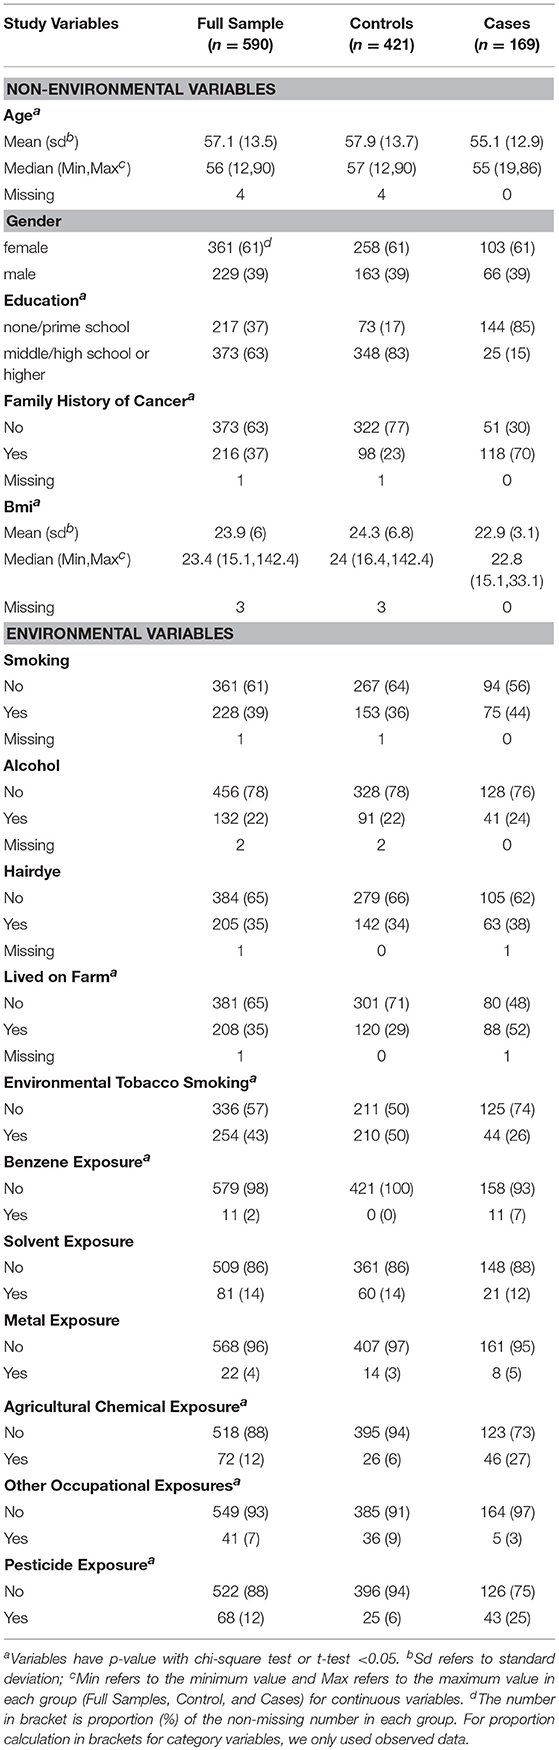
Table 1. Characteristics of NHL Cases and Controls.
Univariate and Multivariable Logistic Regression Analyses
For the univariate SNP-based association analysis, we coded genotypes into numeric values using an additive genetic model (20). We applied the Cochran-Armitage trend test and then adjusted p-values using BH multiple testing (21).
To evaluate the association between NHL risk and each environmental variable, univariate logistic regression model was first performed (20).
where β0 represented the intercept term, βx referred to the effect of each environmental variable, X was each environmental variable.
Multivariable logistic regression model was also implemented for each environmental variable or SNP by adjusting age, gender, education, family history of cancer, and body mass index as a prior (4).
where β1, β2, β3, β4, β5 were regression coefficient for age, gender, education, family history (fh) of NHL and BMI; X was each environmental variable or SNP. P-values of βx were adjusted using BH method.
Interaction Analysis Between Environment Risk Score With SNPs
Following the idea of Park et al. (22), we generated an environmental risk score (ERS) as a new variable using the clustering method implemented in blockcluster R package (23). Block Clustering is a data mining technique. It groups samples into different clusters. Samples in the same group/cluster are more similar than in other groups. In this analysis, we focused on the semi-supervised coclusterBinary algorithm which analyzes the binary variables and simultaneously clusters both variables and study samples. It applied conditional expectation maximization (CEM) to estimate the unknown parameters. Since it is a semi-supervised clustering approach, a label is needed to be assigned to each binary environmental variable. To do this, we coded each given environmental variable with label 1 if its odds ratio is larger than 1 in the logistic regression analysis based on Formula (1). Otherwise, it is coded as 0. The clustering procedure will assign each of the environmental variables into environmental risk group or non- environmental risk group.
We performed the interaction analysis between the ERS with each of the SNPs with and without adjusting age, gender, education, family history of NHL, and body mass index (BMI) (24) as shown in Formula (3):
β0 represented the intercept term; βERS, βsnp referred to the regression coefficients for ERS and each SNP, respectively; β1, β2, β3, β4, β5 were regression coefficient for age, gender, education, family history of NHL and BMI; βint was the regression coefficient for the interaction term of ERS and SNP; P-values of βint were adjusted using BH multiple testing method.
Interaction Analysis Between Environmental Variables With GRS
We generated weighted and unweighted genetic risk scores (GRS) based on the 22 SNPs, respectively. We used the “riskScore” function in PredictABEL R package to calculate the GRS (25). Briefly speaking, a univariate logistic regression model was fitted for each SNP. Unweighted GRS (U_GRS) of a given sample was the sum of risk alleles across all 22 SNPs. Weighted GRS (W_GRS) of a given sample was the number of risk alleles rescaled by its relative effect size (regression coefficient in the logistic regression model). We dichotomized these two GRSs (W_GRS and U_GRS) based on their median. If a sample had a GRS greater than the median of GRS, we assigned 1 to the sample. Otherwise, we assigned 0 to the sample.
We performed interaction analysis between the dichotomized GRSs with each of the environmental variables with and without adjusting age, gender, education, family history of NHL and body mass index; as shown in Formula (4):
where βGRS referred to the regression coefficient for dichotomized unweighted/weighted GRS; E was an environment variable; βint was the regression coefficient for the interaction term of GRS and environmental variable (E). P-values of βint were adjusted using BH method.
Results
Data Quality Control and Characteristics of Variables
In this study, we focused on 21 environmental and non-environmental variables from our previous study (4). Five variables, including smok100 (smoked more than 100 cigarettes), NOEH3 (age started smoking), smok_num (Average smoked number of cigarettes per day), voltage exposure and radiation exposure were removed from the study as they exhibited a missing rate larger than 0.05. A total of sixteen variables were left for follow-up analysis. These included 5 non-environmental variables and 11 environmental variables. Table 1 shows the comparison of characteristics of these variables in this study. Smoking status, drink alcohol, and dye hair were similarly distributed in cases and controls. Cases were less educated and more prone to environmental and occupational exposures, such as living on farm, experience of environmental tobacco smoking, benzene exposure, agricultural chemical exposure, and pesticide exposure (4). Family history of cancer was significantly associated with risk of NHL in this study. Therefore, the five non-environmental variables [sex, age, education, family history of cancer, and body mass index (BMI)], named as covariates, were adjusted in our multivariable logistic regression analysis.
Table 2 lists the result of logistic regression analyses with and without adjusting the five covariates for each of the 11 environmental variables. For univariate analysis, five environmental variables (living on farm, environmental tobacco smoking, agricultural chemical exposure, other occupational exposure and pesticide exposure), showed significant association with NHL. Four (living on farm, environmental tobacco smoking, agricultural chemical exposure, and pesticide exposure) of the five environmental variables showed statistically significance after adjusting multiple testing by BH method. For multivariable logistic analysis, three environmental variables (hair dying, environmental tobacco smoking and pesticide exposure) showed statistically significance with risk of NHL. Two (hair dying and environmental tobacco smoking) of the three environmental variables from multivariable logistic analysis presented significant p-values after multiple testing adjustment by BH method. Figure 2 shows the odds ratio and 95% confidence interval for each environmental variable with the risk of NHL. Agricultural chemical exposure (OR = 5.68, 95% CI = 3.4–9.69) and pesticide exposure (OR = 5.41, 95%CI = 3.2–9.31) were associated with an increased risk of NHL.
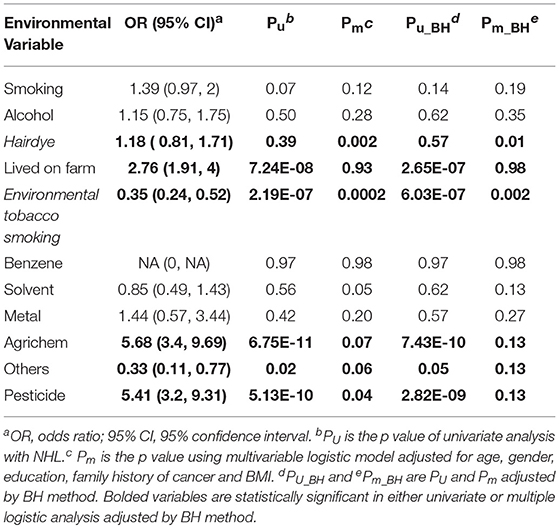
Table 2. Associations between environmental variables and NHL risk.
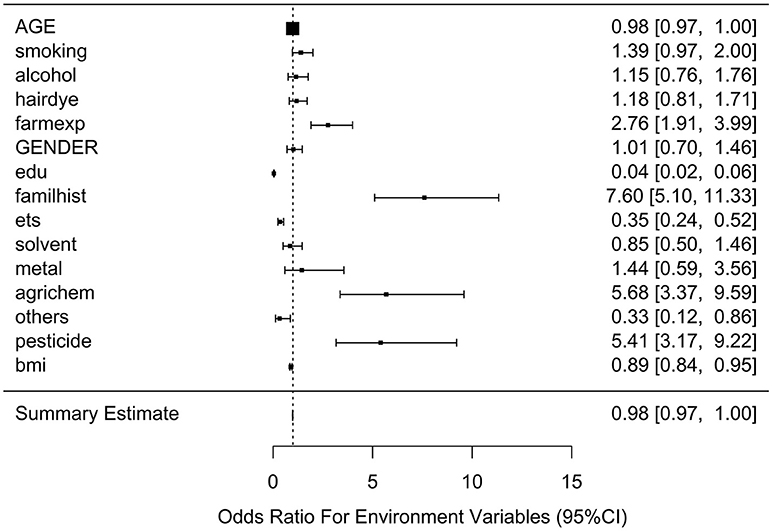
Figure 2. Odds ratios (95% confidence intervals) of risk of NHL for each environmental variable.
SNP Data Quality Control and Association Analysis
There are 29 SNPs genotyped for the study. Three SNPs, rs1051740, rs1346044, and rs2227973 were removed from the further analysis as they presented a Hardy-Weinberg Equilibrium (HWE) test P-value <0.0001 in control group. Four SNPs rs2229094, rs1799930, rs915906, and rs13181 were removed from the analysis as their missing rates were higher than 0.1.
Table 3 shows the associations between gene SNPs and NHL risk. Five SNPs (rs1800893, rs4251961, rs1800630, rs13306698, and rs1799931) showed statistically significance in both univariate and multivariable logistic analyses after adjusting multiple testing by BH method. Table 3 and Figure 3 show the odds ratio and 95% confidence interval for each SNP. rs13306698 featured the highest odds ratio and 95% confidence interval (OR = 10.82, 95% CI = 4.34–28.88); it was associated with an increased risk of NHL. rs1800893 (OR = 2.84, 95% CI = 1.66–4.95) and rs4251961(OR = 2.54, 95% CI = 1.43–4.58) also showed that they have significant association with an increased risk of NHL.
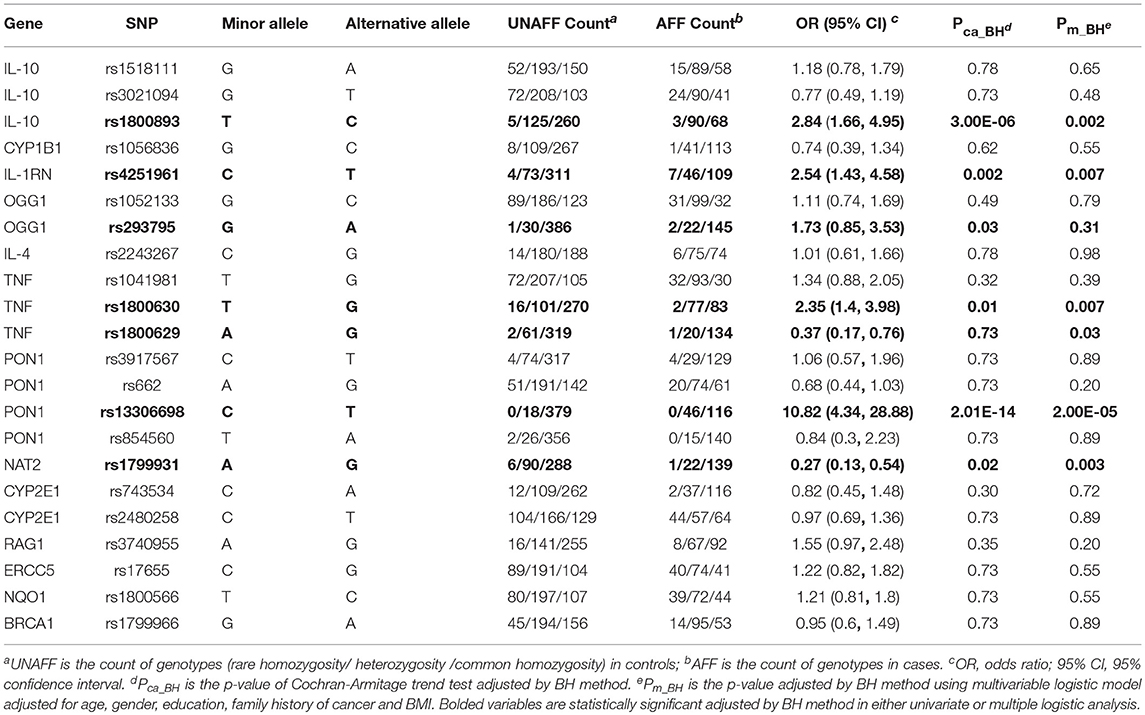
Table 3. Associations between SNPs and NHL risk.
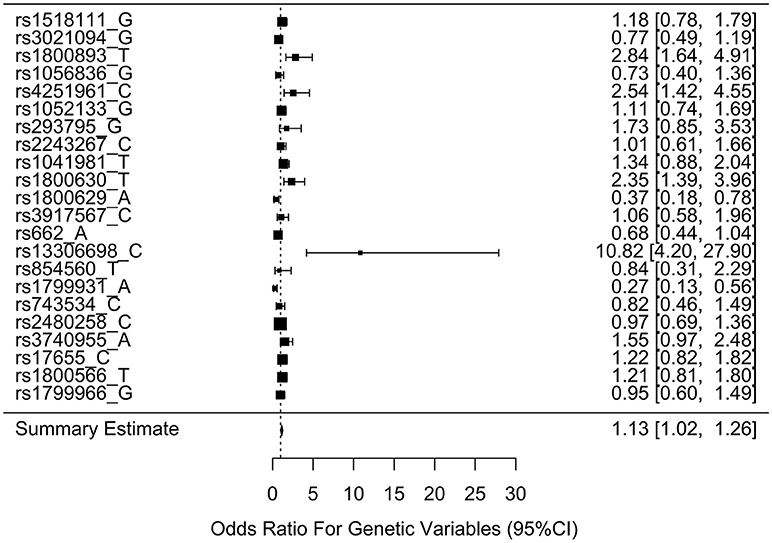
Figure 3. Odds ratios (95% confidence intervals) of risk of NHL for each SNP. This is based on the results from Table 3.
Gene and Environment Interaction Analysis
We generated ERS using the block cluster method. Table 4 shows the interaction analysis between the ERS and each SNP. rs1799931 showed significant nominal p-value for interaction analysis after adjusting the five covariates, but no significant p-values after adjusting multiple testing. For the most significant SNP rs1799931 and interaction with ERS, Figure 4 shows the frequencies of its genotypes (rare homozygosity/ heterozygosity /common homozygosity) in the environmental risk group (ERS = 1) compared with the non-environmental risk group (ERS = 0). As shown in the figure, the frequencies of the common homozygosity GG in the environmental risk group was much higher than frequencies in the non- environmental risk group.
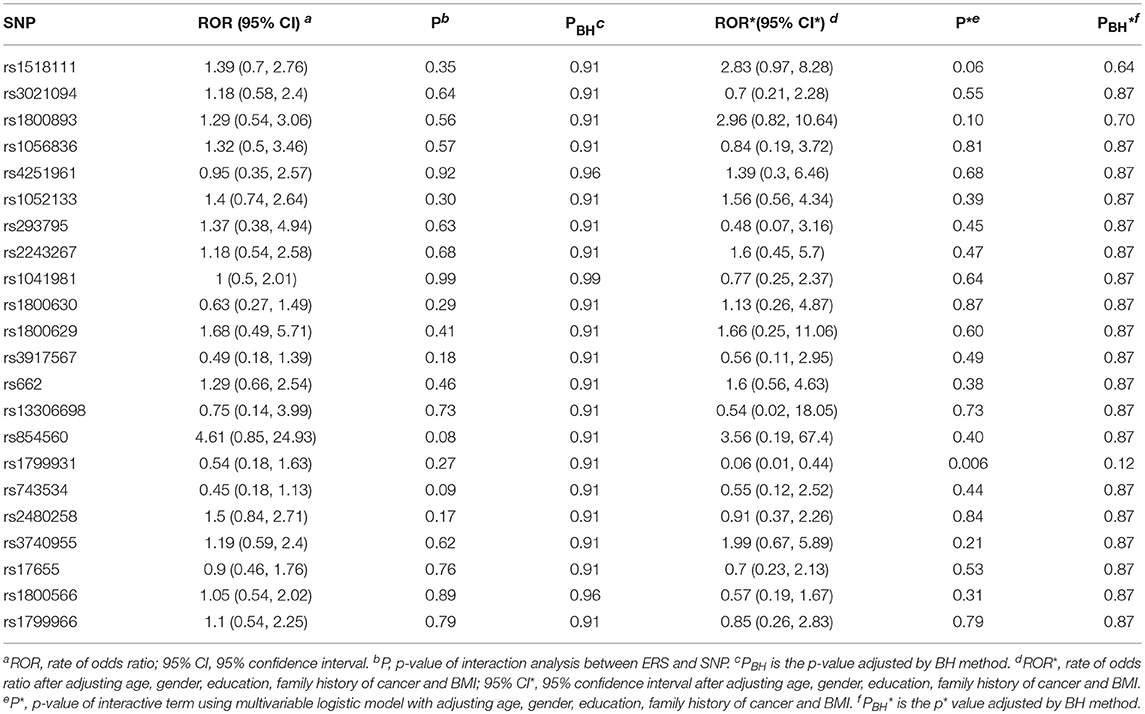
Table 4. Interaction analysis between the environmental risk score variable and each SNP.
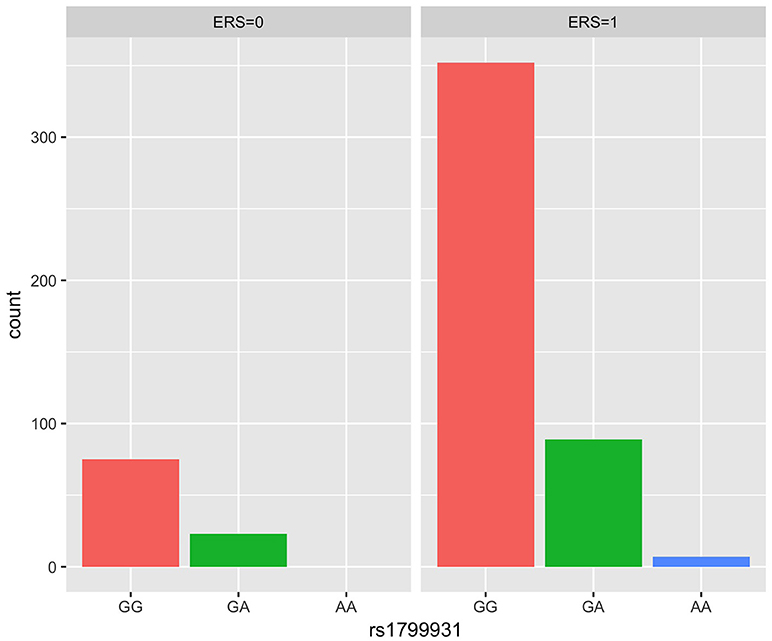
Figure 4. Frequency of genotype plot of rs1799931 in environmental risk group (ERS = 1) and non-environmental risk group (ERS = 0). Frequency of genotypes GG is shown in red, GA is shown in green and AA is shown in blue.
Supplementary Figures 1, 2 show rates of odds ratio with and without adjusting the 5 covariates. With the five covariates adjusted in the logistic regression analysis, the interaction of ERS and rs1799931 presented the lowest rate of odds ratio (ROR = 0.06, 95% CI = 0.01–0.44); it was associated with a decrease risk of NHL. As observed from these two figures, the interaction of ERS and rs854560 yielded the highest ratio of odds ratio (ROR = 4.61, 95% CI = 0.85–24.93; ROR* = 3.56, 95% CI* = 0.19–67.4); it was associated with an increased risk of NHL.
After generating the environmental risk variable, we generated weighted and unweighted GRSs. Figure 5 shows the distributions of the two GRSs comparing the case and control groups. The median of unweighted GRS was much larger than the weighted GRS. For both GRSs, median and quantiles in the case group was higher than those in the control group. Table 5 shows the interaction analysis between individual environmental variable and the dichotomized weighted GRS. The interaction of dichotomized weighted GRS and smoking showed significant nominal p-value for both with and without adjusting the five covariates (P = 0.003; P* = 0.02). After adjusting for multiple testing, the interaction of GRS and smoking still showed significant association with NHL (PBH = 0.035). Figures 6, 7 show rates of odds ratio with and without adjusting the 5 covariates. The interaction of GRS and smoking presents the lowest rate of odds ratio (ROR = 0.23, 95% CI = 0.09–0.61).
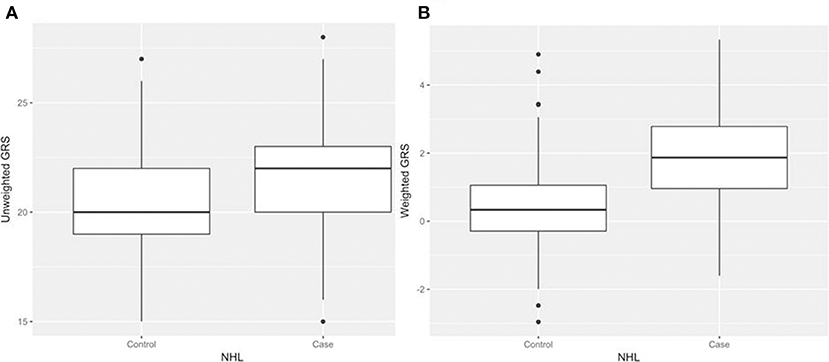
Figure 5. Boxplots of genetic risk scores (GRSs) in control and case groups respectively. (A) unweighted GRSs (B) and weighted GRSs.
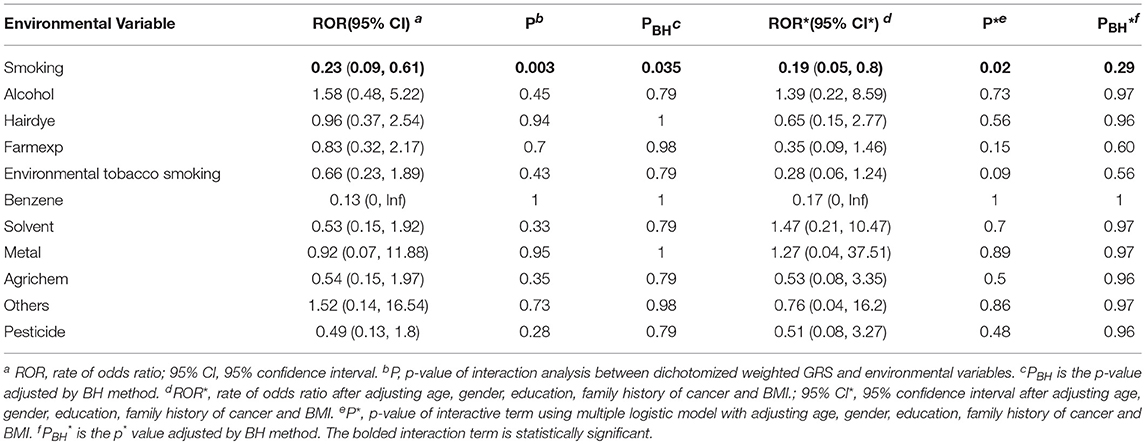
Table 5. Interaction analysis between each environmental variable and weighted GRS.
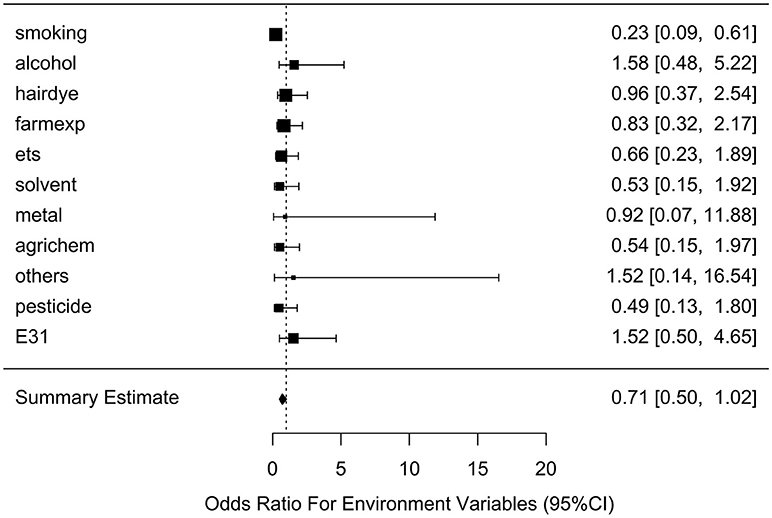
Figure 6. Ratio of Odds ratios (95% confidence intervals) of risk of NHL based on unadjusted models. This is based on the results from Table 5. The environmental variable benzene has not been included due big odds ratio. Models are not adjusted for age, gender, education, family history of cancer and BMI. E31 is environmental risk score (ERS).
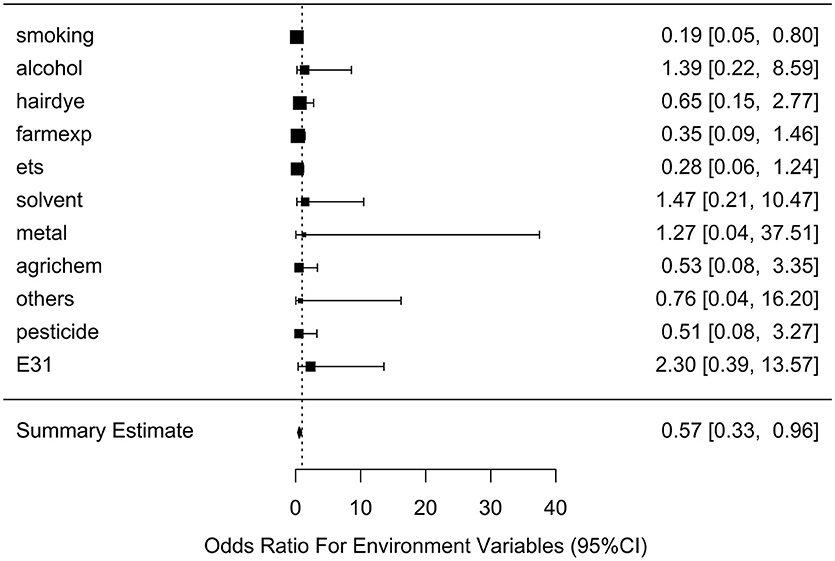
Figure 7. Ratio of Odds ratios (95% confidence intervals) of risk of NHL based on adjusted models. This is based on the results from Table 5. The environmental variable benzene has not been included due big odds ratio. Models are adjusted for age, gender, education, family history of cancer and BMI. E31 is environmental risk score (ERS).
Interaction analysis result between individual environmental variable and the dichotomized weighted GRS is shown in Supplement Table 1. GRS and ERS interaction analysis result is shown in Supplement Table 2. Both do not have statistical significance.
Discussion
Our previous study has shown that SNPs in immune-regulatory genes (IL-10 and TNF) are significantly associated with the risk of NHL (4) in a Chinese population in Shanghai. The current study mainly focused on the effect of gene and environment interactions on the risk of NHL. For the gene and environment interaction analysis without adjusting the five covariates, we observed that the interaction of smoking and weighted GRS has statistically significant association with NHL. However, smoking did not show directly significant association with the risk of NHL in univariate or multivariable logistic models. We did not observe other environmental variables that interacted with GRS to affect the risk of NHL.
NHL is a cancer of immune system. It is well-known that immune deficiency is one of a few well-established risk factors for NHL. For example, polymorphisms in the promoter region of the TNF gene and the IL-10 were reported to be associated with increased NHL risk, and particularly increased DLBCL risk (4, 26–29). However, the specific immune mechanisms responsible remain unresolved. As we know, immunologic response is often driven by specific environmental agents that are influenced by inherited human genetic variation. Previous studies have shown a strong effect of smoking on immune system. For example, cigarette smoke was shown to augment the production of numerous pro-inflammatory cytokines such as TNF (30, 31) and to decrease the levels of anti-inflammatory cytokines such as IL-10 (32). Although previous study (33) and our study have not found a significant association between cigarette smoking and the risk of NHL, our joint interaction analysis of the genetic variants and smoking showed a significant association with the risk of NHL. This suggests that the effect of environmental factors, such as smoking, on the risk of NHL may be modified by single nucleotide variants, which may change immunoregulatory gene functions and therefore influence NHL risk through the immunoregulation pathways critical for lymphomagenesis.
This study features some limitations. One limitation is the sample size, which may influence the statistical power (34). Appropriately large sample size can provide precise estimation of unknown parameters. Small sample size may weaken the internal and external validity of study (35). The other limitation is that all participants (both cases and controls) are from the same hospital, which may influence our analysis and result. Further studies can be conducted using matched healthy individuals as controls. This study showed several significant associations between SNPs, environmental risk factors, gene and environment interaction, and risk of NHL. We need to replicate the results in other independent cohorts. In the future we can explore other methods when performing gene and environment interaction analysis. For example, we can try to use genome-wide association study to identify and include more genetic variants associated with NHL for the interaction analysis.
Conclusions
Collectively, our analyses demonstrate that environmental variables hair dying and environmental tobacco smoking are significantly associated with the risk of NHL. Similarly, genetic factors rs1800893, rs4251961, rs1800630, rs13306698, and rs1799931 also show statistically significant association with the risk of NHL. We only observe that the interaction of smoking and weighted GRS has statistically significant association with NHL.
Consent for Publication
Informed consent was obtained from all individual participants in the study.
Data Availability
The individual level genetic and environmental data are available upon request.
Author Contributions
JZ performed the data analysis and drafted the manuscript. XY and HF designed the data collection in the study. CW performed laboratory and field works. WX and PH supervised the study and revised the manuscript. All authors have reviewed and approved the manuscript.
Funding
This work was supported in part by Natural Sciences and Engineering Research Council of Canada, Manitoba Health Research Council and University of Manitoba.
Conflict of Interest Statement
The authors declare that the research was conducted in the absence of any commercial or financial relationships that could be construed as a potential conflict of interest.
Acknowledgments
We thank the Shanghai Health Study for sharing patient data and DNA specimens and the State Key Laboratory of Genetics of Fudan University for genotyping analysis.
Supplementary Material
The Supplementary Material for this article can be found online at: https://www.frontiersin.org/articles/10.3389/fonc.2018.00657/full#supplementary-material
Abbreviations
BH, Benjamini and Hochberg; BMI, body mass index; CI, confidence interval; DLBCL, diffuse large B-cell lymphoma; ERS, environment risk score; G×E, gene-environment; GRS, genetic risk score; GWAS, genome-wide association study; HWE, Hardy-Weinberg equilibrium; NHL, non-Hodgkin lymphoma; OR, odds ratio; RFLP, Restriction Fragment Length Polymorphism; SNP, single-nucleotide polymorphism.
References
1. Boffetta P. Epidemiology of adult non-Hodgkin lymphoma. Ann Oncol. (2011) 22(Suppl. 4):27–31. doi: 10.1093/annonc/mdr167
2. Key Statistics for Non-hodgkin Lymphoma. American Cancer Society (2018). Available online at: https://www.cancer.org/cancer/non-hodgkin-lymphoma/about/key-statistics.html (Accessed March 28, 2018)
3. Non-hodgkin Lymphoma Statistics. Canadian Cancer Society (2018). Available online at: http://www.cancer.ca/en/cancer-information/cancer-type/non-hodgkin-lymphoma/statistics/?region=on (Accessed March 28, 2018).
4. Ye X, Zhao K, Wu C, Hu P, Fu H. Associations between genetic variants in immunoregulatory genes and risk of non-Hodgkin lymphoma in a Chinese population. Oncotarget (2017) 8:10450–7. doi: 10.18632/oncotarget.14426
5. Bao P-P, Zheng Y, Wu C-X, Huang Z-Z, Gao Y-T, Jin F, et al. Cancer incidence for in urban Shanghai, 1973-2010: an updated trend and age period-cohort effects. BMC Cancer (2016) 16:284. doi: 10.1186/s12885-016-2313-2
6. Non-hodgkin Lymphoma Risk Factors. American Cancer Society (2018). Available online at: https://www.cancer.org/cancer/non-hodgkin-lymphoma/causes-risks-prevention/risk-factors.html (Accessed May 5, 2018).
7. Risk Factors for Non-hodgkin Lymphoma. Canadian Cancer Society (2018). Available online at: http://www.cancer.ca/en/cancer-information/cancer-type/non-hodgkin-lymphoma/risks/?region=on#ixzz5B07Zy5Fu (Accessed March 28, 2018).
8. Fabbro-Peray P, Daures JP, Rossi JF. Environmental risk factors for non-Hodgkin's lymphoma: a population-based case-control study in Languedoc-Roussillon, France. Cancer Causes Control. (2011) 12:201–12. doi: 10.1023/A:1011274922701
9. Qiao Y, Zhou Y, Wu C, et al. Risk of genome-wide association study-identified genetic variants for non-Hodgkin lymphoma in a Chinese population. Carcinogenesis (2013) 34:1516–9. doi: 10.1093/carcin/bgt082
10. Bookman EB, McAllister K, Gillanders E, et al. Gene-environment interplay in common complex diseases: forging an integrative model—recommendations from an NIH workshop. Genetic Epidemiol. (2011) 35:217–25. doi: 10.1002/gepi.20571
11. Hodgins-Davis A, Townsend JP. Evolving gene expression: from G to E to G × E. Cell (2009) 24:649–58. doi: 10.1016/j.tree.2009.06.011
12. Morton LM, Bernstein L, Wang SS, et al. Hair dye use, genetic variation in N-acetyltransferase 1 (NAT1) and 2 (NAT2), and risk of non-Hodgkin lymphoma. Carcinogenesis (2007) 28:1759–64. doi: 10.1093/carcin/bgm121
13. Gathany AH, Hartge P, Davis S, Cerhan JR, Severson RK, Cozen SW, et al. Relationship between interferon regulatory factor 4 genetic polymorphisms, measures of sun sensitivity and risk for non-Hodgkin lymphoma. Cancer Causes Control. (2009) 20:1291–302. doi: 10.1007/s10552-009-9348-5
14. Wang SS, Nieters A. Unraveling the interactions between environmental factors and genetic polymorphisms in non-Hodgkin lymphoma risk. Expert Rev Anticancer Ther. 10:403–13, doi: 10.1586/era.09.194
15. Chang CC, Chow CC, Tellier LCAM, Vattikuti S, Purcell SM, Lee JJ. Second-generation PLINK: rising to the challenge of larger and richer datasets. Gigascience (2015) 4:7. doi: 10.1186/s13742-015-0047-8
16. R Core Team. R: A Language and Environment for Statistical Computing. Vienna: R Foundation for Statistical Computing (2013). Available online at: http://www.R-project.org/
17. Rohlfs RV, Weir BS. Distributions of hardy–weinberg equilibrium test statistics. Genetics (2008) 180:1609–16. doi: 10.1534/genetics.108.088005
18. Benjamini Y, Hochberg Y. Controlling the false discovery rate - a practical and powerful approach to multiple testing. J. Royal Statist. Soc. Series B (1995) 57:289–300. doi: 10.2307/2346101
19. Agresti A. An Introduction to Categorical Data Analysis. 2nd edtion. Hoboken, NJ: Wiley Press (2007). p. 99–105.
20. Han SS, Rosenberg PS, Ghosh A, Landi MT, Caporaso NE, Chatterjee N. An exposure-weighted score test for genetic associations integrating environmental risk factors. Biometrics (2015) 71:596–605. doi: 10.1111/biom.12328
21. Anderson CA, Pettersson FH, Clarke GM, Cardon LR, Morris AP, Zondervan KT. Data quality control in genetic case-control association studies. Nat Protoc. (2010) 5:1564–73. doi: 10.1038/nprot.2010.116
22. Park SK, Tao Y, Meeker JD, Harlow SD, Mukherjee B. Environmental risk score as a new tool to examine multi-pollutants in epidemiologic research: an example from the NHANES Study Using Serum Lipid Levels. PLoS ONE (2014) 9:e98632. doi: 10.1371/journal.pone.0098632
23. Bhatia P, Iovleff S, Govaert G. Blockcluster: an R package for model based co-clustering. J Stat Soft. (2014) 76:hal-01093554. doi: 10.18637/jss.v076.i09
24. Bernardo M, Bioque M, Cabrera B, Lobo A, González-Pinto A, Pina L, et al. Modelling gene-environment interaction in first episodes of psychosis. Schizophr Res. (2017) 189:181–9. doi: 10.1016/j.schres.2017.01.058
25. Kundu S, Aulchenko YS, van Duijn CM, Janssens ACJW. PredictABEL: an R package for the assessment of risk prediction models. Eur J Epidemiol. (2011) 26:261–4. doi: 10.1007/s10654-011-9567-4
26. Wang SS, Cerhan JR, Hartge P, Davis S, Cozen W, Severson RK, et al. Common genetic variants in proinflammatory and other immunoregulatory genes and risk for non-Hodgkin lymphoma. Cancer Res. (2006) 66:9771–80. doi: 10.1158/0008-5472.CAN-06-0324
27. Rothman N, Skibola CF, Wang SS, Morgan G, Lan Q, Smith MT, et al. Genetic variation in TNF and IL10 and risk of non-Hodgkin lymphoma: a report from the InterLymph Consortium. Lancet Oncol. (2006) 7:27–38. doi: 10.1016/S1470-2045(05)70434-4
28. Hosgood HD, Au WY, Kim HN, Liu J, Hu W, Tse J, et al. IL10 and TNF variants and risk of non-Hodgkin lymphoma among three Asian populations. Int J Hematol. (2013) 97:793–9. doi: 10.1007/s12185-013-1345-5
29. Purdue MP, Lan Q, Kricker A, Grulich AE, Vajdic CM, Turner J. Polymorphisms in immune function genes and risk of non-Hodgkin lymphoma: findings from the New South Wales non-Hodgkin Lymphoma Study. Carcinogenesis (2007) 28:704–12. doi: 10.1093/carcin/bgl200
30. Bermudez EA, Rifai N, Buring JE, Manson JE, Ridker PM. Relation between markers of systemic vascular inflammation and smoking in women. Am J Cardiol. (2002) 89:1117e19. doi: 10.1111/j.1742-1241.2009.02179.x
31. Glossop JR, Dawes PT, Mattey DL. Association between cigarette smoking and release of tumour necrosis factor α and its soluble receptors by peripheral blood mononuclear cells in patients with rheumatoid arthritis. Rheumatology (2006) 45:1223e19. doi: 10.1093/rheumatology/kel094
32. Hagiwara E, Takahashi KI, Okubo T, Ohno S, Ueda A, Aoki A, et al. Cigarette smoking depletes cells spontaneously secreting Th(1) cytokines in the human airway. Cytokine (2001) 14:121e6. doi: 10.1006/cyto.2001.0860
33. Schöllkopf C, Smedby KE, Hjalgrim H, Rostgaard K, Gadeberg O, Roos G, et al. Cigarette smoking and risk of non-Hodgkin's lymphoma–a population-based case-control study. Cancer Epidemiol Biomarkers Prev (2005) 14:1791–6. doi: 10.1158/1055-9965.EPI-05-0077
34. Jimenez S, De Los Angeles M. Gene-Environment Interactions in Non-hodgkin Lymphoma: A Statistical Analysis [Master Dissertation] Burnaby, BC: Simon Fraser University (2013).
Keywords: gene-environment interaction (G × E), genetic risk score (GRS), clustering (unsupervised) algorithms, non-hodgkin lymphoma, candidate genes
Citation: Zhang J, Ye X, Wu C, Fu H, Xu W and Hu P (2019) Modeling Gene-Environment Interaction for the Risk of Non-hodgkin Lymphoma. Front. Oncol. 8:657. doi: 10.3389/fonc.2018.00657
Received: 10 September 2018; Accepted: 12 December 2018;
Published: 14 January 2019.
Edited by:
Anjali Mishra, The Ohio State University, United StatesReviewed by:
Alessandro Isidori, Ospedali Riuniti Marche Nord, ItalyZhichao Liu, National Center for Toxicological Research (FDA), United States
Copyright © 2019 Zhang, Ye, Wu, Fu, Xu and Hu. This is an open-access article distributed under the terms of the Creative Commons Attribution License (CC BY). The use, distribution or reproduction in other forums is permitted, provided the original author(s) and the copyright owner(s) are credited and that the original publication in this journal is cited, in accordance with accepted academic practice. No use, distribution or reproduction is permitted which does not comply with these terms.
*Correspondence: Hua Fu, aGZ1QGZ1ZGFuLmVkdS5jbg==
Wei Xu, d3h1QHVobnJlcy51dG9yb250by5jYQ==
Pingzhao Hu, cGluZ3poYW8uaHVAdW1hbml0b2JhLmNh