 Sue Kulason1,2,3*
 Eileen Xu1
 Daniel J. Tward4,5
 Arnold Bakker6,7
 Marilyn Albert7
 Laurent Younes1,2,8
 Michael I. Miller1,2,3,9 for the Alzheimer's Disease Neuroimaging Initiative
- 1Center for Imaging Science, Johns Hopkins University, Baltimore, MD, United States
- 2Institute for Computational Medicine, Johns Hopkins University, Baltimore, MD, United States
- 3Department of Biomedical Engineering, Johns Hopkins University, Baltimore, MD, United States
- 4Department of Computational Medicine, University of California, Los Angeles, Los Angeles, CA, United States
- 5Department of Neurology, Ahmanson-Lovelace Brain Mapping Center, University of California, Los Angeles, Los Angeles, CA, United States
- 6Department of Psychiatry and Behavioral Sciences, Johns Hopkins University, Baltimore, MD, United States
- 7Department of Neurology, Johns Hopkins University, Baltimore, MD, United States
- 8Department of Applied Mathematics and Statistics, Johns Hopkins University, Baltimore, MD, United States
- 9Kavli Neuroscience Discovery Institute, Johns Hopkins University, Baltimore, MD, United States
This study examines the atrophy patterns in the entorhinal and transentorhinal cortices of subjects that converted from normal cognition to mild cognitive impairment. The regions were manually segmented from 3T MRI, then corrected for variability in boundary definition over time using an automated approach called longitudinal diffeomorphometry. Cortical thickness was calculated by deforming the gray matter-white matter boundary surface to the pial surface using an approach called normal geodesic flow. The surface was parcellated based on four atlases using large deformation diffeomorphic metric mapping. Average cortical thickness was calculated for (1) manually-defined entorhinal cortex, and (2) manually-defined transentorhinal cortex. Group-wise difference analysis was applied to determine where atrophy occurred, and change point analysis was applied to determine when atrophy started to occur. The results showed that by the time a diagnosis of mild cognitive impairment is made, the transentorhinal cortex and entorhinal cortex was up to 0.6 mm thinner than a control with normal cognition. A change point in atrophy rate was detected in the transentorhinal cortex 9–14 years prior to a diagnosis of mild cognitive impairment, and in the entorhinal cortex 8–11 years prior. The findings are consistent with autopsy findings that demonstrate neuronal changes in the transentorhinal cortex before the entorhinal cortex.
1. Background
Evidence suggests that neuropathological changes of Alzheimer's disease (AD) begin years before the onset of clinical symptoms (Sperling et al., 2011). Accumulation of these neuropathological changes is associated with neuronal injury, which can be measured indirectly by structural magnetic resonance imaging (MRI) (Atiya et al., 2003; Kantarci and Jack, 2004). A number of MRI studies have detected atrophy in the entorhinal cortex (ERC), hippocampus and amygdala associated with clinical disease severity (Devanand et al., 2007; La Joie et al., 2012; Miller et al., 2015b) and years to AD dementia conversion (Atiya et al., 2003; Kantarci and Jack, 2003). More recent MRI studies have focused on evidence of atrophy that precede clinical symptoms (Jack et al., 2004; Csernansky et al., 2005; den Heijer et al., 2006; Apostolova et al., 2010; Dickerson et al., 2011; Miller et al., 2013; Soldan et al., 2015; Pettigrew et al., 2016), often detecting these smaller changes using time-series data analysis (Durrleman et al., 2012) and survival analysis. These MRI biomarkers of AD-related atrophy prior to manifestation of clinical symptoms are of interest because (1) they may aid in assessing efficacy of therapeutic interventions and (2) they may aid in the identification of populations that can benefit from therapeutic intervention prior to clinical symptoms.
Braak's staging of AD suggests that cortical accumulation of neurofibrillary tangles starts in the transentorhinal cortex (TEC), spreads medially to the ERC, and then involves the hippocampus and amygdala (Braak and Braak, 1991; Braak et al., 2006). Accumulation of tau pathology has been correlated with changes in cognitive status in the presence of β-amyloid plaques (Nelson et al., 2012), as well as with TEC atrophy as detected in MRI (Xie et al., 2018). While relatively few MRI studies exist on AD-related TEC changes (Tward et al., 2017b; Wolk et al., 2017), our recent work demonstrated that subjects with mild cognitive impairment (MCI) have increased baseline atrophy and increased rate of atrophy compared to cognitively normal controls, and that changes in the TEC had greater magnitude than changes in the ERC, hippocampus, and amygdala (Kulason et al., 2019). In addition, our group's work on change point analysis has demonstrated MRI-based shape metrics can detect atrophy in the ERC earlier than hippocampal and amygdalar atrophy (Younes et al., 2014). These changes precede clinical symptoms by up to 10 years.
The evidence of MRI biomarkers that precede clinical symptoms taken together with evidence of cortical AD-related changes selectively occurring first in the TEC motivate a close look at TEC atrophy over the preclinical stage of AD progression. In this study, we aim to localize, both spatially and temporally, MRI-based atrophy detection within the TEC and ERC by examining subjects from two diagnostic groups: stable normal cognition (NC), and NC to MCI converters.
2. Methods
2.1. Data Collection
Subjects were selected from the ADNI database (adni.loni.usc.edu). The criteria for stable NC included the absence of a diagnosis of MCI or AD on all baseline and follow-up visits, a CDR score of 0 on all baseline and follow-up visits, evidence of performance within the normal range on the Logical Memory Subtest of the Wechsler Memory Scale on all baseline and follow-up visits (based on education adjusted norms), and negative results for elevated amyloid β levels on the baseline visit (greater than a cut off of 192 pg/mL from CSF as established by the ADNI Biospecimen Core).
The criteria for NC to MCI converters included evidence of performance within the normal range on the Logical Memory Subtest of the Wechsler Memory Scale at baseline (based on education adjusted norms), a CDR score of 0 on the baseline exam, a diagnosis of NC at baseline, and a diagnosis of MCI or dementia at a subsequent follow-up visit. Estimated MCI age-of-onset was established based on annual assessment of diagnosis. Note that subjects missing a diagnostic evaluation more than a year prior to MCI diagnosis were excluded, and one subject with an MCI diagnosis was also excluded due to a stable, high score on the Logical Memory Subtest of the Weschler Memory Scale 5 years after diagnosis.
In addition, subjects had to have a minimum of three 3T MRI scans over 2 or more years. Out of the 30 subjects that met all criteria for NC to MCI converters, all subjects were examined and 17 had a continuous collateral sulcus (CoS) and were included in this study (see section 2.2 for detailed explanation). We examined a subset of available stable NC subjects to reach a total sample size of 50. Out of the 84 subjects that met all criteria for stable NC, 68 were examined and 33 had a continuous collateral sulcus and were included in this study. The demographics of subjects included in this study are summarized in Table 1. Two-sample t-tests showed no significant diagnostic group differences by age, number of scans, scan period, or clinical evaluation period. Pearson chi-squared test showed no significant diagnostic group difference by sex. Note that the clinical evaluation period is longer than the scan period because the scan protocol was updated in the ADNI 3 cohort to an accelerated scan sequence. These accelerated scans were not included in this analysis.
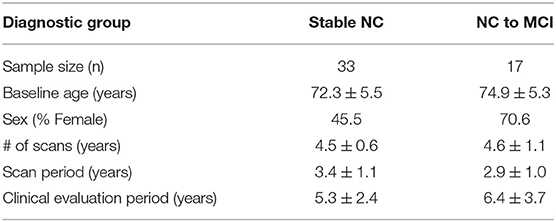
Table 1. Demographics (mean ± standard deviation where applicable).
2.2. Manual Segmentation and Surface-Based Morphometry
As in previous projects (Tward et al., 2017b; Kulason et al., 2019), we restricted the analysis to the left hemisphere and excluded subjects with a discontinuous CoS in the defined region of interest. There are several variants of the CoS to consider, illustrated in Figure 1. The first variant is a deep, continuous sulcus where the rhinal sulcus shares a sulcal bed with the collateral sulcus proper. This variant has been referred to as Type I CoS (Ding and Van Hoesen, 2010) and Type II/Type III rhinal sulcus (Huntgeburth and Petrides, 2012). The second variant is a discontinuous CoS where the collateral sulcus proper begins posterior to the GI. This variant has been referred to as a Type IIa CoS (Ding and Van Hoesen, 2010) and Type I rhinal sulcus (Huntgeburth and Petrides, 2012). Finally, there is a variant with a discontinuous CoS where the collateral sulcus proper begins anterior to the GI, and therefore is excluded for this study. This variant has been referred to as a Type IIb CoS (Ding and Van Hoesen, 2010) and also falls into the category for Type I rhinal sulcus (Huntgeburth and Petrides, 2012). Table 2 categorizes the proportion of CoS variants prior to exclusion of Type IIb. Previous work has shown there is a relationship between CoS depth and the boundaries of the ERC and TEC with respect to anatomical markers (Insausti et al., 1998). Briefly, in a shallow CoS (< 1 cm) the ERC extends to the deepest extent of the CoS. In a regular CoS (between 1 and 1.5 cm), the ERC extends to the midpoint of the medial bank of the CoS. In a deep CoS (> 1.5 cm) the ERC extends up to the CoS. In this subject set we found that excluded Type IIb CoS subjects most often had a shallow CoS, while the Type I and Type IIa variants included in this study were of a regular to deep CoS type.
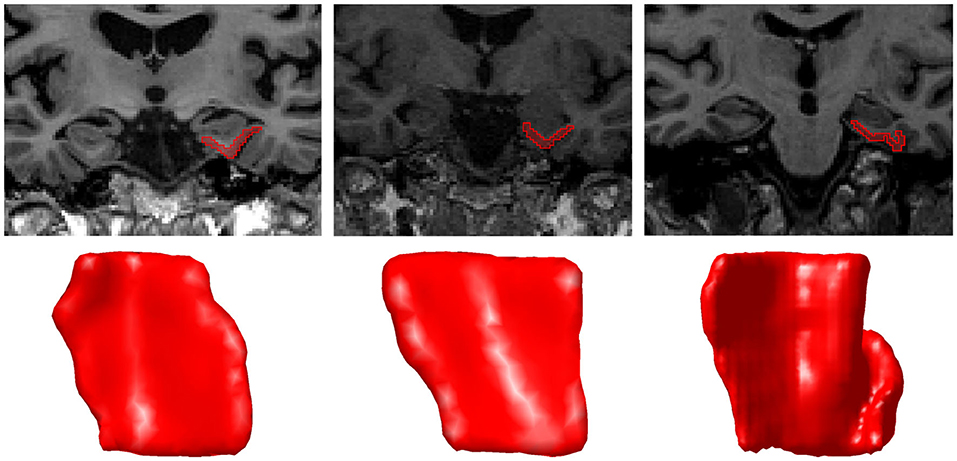
Figure 1. A coronal MRI section and corresponding surface of each CoS variant Type I (left), Type IIa (middle), and Type IIb (right). In Type IIb, the segmentation was extended to the second CoS, also known as the collateral sulcus proper. The orientation of surfaces is as follows: anterior (top), posterior (bottom), medial (left), lateral (right).
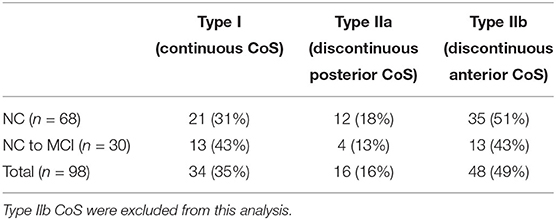
Table 2. Distribution of collateral sulcus variants.
226 3T T1 MRI scans were used in this study. ERC and TEC were segmented manually using Seg3D software (Center for Integrative Biomedical Computing, 2016). We followed an established procedure for segmentation and delineation of the ERC and TEC (Tward et al., 2017b) that was based on anatomical landmarks described near cytoarchitectonically-defined ERC boundaries (Insausti et al., 1998; Ding and Van Hoesen, 2010). The anterior boundary of the ERC and TEC were defined 4 mm anterior to the hippocampal head. Delineation of the ERC and TEC anterior to this boundary is more complex and excluded from this study. Earlier works suggest that the area anterior to this region is a mix of ERC and perirhinal cortex (Insausti et al., 1998), or olfactory cortex (Krimer et al., 1997), whereas a more recent work suggests that this area is, in fact, part of the ERC (Ding and Van Hoesen, 2010). The posterior boundary for ERC and TEC was defined 2 mm posterior to the gyrus intralimbicus (GI) (Insausti et al., 1998). The medial extent of the ERC was defined as far as the gray/white boundary was visible. This delineation excludes a small dorsal medial aspect of the ERC that rests against the amygdala, and is similar to how other T1 MRI protocols delineate the ERC (Desikan et al., 2006; Maass et al., 2015). The lateral extent of the ERC and medial extent of the TEC was defined at the medial extent of the collateral sulcus (CoS), as is found in a deep CoS (Insausti et al., 1998). The lateral extent of the TEC was defined as being at the deepest extent of the CoS, as is also found in a deep CoS (Ding and Van Hoesen, 2010).
Figure 2 shows a sample of ERC plus TEC surfaces generated from manual segmentations. A population template for the ERC plus TEC surface was calculated from these surfaces by taking the average (Fréchet mean) diffeomorphism in a Bayesian setting (Ma et al., 2008). Then, the segmentations were adjusted for variability in boundaries over time by mapping the population template simultaneously onto each scan of a time series (Tward et al., 2017a). The result is a set of surfaces of the ERC plus TEC.
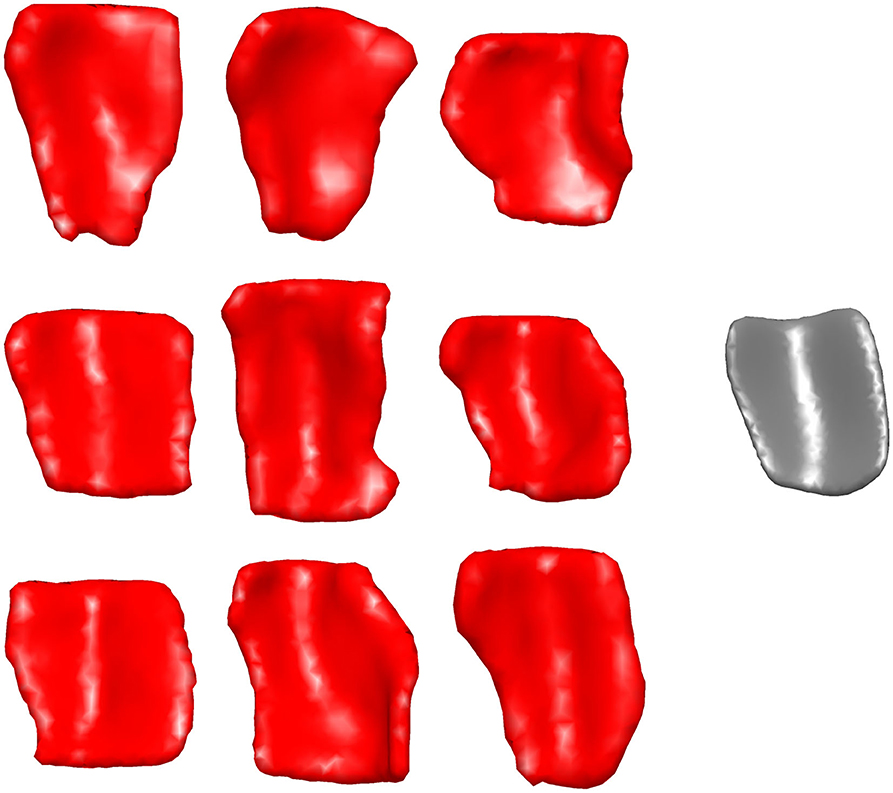
Figure 2. Sample of ERC plus TEC surfaces generated from manual segmentations (left) and the resultant population template (right). The orientation is as follows: anterior (top), posterior (bottom), medial (left), lateral (right).
2.3. Surface Parcellation
Studies of this region have tended to use inconsistent nomenclature. We mapped four atlases with commonly used sub-regional labels onto our ERC plus TEC population template: (1) manual labels of ERC and TEC based on cortical folding seen in structural MRI (Tward et al., 2017b), (2) automated labels of ERC and parahippocampal gyrus (PHG) based on cortical folding seen in structural MRI (Desikan et al., 2006), (3) labels of posterior medial ERC (pmERC), anterior lateral ERC (alERC), and perirhinal cortex (PRC) based on connectivity patterns seen in functional MRI after manual segmentation of ERC in structural 7T MRI (Maass et al., 2015), and (4) histological labels of intermediate superior ERC, intermediate rostral ERC, intermediate caudal ERC, prorhinal ERC, medial rostral ERC, medial caudal ERC, lateral ERC, sulcal ERC and TEC as identified in an 11T ex vivo MRI (Krimer et al., 1997; Miller et al., 2015a).
Manual segmentation of ERC and TEC was performed on an scan with a Type IIa CoS variant of regular depth (1.30 cm). To generate labels from the Desikan-Killiany atlas, FreeSurfer 6.0 was run on the same scan. The functional MRI atlas was provided on a subject with Type IIa CoS variant of regular depth (1.20 cm) (Maass et al., 2015). The ex vivo MRI atlas was provided on a subject with a Type IIb CoS variant of shallow depth (0.75 cm). For each atlas, we manually segmented the ERC plus TEC from the structural MRI following the same protocol as for our subjects. In the ex vivo case, since the CoS was shallow, the TEC was extended to the lateral bank of the CoS, as seen in histology (Insausti et al., 1998; Ding and Van Hoesen, 2010). We then mapped the atlas labels to the manually-defined ERC plus TEC surface by linear interpolation. Finally, we mapped these surfaces and their labels to the population template surface following the LDDMM framework (Beg et al., 2005). The result was four sets of labels, one from each atlas, on each vertex of the population template surface.
The Desikan-Killiany atlas defined the anterior boundary of ERC at the rostral end of the CoS; this was approximately 6 mm anterior to the boundary defined in our protocol. The functional MRI atlas defined the anterior boundary at the rostral end of the amygdala, which coincided with our protocol's boundary. The anterior boundary on the ex vivo MRI atlas was 0.5 mm posterior to our protocol's boundary.
The Desikan-Killiany atlas defined the posterior boundary at the caudal end of the amygdala. This excludes a posterior portion of the ERC that runs lateral to the hippocampal formation (Krimer et al., 1997; Insausti et al., 1998; Ding and Van Hoesen, 2010). The functional MRI atlas defined the posterior boundary as extending to the caudal end of the CoS. Since this atlas was a Type IIa CoS variant, the caudal extent of the CoS coincided with 1.2 mm posterior to the GI, or one 0.6 mm slice anterior to our protocol's boundary. The posterior boundary of the ex vivo atlas was 1.0 mm anterior to our protocol's boundary.
The Desikan-Killiany atlas, functional MRI atlas, and our protocol defined the medial boundary at the furthest extent where gray/white boundary was visible. The ex vivo atlas included the dorsal medial aspect of the ERC that borders the amygdala, a border that is not always visible on 3T T1 MRI. An overlay of the ex vivo atlas ERC partition and our protocol's ERC plus TEC partition highlights this difference as shown in Figure 3.
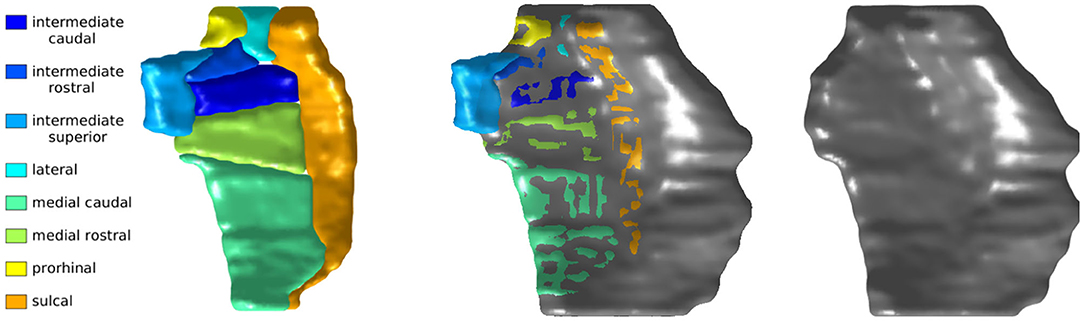
Figure 3. Krimer subregions of ERC labeled on 11T ex vivo MRI (left). ERC plus TEC labeled on same MRI following protocol described in section 4.2 (right). Overlay of segmentations (middle). The orientation is as follows: anterior (top), posterior (bottom), medial (left), lateral (right).
Finally, the Desikan-Killiany atlas defined the lateral extent of entorhinal cortex as the most lateral extent of the CoS. This boundary definition most closely followed that of a shallow CoS variant (Insausti et al., 1998), often seen in Type IIb CoS that were excluded from this study. The functional MRI atlas delineated the ERC ending at the shoulder of the CoS, a definition that most closely followed the boundary of a deep CoS variant (Insausti et al., 1998). Our protocol also followed the delineation that matches a deep CoS variant. Since the subjects included in this study range from regular CoS depth (1.0–1.5 cm) to deep CoS depth (> 1.5 cm), it is likely that our protocol may include a small portion of the ERC within the TEC label.
2.4. Cortical Thickness
To calculate vertex-wise cortical thickness, we followed an established procedure based on LDDMM (Ratnanather et al., 2019). The ERC plus TEC surface was cut into two surfaces: the pial surface and the gray matter-white matter boundary surface. The gray matter-white matter boundary surface was deformed to the pial surface within the LDDMM framework, with an additional imposed constraint that the surface must flow in the direction normal to its evolving surface. Cortical thickness was then estimated as the distance along these trajectories. Average ERC thickness and average TEC thickness were calculated as the mean thickness across vertex labeled ERC and TEC, respected, as mapped from the manual structural MRI atlas.
2.5. Group Difference Analysis
We tested where there were differences in shape measures by diagnostic group. The log-linear mixed effects model under the null hypothesis can be written as Equation (1) given a subject i, scan j, and vertex k.
The constants a, b, c, and the variance of 0-mean Gaussians e and ϵ are estimated by maximum likelihood. e is the subject-specific random effect, while age and sex (a binary indicator variable) are fixed effects.
The log-linear mixed effects model under the alternative hypothesis can be written as Equation (2).
isMCI is a binary indicator variable for whether a subject belongs to the group that converted from NC to MCI, and age_MCIonset is the age of MCI diagnosis. a′ is the mean difference in log thickness at the time of MCI diagnosis for subjects that converted from NC to MCI. b′ corresponds to the disease-related rate of change in this group.
We tested whether the model under the alternative hypothesis significantly fit the data better than the model under the null hypothesis by using the likelihood ratio as a test statistic and bootstrap resampling 10,000 samples. The bootstrapped samples were constructed by sampling from whitened residuals under the null hypothesis. We compared the likelihood ratio to the distribution of likelihood ratios of the bootstrapped samples. We corrected for multiple comparisons over the vertices by using the maximum test statistic over all vertices for each set of bootstrapped samples (Nichols and Hayasaka, 2003). We rejected the null hypothesis when the true likelihood ratio was greater than 95% of the bootstrapped likelihood ratios.
2.6. Change Point Analysis
We tested when a change in atrophy rate occurred with respect to MCI diagnosis. Details for constructing and testing this change point model are described in another work (Tang et al., 2017). Here we provide a brief summary of the approach.
The log-linear mixed effects model under the null hypothesis can be written as Equation (3) given a subject i, scan j, and location k.
The constants a, b, c, d, and the variance of 0-mean Gaussians e and ϵ are estimated by maximum likelihood. e is the subject-specific random effect, while age and sex (a binary indicator variable) are fixed effects. Unlike in the group-wise difference analysis, this model has only two locations in order to reduce computational complexity: one for average ERC thickness, and the other for average TEC thickness.
The model under the alternative hypothesis can be written as Equation (4).
Δ is the number of years from a diagnosis of MCI to the change point in atrophy rate, and is the number of years past the change point. The constants a, b, c, d, and the variance of 0-mean Gaussians e and ϵ are estimated by maximum likelihood over a fixed Δ with yearly increments of Δ between −50 and 50 years. The best candidate Δ is calculated from the posterior mean.
For stable NC subjects, we estimated MCI diagnosis from a conditional probability distribution where the age of onset was constrained to be after the last diagnostic evaluation, and drawn from a Gaussian distribution with mean age of μ1 = 93 years and standard deviation of σ1 = 14.5 years. This distribution of MCI diagnosis was estimated (Tang et al., 2017) using a set of 1, 000 subjects enrolled with normal cognition and a family history of Alzheimer's disease.
Since the subjects in this study were selected to meet diagnostic group criteria and do not represent a random sample over the progression of the disease, we re-weighted the likelihood function by the distribution of stable NC and NC to MCI converters expected if the subjects were selected blind to diagnostic group. The subjects in the ADNI database were enrolled to meet a set number of subjects per diagnostic group, and as such, cannot be used to estimate this distribution. Instead, we examined the BIOCARD database, where subjects were enrolled cognitively normal and followed for up to 22 years at time we examined this database (biocard-se.org). This distribution was calculated from a subset of subjects over 65 years of age at their most recent follow-up visit. Specifically, the proportion was 184/260 stable NC and 44/260 NC to MCI converters.
We tested whether the model under the alternative hypothesis significantly fit the data better than the model under the null hypothesis using the likelihood ratio as a test statistic and bootstrap resampling 1,000 samples. The bootstrapped samples are constructed by sampling from whitened residuals under the null hypothesis, with imputed values for age_MCIonset for stable NC subjects. We compared the likelihood ratio to the distribution of likelihood ratios of the bootstrapped samples and rejected the null hypothesis when the likelihood ratio was greater than 95% of the bootstrapped likelihood ratios. We used the maximum test statistic over pairs of ERC and TEC statistics to control family-wise error rate (Nichols and Hayasaka, 2003).
In the case where the null hypothesis was rejected, we then determined the confidence interval for Δ, b and b′ by bootstrap resampling under the alternative hypothesis 1,000 times. The bootstrapped samples were constructed by sampling from whitened residuals under the alternative hypothesis, with imputed values for age_MCIonset for NC subjects. In the case where the null hypothesis was rejected for both ERC and TEC measures, we then calculated the probability that the change point for TEC occurred before the change point for ERC based on the change point Δ of each pair of bootstrapped samples under the alternative hypothesis. This one-sided test was selected based on histological evidence that changes occurred in the TEC before the ERC (Braak et al., 2006).
3. Results
3.1. Surface Parcellation
The results of the four atlas mappings onto the population template surface are shown in Figure 4. Comparison of the atlases highlight inconsistencies introduced by varying nomenclature and CoS variant. The automated labels based on cortical folding used by Desikan-Killany defined the ERC extending into the CoS, a definition that matches a shallow CoS variant. The atlas also excluded the posterior extent of the ERC. In contrast, the functional MRI atlas defined the perirhinal cortex (PRC), an area that includes the TEC, and separated this structure from the ERC using a definition that matches a deep CoS variant. Histologically-defined subregions of the ERC show yet another popular parcellation of this region on a regular depth (1–1.5 cm) CoS variant. Note how in this definition, the sulcal ERC extends into the shoulder of the CoS. In this study, average ERC and average TEC metrics were calculated based on the labels shown in the manual structural labels (top left).
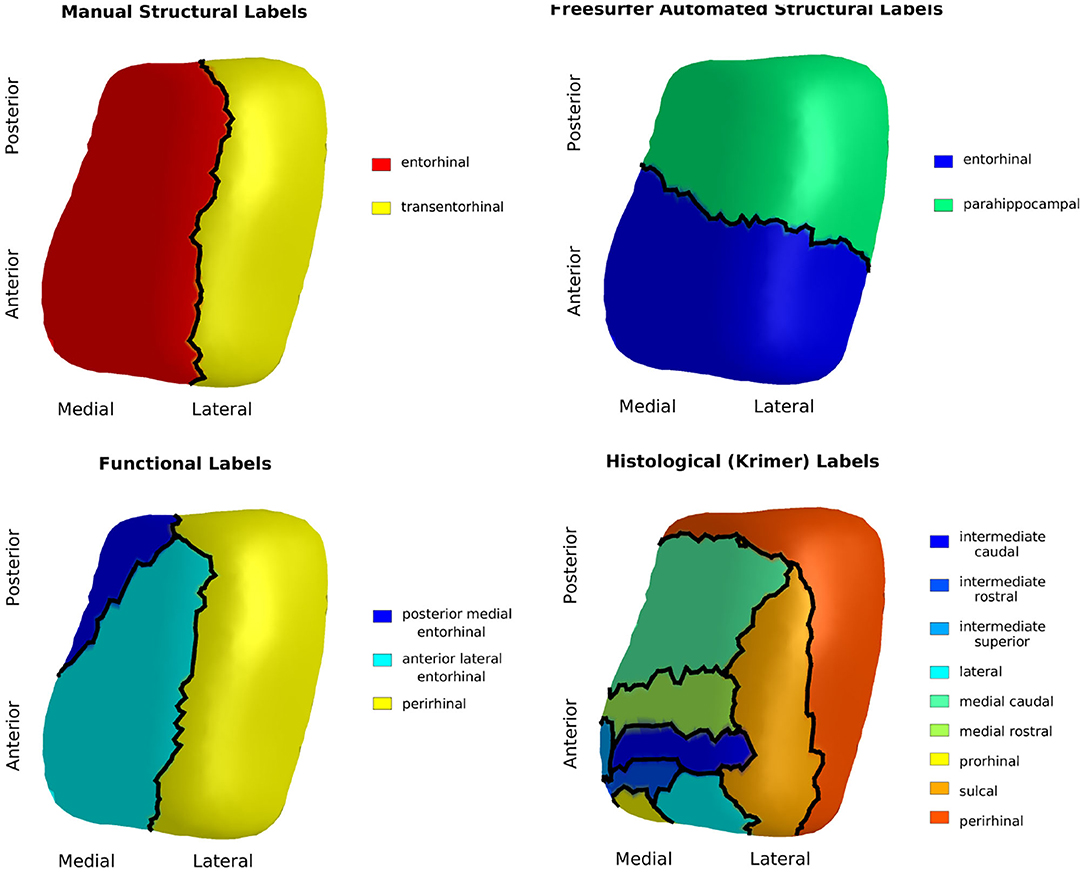
Figure 4. Manual structural labels (top left), automated structural labels (top right), functional labels (bottom left), histological labels (bottom right) mapped onto the population template.
3.2. Cortical Thickness
Average cortical thickness of TEC and average cortical thickness of ERC are plotted in Figure 5. The TEC is slightly thicker than the ERC, which is in agreement with previous work (Kulason et al., 2019). In both regions, organization by MCI diagnosis date show cortical thickness measures decrease with progression of the disease, and that the rate of cortical thinning is noticeably steeper in NC to MCI converters than in stable NC subjects.
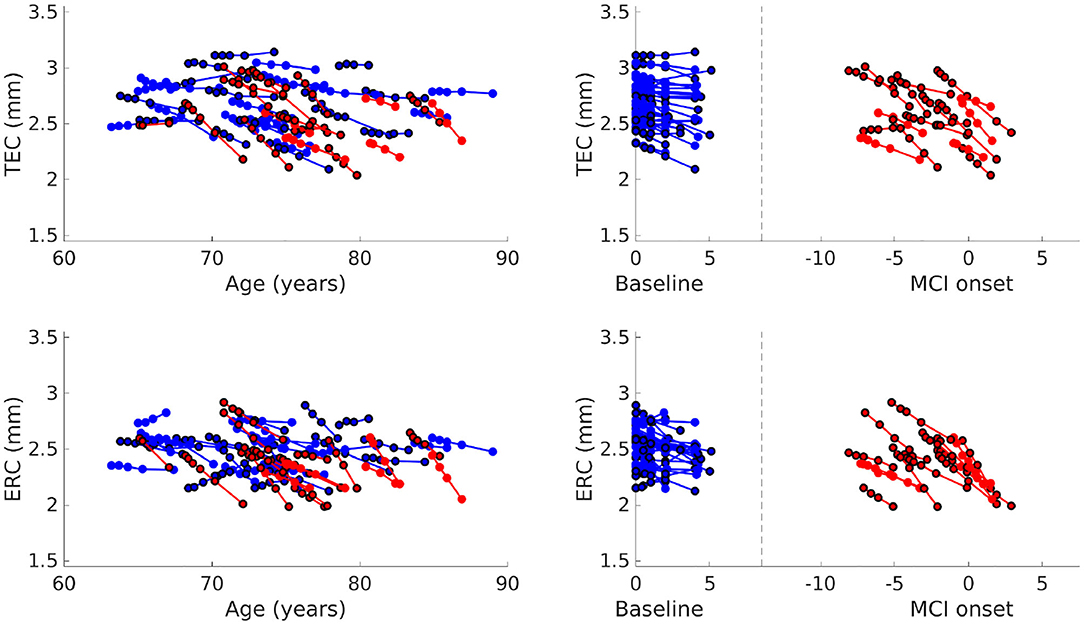
Figure 5. Average TEC thickness (top) and ERC thickness (bottom) plotted over age (left). Average TEC thickness (top) and ERC thickness (bottom) plotted with respect to time from baseline scan for NC, and with respect to time from MCI onset for NC to MCI converters (right). Each line corresponds to a subject, the color to a diagnostic group (stable NC, NC to MCI), and the marker border to sex (no border is male, bordered is female).
3.3. Diagnostic Group Difference Analysis
We rejected the null hypothesis with global p < 0.0001 and concluded that there was a difference in cortical thickness between diagnostic groups. Figure 6 shows the difference in atrophy and atrophy rate across all vertices. A summary of average and maximum atrophy/atrophy rates is shown in Table 3. As the data demonstrates, at the time of MCI diagnosis, individuals who had progressed to a diagnosis of MCI were as much as 0.58 mm thinner in the ERC and 0.60 mm thinner in the TEC. The additional atrophy rate in the participants who progressed from NC to MCI was 2.96% per year in the ERC on average and 2.43% per year in the TEC on average. This is a notable increase from age-related atrophy which was, on average, 0.68% per year in the TEC and 0.66% per year in the ERC. In other words, the average total atrophy rate in NC to MCI converters was 5.35 times greater in the ERC and 4.68 times greater in the TEC compared to stable NC subjects.
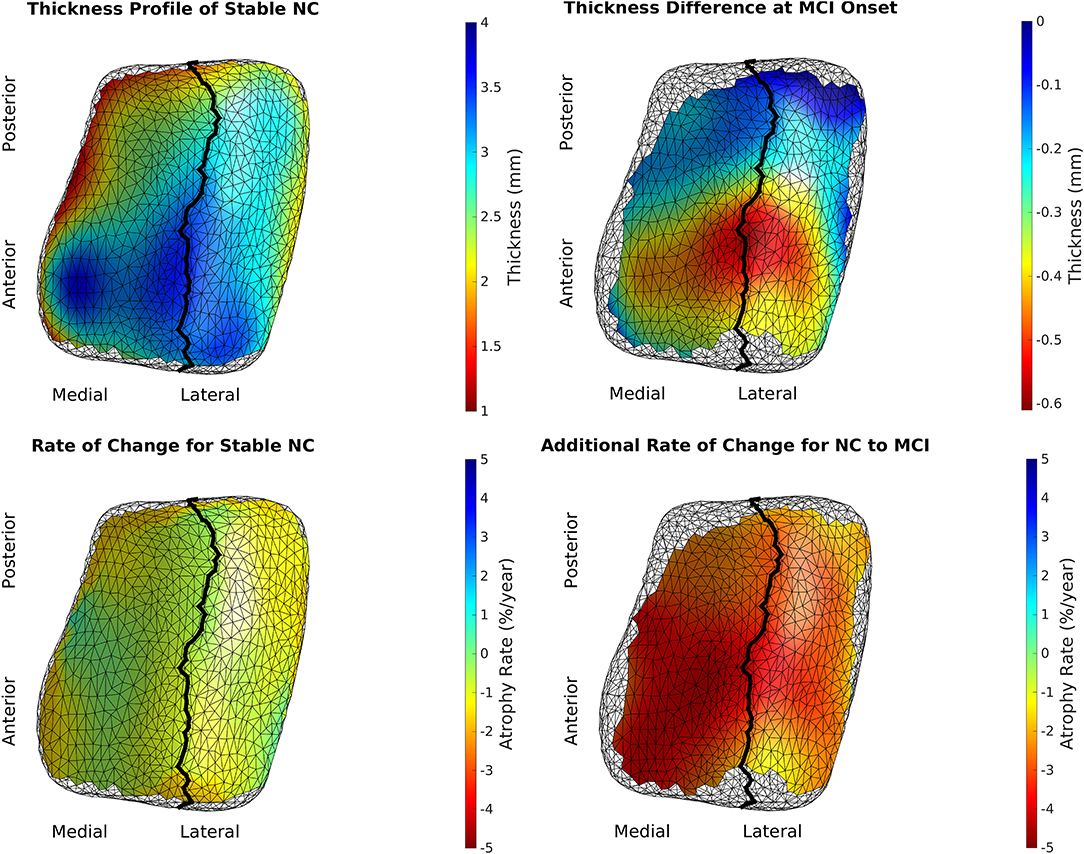
Figure 6. Top left is the model of a 65-year-old, male, stable NC. Bottom left is the age-related atrophy rate. Top right is the difference in thickness at time of MCI diagnosis in NC to MCI converters. Bottom right is the additional atrophy rate for NC to MCI converters.
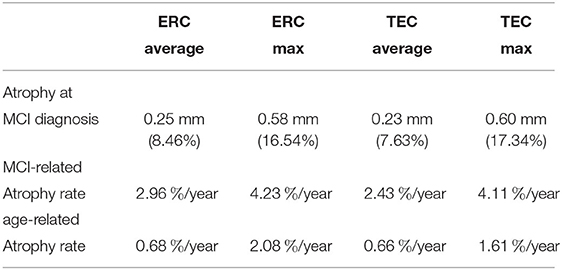
Table 3. Summary of group-wise difference analysis by region.
3.4. Change Point Analysis
We rejected the null hypothesis and concluded that there was a change point 9.02 years before MCI onset for the ERC (p < 0.001) and 10.69 years before MCI diagnosis for the TEC (p < 0.001). Prior to the change point, the atrophy rate was 0.35%/year for the ERC and 0.34%/year for the TEC. After the change point, the additional atrophy was 3.75%/year for the ERC and 2.58%/year for the TEC. The 95% confidence interval for the parameters of interest are shown in Table 4. The ERC change point in thickness occurred at or before the TEC change point in 3.75% of bootstrapped samples. We concluded that the TEC change point preceded the ERC change point.
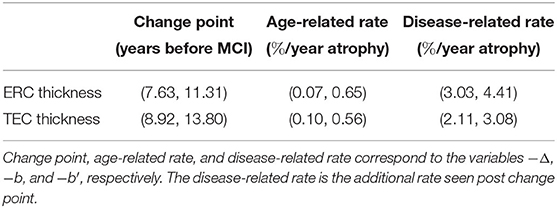
Table 4. 95% confidence interval (min, max).
4. Discussion
The first major finding of this study is that anterior regions of the ERC and TEC were more than half a millimeter thinner (up to 17% thinner) in NC to MCI converters at the time of MCI diagnosis, and that disease-related atrophy was roughly 3% per year. The evidence suggests that disease-related atrophy begins prior to an MCI diagnosis in the anterior lateral region of ERC and anterior region of TEC. This is in line with our previous study that examined subjects after an MCI diagnosis, where we found disease-related thickness atrophy was 5% atrophy per year in the TEC and that MCI subjects were on average 23% thinner than NC (Kulason et al., 2019). The 3% atrophy per year in NC to MCI converters vs. 5% atrophy per year in subjects after MCI diagnosis may suggest that the atrophy rate increases with progression of the disease from the preclinical to clinical stage.
The second major finding of this study is that there was a change in the rate of ERC thickness atrophy 8–11 years prior to MCI diagnosis, and a change in the rate of TEC thickness atrophy 9–14 years before the diagnosis of MCI. The order of the change points, TEC before ERC, is consistent with histological report of neurofibrillary tau accumulation in this region (Braak et al., 2006). The time of change point is consistent with a previous study, which found changes in surface area of the FreeSurfer-defined ERC 8–10 years prior to symptom onset (Younes et al., 2014).
These findings emphasize the discrepancies in nomenclature pertaining to the TEC and ERC. We showed how the Desikan-Killiany atlas defined ERC beginning anterior to our protocol and ending anterior to our protocol. Our protocol closely matched the anterior and posterior boundaries defined in the function MRI atlas and ex vivo atlases. The Desikan-Killiany ERC extended laterally into the CoS, which is accurate for shallow CoS common variant in Type IIb CoS, and not as accurate for the regular and deep CoS variants that were included in this study. The ex vivo atlas, a subject with Type IIa CoS variant of regular depth, marked the sulcal ERC lateral boundary shortly past the shoulder of the CoS, which is consistent with cytoarchitectonically-defined ERC in previous studies (Krimer et al., 1997; Insausti et al., 1998; Ding and Van Hoesen, 2010). The functional MRI atlas and Desikan-Killiany atlas chose not to define the TEC separate from perirhinal cortex and fusiform gyrus, respectively. The 4 surface parcellations mapped to the same coordinate system highlight the need for a standardized nomenclature of this region, much like the work being done to standardize sub-regional boundaries of the hippocampus (Adler et al., 2018; Olsen et al., 2019).
There are a number of strengths to this study. The subjects were carefully selected to (1) follow a strict set of inclusion criteria for diagnostic grouping, and (2) exclude subjects with a discontinuous CoS within the region of interest. This was done to reduce confounding factors introduced by other medical conditions and natural variability in cortical folding. In addition, scans were manually segmented to avoid errors introduced by automated segmentation methods. Finally, the results were put in the context of several atlases for broader interpretation of findings.
There are also a few limitations to this study, the first being a relatively small sample size. Accurate segmentations, which have been performed manually for this study, are extremely time consuming. The ERC is particularly difficult to segment automatically due to its proximity with the meninges and oculomotor nerve. These neighboring structures are a similar intensity to gray matter voxels in T1 scans. Some recent work has been done to address this issue using automatic parcellation (Xie et al., 2017); a future direction is to determine whether this type of automated approach to segmentation affects ERC and TEC metrics produced in this analysis.
Another limitation of this study is that the distribution of samples is biased by diagnostic grouping. It is difficult to estimate the true distribution of diagnostic groups because the ADNI protocol selected subjects based on diagnosis and the follow-up time varies. This is mitigated by the use of distribution estimates calculated from the BIOCARD database.
In the future, this study can be extended to include shallow, discontinuous CoS variants for detecting Alzheimer's-related changes. It is of interest to develop metrics of disease progression that are robust to this natural variation in folding. Autopsy studies have shown that subjects with a shallow, discontinuous CoS have a TEC that begins at the deepest extent of the CoS and extends out laterally, whereas deep, continuous CoS have a TEC that begins at the shoulder of the CoS and extends only to the deepest extent of the CoS (Insausti et al., 1998; Ding and Van Hoesen, 2010). Therefore, a multi-atlas approach with CoS variant-specific atlases may be desirable to delineate the ERC and TEC accurately for a full population of subjects.
Finally, given the localization of tau to CA1 after initial deposits along the boundary of TEC and ERC (Braak and Braak, 1991), it is of interest to extend thickness analysis to this region. Unfortunately, the CA1 subfield cannot be segmented separately from the hippocampal formation in 3T T1 MRI. Previous volumetric analysis of the hippocampus has shown 9% atrophy in MCI subjects, compared to 27% volumetric atrophy of ERC plus TEC in MCI subjects (Kulason et al., 2019). Previous change point analysis of surface expansion/contraction metrics have shown a hippocampal change point 2–4 years prior to symptom onset, compared to 8–10 years prior to symptom onset for a Desikan-Killiany defined ERC (Younes et al., 2014). As more high resolution T2 MRI data become available, such as with data being collected in the more recent ADNI 3 protocol, it will be of interest to extend this thickness analysis to the CA1 subfield.
This study provides strong evidence that TEC and ERC thickness is a sensitive measure to progression to the symptomatic phase of Alzheimer's disease and that disease-related atrophy begins to occur at least 9 years prior to a clinical diagnosis of MCI.
Data Availability Statement
The data analyzed in this study is subject to the following licenses/restrictions: Individuals need to register with ADNI and agree to the conditions in the “ADNI Data Use Agreement” and undergo limited screening by the DPC before accessing data. Requests to access these datasets should be directed to http://adni.loni.usc.edu/data-samples/access-data/.
Ethics Statement
The studies involving human participants were reviewed and approved by Good Clinical Practice guidelines, the Declaration of Helsinki, and the US 21 CFR Part 50-Protection of Human Subjects, and Part 56-Institutional Review Boards (IRB). The patients/participants provided their written informed consent to participate in this study.
Author Contributions
SK and EX processed the data. SK performed the analysis, drafted the manuscript, and designed the figures. DT, MA, LY, and MM contributed to the design and implementation of the research and to the analysis of the results. All authors contributed to the editing of the manuscript.
Funding
This work was supported by the National Institutes of Health (P41-EB015909 and R01-EB020062); and the Kavli Neuroscience Discovery Institute. MM reports personal fees from AnatomyWorks, LLC, outside the submitted work, and jointly owns AnatomyWorks. Dr. Miller's relationship with AnatomyWorks is being handled under full disclosure by the Johns Hopkins University.
Conflict of Interest
The authors declare that the research was conducted in the absence of any commercial or financial relationships that could be construed as a potential conflict of interest.
Acknowledgments
A special thank you to Kanami Mori for her work on manually segmenting the 11T ex vivo MRI atlas and to Anthony Kolasny for maintaining the Center for Imaging Science server on which much of this analysis was run.
Data used in the preparation of this article were obtained from the Alzheimer's Disease Neuroimaging Initiative (ADNI) database (adni.loni.usc.edu). As such, the investigators within the ADNI contributed to the design and implementation of ADNI and/or provided data but did not participate in the analysis or writing of this report. A complete listing of ADNI investigators can be found at http://adni.loni.usc.edu/wp-content/uploads/how_to_apply/ADNI_Acknowledgement_List.pdf. Data collection and sharing for this project was funded by the Alzheimer's Disease Neuroimaging Initiative (ADNI) (National Institutes of Health Grant U01 AG024904) and DODADNI (Department of Defense award number W81XWH-12-2-0012). ADNI is funded by the National Institute on Aging, the National Institute of Biomedical Imaging and Bioengineering, and through generous contributions from the following: AbbVie, Alzheimer's Association; Alzheimer's Drug Discovery Foundation; Araclon Biotech; BioClinica, Inc.; Biogen; Bristol-Myers Squibb Company; CereSpir, Inc.; Cogstate; Eisai Inc.; Elan Pharmaceuticals, Inc.; Eli Lilly and Company; EuroImmun; F. Hoffmann-La Roche Ltd. and its affiliated company Genentech, Inc.; Fujirebio; GE Healthcare; IXICO Ltd.; Janssen Alzheimer Immunotherapy Research & Development, LLC; Johnson & Johnson Pharmaceutical Research & Development LLC; Lumosity; Lundbeck; Merck & Co, Inc.; Meso Scale Diagnostics, LLC; NeuroRx Research; Neurotrack Technologies; Novartis Pharmaceuticals Corporation; Pfizer Inc.; Piramal Imaging; Servier; Takeda Pharmaceutical Company; and Transition Therapeutics. The Canadian Institutes of Health Research is providing funds to support ADNI clinical sites in Canada. Private sector contributions are facilitated by the Foundation for the National Institutes of Health (www.fnih.org). The grantee organization is the Northern California Institute for Research and Education, and the study is coordinated by the Alzheimer's Therapeutic Research Institute at the University of Southern California. ADNI data are disseminated by the Laboratory for Neuroimaging at the University of Southern California.
Data from the BIOCARD study are supported by grant U19 AG033655 from the National Institute on Aging. The BIOCARD Study consists of 7 Cores with the following members: (1) The Administrative Core (MA, Barbara Rodzon), (2) the Clinical Core (MA, Anja Soldan, Rebecca Gottesman, Ned Sacktor, Corinne Pettigrew, Scott Turner, Leonie Farrington, Maura Grega, Jules, Gilles, Gay Rudow, Rostislav Brichko, Scott Rudow), (3) the Imaging Core (MM, Susumu Mori, Tilak Ratnanather, Anthony Kolasny, Hanzhang Lu, Kenichi Oishi, LY), (4) the Biospecimen Core (Abhay Moghekar, Jacqueline Darrow, Richard O'Brien), (5) the Informatics Core (Roberta Scherer, David Shade, Ann Ervin, Jennifer Jones, Hamadou Coulibaly, Kathy Moser), the (6) Biostatistics Core (Mei-Cheng Wang, Yuxin Zhu, Jiangxia Wang), and (7) the Neuropathology Core (Juan Troncoso, Olga Pletnikova, Karen Fisher). We would also like to acknowledge the members of the BIOCARD Scientific Advisory Board who provide oversight an guidance regarding the conduct of the study including: Drs. John Csernansky, David Holtzman, David Knopman, Walter Kukull and Kevin Duff, as well as Drs. Laurie Ryan and John Hsiao, who provide oversight on behalf of the NIA. Additionally, we recognize the members of the BIOCARD Resource Allocation Committee who provide ongoing guidance regarding the use of the biospecimens collected as part of the study, including: Drs. Constantine Lyketsos, Carlos Pardo, Gerard Schellenberg, Leslie Shaw, Madhav Thambisetty, and John Trojanowski. We would like to acknowledge the contributions of the Geriatric Psychiatry Branch (GPB) of the intramural program of the NIMH who initiated this study (PI: Dr. Trey Sunderland). Dr. Karen Putnam provided documentation of the GPB study procedures and the datafiles received from NIMH. We acknowledge the altruism of the participants and their families and contributions of the BIOCARD research and support staff for their contributions to this study.
References
Adler, D. H., Wisse, L. E., Ittyerah, R., Pluta, J. B., Ding, S.-L., Xie, L., et al. (2018). Characterizing the human hippocampus in aging and Alzheimer's disease using a computational atlas derived from ex vivo MRI and histology. Proc. Natl. Acad. Sci. U.S.A. 115, 4252–4257. doi: 10.1073/pnas.1801093115
Apostolova, L. G., Mosconi, L., Thompson, P. M., Green, A. E., Hwang, K. S., Ramirez, A., et al. (2010). Subregional hippocampal atrophy predicts Alzheimer's dementia in the cognitively normal. Neurobiol. Aging 31, 1077–1088. doi: 10.1016/j.neurobiolaging.2008.08.008
Atiya, M., Hyman, B. T., Albert, M. S., and Killiany, R. (2003). Structural magnetic resonance imaging in established and prodromal Alzheimer disease: a review. Alzheimer Dis. Assoc. Disord. 17, 177–195. doi: 10.1097/00002093-200307000-00010
Beg, M. F., Miller, M. I., Trouvé, A., and Younes, L. (2005). Computing large deformation metric mappings via geodesic flows of diffeomorphisms. Int. J. Comput. Vis. 61, 139–157. doi: 10.1023/B:VISI.0000043755.93987.aa
Braak, H., Alafuzoff, I., Arzberger, T., Kretzschmar, H., and Del Tredici, K. (2006). Staging of Alzheimer disease-associated neurofibrillary pathology using paraffin sections and immunocytochemistry. Acta Neuropathol. 112, 389–404. doi: 10.1007/s00401-006-0127-z
Braak, H., and Braak, E. (1991). Neuropathological stageing of Alzheimer-related changes. Acta Neuropathol. 4, 239–259. doi: 10.1007/BF00308809
Center for Integrative Biomedical Computing (2016). Seg3D: Volumetric Image Segmentation and Visualization. Scientific Computing and Imaging Institute (SCI). Available online at: http://www.seg3d.org
Csernansky, J. G., Wang, L., Swank, J., Miller, J. P., Gado, M., McKeel, D., et al. (2005). Preclinical detection of Alzheimer's disease: hippocampal shape and volume predict dementia onset in the elderly. Neuroimage 25, 783–792. doi: 10.1016/j.neuroimage.2004.12.036
den Heijer, T., Geerlings, M. I., Hoebeek, F. E., Hofman, A., Koudstaal, P. J., and Breteler, M. M. (2006). Use of hippocampal and amygdalar volumes on magnetic resonance imaging to predict dementia in cognitively intact elderly people. Arch. Gen. Psychiatry 63, 57–62. doi: 10.1001/archpsyc.63.1.57
Desikan, R. S., Ségonne, F., Fischl, B., Quinn, B. T., Dickerson, B. C., Blacker, D., et al. (2006). An automated labeling system for subdividing the human cerebral cortex on MRI scans into gyral based regions of interest. Neuroimage 31, 968–980. doi: 10.1016/j.neuroimage.2006.01.021
Devanand, D. P., Pradhaban, G., Liu, X., Khandji, A., De Santi, S., Segal, S., et al. (2007). Hippocampal and entorhinal atrophy in mild cognitive impairment prediction of Alzheimer disease. Neurology 68, 828–836. doi: 10.1212/01.wnl.0000256697.20968.d7
Dickerson, B., Stoub, T., Shah, R., Sperling, R., Killiany, R., Albert, M., et al. (2011). Alzheimer-signature MRI biomarker predicts AD dementia in cognitively normal adults. Neurology 76, 1395–1402. doi: 10.1212/WNL.0b013e3182166e96
Ding, S.-L., and Van Hoesen, G. W. (2010). Borders, extent, and topography of human perirhinal cortex as revealed using multiple modern neuroanatomical and pathological markers. Hum. Brain Mapp. 31, 1359–1379. doi: 10.1002/hbm.20940
Durrleman, S., Fletcher, T., Gerig, G., and Niethammer, M. (2012). “Spatio-temporal image analysis for longitudinal and time-series image data,” in Second International Workshop, STIA 2012, Held in Conjunction with MICCAI 2012 (Nice: Springer). doi: 10.1007/978-3-642-33555-6
Huntgeburth, S. C., and Petrides, M. (2012). Morphological patterns of the collateral sulcus in the human brain. Eur. J. Neurosci. 35, 1295–1311. doi: 10.1111/j.1460-9568.2012.08031.x
Insausti, R., Juottonen, K., Soininen, H., Insausti, A. M., Partanen, K., Vainio, P., et al. (1998). MR volumetric analysis of the human entorhinal, perirhinal, and temporopolar cortices. Am. J. Neuroradiol. 19, 659–671. doi: 10.1016/S0197-4580(98)00007-4
Jack, C. R., Shiung, M. M., Gunter, J. L., O'brien, P. C., Weigand, S. D., Knopman, D. S., et al. (2004). Comparison of different MRI brain atrophy rate measures with clinical disease progression in AD. Neurology 62, 591–600. doi: 10.1212/01.WNL.0000110315.26026.EF
Kantarci, K., and Jack, C. R. (2003). Neuroimaging in Alzheimer disease: an evidence-based review. Neuroimaging Clin. 13, 197–209. doi: 10.1016/S1052-5149(03)00025-X
Kantarci, K., and Jack, C. R. (2004). Quantitative magnetic resonance techniques as surrogate markers of Alzheimer's disease. NeuroRx 1, 196–205. doi: 10.1602/neurorx.1.2.196
Krimer, L. S., Hyde, T. M., Herman, M. M., and Saunders, R. C. (1997). The entorhinal cortex: an examination of cyto-and myeloarchitectonic organization in humans. Cereb. Cortex 7, 722–731. doi: 10.1093/cercor/7.8.722
Kulason, S., Tward, D. J., Brown, T., Sicat, C. S., Liu, C.-F., Ratnanather, J. T., et al. (2019). Cortical thickness atrophy in the transentorhinal cortex in mild cognitive impairment. Neuroimage Clin. 21:101617. doi: 10.1016/j.nicl.2018.101617
La Joie, R., Perrotin, A., Barré, L., Hommet, C., Mézenge, F., Ibazizene, M., et al. (2012). Region-specific hierarchy between atrophy, hypometabolism, and β-amyloid (Aβ) load in Alzheimer's disease dementia. J. Neurosci. 32, 16265–16273. doi: 10.1523/JNEUROSCI.2170-12.2012
Ma, J., Miller, M. I., Trouvé, A., and Younes, L. (2008). Bayesian template estimation in computational anatomy. Neuroimage 42, 252–261. doi: 10.1016/j.neuroimage.2008.03.056
Maass, A., Berron, D., Libby, L. A., Ranganath, C., and Düzel, E. (2015). Functional subregions of the human entorhinal cortex. eLife 4:e06426. doi: 10.7554/eLife.06426
Miller, M. I., Ratnanather, J. T., Tward, D. J., Brown, T., Lee, D. S., Ketcha, M., et al. (2015a). Network neurodegeneration in Alzheimer's disease via MRI based shape diffeomorphometry and high-field atlasing. Front. Bioeng. Biotechnol. 3:54. doi: 10.3389/fbioe.2015.00054
Miller, M. I., Younes, L., Ratnanather, J. T., Brown, T., Trinh, H., Lee, D. S., et al. (2015b). Amygdalar atrophy in symptomatic Alzheimer's disease based on diffeomorphometry: the BIOCARD cohort. Neurobiol. Aging 36:S3–S10. doi: 10.1016/j.neurobiolaging.2014.06.032
Miller, M. I., Younes, L., Ratnanather, J. T., Brown, T., Trinh, H., Postell, E., et al. (2013). The diffeomorphometry of temporal lobe structures in preclinical Alzheimer's disease. Neuroimage Clin. 3, 352–360. doi: 10.1016/j.nicl.2013.09.001
Nelson, P. T., Alafuzoff, I., Bigio, E. H., Bouras, C., Braak, H., Cairns, N. J., et al. (2012). Correlation of Alzheimer disease neuropathologic changes with cognitive status: a review of the literature. J. Neuropathol. Exp. Neurol. 71, 362–381. doi: 10.1097/NEN.0b013e31825018f7
Nichols, T., and Hayasaka, S. (2003). Controlling the familywise error rate in functional neuroimaging: a comparative review. Stat. Methods Med. Res. 12, 419–446. doi: 10.1191/0962280203sm341ra
Olsen, R. K., Carr, V. A., Daugherty, A. M., La Joie, R., Amaral, R. S., Amunts, K., et al. (2019). Progress update from the hippocampal subfields group. Alzheimers Dement. Diagn. Assess. Dis. Monitor. 11, 439–449. doi: 10.1016/j.dadm.2019.04.001
Pettigrew, C., Soldan, A., Zhu, Y., Wang, M.-C., Moghekar, A., Brown, T., et al. (2016). Cortical thickness in relation to clinical symptom onset in preclinical AD. Neuroimage Clin. 12, 116–122. doi: 10.1016/j.nicl.2016.06.010
Ratnanather, J. T., Arguillére, S., Kutten, K. S., Hubka, P., Kral, A., and Younes, L. (2019). “Chapter 7: 3D normal coordinate systems for cortical areas,” in Mathematics of Shapes and Applications, Vol. 37 (Singapore: World Scientific), 167–180. doi: 10.1142/9789811200137_0007
Soldan, A., Pettigrew, C., Lu, Y., Wang, M.-C., Selnes, O., Albert, M., et al. (2015). Relationship of medial temporal lobe atrophy, APOE genotype, and cognitive reserve in preclinical Alzheimer's disease. Hum. Brain Mapp. 36, 2826–2841. doi: 10.1002/hbm.22810
Sperling, R. A., Aisen, P. S., Beckett, L. A., Bennett, D. A., Craft, S., Fagan, A. M., et al. (2011). Toward defining the preclinical stages of Alzheimer's disease: recommendations from the National Institute on Aging-Alzheimer's Association workgroups on diagnostic guidelines for Alzheimer's disease. Alzheimers Dement. 7, 280–292. doi: 10.1016/j.jalz.2011.03.003
Tang, X., Miller, M. I., and Younes, L. (2017). Biomarker change-point estimation with right censoring in longitudinal studies. Ann. Appl. Stat. 11:1738. doi: 10.1214/17-AOAS1056
Tward, D., Miller, M., Alzheimer's Disease Neuroimaging Initiative (2017a). “Unbiased diffeomorphic mapping of longitudinal data with simultaneous subject specific template estimation,” in Graphs in Biomedical Image Analysis, Computational Anatomy and Imaging Genetics (Cham: Springer), 125–136. doi: 10.1007/978-3-319-67675-3_12
Tward, D. J., Sicat, C. S., Brown, T., Bakker, A., Gallagher, M., Albert, M., et al. (2017b). Entorhinal and transentorhinal atrophy in mild cognitive impairment using longitudinal diffeomorphometry. Alzheimers Dement. 9, 41–50. doi: 10.1016/j.dadm.2017.07.005
Wolk, D. A., Das, S. R., Mueller, S. G., Weiner, M. W., Yushkevich, P. A., Initiative, A. D. N., et al. (2017). Medial temporal lobe subregional morphometry using high resolution MRI in Alzheimer's disease. Neurobiol. Aging 49, 204–213. doi: 10.1016/j.neurobiolaging.2016.09.011
Xie, L., Das, S. R., Wisse, L. E., Ittyerah, R., Yushkevich, P. A., Wolk, D. A., et al. (2018). Early tau burden correlates with higher rate of atrophy in transentorhinal cortex. J. Alzheimers Dis. 62, 85–92. doi: 10.3233/JAD-170945
Xie, L., Pluta, J. B., Das, S. R., Wisse, L. E., Wang, H., Mancuso, L., et al. (2017). Multi-template analysis of human perirhinal cortex in brain MRI: explicitly accounting for anatomical variability. Neuroimage 144, 183–202. doi: 10.1016/j.neuroimage.2016.09.070
Keywords: transentorhinal, entorhinal, preclinical, cortical thickness, change point, diffeomorphometry
Citation: Kulason S, Xu E, Tward DJ, Bakker A, Albert M, Younes L and Miller MI (2020) Entorhinal and Transentorhinal Atrophy in Preclinical Alzheimer's Disease. Front. Neurosci. 14:804. doi: 10.3389/fnins.2020.00804
Received: 14 April 2020; Accepted: 09 July 2020;
Published: 21 August 2020.
Edited by:
Jie Tu, Chinese Academy of Sciences, ChinaReviewed by:
Ricardo Insausti, University of Castilla-La Mancha, SpainJosé Luna-Muñoz, Universidad Nacional Autonóma de México, Mexico
Copyright © 2020 Kulason, Xu, Tward, Bakker, Albert, Younes, and Miller. This is an open-access article distributed under the terms of the Creative Commons Attribution License (CC BY). The use, distribution or reproduction in other forums is permitted, provided the original author(s) and the copyright owner(s) are credited and that the original publication in this journal is cited, in accordance with accepted academic practice. No use, distribution or reproduction is permitted which does not comply with these terms.
*Correspondence: Sue Kulason, skulaso1@jhu.edu