 Yang Yu
 Ziqi Li
 Yajie Lin1
 Guoping Peng
 Xize Jia
 Benyan Luo
- 1Department of Neurology, First Affiliated Hospital, School of Medicine, Zhejiang University, Hangzhou, China
- 2School of Information and Electronics Technology, Jiamusi University, Jiamusi, China
- 3Center for Cognition and Brain Disorders, Institutes of Psychological Sciences, Hangzhou Normal University, Hangzhou, China
- 4Zhejiang Key Laboratory for Research in Assessment of Cognitive Impairments, Hangzhou, China
Numerous observational studies have shown that depressive symptoms are common in individuals with mild cognitive impairment (MCI) who have a higher rate of progress to dementia. However, it is still uncertain whether there are any differences between MCI patients with and without depression symptom in their brain function activities. Here we have identified the brain function activity differences in two groups of MCI patients (with depression or without depression) using the resting state MRI (rsfMRI) measurements. 76 right-handed MCI subjects have been recruited in this study, including 27 MCI patients with depression symptom (MCID), 49 MCI patients without depression symptom (MCIND). Analyses based on 7 rsfMRI measurements, including four static measurements (ALFF, fALFF, PerAF, and ReHo) and three dynamic measurements (dALFF, dfALFF, and dReHo) have been used to explore the temporal variability of intrinsic brain activity. No significant differences in ALFF and dALFF between the two group were found. In the MCID group, fALFF decreased in temporal gyrus, frontal gyrus, inferior occipital gyrus, middle frontal gyrus and cerebellum, but increased in cuneus, calcarine, lingual; while PerAF increased in left parahippocampus. The differences of ReHo in the two groups was only found in cerebellum. Compared to MCIND group, dfALFF in MCID decreased in cuneus, occipital gyrus and calcarine, while dReHo in MCID increased in bilateral temporal gyrus, frontal gyrus, superior parietal gyrus, inferior parietal gyrus and precuneus. Our results may provide a better understanding in the relationship between the depressive symptoms and memory deficits.
Introduction
Mild cognitive impairment (MCI) is the clinical status of an individual with memory impairment who had memory defect but is otherwise functioning properly and does not meet clinical diagnosis criteria for dementia (Petersen et al., 1999, 2001). Cognitive deficits can be a single symptom, they also coexist with other non-cognitive features, of all the non-cognitive features, the prevalence of depression is the highest (Chi et al., 2015). Further, evidence suggests that MCI patients combined with depression symptoms (MCID) progress more rapidly from MCI to Alzheimer’s disease (AD) along the neurodegenerative spectrum, with a reported prevalence of 32% (Gao et al., 2013; Chi et al., 2015; Ismail et al., 2017). Thus, for early diagnosis and treatment purposes, an appropriate screening strategy to define the probable risk factors in those cognitive impaired individuals is meaningful (Ismail et al., 2017).
In recent years, based on the development of neuroimaging technology, magnetic resonance imaging, as a tool for detecting brain structure and function has been provided. Blood oxygenation level-dependent (BOLD) resting-state functional MRI (rsfMRI), has attracted enormous research interest in studying the neural mechanisms of cognitive dysfunction in individuals with psychiatric disorders (Biswal, 2012). Various rsfMRI measures such as functional connectivity (FC) (Biswal et al., 1995), amplitude of low-frequency fluctuation (ALFF) (Zang et al., 2007) fractional ALFF (fALFF) (Zou et al., 2008), percent amplitude of fluctuation (PerAF) (Jia et al., 2017, 2019) regional homogeneity (ReHo) (Zang et al., 2004) and degree centrality (DC) (Zuo et al., 2012) have been used to describe the intrinsic brain activity (IBA). IBA involves dynamic neural and metabolic activities, it is activity and plays a pivotal role in brain function (Dai and He, 2014; Raichle, 2015). These methods have been widely used to evaluate the IBA of neurological disorders or neuropsychiatric disorders, such as AD, depression, and MCI (Yao et al., 2009; Zhang et al., 2012; Guo et al., 2016; Wee et al., 2016; Li et al., 2017; Stoyanov et al., 2017; Zhang et al., 2017; Kandilarova et al., 2018; Yang et al., 2018; Liu et al., 2019). Furthermore, evidence indicated that once brain got an internal or external stimuli, it could respond by dynamic integration or adjustment over multiple time scales (Hutchison et al., 2013; Bassett and Sporns, 2017; Yan et al., 2017). However, the aforementioned measures are static, which ignoring the characteristics of dynamic changes of IBA over time, they assumed that during the entire rsfMRI scan, the BOLD signal is stationary (Liao et al., 2014, 2015). Compared with the static rsfMRI measures, the dynamic sliding window approaches are effective for capturing the dynamic characteristics of regional brain activity over different times which could be used to examine abnormal brain function (Yan et al., 2017; Tang et al., 2018). These evidence all indicated that rsfMRI is a proper approach to compare the differences between MCID and MCIND.
Studies have identified regions in MCI compared with the NC, with a decreased or increased ALFF/fALFF/ReHo (Han et al., 2011; Zhang et al., 2012; Dai and He, 2014; Li et al., 2017; Liu et al., 2018, 2019; Yang et al., 2018). Previous study found that changes from ALFF/fALFF measurements of IBA may be worthwhile to characterize the early and gradual changes in physiological alterations throughout AD progression (Yang et al., 2018). Moreover, in MCID group the FC density values were higher in the left MTG than those in the MCI without depression patients (MCIND) (Liu et al., 2018). Another study found that abnormal ALFF values in MCID group could serve as markers to effectively differentiate MCID from MCI patients (Li et al., 2017). As for ReHo, it can be used to classify the depression subtypes and MCI, also changes in ReHo could be a biomarker for the pathophysiology and therapeutic response of depression (Guo et al., 2013; Liu et al., 2019). Previously, by combining dynamic FC with static FC, some studies found that the diagnostic accuracy for MCI could be significantly improved (Wee et al., 2016; Zhang et al., 2017). So far, no study explored the dynamic characteristics of local brain activity indexes in MCID patients.
We employed 7 resting state measurements, including four static measurements (ALFF, fALFF, PerAF, and ReHo) and three dynamic measurements (dALFF, dfALFF, and dReHo) to investigate the temporal variability of voxel-wise brain activity. These combinations were designed to explore the variability of IBA and to enhance our understanding of brain function by recognizing specific pathophysiological features and further deepen our understanding of cognitive behavior. We assumed that MCID patients would exhibit abnormal spontaneous brain activity compared with those MCIND. These would enhance understanding of the relationship between depressive symptoms and memory deficits.
Materials and Methods
Participants
The study was endorsed by the Research Ethics Review Board of the First Affiliated Hospital of Medical School of Zhejiang University (FAHZU). A total of 76 right-handed MCI subjects were recruited in the study, including 27 patients combined with depression symptoms (MCID), 49 MCI without depression patients (MCIND). All MCI patients were recruited at the clinic of the Department of Neurology, FAHZU. Diagnoses of MCI were made by experienced neurologists according to Petersen’s criteria (Petersen, 2004). Depressive symptoms were identified by qualified psychiatrists according to the Diagnostic and Statistical Manual of Mental Disorders, fifth edition (DSM-V) and the Geriatric Depression Scale (GDS) (Yesavage et al., 1982; Chau et al., 2006) [we also recruited 50 right-handed normal controls, who were matched for age and gender from the local communities (Supplementary Methods in Supplementary Material)].
The diagnosis of MCID and MCIND both fulfilled the published MCI diagnostic criteria (Petersen, 2004). The inclusion criteria for the MCID group included an acute episode of mild depression with DSM-V for the diagnosis of depression symptom who were first suffered from MCI and the 30-item GDS was > 10 scores (Yesavage et al., 1982; Chau et al., 2006). The MCIND subjects were excluded if they had been diagnosed with major depression, recurrent depression, or other psychiatric disorders as described in DSM-V.
Imaging Data Acquisition
MRI data were obtained using a 3.0 Tesla GE Discovery MR750 scanner (HD, General Electric Healthcare, Waukesha, WI, United States). 3D T1-weighted structural images were acquired using the following parameters: 128 slices, TR of 8,100 ms, TE of 3.1 ms, slice thickness of 1 mm, FA of 8°, matrix size of 256 × 256, FOV of 256 × 256 mm2. Functional images were acquired using the following parameters: 43 contiguous axial slices, repetition time (TR) of 2,000 ms, echo time (TE) of 30 ms, slice thickness of 3.2 mm, flip angle (FA) of 90°, matrix size of 64 × 64, field of view (FOV) of 200 × 200 mm2, total scan time of 8’00”. During the rsfMRI scan, the patients were given no task but were instructed to simply rest with eyes closed.
rsfMRI Preprocessing
The rsfMRI data were processed using SPM121 and RESTplus (Jia et al., 2019)2. The first 10 time points were discarded as adaptation of the participant to the scanner noise. The data preprocessing steps included slice timing, realignment, and spatial normalization. First, an individual T1-weighted image was co-registered to the mean functional image and then the T1-weighted image was segmented into gray matter (GM), white matter (WM) signal, and cerebrospinal fluid (CSF) signal. The EPI images were spatially normalized to the Montreal Neurological Institute (MNI) space and voxel size was resampled to 3 mm × 3 mm × 3 mm using the normalization parameters estimated during segmentation. Smoothing was performed with a 6 mm full width - half maximum (FWHM) Gaussian kernel. After removing the linear trend, we regressed out of covariates, which consisted of Friston-24 head motion parameters (Friston et al., 1996; Yan et al., 2013), WM signal, and CSF signal. The time courses were filtered by a (0.01–0.08 Hz) band to reduce high-frequency noise and low-frequency drifts.
Static ALFF, Fractional ALFF (fALFF), Percent Amplitude of Fluctuation (PerAF) and Regional Homogeneity (ReHo) Calculation
We performed ALFF, fALFF, PerAF and ReHo analysis for each scan. The calculation of ALFF was based on fast Fourier transform (FFT). Using FFT, each time course was converted to the frequency domain. Then, the square root of the power spectrum at each frequency was averaged across the filtered band (0.01–0.08 Hz). The ALFF of each voxel was then normalized by the global mean of the ALFF values (mALFF) for standardization. For each given voxel, mALFF reflected the degree of its raw ALFF value relative to the average ALFF value of the whole brain (Zang et al., 2007). Then we calculated fALFF by obtaining the ratio of the power spectrum of low frequency (0.01–0.08 Hz) to that of the entire frequency range. Then, the resulting spatial fALFF maps were then divided with each voxel divided by the whole-brain fALFF mean (mfALFF), providing mfALFF spatial maps (Zou et al., 2008). PerAF designated the percentage amplitude of BOLD fluctuation relative to the mean BOLD signal intensity of a given time series (Jia et al., 2017) with RESTplus (Jia et al., 2019). PerAF is standardized at the single voxel level, the resulting spatial PerAF maps were then normalized with each voxel divided by the global mean PerAF (mPerAF). Both PerAF and mPerAF can be used for group-level statistical analysis, here we used mPerAF for further statistical analyses (Jia et al., 2019; Yu et al., 2019). For ReHo, the Kendall’s coefficient of concordance (KCC) of the time course of every 27 nearest neighboring voxels was calculated (Zang et al., 2004). To reduce the influence of individual variations in the KCC value, ReHo map normalizations were performed by dividing the KCC among each voxel by the averaged KCC of the whole brain.
Dynamic ALFF, fALFF and ReHo Calculation
Dynamic parameters were performed using Temporal Dynamic Analysis (TDA) toolkits based on DPABI (Yan et al., 2016) Sliding window-based analysis, which is sensitive in detecting time-dependent variations, was applied to examine three dynamic measurements (dALFF, dfALFF or dReHo) variability over the whole brain (Hindriks et al., 2016; Liu et al., 2017; Yan et al., 2017; Yip et al., 2017; Tang et al., 2018; Vergara et al., 2019).
In the sliding window analysis, a temporal window of certain size and shape is chosen, and ALFF, fALFF and ReHo within that window are calculated. Theoretically, the window size should be designed feasibly. It should be small enough to monitor potentially transient signals, and yet large enough to describe the lowest frequencies of interest in the signals (Sakoglu et al., 2010). Previous studies of sliding window connectivity have applied a sliding window length from to 10 to 180 s (Thompson et al., 2013; Gonzalez-Castillo et al., 2015; Chen et al., 2018). Here we applied a sliding window length of 32 TR (64 s) and a shifting step size of two TR (4 s) (Chen et al., 2018). The remaining 230 time points after removing the first 10 time points for each individual were segmented into 100 windows in total. In each sliding window, ALFF, fALFF and ReHo were calculated. After calculating ALFF of all voxel in time windows, each participant will get several window-based ALFF maps (similar as fALFF and ReHo). Then, we computed the mean and standard deviation of each voxel in all window-based ALFF maps for each subject and further got the corresponding coefficient of variation (CV) which was acquired by dividing the standard deviation by the mean. To better measure the dynamic variation of regional brain activity between different individuals, we used CV as dALFF (similar as dfALFF), which represented the temporal variability of absolute energy consumption in low-frequency regional brain activity (Tang et al., 2018).
Statistical Analyses
Scales Analysis
To examine the between-group differences in the seven measurements, two-sample t-test was held between the MCID and MCIND groups using DPABI (Yan et al., 2016). The figure was drawn by both DPABI and BrainNet Viewer (Xia et al., 2013; Yan et al., 2016). To reduce the effect of confounding variables in the statistical analysis, we performed two-sample t-tests with the mean relative displacements of age, sex, and education as covariance. Multiple comparison correction was performed based on Gaussian random field theory (GRF, voxel-wise p < 0.05, cluster-wise p < 0.05, two-tailed).
Correlation Analysis
With the peak voxels of abnormal regions as spherical centers, spherical ROIs were constructed around these abnormal regions (with a 6 mm radius). To assess the relationship between the behavioral scores (include MMSE, MoCA and GDS scores) and metrics in these abnormal regions, we used Partial correlation analysis that controlled for age, sex and education by SPSS software (version 20.0; IBM, Chicago, IL, United States). Statistical significance was defined as p < 0.05. To control for false positives from multiple comparisons, we used the false discovery rate (FDR) correction in which the p-values were multiplied by the number of comparisons.
Results
Neuropsychological Results
Demographic and clinical characteristics of 76 patients with MCI, 49 MCIND (19 men; mean age, 65.88 ± 9.762 years) and 27 MCID (11 men; mean age, 63.44 ± 10.58 years) are listed in Table 1. No significant differences were found (p > 0.05) in gender, age, education level, and MMSE, MoCA scores between the MCID group and MCIND group. Detailed demographics and the psychological characteristics of the two groups are shown in Table 1.
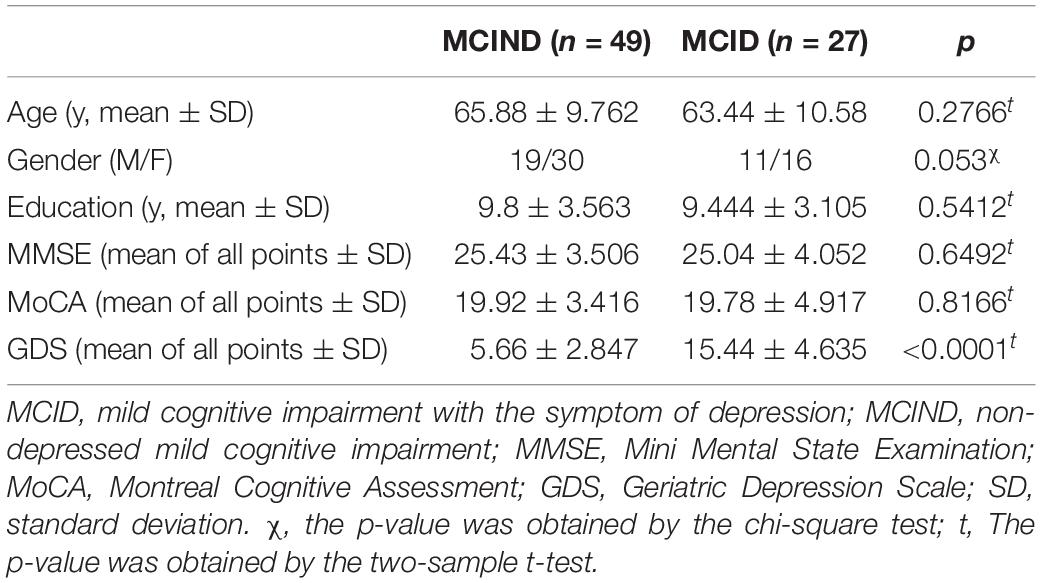
Table 1. Demographic and neuropsychological data.
Alterations of Region IBA Changes Between MCID and MCIND
The Comparison of ALFF
There were no significant differences in ALFF between the MCID group and MCIND group.
The Comparison of fALFF
As shown in the Figure 1, for fALFF, MCID decreased in inferior temporal gyrus (ITG), middle temporal gyrus (MTG), middle frontal gyrus, inferior occipital gyrus, and cerebellum, but increased in cuneus, calcarine, lingual. The significant differences in fALFF between the two groups are shown in Table 2 and Figure 1A.
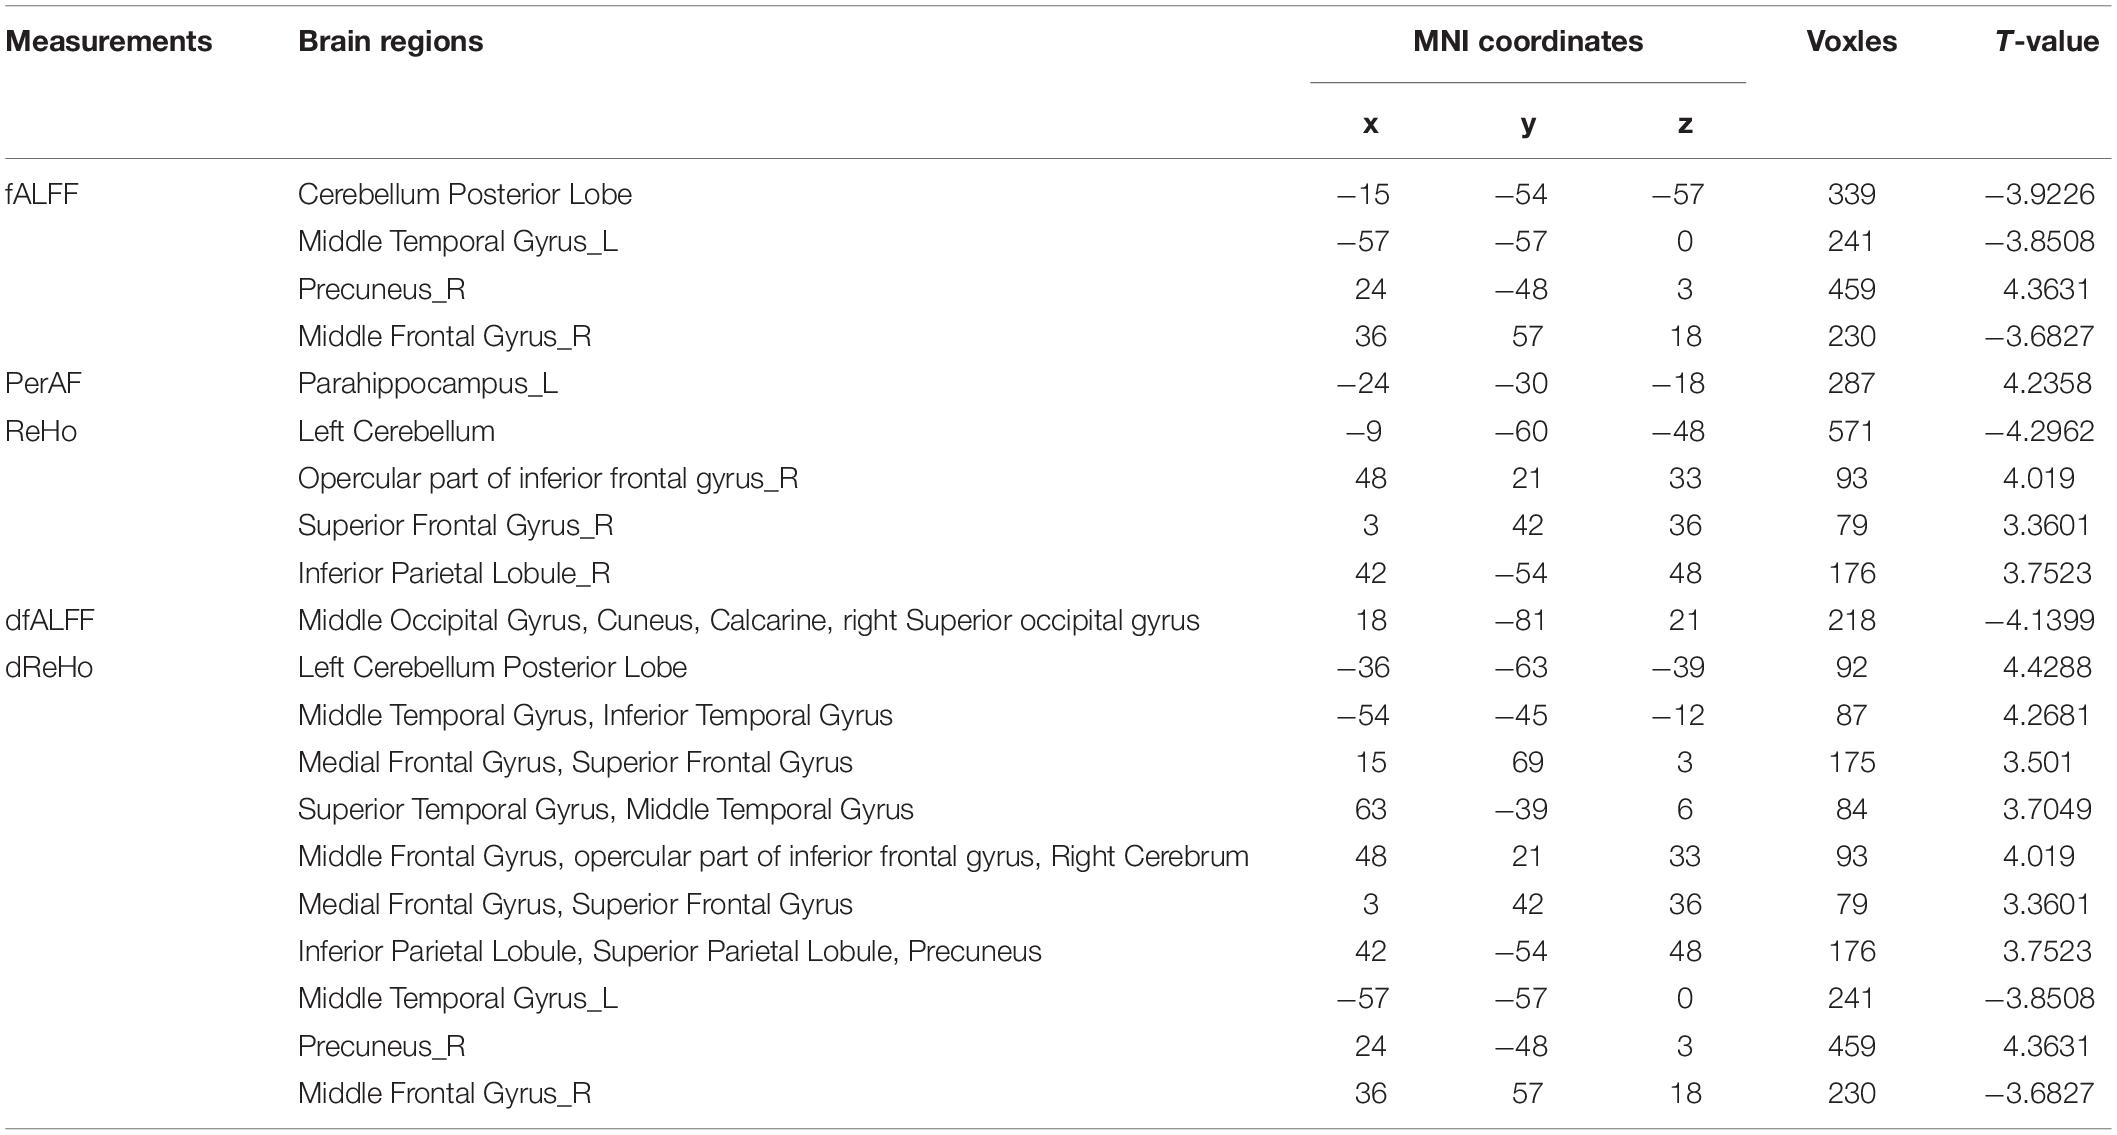
Table 2. Brain regions with significantly differences rsfMRI values in the MCID group compared with the MCIND group.
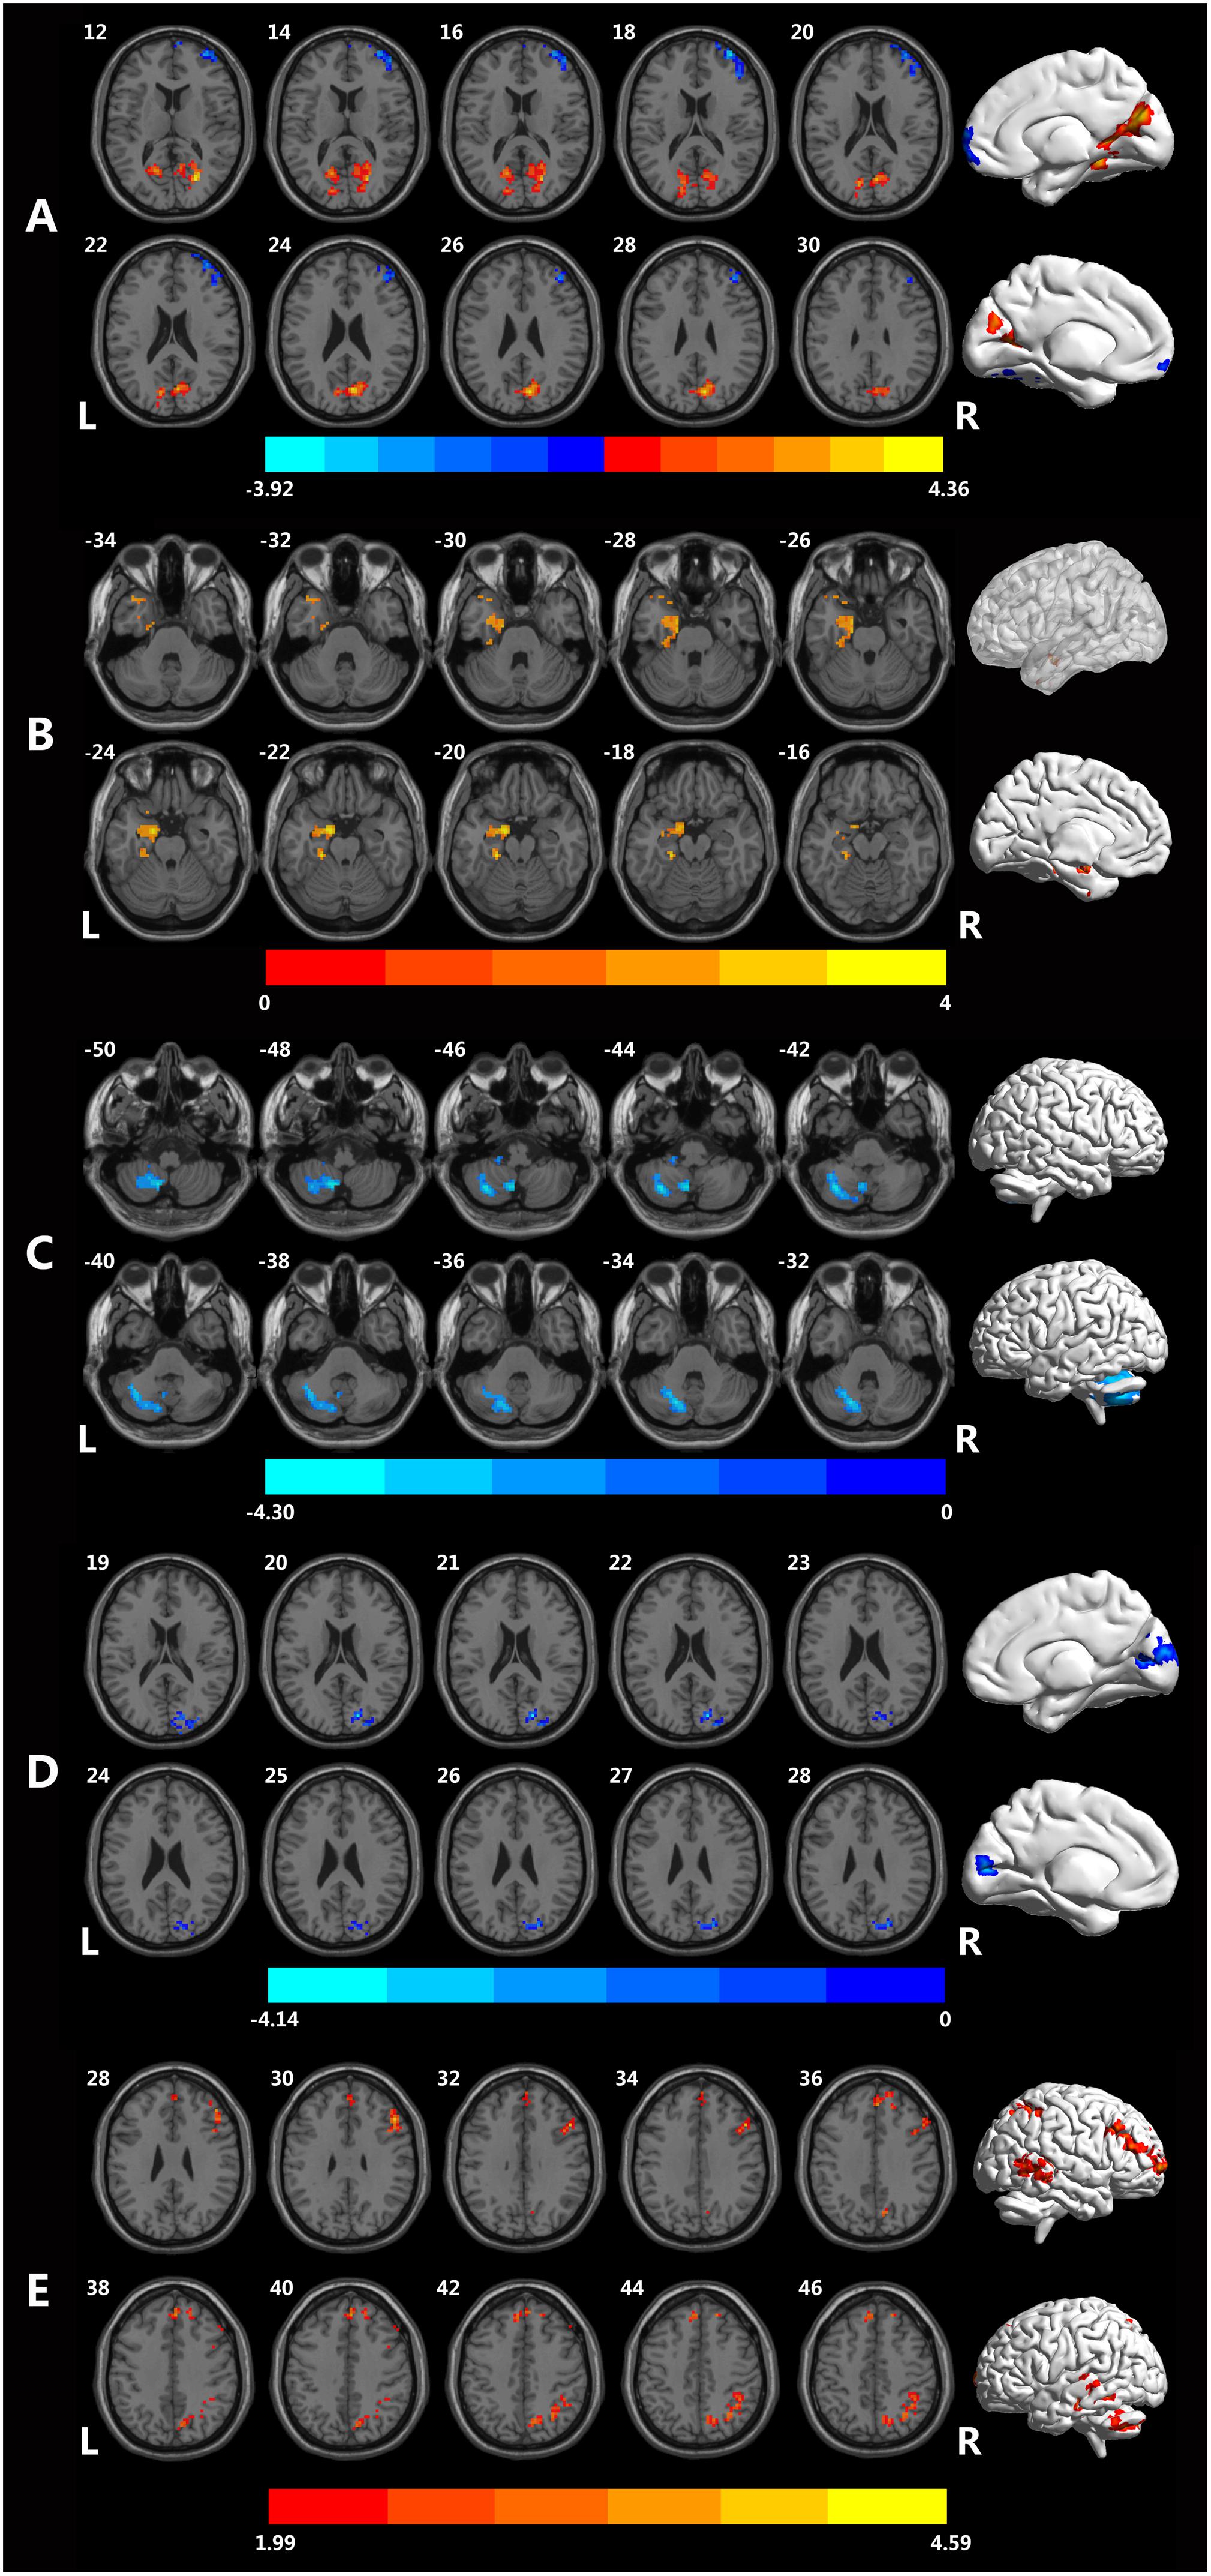
Figure 1. Brain regions showing different rsfMRI values between the MCID and MCIND groups. (A) Brain regions with significant differences in fALFF between the MCID group and MCIND group. (B) Brain regions with significant differences in PerAF between the MCID group and MCIND group. (C) Brain regions with significant differences in ReHo between the MCID group and MCIND. (D) Brain regions with significant differences in dfALFF between the MCID group and MCIND group. (E) Brain regions with significant differences in dReHo between the MCID group and MCIND group (after GRF correction; voxel-wise p < 0.05, cluster-wise p < 0.05, two-tailed). The color bar indicates the T-value.
The Comparison of PerAF
We found that in MCID group, PerAF increased in left parahippocampus gyrus and temporal gyrus. The significant differences in PerAF between the MCID and MCIND group are shown in Table 2 and Figure 1B.
The Comparison of ReHo
Using ReHo, there were only a small amount of group differences between MCID and MCIND group in cerebellum. More details were shown in the Table 2 and Figure 1C.
The Comparison of dALFF
There were no significant differences in dALFF between the MCID group and MCIND group.
The Comparison of dfALFF
As shown in the Figure 1, for dALFF, compared to MCIND group, MCID group showed decreased dALFF in the bilateral cuneus, middle occipital gyrus, right superior occipital gyrus and calcarine. The significant differences in dfALFF between the MCID group and MCIND group are shown in Table 2 and Figure 1D.
The Comparison of dReHo
Using dReHo, compared to MCIND group, MCID group exhibited obvious increase in bilateral MTG, ITG, superior temporal gyrus (STG), superior parietal lobule, inferior parietal gyrus (IPG), precuneus, superior frontal gyrus (SFG), middle frontal gyrus (MFG), opercular part of inferior frontal gyrus (IFG) and right cerebellum. More details were shown in the Table 2 and Figure 1E.
Correlational Analysis
There was no significant correlation between clinical behavioral scores and any rsfMRI metrics.
Discussion
Most previous studies have focused on the depression-related or MCI-related brain functional changes. However, the brain function in MCI patients combined with depression is still uncertain. In the current study, we observed alterations in IBA during the resting state in 7 resting state parameters, including four static measurements and three dynamic characteristics in MCID and MCIND patients. We found several brain regions especially in frontal gyrus, temporal gyrus and parahippocampus gyrus, showed significant differences in fALFF, PerAF, ReHo, dfALFF and dReHo between the MCID and MCIND groups. These findings may develop a better understanding of the relationship between depressive symptoms and memory deficits.
As we supposed, the differences of abnormal spontaneous brain activity between MCID and MCIND patients could be distinguished by rsfMRI. We found significant differences between MCID and MCIND group in frontal gyrus [included superior frontal gyrus (SFG), middle frontal gyrus (MFG) and inferior frontal gyrus (IFG)], temporal gyrus (included MTG, ITG and STG), hippocampus, parahippocampus gyrus, IPG and cuneus. The robustness of the results was tested to prove the regions we found was stability and repeatability (Supplementary Figures S2, S3). In the studies pretend to explore the neural mechanism about MCI, AD or depression, these regions also have been mentioned (Langenecker et al., 2007; Alexopoulos et al., 2008; Yao et al., 2009; Lee et al., 2012; Xie et al., 2012; Zhang et al., 2012; Rizio and Dennis, 2014; Guo et al., 2016; Stoyanov et al., 2017; Kandilarova et al., 2018; Yang et al., 2018; Kandilarova et al., 2019). These brain regions may be the proof of a possible shared pathophysiology in both depression and MCI (Yao et al., 2009; Zhang et al., 2012). Other studies found that depressive symptoms in AD had biochemical manifestations similar to depression, suggesting that they might share a common pathway at the biochemical level, this phenomenon may be same in those MCI (Langenecker et al., 2007; Alexopoulos et al., 2008; Lee et al., 2012; Xie et al., 2012; Taylor et al., 2013; Rizio and Dennis, 2014). In studies focused on brain structure found that depression may cause structural changes in frontal and temporal regions (Koolschijn et al., 2009; Kandilarova et al., 2019). These findings suggested that a circuit may be involved in the frontal cortex is associated with the functional neuroanatomy of depression (Langenecker et al., 2007; Yang et al., 2016).
Meanwhile, regions we found the IBA changes mostly related to default mode network (DMN) and executive control network (ECN). Executive functions are control mechanisms that adjust aspects of emotion and cognition, and disruption to these processes is related to worse clinical prognosis of depression (Morimoto et al., 2015). According to previous neuroimaging studies, the DMN s linked to self-referential thought, and the episodic memory retrieval and scene construction (Lei et al., 2013). It is supported by results from previous studies about late-life depression (LLD). LLD usually has a hyperactive DMN (increased rumination, defected cognition) and a hypoactive ECN (low cognitive control associated with emotional response), which may reflect clinical features of depressive symptoms (Aizenstein et al., 2014; Karim et al., 2017).
Above all the parameters we estimated, we didn’t find significant differences in ALFF or dALFF. It has been pointed out that the ALFF could be influenced by the physiological noise irrelevant to brain activity, and dALFF has a temporal variability related to specific topographic (Zou et al., 2008; Liao et al., 2019). As for fALFF, it could effectively suppress the physiological noise, but is not as stable as ALFF in gray matter regions (Zou et al., 2008; Zuo et al., 2010). We firstly used PerAF to estimate IBA of MCID patients, in parahippocampus, MCID had an increased PerAF. Previous study by using both ALFF and PerAF found that the ALFF was similar to PerAF, but PerAF was better than ALFF in inter-scanner reliability (Zhao et al., 2018). Although it is still unclear what causes the difference between those parameters and the potential physiological significance might be, with the limitation of each parameters, it is still necessary to take into consideration all these metrics (Zuo et al., 2010). We found ReHo only decreased in cerebellum, while another study found that MCID patients showed significantly higher coherence ReHo (cReHo) than MCIND patients in the left Heschl’s gyrus and thalamus, lower cReHo in the left postcentral gyrus (Liu et al., 2019). These differences may be influenced by different calculation of ReHo. Also, the recruit criteria of MCID group could be another factor. Depression is a highly heterogeneous disease, and there are no clear gold biomarkers for diagnosis (Ismail et al., 2017). In addition, the diagnose of depression syndrome is based on clinical symptoms and a rating scale, which is inevitably subjective. Further, evidence suggests that evaluating depressive symptoms comprehensively and accurately in those with neurocognitive disorders is difficult because of atypical symptoms in elders, and the interaction between depression and cognitive impairment in older adults makes it further complicated (Ting et al., 2010; Ismail et al., 2017). In our study, we selected the GDS to evaluate depressive symptoms in MCI, while other studies have used different scales, such as HAMD and the NPI (Liu et al., 2019).
Interestingly, we found that the results of dynamic measures differ from the static measures, this had also been found in other studies of diseases (Sourty et al., 2016; Cordova-Palomera et al., 2017). We found that fALFF in MCID decreased in temporal gyrus (ITG, MTG), MFG and inferior occipital gyrus, but increased in cuneus, calcarine, lingual, while in d fALFF, we found an increase in the cuneus, middle occipital gyrus. Also, the ReHo doesn’t change in line with dReHo. As for dReHo, compared to MCIND group, MCID group exhibited an obvious increase in temporal gyrus (MTG, ITG, STG), frontal gyrus (MFG, SFG, IFG) and right cerebellum. However, using ReHo, we only found differences in cerebellum. Sourty et al. (2016) implied that some brain function alterations in Lewy body dementia can be detected utilizing dynamic FC but not static FC by sliding-window analysis (Sourty et al., 2016). The concept of dynamic neuroimage characteristics may provide a proper way to summarize changes in spatial patterns over time and to track differences in disease (Calhoun et al., 2014).
This study had several potential limitations. Firstly, this is a cross-sectional study, we did not investigate the conversion of MCID/MCIND to AD. These two sub-types of MCI patients may have different disease progress into AD. We will focus on not only the different clinical symptoms and their different brain areas, but also the potential different follow up consequences for MCID and MCIND patients. Secondly, it remains unclear that the mechanism of the differences and abnormalities in the patients of MCID and MCIND. In further studies, we would like to combine the rsfMRI, structural MRI and other biophysical data simultaneously with a larger sample and would reveal structural and biological substrates underlying these functional deficits in MCI and MCID patients.
Conclusion
In summary, we have investigated the IBA of MCID and MCIND using rsfMRI technique. We have found some obvious difference in the IBA between MCID and MCIND in the regions such as frontal gyrus (included SFG, MFG and IFG), temporal gyrus (included MTG, ITG and STG), parietal gyrus (superior parietal gyrus, IPG), occipital gyrus, parahippocampus gyrus and cuneus. The rsfMRI study suggests that the abnormal IBA pattern of the whole-brain functional activity may serve as an early biomarker for the detection of cognitive deficits and emotional problems in MCI patients.
Author Contributions
YY analyzed the data and wrote the manuscript. ZL analyzed the data. YL, JY, GP, and KZ evaluated the subjects and collected the data. XJ and BL designed the experiment and monitored the quality of the experiment.
Funding
This study was funded by grants from the Science and Technology Program of Zhejiang Province (2017C03011), the National Key Research and Development Program of China (2016YFC1306402).
Conflict of Interest
The authors declare that the research was conducted in the absence of any commercial or financial relationships that could be construed as a potential conflict of interest.
Supplementary Material
The Supplementary Material for this article can be found online at: https://www.frontiersin.org/articles/10.3389/fnins.2019.01333/full#supplementary-material
Footnotes
References
Aizenstein, H. J., Khalaf, A., Walker, S. E., and Andreescu, C. (2014). Magnetic resonance imaging predictors of treatment response in late-life depression. J. Geriatr. Psychiatry Neurol. 27, 24–32. doi: 10.1177/0891988713516541
Alexopoulos, G. S., Gunning-Dixon, F. M., Latoussakis, V., Kanellopoulos, D., and Murphy, C. F. (2008). Anterior cingulate dysfunction in geriatric depression. Int. J. Geriatr. Psychiatry 23, 347–355. doi: 10.1002/gps.1939
Bassett, D. S., and Sporns, O. (2017). Network neuroscience. Nat. Neurosci. 20, 353–364. doi: 10.1038/nn.4502
Biswal, B., Yetkin, F. Z., Haughton, V. M., and Hyde, J. S. (1995). Functional connectivity in the motor cortex of resting human brain using echo-planar MRI. Magn. Reson. Med. 34, 537–541. doi: 10.1002/mrm.1910340409
Biswal, B. B. (2012). Resting state fMRI: a personal history. Neuroimage 62, 938–944. doi: 10.1016/j.neuroimage.2012.01.090
Calhoun, V. D., Miller, R., Pearlson, G., and Adali, T. (2014). The chronnectome: time-varying connectivity networks as the next frontier in fMRI data discovery. Neuron 84, 262–274. doi: 10.1016/j.neuron.2014.10.015
Chau, J., Martin, C. R., Thompson, D. R., Chang, A. M., and Woo, J. (2006). Factor structure of the Chinese version of the geriatric depression scale. Psychol. Health Med. 11, 48–59. doi: 10.1080/13548500500093688
Chen, J., Sun, D., Shi, Y., Jin, W., Wang, Y., Xi, Q., et al. (2018). Dynamic alterations in spontaneous neural activity in multiple brain networks in subacute stroke patients: a resting-state fMRI study. Front. Neurosci. 12:994. doi: 10.3389/fnins.2018.00994
Chi, S., Wang, C., Jiang, T., Zhu, X.-C., Yu, J.-T., and Tan, L. (2015). The prevalence of depression in Alzheimer’s disease: a systematic review and meta-analysis. Curr. Alzheimer Res. 12, 189–198. doi: 10.2174/1567205012666150204124310
Cordova-Palomera, A., Kaufmann, T., Persson, K., Alnaes, D., Doan, N. T., Moberget, T., et al. (2017). Disrupted global metastability and static and dynamic brain connectivity across individuals in the Alzheimer’s disease continuum. Sci. Rep. 7:40268. doi: 10.1038/srep40268
Dai, Z., and He, Y. (2014). Disrupted structural and functional brain connectomes in mild cognitive impairment and Alzheimer’s disease. Neurosci. Bull. 30, 217–232. doi: 10.1007/s12264-013-1421-1420
Esterman, M., Tamber-Rosenau, B. J., Chiu, Y. C., and Yantis, S. (2010). Avoiding non-independence in fMRI data analysis: leave one subject out. Neuroimage 50, 572–576. doi: 10.1016/j.neuroimage.2009.10.092
Friston, K. J., Williams, S., Howard, R., Frackowiak, R. S., and Turner, R. (1996). Movement-related effects in fMRI time-series. Magn. Reson. Med. 35, 346–355. doi: 10.1002/mrm.1910350312
Gao, Y., Huang, C., Zhao, K., Ma, L., Qiu, X., Zhang, L., et al. (2013). Depression as a risk factor for dementia and mild cognitive impairment: a meta-analysis of longitudinal studies. Int. J. Geriatr. Psychiatry 28, 441–449. doi: 10.1002/gps.3845
Gonzalez-Castillo, J., Hoy, C. W., Handwerker, D. A., Robinson, M. E., Buchanan, L. C., Saad, Z. S., et al. (2015). Tracking ongoing cognition in individuals using brief, whole-brain functional connectivity patterns. Proc. Natl. Acad. Sci. U.S.A. 112, 8762–8767. doi: 10.1073/pnas.1501242112
Guo, W., Liu, F., Liu, J., Yu, L., Zhang, Z., Zhang, J., et al. (2013). Is there a cerebellar compensatory effort in first-episode, treatment-naive major depressive disorder at rest? Prog. Neuropsychopharmacol. Biol. Psychiatry 46, 13–18. doi: 10.1016/j.pnpbp.2013.06.009
Guo, Z., Liu, X., Hou, H., Wei, F., Liu, J., and Chen, X. (2016). Abnormal degree centrality in Alzheimer’s disease patients with depression: a resting-state functional magnetic resonance imaging study. Exp. Gerontol. 79, 61–66. doi: 10.1016/j.exger.2016.03.017
Han, Y., Wang, J., Zhao, Z., Min, B., Lu, J., Li, K., et al. (2011). Frequency-dependent changes in the amplitude of low-frequency fluctuations in amnestic mild cognitive impairment: a resting-state fMRI study. Neuroimage 55, 287–295. doi: 10.1016/j.neuroimage.2010.11.059
Hindriks, R., Adhikari, M. H., Murayama, Y., Ganzetti, M., Mantini, D., Logothetis, N. K., et al. (2016). Corrigendum to “Can sliding-window correlations reveal dynamic functional connectivity in resting-state fMRI?” [NeuroImage 127 (2016) 242-256]. Neuroimage 132:115. doi: 10.1016/j.neuroimage.2016.02.007
Hutchison, R. M., Womelsdorf, T., Allen, E. A., Bandettini, P. A., Calhoun, V. D., Corbetta, M., et al. (2013). Dynamic functional connectivity: promise, issues, and interpretations. Neuroimage 80, 360–378. doi: 10.1016/j.neuroimage.2013.05.079
Ismail, Z., Elbayoumi, H., Fischer, C. E., Hogan, D. B., Millikin, C. P., Schweizer, T., et al. (2017). Prevalence of depression in patients with mild cognitive impairment: a systematic review and meta-analysis. JAMA Psychiatry 74, 58–67. doi: 10.1001/jamapsychiatry.2016.3162
Jia, X.-Z., Ji, G.-J., Liao, W., Lv, Y.-T., Wang, J., Wang, Z., et al. (2017). Percent amplitude of fluctuation: a simple measure for resting-state fMRI signal at single voxel level. bioRxiv [Preprint]. doi: 10.1101/214098
Jia, X.-Z., Wang, J., Sun, H.-Y., Zhang, H., Liao, W., Wang, Z., et al. (2019). RESTplus: an improved toolkit for resting-state functional magnetic resonance imaging data processing. Sci. Bull. 64, 953–954. doi: 10.1016/j.scib.2019.05.008
Kandilarova, S., Stoyanov, D., Kostianev, S., and Specht, K. (2018). Altered resting state effective connectivity of anterior insula in depression. Front. Psychiatry 9:83. doi: 10.3389/fpsyt.2018.00083
Kandilarova, S., Stoyanov, D., Sirakov, N., Maes, M., and Specht, K. (2019). Reduced grey matter volume in frontal and temporal areas in depression: contributions from voxel-based morphometry study. Acta Neuropsychiatr. 31, 252–257. doi: 10.1017/neu.2019.20
Karim, H. T., Andreescu, C., Tudorascu, D., Smagula, S. F., Butters, M. A., Karp, J. F., et al. (2017). Intrinsic functional connectivity in late-life depression: trajectories over the course of pharmacotherapy in remitters and non-remitters. Mol. Psychiatry 22, 450–457. doi: 10.1038/mp.2016.55
Koolschijn, P. C., van Haren, N. E., Lensvelt-Mulders, G. J., Hulshoff Pol, H. E., and Kahn, R. S. (2009). Brain volume abnormalities in major depressive disorder: a meta-analysis of magnetic resonance imaging studies. Hum. Brain Mapp. 30, 3719–3735. doi: 10.1002/hbm.20801
Langenecker, S. A., Kennedy, S. E., Guidotti, L. M., Briceno, E. M., Own, L. S., Hooven, T., et al. (2007). Frontal and limbic activation during inhibitory control predicts treatment response in major depressive disorder. Biol. Psychiatry 62, 1272–1280. doi: 10.1016/j.biopsych.2007.02.019
Lee, G. J., Lu, P. H., Hua, X., Lee, S., Wu, S., Nguyen, K., et al. (2012). Depressive symptoms in mild cognitive impairment predict greater atrophy in Alzheimer’s disease-related regions. Biol. Psychiatry 71, 814–821. doi: 10.1016/j.biopsych.2011.12.024
Lei, X., Zhao, Z., and Chen, H. (2013). Extraversion is encoded by scale-free dynamics of default mode network. Neuroimage 74, 52–57. doi: 10.1016/j.neuroimage.2013.02.020
Li, H. J., Xu, Y., Zhang, K. R., Hoptman, M. J., and Zuo, X. N. (2015). Homotopic connectivity in drug-naive, first-episode, early-onset schizophrenia. J. Child Psychol. Psychiatry 56, 432–443. doi: 10.1111/jcpp.12307
Li, R., Li, Y., An, D., Gong, Q., Zhou, D., and Chen, H. (2015). Altered regional activity and inter-regional functional connectivity in psychogenic non-epileptic seizures. Sci. Rep. 5:11635. doi: 10.1038/srep11635
Li, Y., Jing, B., Liu, H., Li, Y., Gao, X., Li, Y., et al. (2017). Frequency-dependent changes in the amplitude of low-frequency fluctuations in mild cognitive impairment with mild depression. J. Alzheimers Dis. 58, 1175–1187. doi: 10.3233/JAD-161282
Liao, W., Chen, H., Li, J., Ji, G. J., Wu, G. R., Long, Z., et al. (2019). Endless fluctuations: temporal dynamics of the amplitude of low frequency fluctuations. IEEE Trans. Med. Imaging 38, 2523–2532. doi: 10.1109/TMI.2019.2904555
Liao, W., Wu, G. R., Xu, Q., Ji, G. J., Zhang, Z., Zang, Y. F., et al. (2014). DynamicBC: a MATLAB toolbox for dynamic brain connectome analysis. Brain Connect. 4, 780–790. doi: 10.1089/brain.2014.0253
Liao, X., Yuan, L., Zhao, T., Dai, Z., Shu, N., Xia, M., et al. (2015). Spontaneous functional network dynamics and associated structural substrates in the human brain. Front. Hum. Neurosci. 9:478. doi: 10.3389/fnhum.2015.00478
Liu, F., Wang, Y., Li, M., Wang, W., Li, R., Zhang, Z., et al. (2017). Dynamic functional network connectivity in idiopathic generalized epilepsy with generalized tonic-clonic seizure. Hum. Brain Mapp. 38, 957–973. doi: 10.1002/hbm.23430
Liu, X., Chen, J., Shen, B., Wang, G., Li, J., Hou, H., et al. (2018). Altered intrinsic coupling between functional connectivity density and amplitude of low-frequency fluctuation in mild cognitive impairment with depressive symptoms. Neural Plast. 2018:1672708. doi: 10.1155/2018/1672708
Liu, X., Tu, Y., Zang, Y., Wu, A., Guo, Z., and He, J. (2019). Disrupted regional spontaneous neural activity in mild cognitive impairment patients with depressive symptoms: a resting-state fMRI study. Neural Plast. 2019:2981764. doi: 10.1155/2019/2981764
Morimoto, S. S., Kanellopoulos, D., Manning, K. J., and Alexopoulos, G. S. (2015). Diagnosis and treatment of depression and cognitive impairment in late life. Ann. N. Y. Acad. Sci. 1345, 36–46. doi: 10.1111/nyas.12669
Petersen, R. C. (2004). Mild cognitive impairment as a diagnostic entity. J. Intern. Med. 256, 183–194. doi: 10.1111/j.1365-2796.2004.01388.x
Petersen, R. C., Smith, G. E., Waring, S. C., Ivnik, R. J., Tangalos, E. G., and Kokmen, E. (1999). Mild cognitive impairment: clinical characterization and outcome. Arch. Neurol. 56, 303–308. doi: 10.1001/archneur.56.3.303
Petersen, R. C., Stevens, J. C., Ganguli, M., Tangalos, E. G., Cummings, J. L., and DeKosky, S. T. (2001). Practice parameter: early detection of dementia: mild cognitive impairment (an evidence-based review). report of the quality standards subcommittee of the american academy of neurology. Neurology 56, 1133–1142. doi: 10.1212/wnl.56.9.1133
Raichle, M. E. (2015). The restless brain: how intrinsic activity organizes brain function. Philos. Trans. R. Soc. Lond. B Biol. Sci. 370:1668. doi: 10.1098/rstb.2014.0172
Rizio, A. A., and Dennis, N. A. (2014). The cognitive control of memory: age differences in the neural correlates of successful remembering and intentional forgetting. PLoS One 9:e87010. doi: 10.1371/journal.pone.0087010
Sakoglu, U., Pearlson, G. D., Kiehl, K. A., Wang, Y. M., Michael, A. M., and Calhoun, V. D. (2010). A method for evaluating dynamic functional network connectivity and task-modulation: application to schizophrenia. MAGMA 23, 351–366. doi: 10.1007/s10334-010-0197-198
Sourty, M., Thoraval, L., Roquet, D., Armspach, J. P., Foucher, J., and Blanc, F. (2016). Identifying dynamic functional connectivity changes in dementia with lewy bodies based on product hidden markov models. Front. Comput. Neurosci. 10:60. doi: 10.3389/fncom.2016.00060
Stoyanov, D., Kandilarova, S., and Borgwardt, S. (2017). Translational functional neuroimaging in the explanation of depression. Balkan Med. J. 34, 493–503. doi: 10.4274/balkanmedj.2017.1160
Tang, C., Wei, Y., Zhao, J., and Nie, J. (2018). “The dynamic measurements of regional brain activity for resting-state fMRI: d-ALFF, d-fALFF and d-ReHo,” in Proceedings of the International Conference on Medical Image Computing and Computer-Assisted Intervention. MICCAI: Shenzhen.
Taylor, W. D., Aizenstein, H. J., and Alexopoulos, G. S. (2013). The vascular depression hypothesis: mechanisms linking vascular disease with depression. Mol. Psychiatry 18, 963–974. doi: 10.1038/mp.2013.20
Thompson, G. J., Magnuson, M. E., Merritt, M. D., Schwarb, H., Pan, W. J., McKinley, A., et al. (2013). Short-time windows of correlation between large-scale functional brain networks predict vigilance intraindividually and interindividually. Hum. Brain Mapp. 34, 3280–3298. doi: 10.1002/hbm.22140
Ting, C., Rajji, T. K., Ismail, Z., Tang-Wai, D. F., Apanasiewicz, N., Miranda, D., et al. (2010). Differentiating the cognitive profile of schizophrenia from that of Alzheimer disease and depression in late life. PLoS One 5:e10151. doi: 10.1371/journal.pone.0010151
Vergara, V. M., Abrol, A., and Calhoun, V. D. (2019). An average sliding window correlation method for dynamic functional connectivity. Hum. Brain Mapp. 40, 2089–2103. doi: 10.1002/hbm.24509
Wee, C. Y., Yang, S., Yap, P. T., Shen, D., and Alzheimer’s Disease Neuroimaging Initiative (2016). Sparse temporally dynamic resting-state functional connectivity networks for early MCI identification. Brain Imaging Behav. 10, 342–356. doi: 10.1007/s11682-015-9408-2
Xia, M., Wang, J., and He, Y. (2013). BrainNet Viewer: a network visualization tool for human brain connectomics. PLoS One 8:e68910. doi: 10.1371/journal.pone.0068910
Xie, C., Li, W., Chen, G., Douglas Ward, B., Franczak, M. B., Jones, J. L., et al. (2012). The co-existence of geriatric depression and amnestic mild cognitive impairment detrimentally affect gray matter volumes: voxel-based morphometry study. Behav. Brain Res. 235, 244–250. doi: 10.1016/j.bbr.2012.08.007
Yan, C. G., Cheung, B., Kelly, C., Colcombe, S., Craddock, R. C., Di Martino, A., et al. (2013). A comprehensive assessment of regional variation in the impact of head micromovements on functional connectomics. Neuroimage 76, 183–201. doi: 10.1016/j.neuroimage.2013.03.004
Yan, C. G., Wang, X. D., Zuo, X. N., and Zang, Y. F. (2016). DPABI: data processing & analysis for (resting-state) brain imaging. Neuroinformatics 14, 339–351. doi: 10.1007/s12021-016-9299-9294
Yan, C.-G., Yang, Z., Colcombe, S. J., Zuo, X.-N., and Milham, M. P. (2017). Concordance among indices of intrinsic brain function: insights from inter-individual variation and temporal dynamics. Sci. Bull. 62, 1572–1584. doi: 10.1016/j.scib.2017.09.015
Yang, L., Yan, Y., Wang, Y., Hu, X., Lu, J., Chan, P., et al. (2018). Gradual disturbances of the amplitude of low-frequency fluctuations (ALFF) and fractional ALFF in Alzheimer spectrum. Front. Neurosci. 12:975. doi: 10.3389/fnins.2018.00975
Yang, W., Chen, Q., Liu, P., Cheng, H., Cui, Q., Wei, D., et al. (2016). Abnormal brain activation during directed forgetting of negative memory in depressed patients. J. Affect. Disord. 190, 880–888. doi: 10.1016/j.jad.2015.05.034
Yao, Z., Wang, L., Lu, Q., Liu, H., and Teng, G. (2009). Regional homogeneity in depression and its relationship with separate depressive symptom clusters: a resting-state fMRI study. J. Affect. Disord. 115, 430–438. doi: 10.1016/j.jad.2008.10.013
Yesavage, J. A., Brink, T. L., Rose, T. L., Lum, O., Huang, V., Adey, M., et al. (1982). Development and validation of a geriatric depression screening scale: a preliminary report. J. Psychiatr. Res. 17, 37–49. doi: 10.1016/0022-3956(82)90033-4
Yip, E., Yun, J., Wachowicz, K., Gabos, Z., Rathee, S., and Fallone, B. G. (2017). Sliding window prior data assisted compressed sensing for MRI tracking of lung tumors. Med. Phys. 44, 84–98. doi: 10.1002/mp.12027
Yu, Y., Chen, L., Wang, Q., Hu, L., Ding, Q., Jia, X., et al. (2019). Altered amplitude of low-frequency fluctuations in inactive patients with nonneuropsychiatric systemic lupus erythematosus. Neural Plast. 2019, 1–10. doi: 10.1155/2019/9408612
Zang, Y., Jiang, T., Lu, Y., He, Y., and Tian, L. (2004). Regional homogeneity approach to fMRI data analysis. Neuroimage 22, 394–400. doi: 10.1016/j.neuroimage.2003.12.030
Zang, Y. F., He, Y., Zhu, C. Z., Cao, Q. J., Sui, M. Q., Liang, M., et al. (2007). Altered baseline brain activity in children with ADHD revealed by resting-state functional MRI. Brain Dev. 29, 83–91. doi: 10.1016/j.braindev.2006.07.002
Zhang, Y., Zhang, H., Chen, X., Lee, S. W., and Shen, D. (2017). Hybrid high-order functional connectivity networks using resting-state functional MRI for mild cognitive impairment diagnosis. Sci. Rep. 7:6530. doi: 10.1038/s41598-017-06509-6500
Zhang, Z., Liu, Y., Jiang, T., Zhou, B., An, N., Dai, H., et al. (2012). Altered spontaneous activity in Alzheimer’s disease and mild cognitive impairment revealed by Regional Homogeneity. Neuroimage 59, 1429–1440. doi: 10.1016/j.neuroimage.2011.08.049
Zhao, N., Yuan, L. X., Jia, X. Z., Zhou, X. F., Deng, X. P., He, H. J., et al. (2018). Intra- and inter-scanner reliability of voxel-wise whole-brain analytic metrics for resting state fMRI. Front. Neuroinform. 12:54. doi: 10.3389/fninf.2018.00054
Zou, Q. H., Zhu, C. Z., Yang, Y., Zuo, X. N., Long, X. Y., Cao, Q. J., et al. (2008). An improved approach to detection of amplitude of low-frequency fluctuation (ALFF) for resting-state fMRI: fractional ALFF. J. Neurosci. Methods 172, 137–141. doi: 10.1016/j.jneumeth.2008.04.012
Zuo, X. N., Di Martino, A., Kelly, C., Shehzad, Z. E., Gee, D. G., Klein, D. F., et al. (2010). The oscillating brain: complex and reliable. Neuroimage 49, 1432–1445. doi: 10.1016/j.neuroimage.2009.09.037
Keywords: Alzheimer’s disease, aging, cognition, depression, brain function
Citation: Yu Y, Li Z, Lin Y, Yu J, Peng G, Zhang K, Jia X and Luo B (2019) Depression Affects Intrinsic Brain Activity in Patients With Mild Cognitive Impairment. Front. Neurosci. 13:1333. doi: 10.3389/fnins.2019.01333
Received: 01 October 2019; Accepted: 27 November 2019;
Published: 17 December 2019.
Edited by:
Jiehui Jiang, Shanghai University, ChinaReviewed by:
Zaixu Cui, University of Pennsylvania, United StatesDrozdstoy Stoyanov Stoyanov, Plovdiv Medical University, Bulgaria
Copyright © 2019 Yu, Li, Lin, Yu, Peng, Zhang, Jia and Luo. This is an open-access article distributed under the terms of the Creative Commons Attribution License (CC BY). The use, distribution or reproduction in other forums is permitted, provided the original author(s) and the copyright owner(s) are credited and that the original publication in this journal is cited, in accordance with accepted academic practice. No use, distribution or reproduction is permitted which does not comply with these terms.
*Correspondence: Benyan Luo, bHVvYmVueWFuQHpqdS5lZHUuY24=; Xize Jia, amlheGl6ZUBmb3htYWlsLmNvbQ==