 Zhe Ding1,2
 Mingbiao Ma1,2Lvyan Tao1,3Yun Peng1,2Yuanyuan Han4Luyun Sun1
 Xiting Dai1,2Zhenhua Ji1,2Ruolan Bai1,3Miaomiao Jian1,3Taigui Chen1,2Lisha Luo1,3Feng Wang1Yunfeng Bi1Aihua Liu1,3,5,6*
 Fukai Bao1,2,5,6*
- 1Yunnan Province Key Laboratory for Tropical Infectious Diseases in Universities, Kunming Medical University, Kunming, China
- 2Department of Microbiology and Immunology, Kunming Medical University, Kunming, China
- 3Department of Biochemistry and Molecular Biology, Kunming Medical University, Kunming, China
- 4Institute of Medical Biology, Chinese Academy of Medical Sciences and Peking Union Medical College, Kunming, China
- 5Yunnan Province Integrative Innovation Center for Public Health, Diseases Prevention and Control, Kunming Medical University, Kunming, China
- 6Yunnan Demonstration Base of International Science and Technology Cooperation for Tropical Diseases, Kunming, China
Lyme neuroborreliosis (LNB) is the most dangerous manifestation of Lyme disease caused by the spirochete Borrelia burgdorferi which can reach the central nervous system most commonly presenting with lymphocytic meningitis; however, the molecular basis for neuroborreliosis is still poorly understood. We incubated explants from the frontal cortex of three rhesus brains with medium alone or medium with added live Borrelia burgdorferi for 6, 12, and 24 h and isolated RNA from each group was used for RNA sequencing with further bioinformatic analysis. Transcriptomic differences between the ex vivo model of live Borrelia burgdorferi with rhesus frontal cortex tissue explants and the controls during the progression of the infection were identified. A total of 2249, 1064, and 420 genes were significantly altered, of which 80.7, 52.9, and 19.8% were upregulated and 19.3, 47.1, 80.2% were downregulated at 6, 12, and 24 h, respectively. Gene ontology and KEGG pathway analyses revealed various pathways related to immune and inflammatory responses during the spirochete infection were enriched which is suggested to have a causal role in the pathogenesis of neurological Lyme disease. Moreover, we propose that the overexpressed FOLR2 which was demonstrated by the real-time PCR and western blotting could play a key role in neuroinflammation of the neuroborreliosis based on PPI analysis for the first time. To our knowledge, this is the first study to provide comprehensive information regarding the transcriptomic signatures that occur in the frontal cortex of the brain upon exposure to Borrelia burgdorferi, and suggest that FOLR2 is a promising target that is associated with neuroinflammation and may represent a new diagnostic or therapeutic marker in LNB.
Introduction
Lyme disease is identified as a multistage and multisystem disease which results in the neurological manifestation of systemic infection at a later period, which is called LNB (Pachner and Steiner, 2007). This spirochete, Borrelia burgdorferi, with characteristic features such as neural invasion, is the primary pathogen of Lyme disease and can attack the CNS and PNS, leading to lymphocytic meningitis, cranial neuritis, radiculitis, and other focal or multifocal mononeuropathies (Hansen et al., 2013; Beuchat et al., 2018; Halperin, 2018). Generally, patients may have an impairment in cognition and memory (Halperin, 1997). It has been reported that immune-mediated neuronal and glial cell damage, including elevated levels of proinflammatory cytokines and chemokines, may be involved in the neuropathogenesis of LNB (Ramesh et al., 2013a). Due to the increasing prevalence of Lyme disease around the world (Koedel et al., 2015), an improved understanding of the neuropathogenesis resulting from gene interactions in LNB is warranted for the development of better therapeutic strategies to prevent this disease.
Given the similarity of pathology and disease progression of Lyme disease between humans and non-human primates (NHPs), an NHP model of LNB has been widely developed. Rhesus macaques (Macaca mulatta) are ideal models for studies related to human infectious diseases, and they are widely used in studies of neurobiology and psychobiology (Xue et al., 2016). In addition, the adaptability of the rhesus monkey and its overall genetic and physiological resemblance to humans (Bimber et al., 2017) makes this species appropriate for studying the immunological response to B. burgdorferi in the brain. While much progress has been made in investigating the immune response to Lyme disease using animal models, including mouse (Bramwell et al., 2014; Byram et al., 2015; Hansen et al., 2016; Sallay et al., 2017), hamster (Croke et al., 2000; Munson et al., 2012), rabbit (Shang et al., 2000; Scott et al., 2017), and dog (Smith et al., 2012; Wagner et al., 2015), these experimental animals can exhibit erythema migrans or arthritis. However, the rhesus macaque model plays an indispensable role in studies related to neuroborreliosis (Roberts et al., 1998; Pachner et al., 2001), as the overall understanding of the inflammation response leading to LNB remains elusive.
Transcriptomic analysis can provide insights into the molecular basis underlying the development of Lyme disease (Iyer and Schwartz, 2016; Casselli et al., 2017; Marques et al., 2017; Popitsch et al., 2017), and the differentially gene expression profile has implications in the pathogenesis and, hence, potential treatment strategies to combat this disease (Bouquet et al., 2016). Overall, previous studies have helped define the roles of sustained differential gene expression signatures in Lyme disease that may be useful in the future for diagnosis or treatment. We hypothesize that there are some complex interplay among some genes and distinct signaling pathways initiated by spirochetes in the brain which could serve as the underlying molecular and genetic basis of LNB. In this study, we used Illumina Hiseq 2500 to compare the gene expression profiles of frontal cortex brain explants that were exposed to live spirochetes (B. burgdorferi), along with the controls, to investigate the regulatory mechanism underlying inflammation in host immune responses at sequential time points in three rhesus macaques.
Materials and Methods
Animals
Three rhesus macaques weighing 1.5 to 3 kg (Macaca mulatta) of Chinese origin Monkey 1 (Male; age, 1 year old), Monkey 2 (Male; age, 1 year old), and Monkey 3 (Female; age, 1 year old) were from the Institute of Medical Biology, Chinese Academy of Medical Sciences and Peking Union Medical College. Animal permit number: SCXK (DIAN) K2015-0004. Frontal cortex tissues for the ex vivo experiments were given as a present for our laboratory and were collected from these rhesus macaques that were slated for euthanasia. These animals were healthy and were all uninfected with B. burgdorferi. All efforts were made to minimize suffering, and all procedures were performed in accordance with the rules for euthanasia of experimental animals in the Chinese experimental animal information network. This experiment was performed in accordance with the Guide for the Care and Use of Laboratory Animals (Carbone, 2012) and the ARRIVE Guidelines for Reporting Animal Research (Kilkenny et al., 2010). The Animal Ethical and Welfare Committee of Kunming Medical University reviewed and approved this study, and the necropsy was conducted by qualified experimenters.
Growth and Preparation of Live Spirochetes
The low-passage-number B. burgdorferi strain 4680 (Bb4680, DSMZ, A1511358-1) was grown in Barbour-Stoenner-Kelly II (BSK II) medium (Ruzic-Sabljic et al., 2006; Zuckert, 2007) supplemented with 6% rabbit serum (Thermo Fisher Scientific, United States) to the late logarithmic phase under microaerophilic conditions. The cultures were incubated at 37°C and examined by dark-field microscopy for the plate count. After centrifugation (4°C, 10 min, 2000 ×g), the supernatant was discarded. After the cells were washed twice with sterile PBS, an appropriate volume of 10% FBS-RPMI 1640 medium (Thermo Fisher Scientific, United States) was added to a final bacterial concentration of 1 × 10⁷ bacteria/mL.
Frontal Cortex Brain (FCB) Explant Co-culture With Live Spirochetes and Experimental Design
Freshly harvested frontal cortex tissues were collected immediately at necropsy from three rhesus macaques and washed twice with PBS. The frontal cortex was sliced as thin as possible using sterile scalpel handle (J11060, Jinzhong®, Shanghai), scalpel blades (J0B080, Jinzhong®, Shanghai) and atraumatic tissue forceps (JYF010, Jinzhong®, Shanghai). Each section weighed 0.5 g and placed in a separate T-25 flask (Corning, NY, United States) containing 4 mL of 10% FBS-RPMI 1640 medium or 4 mL B. burgdorferi (Bb) bacteria suspension prepared as previously described. We ensured that each tissue section was totally soaked in the medium and triplicate tissue sections from three animals were then incubated in a humidified incubator with 5% CO2 at 37°C for 6, 12, and 24 h, respectively. After 6, 12, and 24 h of incubation, the co-culture FCB sections of the three rhesus macaques were collected and stored at -80°C.
RNA Isolation
Equivalent amounts of brain tissue weighed 20 mg were gently removed and lysed with 1 ml of TRIZOL Reagent (Invitrogen) in the triturator. RNA was then extracted with chloroform–isopropanol. After 30 min of incubation, the samples were centrifuged to separate the RNA, which was subsequently washed with 75% ethanol. The RNA concentration and purity was measured using a NanoDrop-2000 spectrophotometer (Thermo ScientificTM), and the qualified samples (1.7 < OD260/OD280 < 2.0) were stored at -80°C. Possible DNA contamination was removed by subjecting the RNA to DNase treatment (5 × g DNA Eraser Buffer, Takara).
Reverse Transcription
RNA was digested with 5 × gDNA Eraser Buffer (Takara) for 5 min at room temperature and then reverse transcribed into cDNA using the PrimeScriptTM RT reagent Kit (Takara). The reaction mixture contained the following: 1 μg of RNA, 4 μL of 5 × PrimeScript Buffer 2 (for real-time PCR), 1 μL of PrimeScript RT Enzyme Mix I, and RNase Free dH2O to a final volume of 20 μL. The reaction was performed in a Bio-Rad C1000 TouchTM Thermal Cycler under the following conditions: 37°C for 15 min, 85°C for 5 s, 4°C infinitely. The cDNA samples were stored at -20°C.
cDNA Library Preparation and Sequencing
The cDNA library was established using the RNA-Seq Library Preparation Kit (Illumina) following the manufacturer’s protocol. In brief, poly-(A) mRNA was separated from 5 μg of total RNA using the Oligo d(T) magnetic beads. Then, after the fragmentation buffer was added, the mRNA was fragmented into small pieces under an elevated temperature. Using the mRNA fragments as templates, the first-strand cDNA was synthesized with 6-base random primers. Next, the second-strand cDNA was synthesized using DNA polymerase I and RNase H. The obtained cDNAs were end-repaired by polymerase and ligated with “A-tailing” base adaptors. Target fragments were selected by magnetic beads for PCR amplification to construct the final cDNA library and the final double-stranded cDNA samples were examined by agarose electrophoresis. After the library was quantified using Qubit 2.0 (Illumina), sequencing was performed on an Illumina HiSeq 2500 sequencing platform.
RNA-Seq Data Processing
To identify the genes that are involved in the response to the inflammation response in the brain, we performed a time course of Bb infection in the FCB tissue of rhesus monkeys, and the RNA was isolated for analysis using the Illumina HiSeq 2500 sequencing technique at 6, 12, and 24 h after the co-culture experiment, as previously described. The original image data obtained from the Illumina Hiseq sequencing was converted into sequence data through Base Calling in the FASTQ format, and the raw data were obtained. The quality control of the raw data were performed using FastQC, and the raw data were pre-processed using Trimmomatic (Illumina) software to remove the adaptor sequences, ribosomal RNA, and other contaminants that could potentially interfere with the clustering and assembly. The resulting clean data were compared with the corresponding reference genome to obtain comprehensive transcriptome information, and the RPKM (Wagner et al., 2012) in RNA-seq data was obtained for analyzing DEGs. An RPKM ≥ 0.5 was considered statistically significant.
Bioinformatics Analysis
A heatmap was generated that illustrated the significant alterations in gene expression between the Bb co-culture with FCB explants and the controls at 6, 12, and 24 h. We defined significantly altered genes as those genes with a fold change (FC) ≥ 2 and FDR (False Discovery Rate) < 0.01, which was the correction of the P-value using the Benjamini–Hochberg method (Madar and Batista, 2016). Functional classifications of the DEGs were determined with GO annotation using the online DAVID tool, and the pathway analysis of the DEGs was performed with the KEGG database. Based upon the functional annotation in the GO database, the DEGs were assigned to categories of various BP, CC, and MF. Significant enrichment was defined as a P-value < 0.05. The results of the analysis of enrichment of GO and KEGG are also presented in this study. In addition, a hierarchical cluster analysis was performed for the enriched genes by Cluster software, and the PPI network of the proteins encoded by the DEGs was searched using STRING online software. A network layout was produced by Cytoscape software, using the BiNGO 3.03 Cytoscape plug-in to assess overrepresentation of GO categories in biological networks (Maere et al., 2005).
Confirmation of Expression by Real-Time PCR
Real-time PCR was performed using Takara SYBR® Premix Ex Taq II (Tli RNaseH Plus) (2×) on a CFX96 Real-Time PCR Detection System. The reaction volume was 25 μL, containing 12.5 μL of Takara SYBR® Premix Ex Taq II (Tli RNaseH Plus) (2×), 1 μL of each primer and 2 μL of the cDNA template. Amplification conditions were as follows: 95°C for 30 s, followed by 40 cycles of 95°C for 5 s, 64°C (55°C for GAPDH) for 30 s. SYBR® Green PCR mix and primers that were specific to our target gene were used to efficiently amplify the target region. The primers used were as follows: GAPDH sense: 5′-GCACCACCAACTGCTTAGCAC-3′; GAPDH antisense: 5′-TCTTCTGGGTGGCAGTGATG-3′; FOLR2 sense: 5′-ACTTCTGCTGCTTCTGGTCT-3′; FOLR2 antisense: 5′-GTCATGCAGCTTGTCCTCAG-3′.
Confirmation of Expression by Western Blotting
The total protein from each brain tissue sample was extracted using RIPA lysis buffer (Solarbio, #R0010) supplemented with the protease inhibitor PMSF (Solarbio, #R0010). After the protein concentration was determined using the Bicinchoninic acid (BCA) assay (Reichelt et al., 2016), the protein and 4 × Protein SDS PAGE Loading Buffer (Takara, #9173) were mixed in a ratio of 3:1 in boiling water for 15 min, and then the samples were stored at -20°C. Next, 60 μg protein samples were separated using 10% TGX stain-freeTM FastCastTM Acrylamide gel (Takara) (Gilda and Gomes, 2013; Posch et al., 2013; Ghosh et al., 2014; Gilda and Gomes, 2015) electrophoresis and transferred to a polyvinyl difluoride membrane. After being blocked with 5% non-fat dry milk, the membranes were incubated overnight at 4°C with a FOLR2 primary antibody (LifeSpan, LS-C152098-50). Then, the samples were incubated with a goat anti-rabbit horseradish peroxidase-labeled secondary antibody (Abcam, ab6721) for 2 h at room temperature. The resulting immunocomplexes were visualized with chemiluminescence using the Clarity Western ECL Substrate (Bio-Rad), and the signal intensity was quantified with the Image LabTM (Bio-Rad) software version 5.2.1. Densitometry was normalized to the corresponding total protein of the control.
Statistical Analysis
The data are presented as the means ± standard error (SEM). All calculations were performed using the software package GraphPad PRISM version 6.01 (GraphPad Software, Inc.). All experiments were performed in triplicate unless stated otherwise. An unpaired two-tail Student’s t-test was performed, as appropriate, to evaluate the P-values, and a P-value < 0.05 was considered statistically significant.
Results
Quality Control and Correlations of the Data
The experimental process is shown in Figure 1. The gene expression levels in the rhesus macaque frontal cortex after co-culture with Bb or medium alone at the indicated time points are shown in Figure 2A. The ratio of clean reads as a percentage of all raw reads was greater than 93% for all samples. This suggests that the data were high-quality and suitable for subsequent analysis. Additionally, the correlation of the gene expression level between samples is shown in Figure 2B, which is an important index to test the reliability of the experiment and the reasonableness of the sample selection. In our study, the R2 (square of Pearson correlation coefficient) of all groups was greater than 0.8, thus the reliability of subsequent experiments was guaranteed.
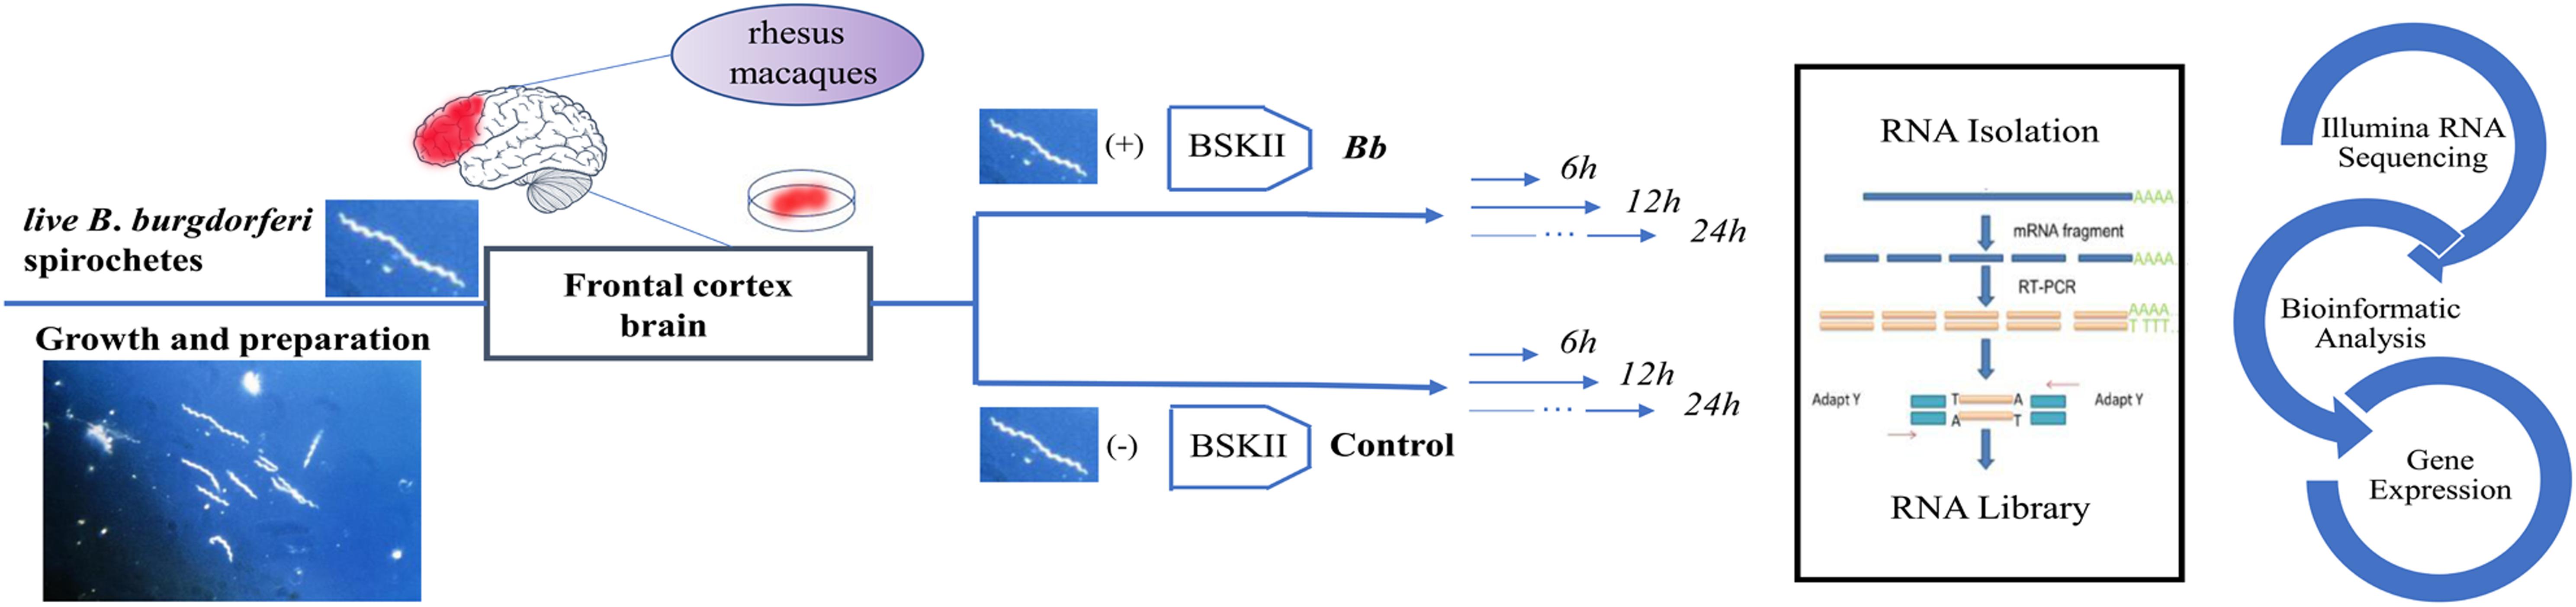
Figure 1. Schematic description of the experimental design. The asterisk represents the Borrelia burgdorferi spirochetes.
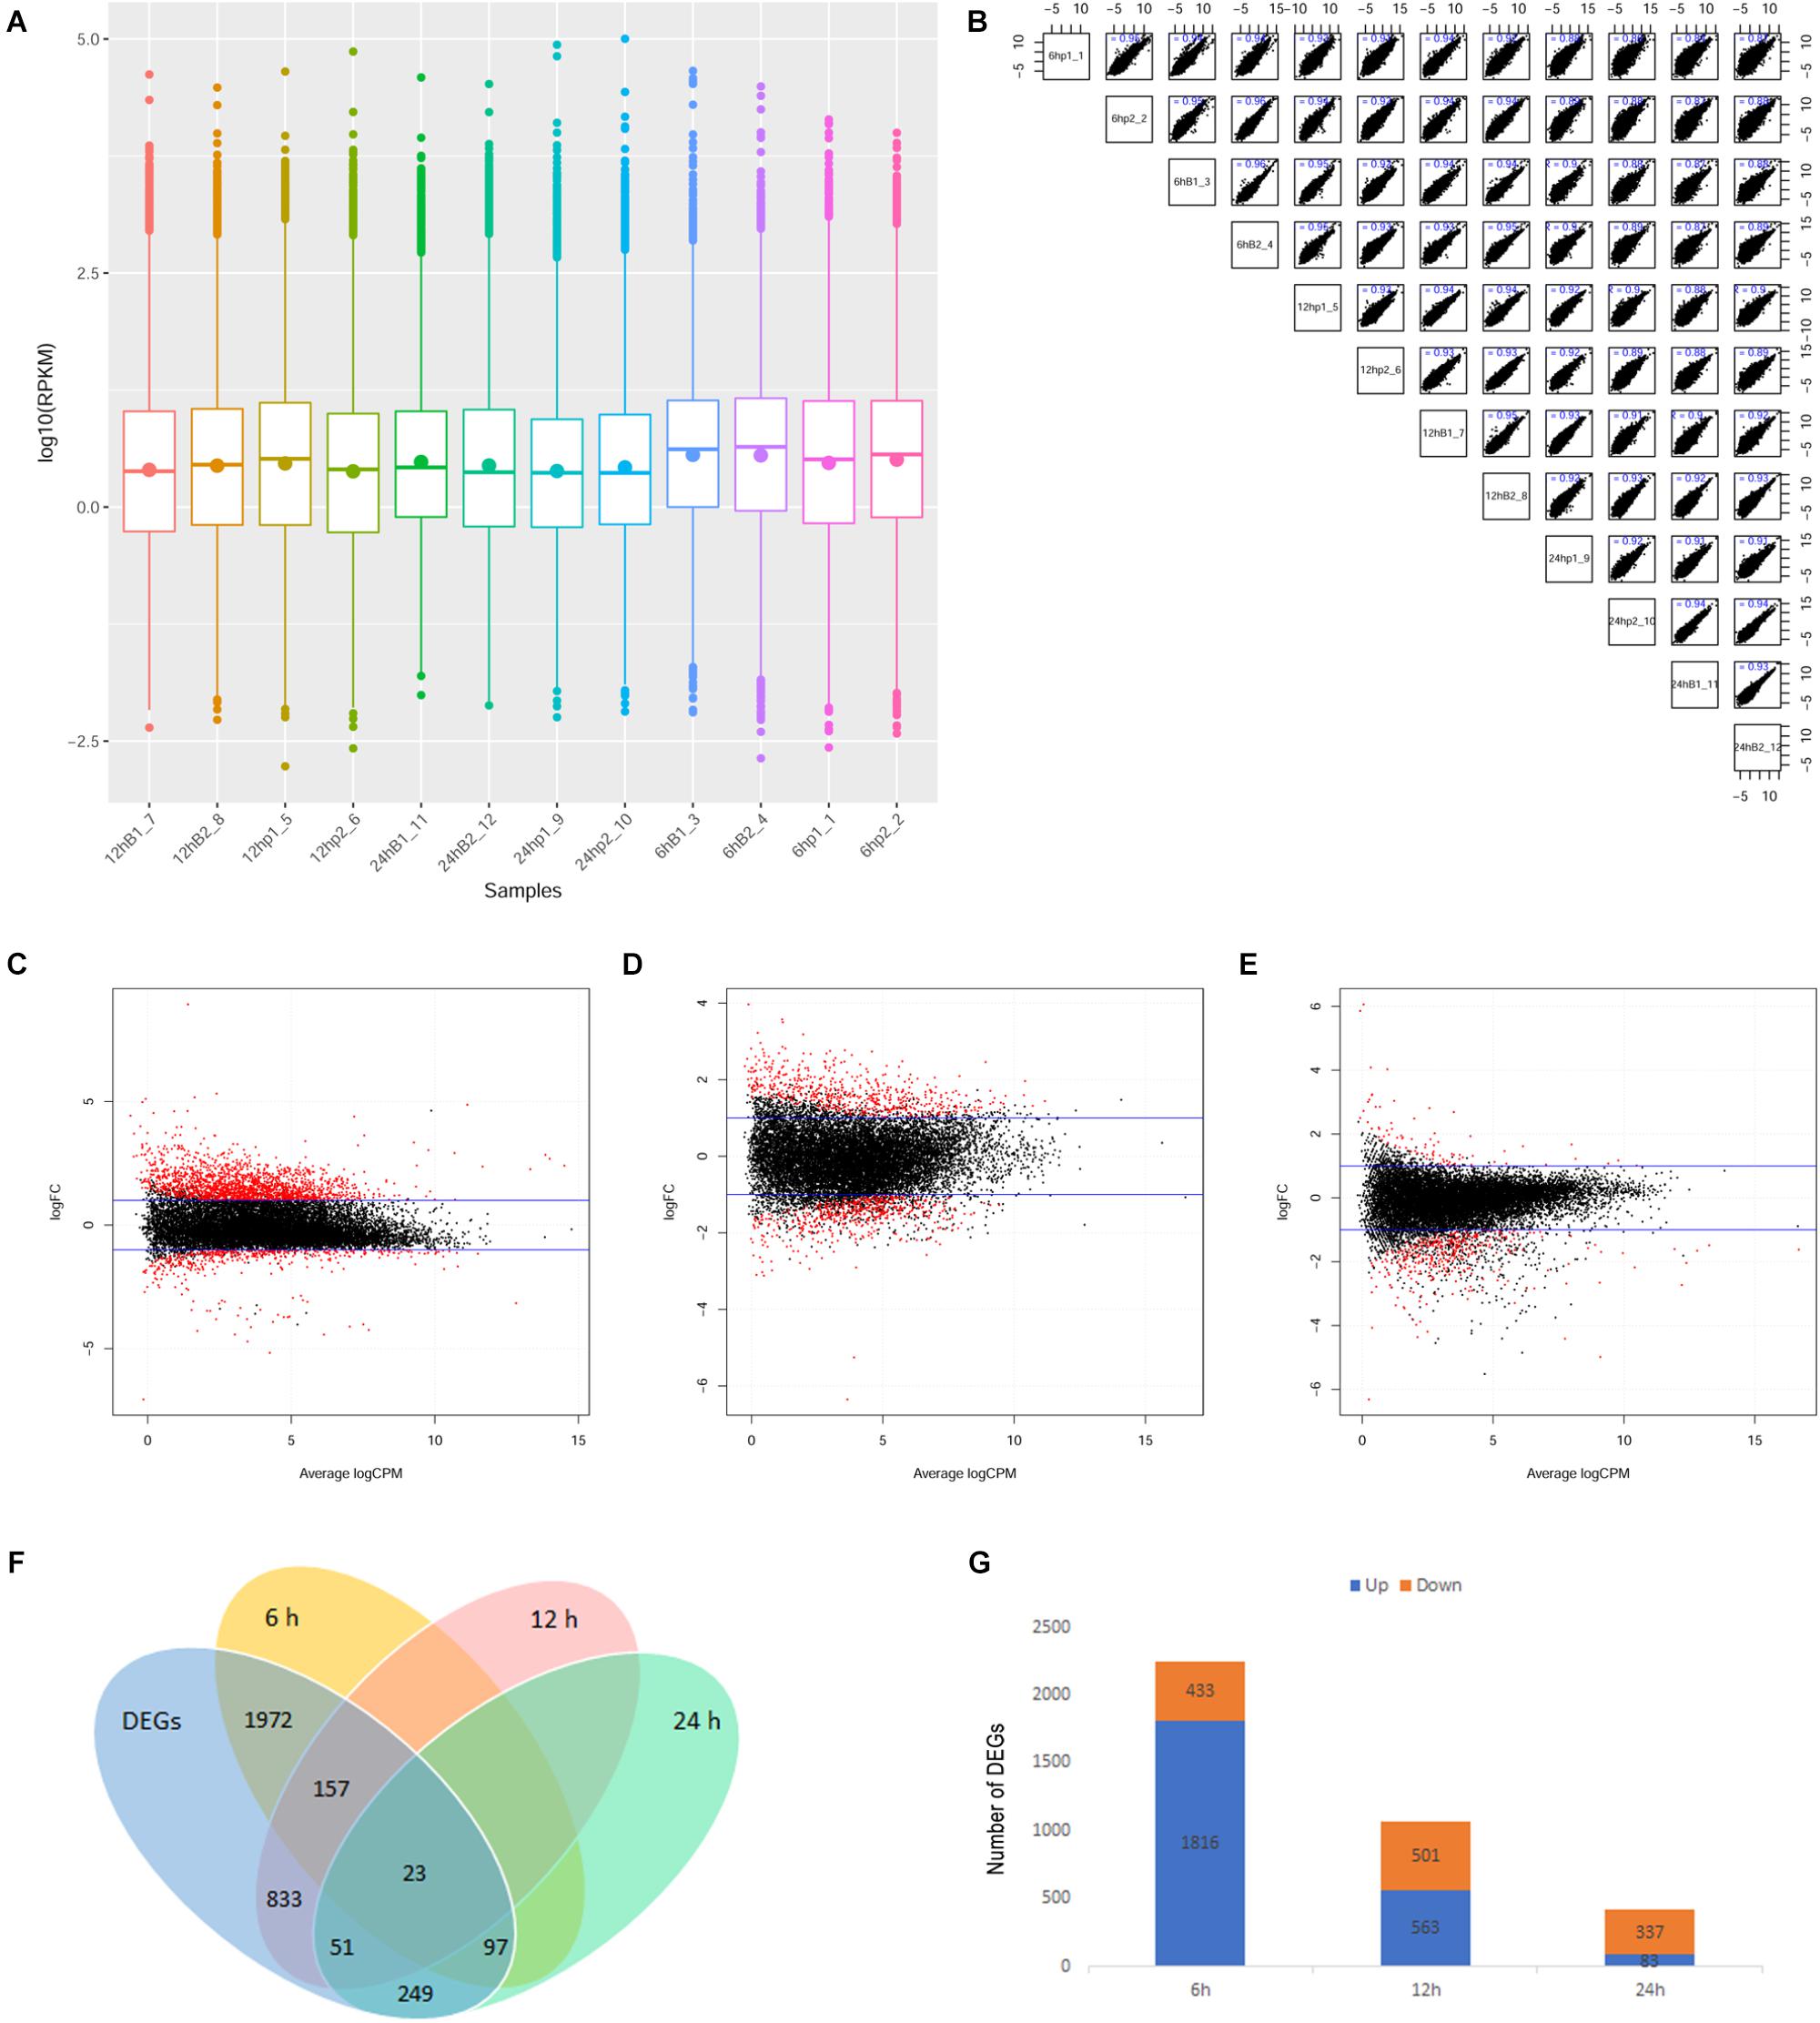
Figure 2. Overview of mRNA profiling in this study. (A) Boxplot of the gene expression levels of various samples. Box charts for each region correspond to the maximum, upper quartile, median, lower quartile, and minimum of log10 (RPKM). (B) Scatter plot of the gene expression correlation in this study. The abscissa and ordinate represent log10(RPKM) of different sample genes respectively. (C–E) MA plot indicating upregulated and downregulated differentially expressed genes (DEGs) in the ex vivo model 6, 12, and 24 h after Bb infection. The abscissa represented Average log2 (CPM). The ordinate represented log2 (FC). The two blue lines represent the threshold of differentially expressed genes and the points outside the threshold are marked in red. log2 (FC) > 1 represents upregulated and log2 (FC) < -1 represents downregulated. (F) Venn diagram representing the overlap of identified DEGs. Overlaps showing 6 h-DEGs (n = 2249; yellow), 12 h-DEGs (n = 1064; red), 24 h-DEGs (n = 420; green), 6, 12, 24 h-DEGs (n = 3382; blue). (G) Number of upregulated and downregulated DEGs at 6, 12, and 24 h.
DEGs in the Frontal Cortex Brain Transcriptome Following Bb Infection
Using an MA plot, we could clearly identify DEGs at separate time points (Figures 2C–E). The details of these DEGs at each time point are listed in the respective tables (Additional files 1–3: Supplementary Tables S1–S3). The Venn diagram showed that the number of DEGs at 6, 12, and 24 h was 2,249, 1,064, and 420, respectively (Figure 2F). A comparison of DEGs at each time point revealed that 23 DEGs were shared at all three time points (Figure 2F), and 1,816 (80.7%) genes were identified as being significantly upregulated and 433 (19.3%) were significantly downregulated at 6 h after the Bb infection, 563 genes (52.9%) were significantly upregulated and 501 genes (47.1%) were significantly downregulated at 12 h after the Bb infection, while 83 genes (19.8%) were significantly upregulated and 337 genes (80.2%) were significantly downregulated at 24 h after the Bb infection (Figure 2G). Moreover, the heatmap (Figure 3) illustration of the DEGs shows the changes in mRNA abundance observed in each group following the Bb infection.
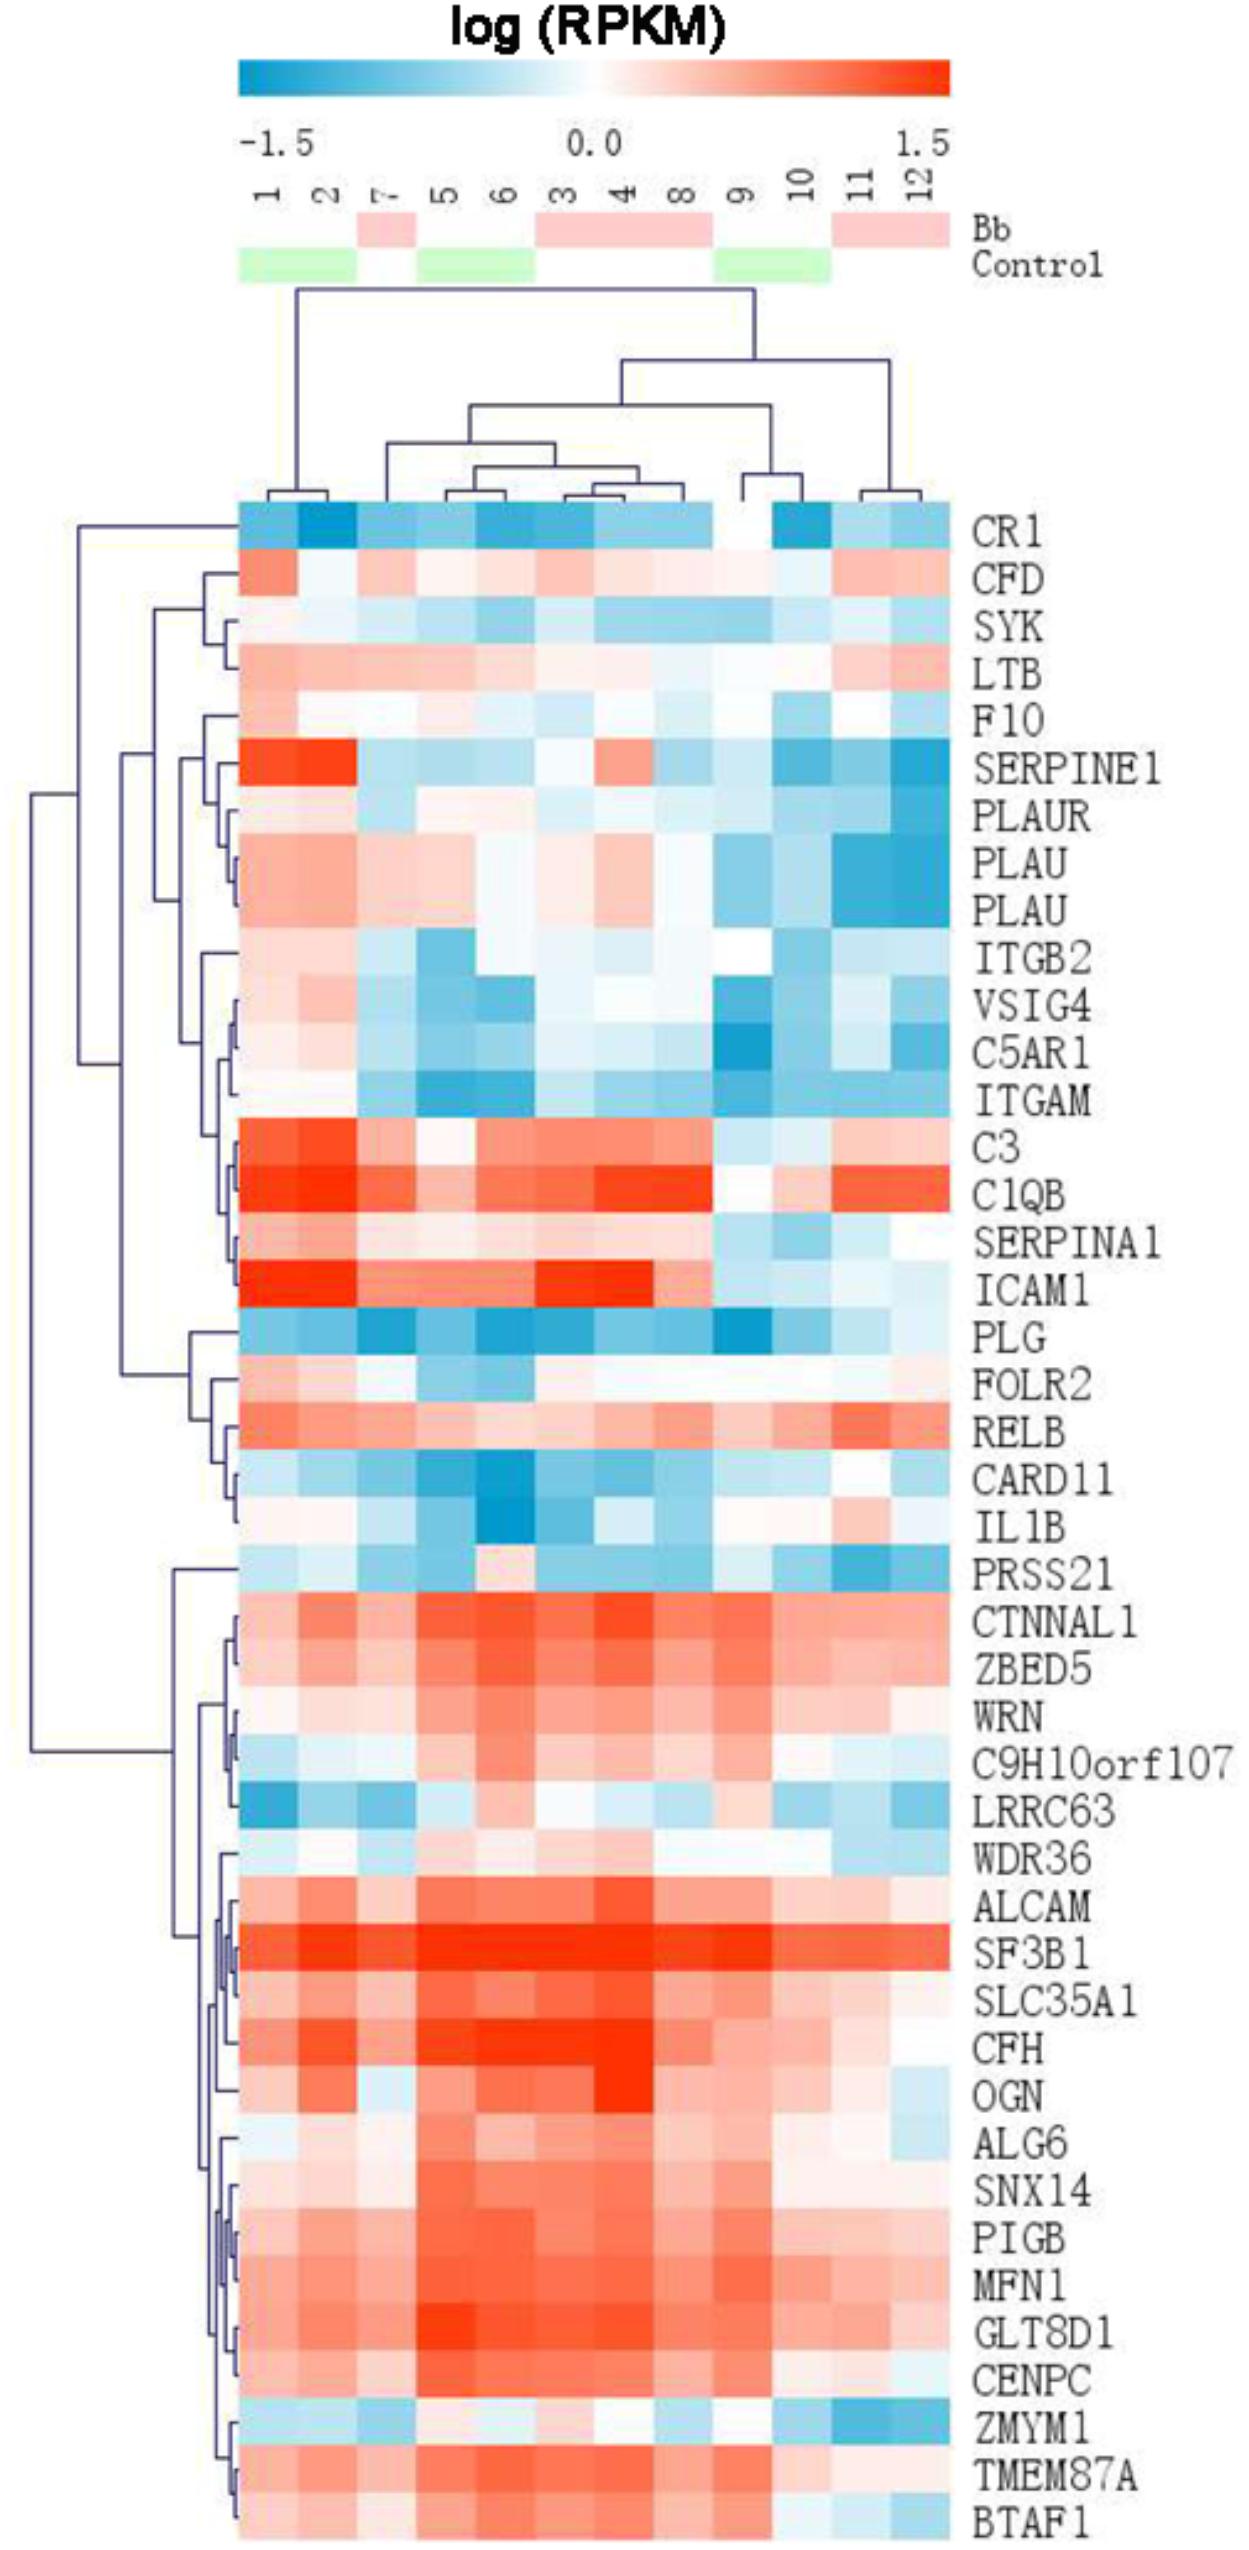
Figure 3. Heatmap of DEGs identified by RNA sequencing showing the hierarchical clustering of the relative expression of a portion of the DEGs in each sample, for the sake of brevity. The Bb group and control group are represented by red and green, respectively. High and low abundance of gene expression are shown in red and blue, respectively.
GO Functional Analysis of DEGs
The upregulated DEGs at 6 h were enriched in BP terms including protein ubiquitination, lipoprotein metabolic process and protein modification by small protein conjugation, CC terms including cytoplasm, and MF terms including ubiquitin-protein transferase activity and RNA binding. The upregulated DEGs at 12 h were enriched in BP terms including the glutamate receptor signaling pathway and G-protein coupled acetylcholine receptor signaling pathway, CC terms including neuron component, and MF terms such as protein kinase activity. The upregulated DEGs at 24 h were enriched in BP terms including regulation of the adaptive immune response, CC terms including cell surface, and MF terms including protein-hormone receptor activity. The GO enrichment terms of BP, CC, and MF for upregulated DEGs at 6, 12, and 24 h are shown in Figures 4A,C,E.
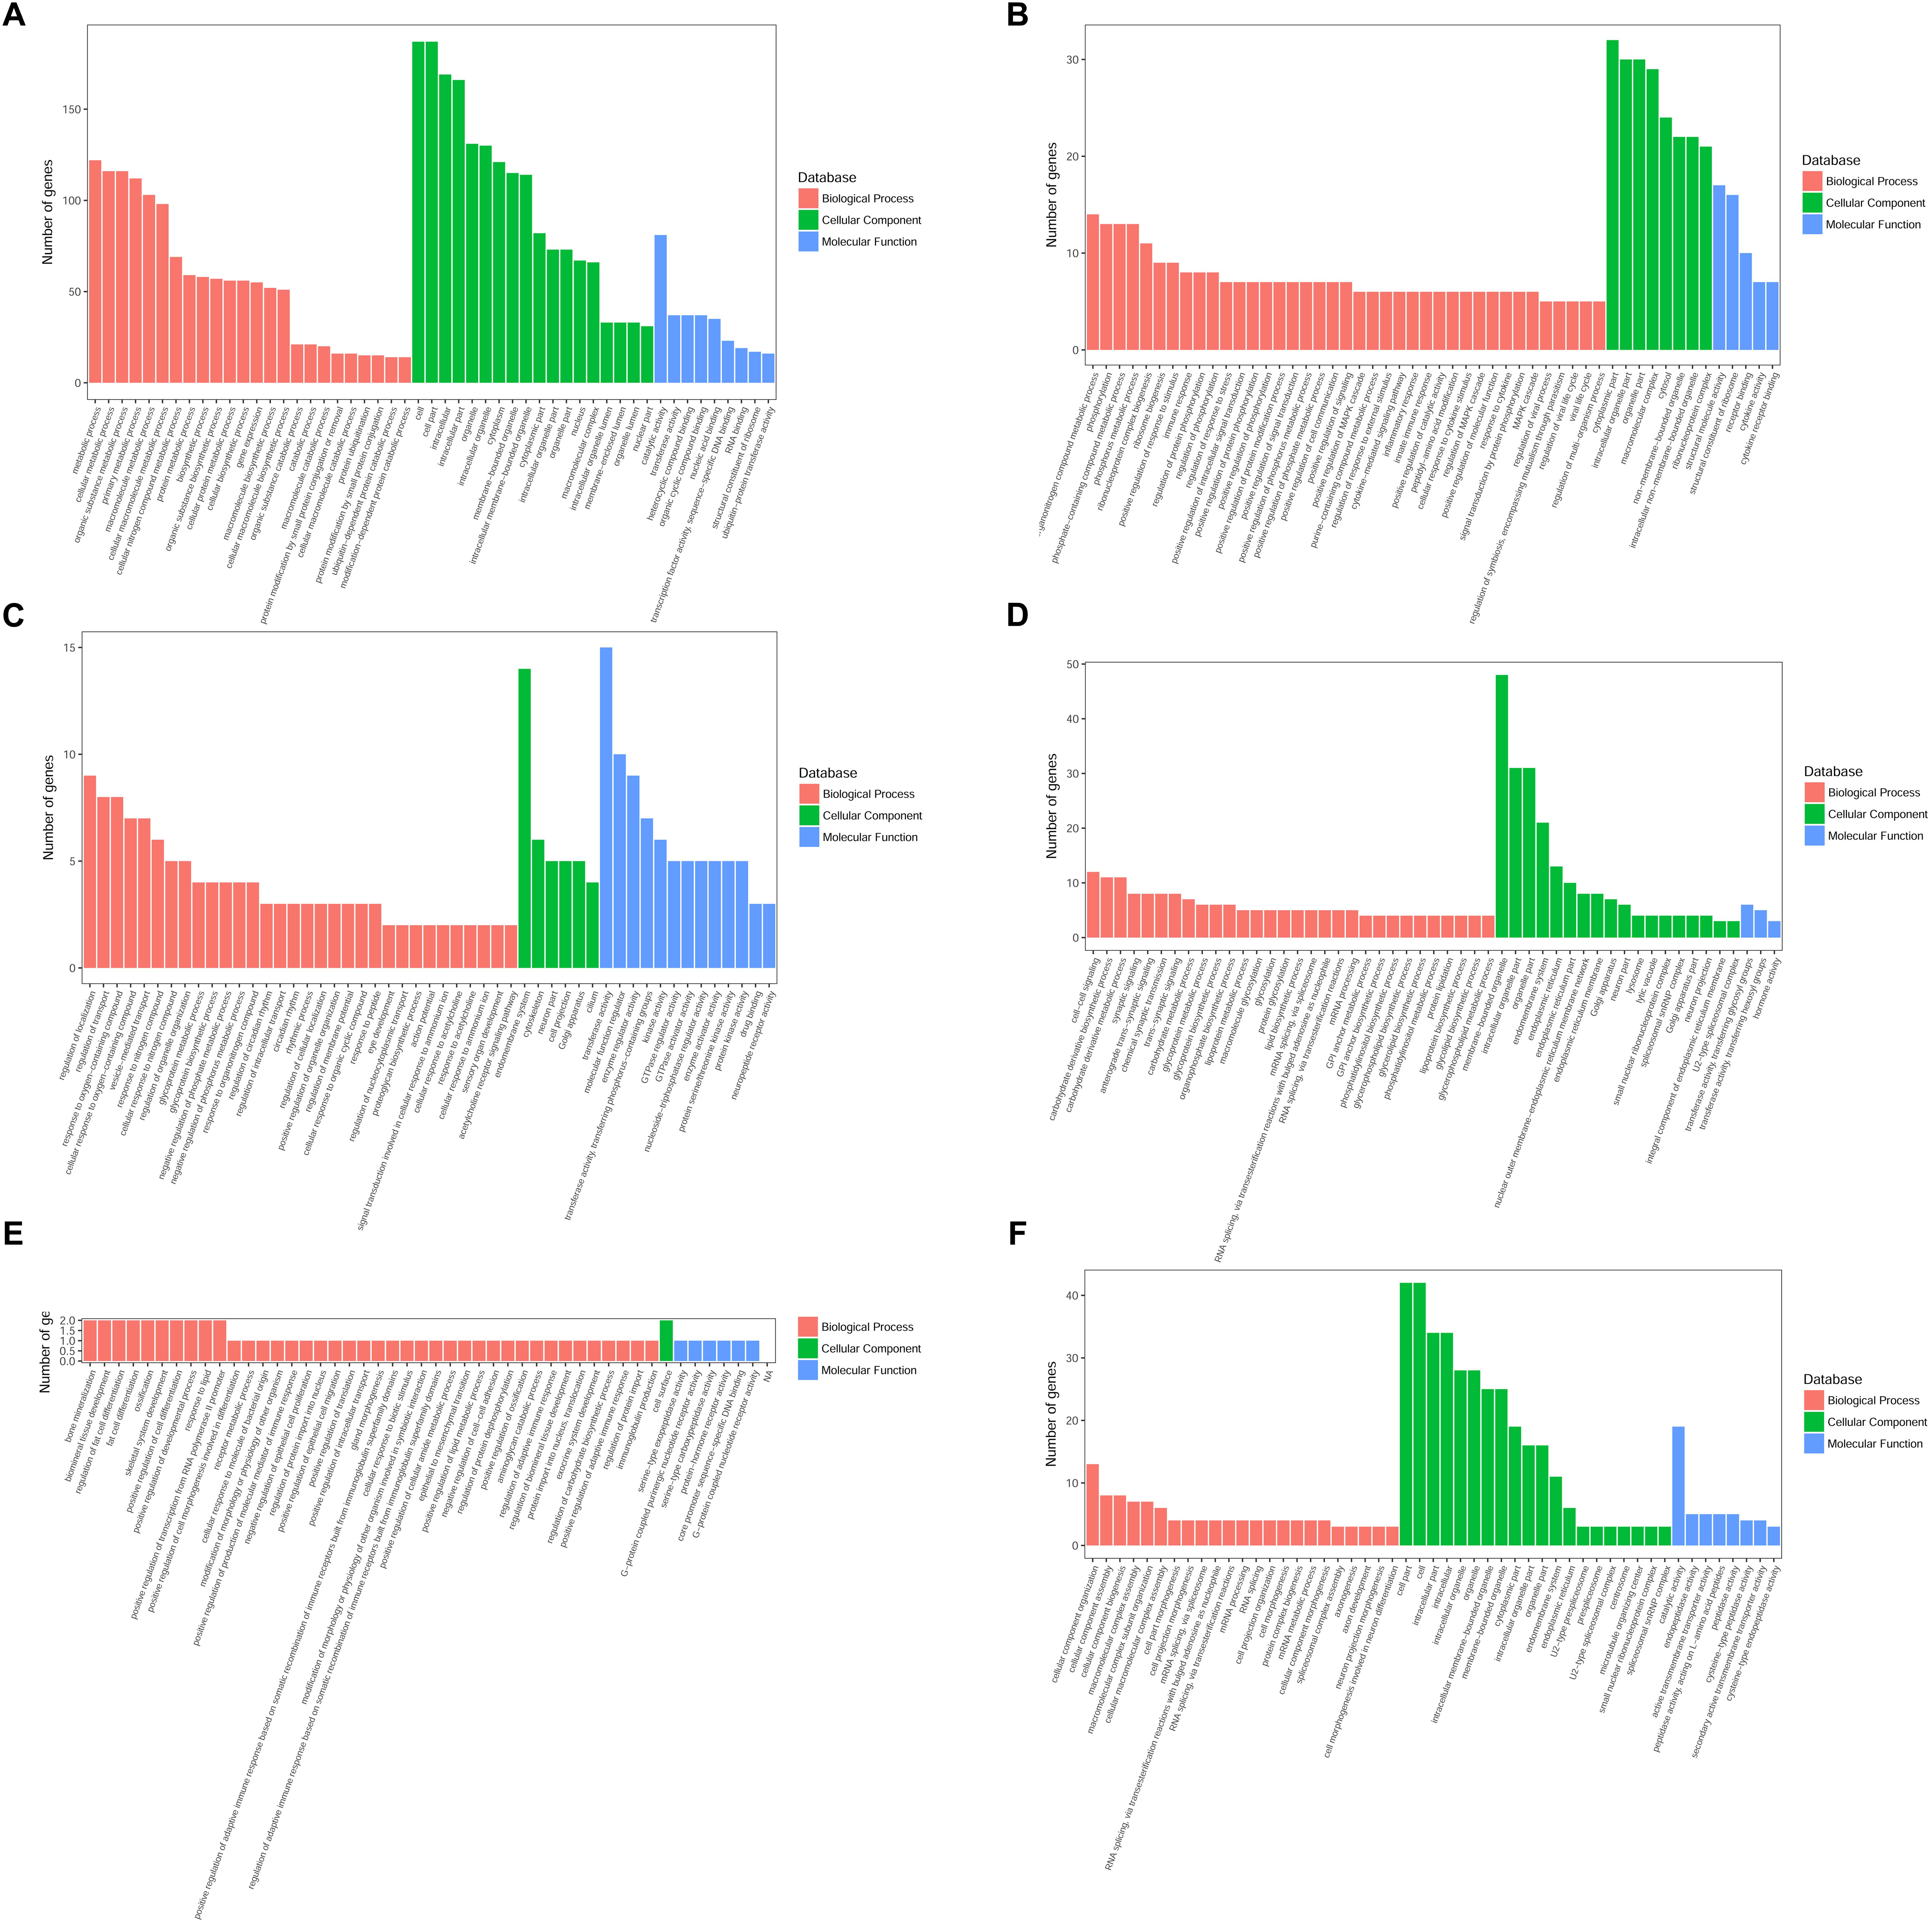
Figure 4. GO annotation analysis of upregulated and downregulated DEGs at various time points. GO annotation characterization of the molecular functions, biological processes, and cellular components based on significantly upregulated or downregulated DEGs. (A) GO annotation for upregulated DEGs at 6 h. (B) GO annotation for downregulated DEGs at 6 h. (C) GO annotation for upregulated DEGs at 12 h. (D) GO annotation for downregulated DEGs at 12 h. (E) GO annotation for upregulated DEGs at 24 h. (F) GO annotation for downregulated DEGs at 24 h.
Meanwhile, the downregulated DEGs at 6 h were enriched in BP terms including alpha-beta T cell activation, cellular response to IFN-γ, cellular response to IL-1, and positive regulation of leukocyte differentiation, CC terms including cytosolic ribosome, and MF terms including CCR chemokine receptor binding and chemokine activity. The downregulated DEGs at 12 h were enriched in BP terms including GPI anchor metabolic process and synaptic signaling, CC terms including endoplasmic reticulum part, and MF terms such as neuropeptide hormone activity. The downregulated DEGs at 24 h were enriched in BP terms including semaphorin-plexin signaling pathway, CC terms including prespliceosome, and MF terms including active transmembrane transporter activity. The GO enrichment terms of BP, CC, and MF for downregulated DEGs at 6, 12, and 24 h are shown in Figures 4B,D,F.
The complete GO results for upregulated and downregulated genes 6, 12, and 24 h after Bb infection are shown in the Additional files 4–9: Supplementary Table S4–S9.
KEGG Pathway Enrichment Analysis of DEGs
The DEGs between the Bb group and the control group at each time point were subjected to KEGG pathway enrichment analysis through the KEGG database. The threshold for significant enrichment was set at a P-value < 0.01. According to the KEGG pathway enrichment analysis, the upregulated DEGs at 6 h were significantly enriched in 7 signaling pathways, including protein processing in the endoplasmic reticulum (Figure 5A). The upregulated DEGs at 12 h were significantly enriched in 2 signaling pathways including glutamatergic synapse and glycosaminoglycan biosynthesis – heparan sulfate/heparin (Figure 5B). Moreover, the upregulated DEGs at 24 h were significantly enriched in 4 signaling pathways, including Staphylococcus aureus infection and complement and coagulation cascades (Figure 5C). The downregulated DEGs at 6 h were significantly enriched in 10 signaling pathways, including complement and coagulation cascades, the NF-kappa B signaling pathway and AD (Figure 5D). The downregulated DEGs at 12 and 24 h were significantly enriched in 12 signaling pathways and 5 signaling pathways, respectively (Figures 5E,F). Interestingly, sphingolipid metabolism and ECM-receptor interactions were both enriched in the downregulated DEGs at 12 and 24 h. Complement and coagulation cascades, which were primarily related to immune and inflammatory responses, were enriched in the DEGs at 6 and 24 h.
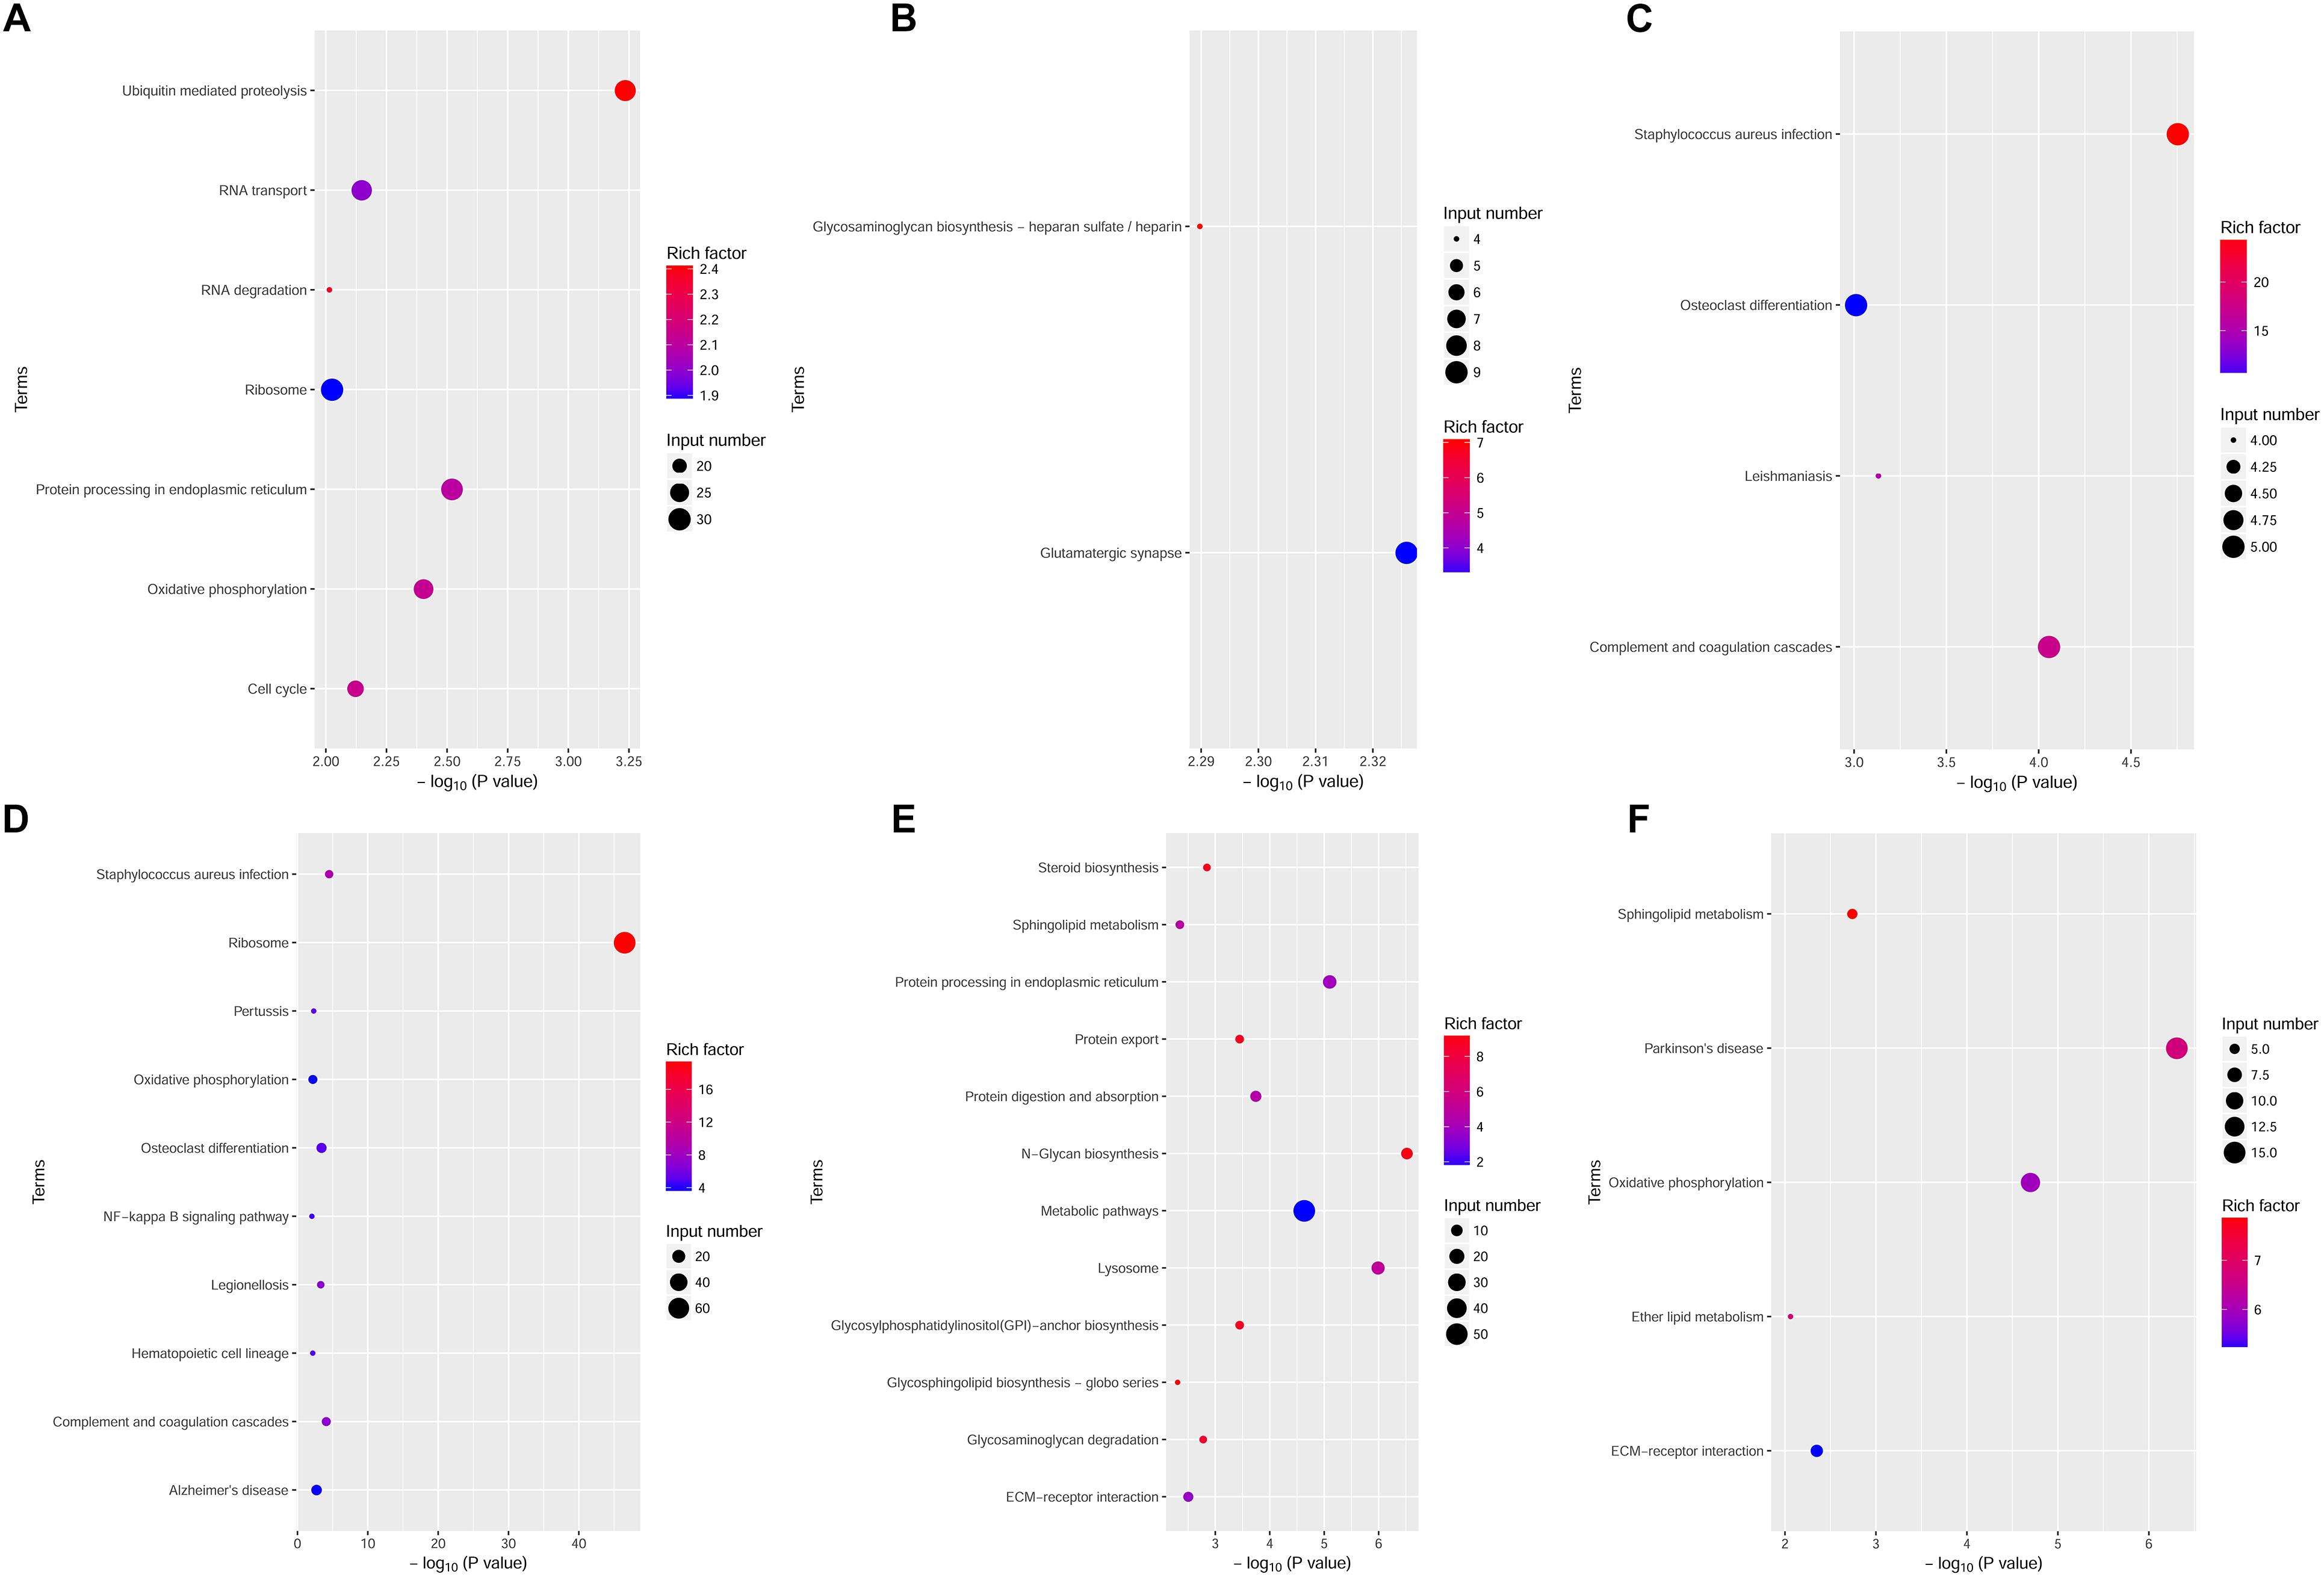
Figure 5. KEGG pathway enrichment analysis of upregulated and downregulated DEGs at various time points. The dot size and depth indicate the number of DEGs contained in the KEGG pathway and the degree of enrichment of the rich factor, respectively. We chose the most significant top 20 GO terms according to –log10 (P-value). (A–C) KEGG analysis of upregulated DEGs at 6, 12, and 24 h. (D–F) KEGG analysis of downregulated DEGs at 6, 12, and 24 h. Rich factor: the enrichment factor of KEGG pathway enrichment analysis of DEGs; Input number: the number of genes enriched in this pathway in the list of differentially expressed genes.
Prediction of FOLR2 Closely Related to Different Branches of the Immune System Based on PPI Network Analysis
To investigate the interaction of DEGs in response to Bb infection following the co-culture experiment, the PPI network analysis was performed using STRING. As shown, the predicted PPI in the frontal cortex brain of the rhesus macaques exhibited an intricate network after the Bb infection (Figure 6A). The established PPI network (PPI enrichment p-value < 1.0e-16) contained 52 nodes and 168 edges. In addition, 48 pathways were significantly enriched using the FDR value < 0.01 as the threshold of significant enrichment, including the Complement and coagulation cascades, Ras signaling pathway, MAPK signaling pathway, Rap1 signaling pathway, and NF-kappa B signaling pathway, which were closely interrelated as components of the immune response in the progression of the Bb infection (Table 1 and Additional file 10: Supplementary Table S10). Moreover, FOLR2 was shown to be located at an important position from which different branches of the immune response could be driven in the PPI network. To investigate the molecular interaction networks, the predominant function of the DEGs was analyzed using BiNGO 3.03 Cytoscape plug-in, and the intuitive and customizable visual representation of the results was showed in Figures 6B–E. The results of ontological analysis are shown in Table 2. It shows that the first neighbors of FOLR2 were STAB1 and C1QB and the interactions between the DEGs were multitudinous. According to the PPI analysis, the co-expression of FOLR2-STAB1 (score: 0.413) and FOLR2-C1QB (score: 0.329) could potentially activate a series of reactions; however, further studies are warranted.
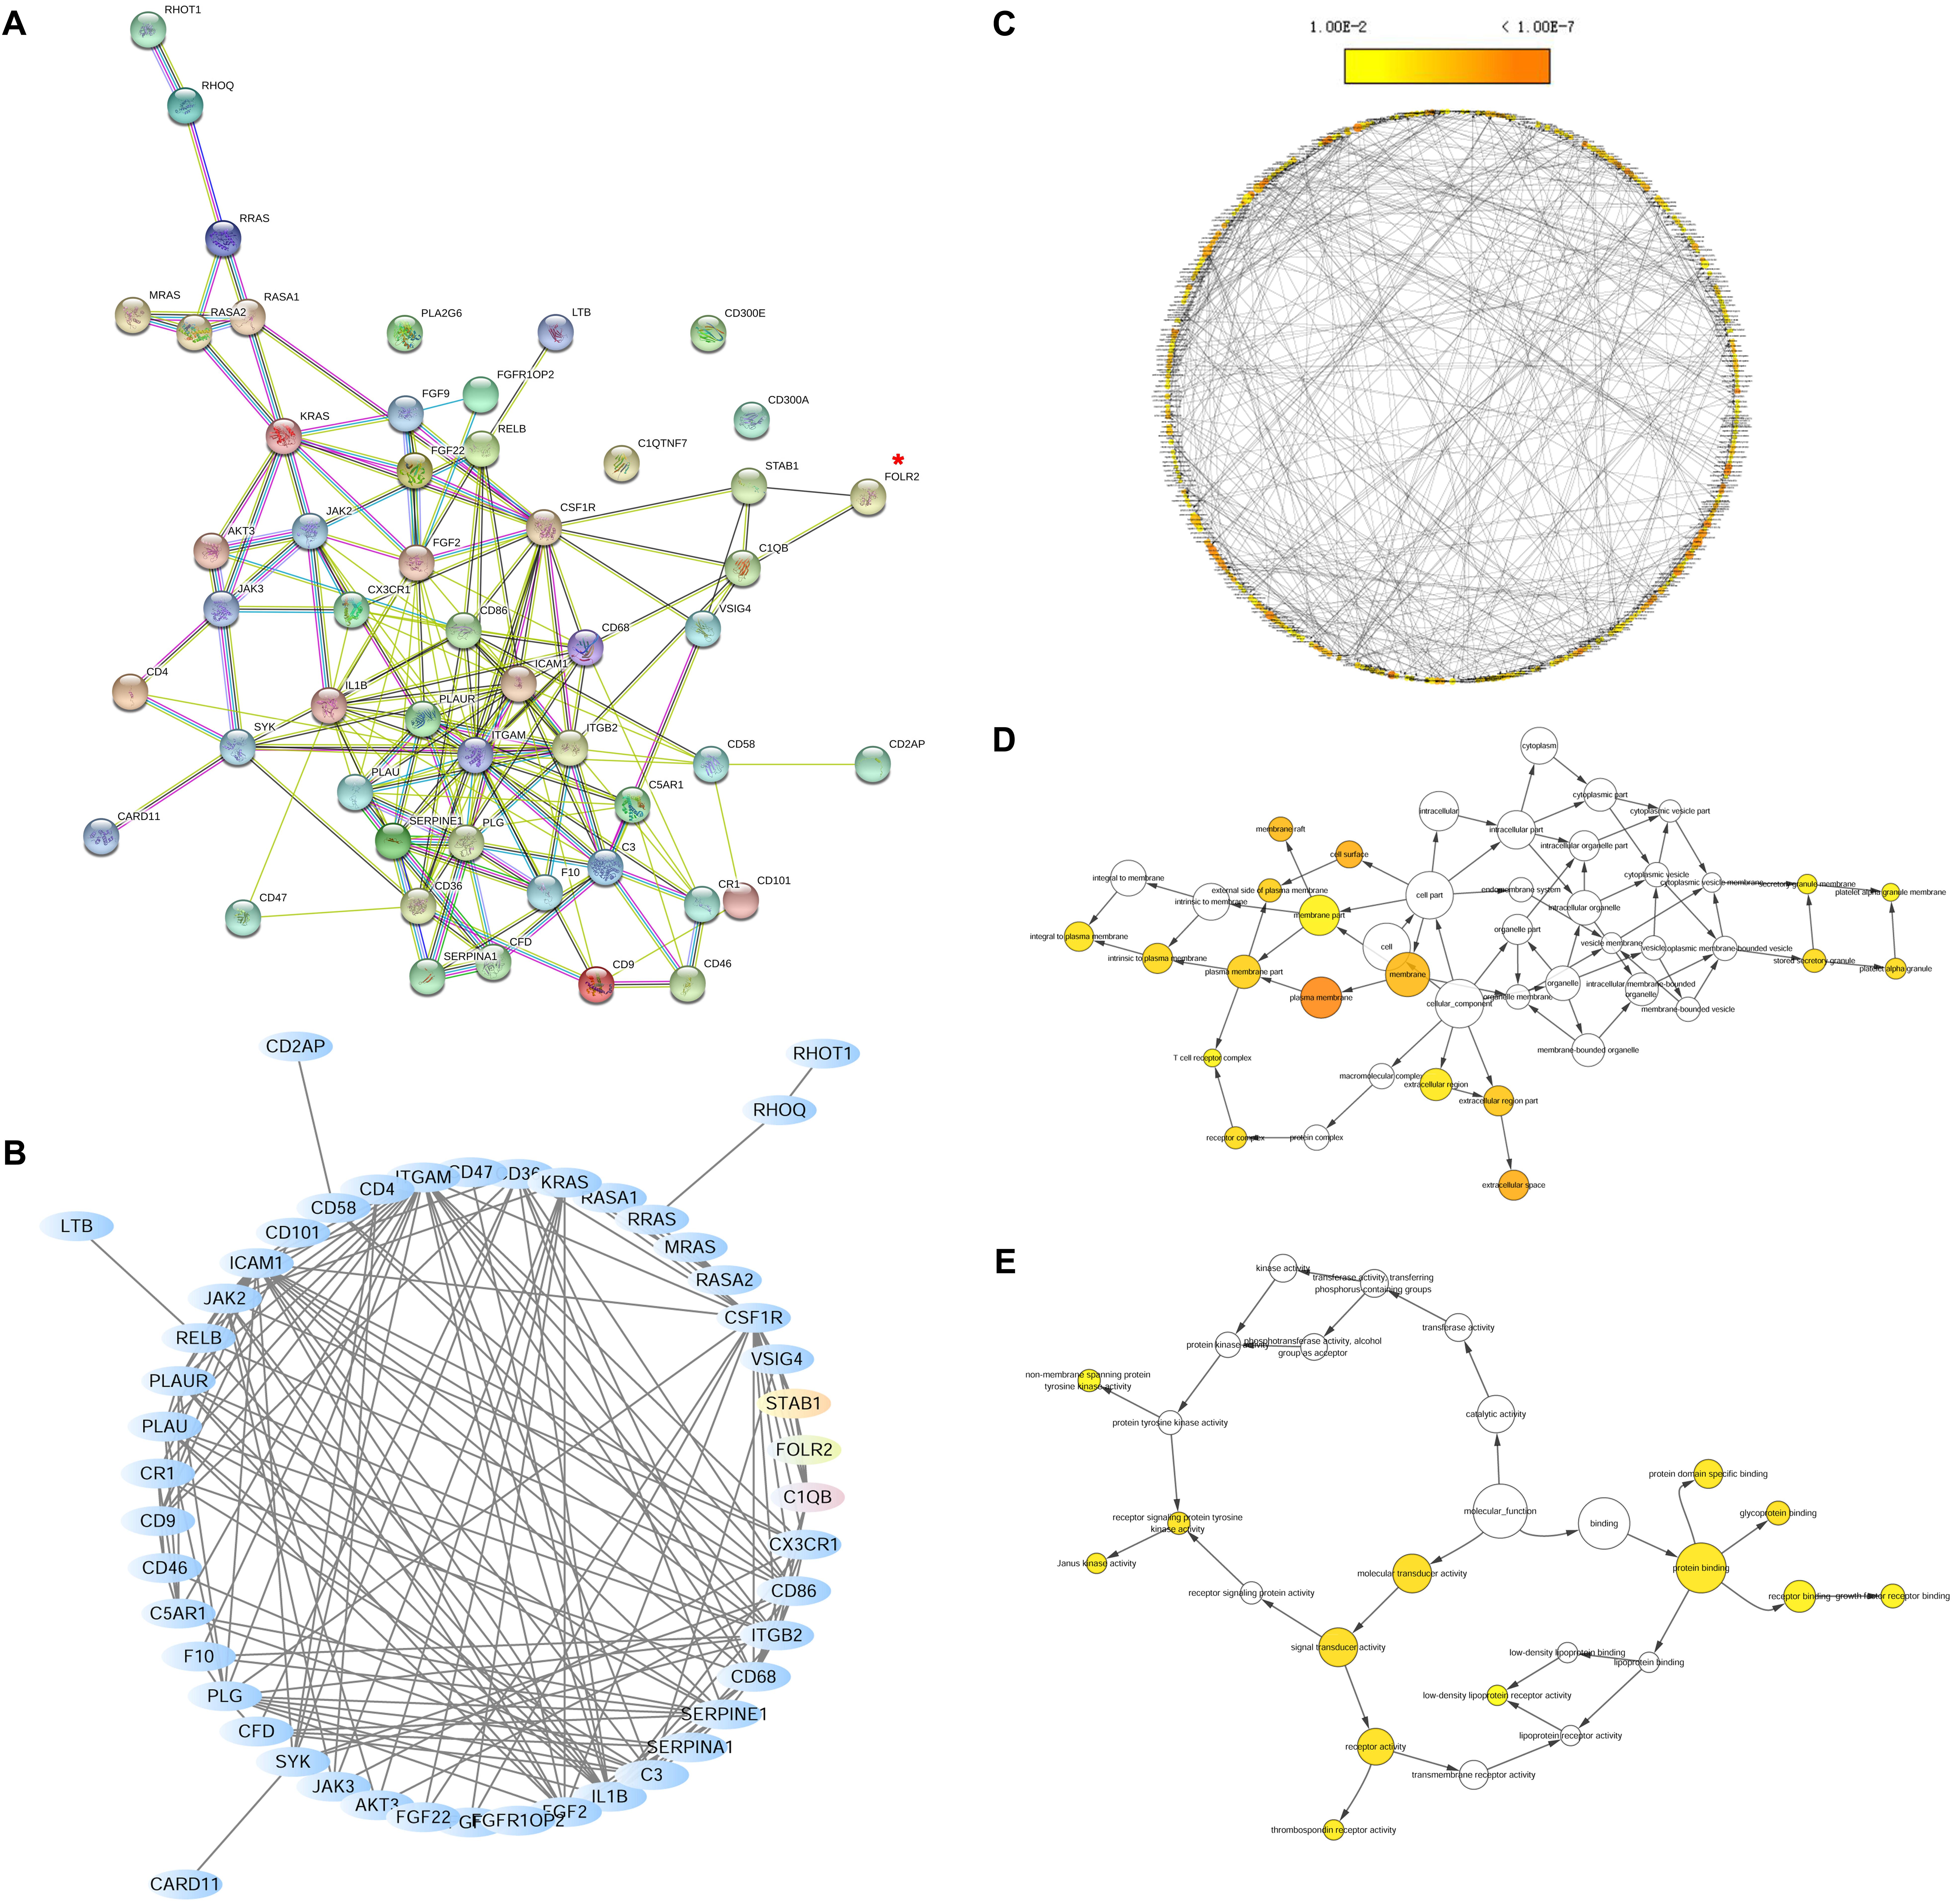
Figure 6. The network analysis of the biological interactions within DEGs based on the RNA-seq datasets. (A) The PPI network of DEGs related to immune responses. The network nodes represent proteins and the edges represent protein-protein associations. The position of FOLR2 is marked by a red asterisk. (B) The network of DEGs related to immune responses using Cytoscape. The first neighbors of FOLR2 (red) were STAB1 (yellow) and C1QB (green). (C) Representative biological process based on BiNGO. (D) Representative cellular component based on BiNGO. (E) Representative molecular function based on BiNGO. Orange categories are most significantly overrepresented and white nodes are not significantly overrepresented. The area of a node was proportional to the number of DEGs in the test set.
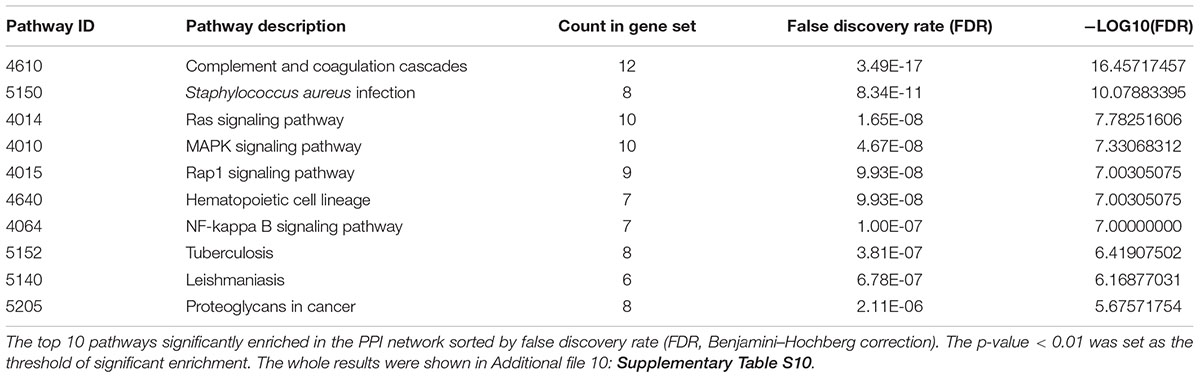
Table 1. KEGG pathways analysis in the PPI network.
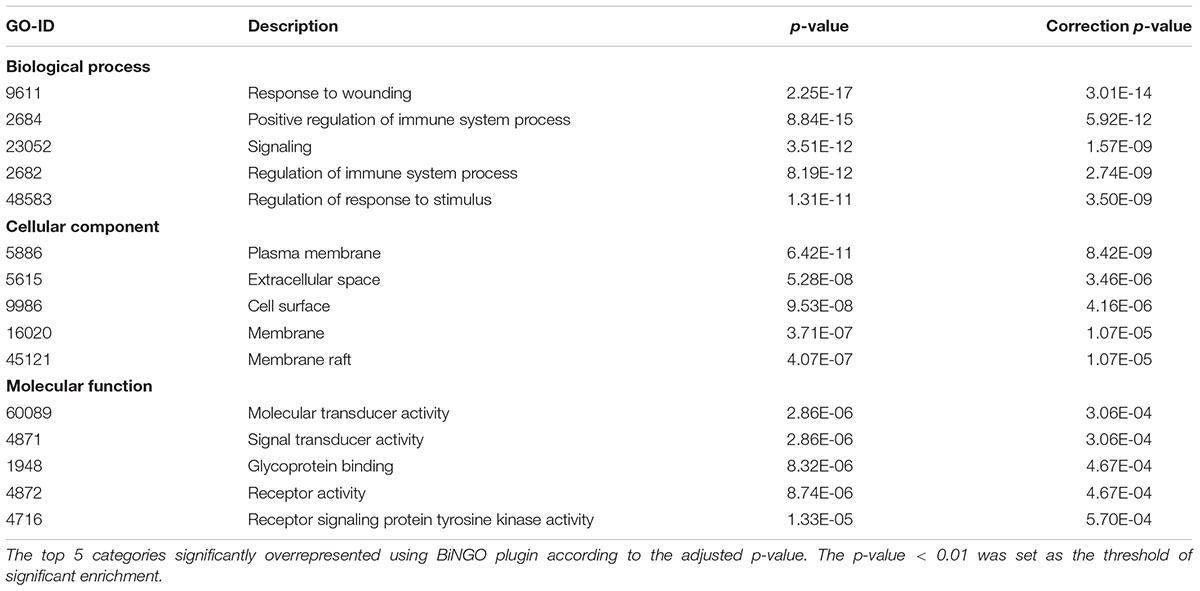
Table 2. Ontological analysis.
Validation of mRNA and Protein Expression of FOLR2 Using qPCR and Western Blotting
Throughout the whole infection course in our study, the expression changes of FOLR2 were the most significant among all the DEGs which inevitably attracted our attention (Figure 7A). Strikingly, the fold change (FC) of FOLR2 mRNA levels at 6, 12, and 24 h according to RNA sequencing were -1.2713, 2.3536, and 5.8588, respectively. Then, real-time PCR was performed to confirm the mRNA expression levels at 6, 12, and 24 h after the Bb infection, and the results were consistent with those obtained with RNA-seq (Figure 7B). The mRNA expression level of FOLR2 in the Bb group was downregulated compared to the control at 6 h only. In contrast, the mRNA expression level of FOLR2 in the Bb group was increasingly upregulated compared to the control at 12 and 24 h. Consistent with the increased level of mRNA expression at 12 and 24 h, the protein level of FOLR2 was also significantly upregulated in cases with Bb infection (Figures 7C,D). However, the protein expression of FOLR2 was upregulated at 6 h after Bb infection, which was inconsistent with the mRNA level, possibly due to the regulation of translation (Schwanhausser et al., 2013).
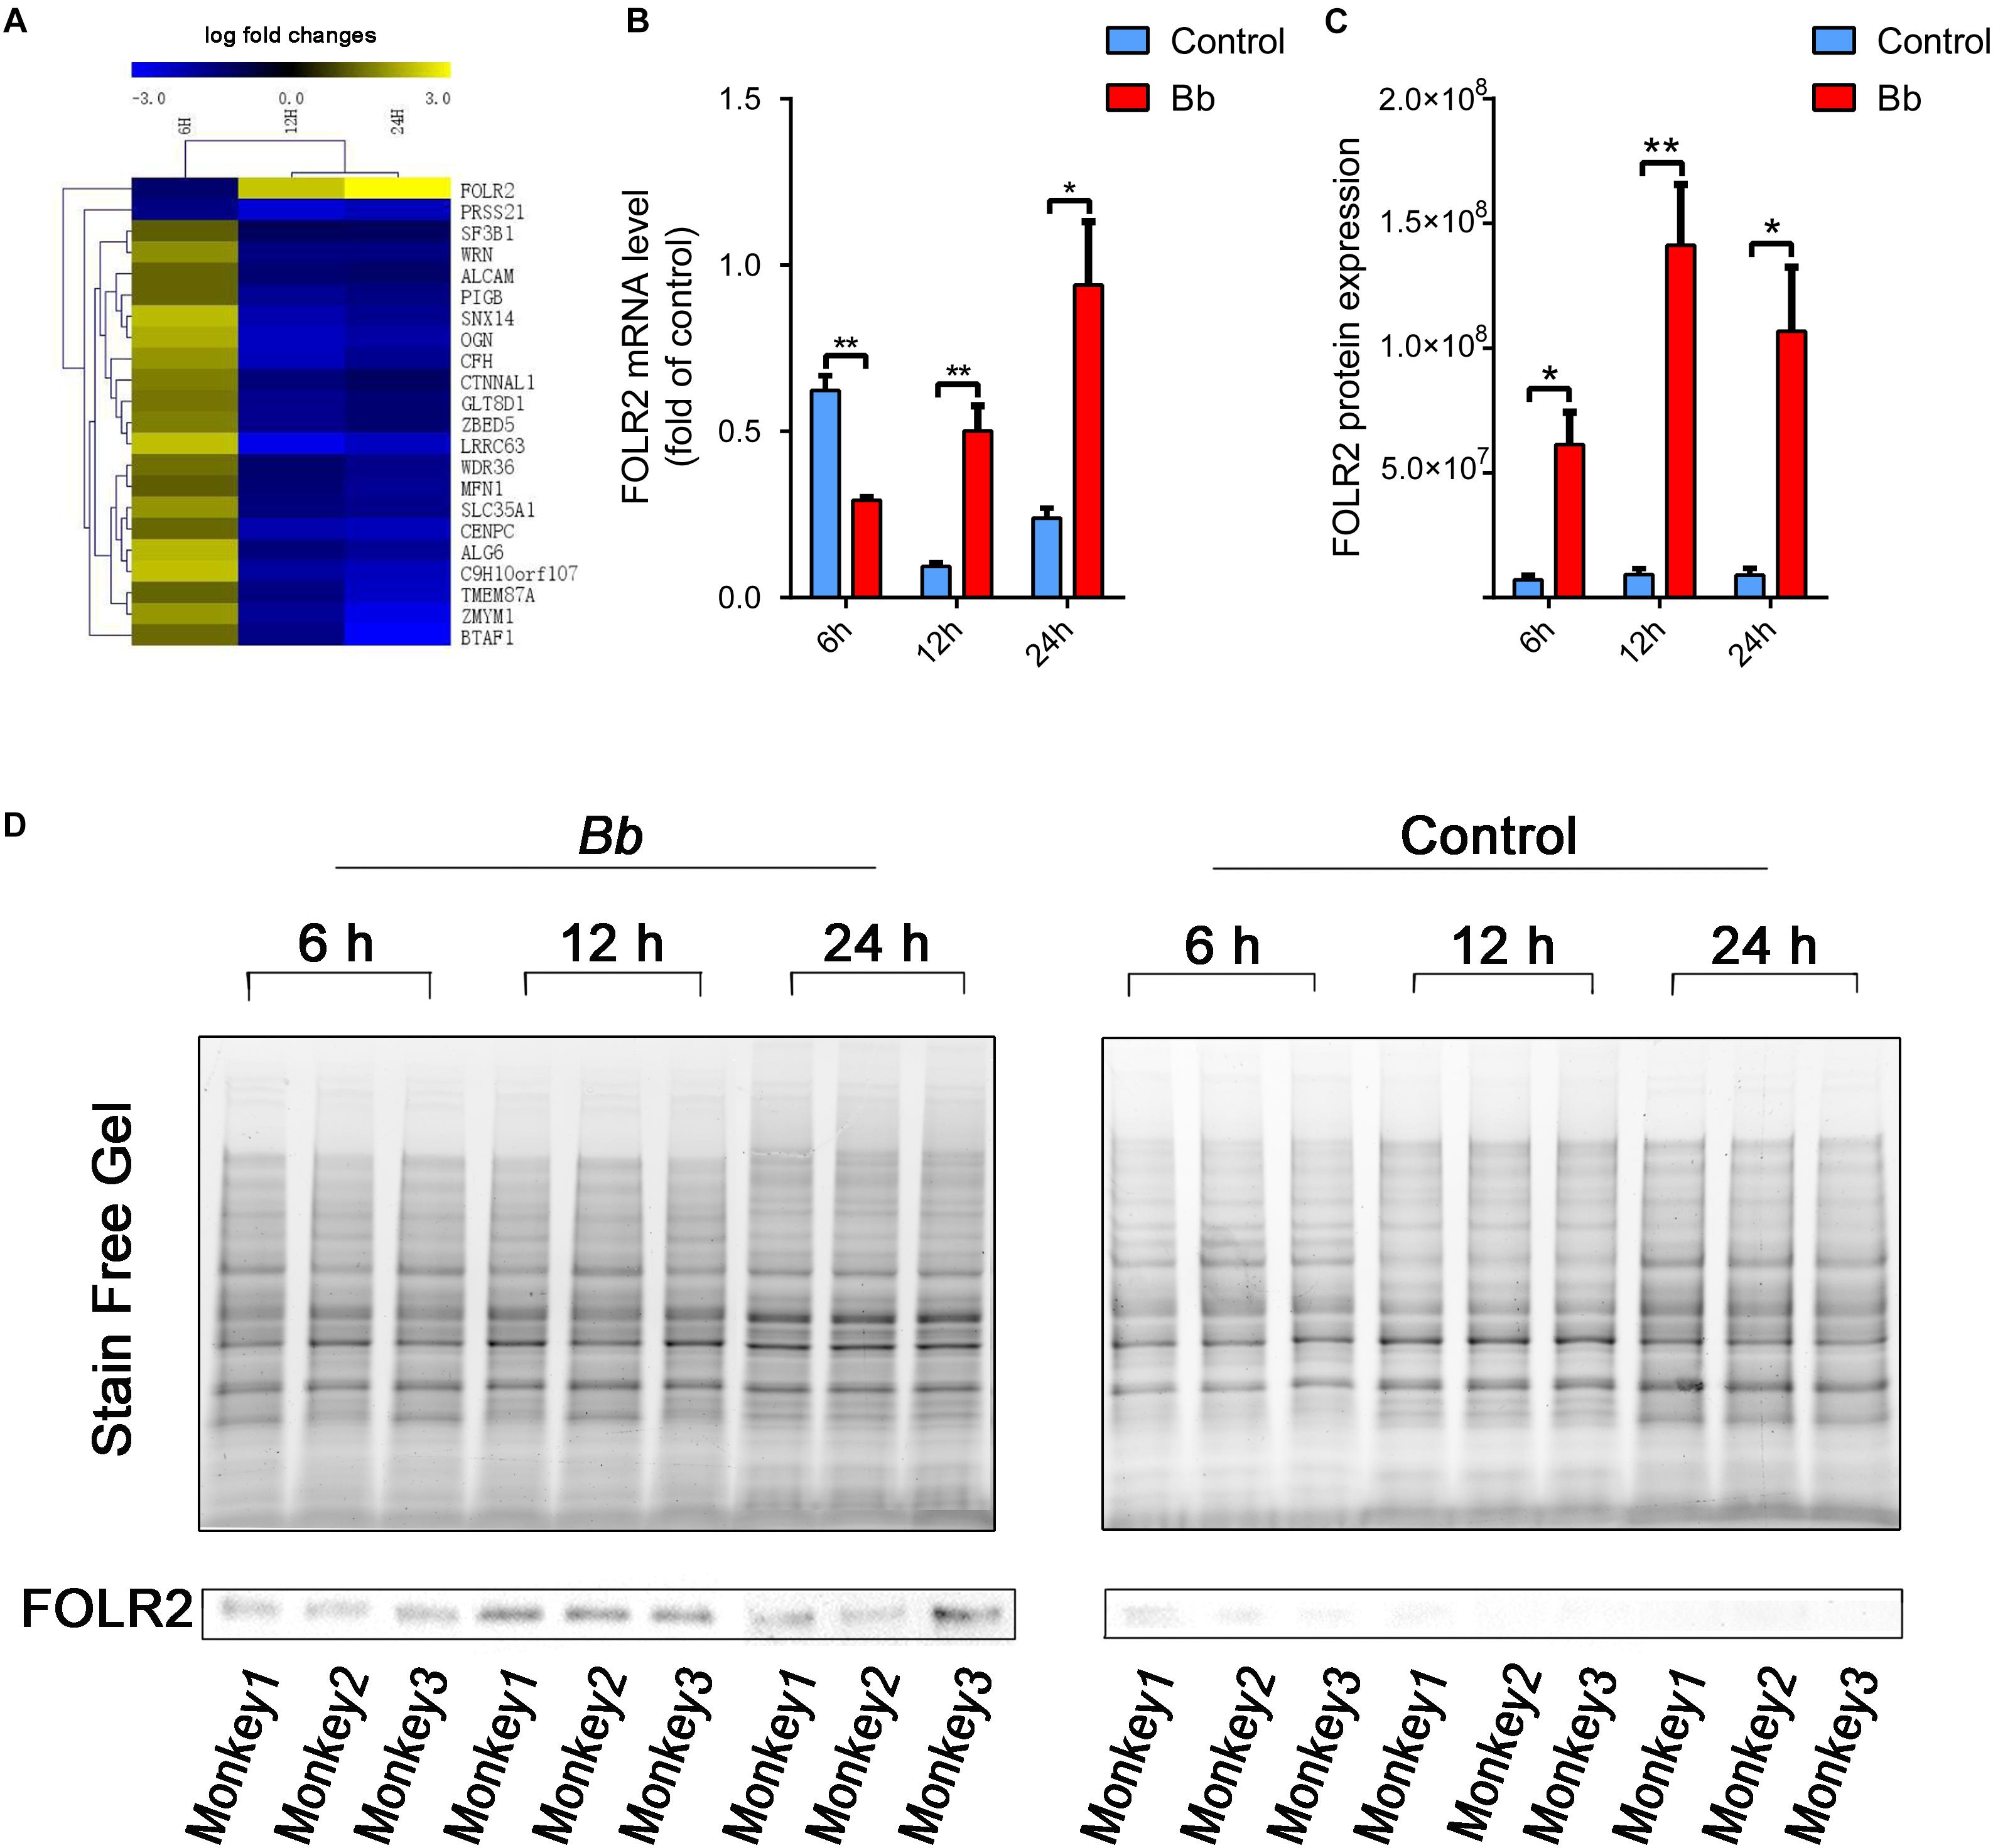
Figure 7. Significant alteration of FOLR2 expression during the progressions of Bb infection. (A) Heatmap showing the fold changes of DEGs based on RNA-seq datasets at three time points in the frontal cortex co-cultured with live Bb compared with the control. Upregulated and downregulated genes are shown in yellow and blue, respectively. (B) Real-time PCR analysis of FOLR2 expression comparing explants from the frontal cortex of rhesus brains co-cultured with live Bb with the controls at 6, 12, and 24 h. (C) Protein expression of FOLR2 in explants from the frontal cortex of rhesus brains co-cultured with live Bb and the controls at 6, 12, and 24 h, validated by western blotting. (D) Western blotting results using total protein loading in the stain-free gel as a loading control. ∗p < 0.05, ∗∗p < 0.01, Bb vs. Control, analyzed with an unpaired two-tail Student t-test. Data were expressed as the means ± SEM.
Discussion
Borrelia burgdorferi, which is a fairly complicated pathogen, can infect a variety of animals, resulting in systemic infection, including neurological infection, which is perhaps regarded as the most dangerous manifestation of this disease. In the case of persistent Bb infection, i.e., if the spirochetes are not cleared out by the host, the nervous system gets attacked, and the inflammation which is elicited by the relentless effort of the host to clear the pathogen is acknowledged as the primary pathogenic mechanism (Ramesh et al., 2017). In the present study, we focused on the alterations of transcriptional profiles to explore the interaction between the host and organism in the CNS via the co-cultivation of live Bb and the frontal cortex of three rhesus macaques.
We have shown that distinct changes in the frontal cortex brain transcriptome between control and Bb infected tissue samples are observed. Previously, extensive studies of the immune responses to Bb during persistent dissemination in the NHP model have helped us to elucidate the neurological deficits (Pachner et al., 2001; Holub et al., 2002). The role of glia cells in initiating or promoting inflammatory responses during Bb-induced infection by facilitating the recruitment of peripheral immune cells and producing cytokines or chemokines has been well documented (Ramesh et al., 2008, 2009, 2013b, 2015; Martinez et al., 2015). Concomitant with the activation of microglia, astrocyte, and oligodendrocyte, as well as the production of antibodies, is the cytokines storm that results in neuroinflammation and the neurological sequelae associated with the apoptosis of glial cells and neurons. Consistent with the literatures, our results show that the DEGs related to immune response are significantly upregulated following Bb infection such as IL6ST, CSF1R, C1QTNF7, CX3CR1, and CCL24 (Additional files 1–3: Supplementary Table S1–S3) and the complement and coagulation cascades which can regulate the immune response and inflammation are still active 24 h after Bb infection comparing control and infected tissue samples (Figure 5C).
Moreover, several studies have provided evidence that chronic spirochetal infection may cause dementia and may be involved in the pathogenesis of neurodegenerative diseases, such as AD (Miklossy et al., 2004; MacDonald, 2007; Miklossy, 2011, 2015). These findings corroborate previous observations that DEGs were significantly enriched in AD, PD, glutamatergic synapse, and sphingolipid metabolism (Figure 5), suggesting that cognitive dysfunction may potentially be a consequence of the impairment of glial and neurons as a result of the interaction between Bb and these cells.
The method of co-culture ex vivo is commonly used in the NHP model of Lyme disease (Ramesh et al., 2013b, 2017; Martinez et al., 2015) and the results have increased our understanding of the mechanisms during the early and late disseminated infection of Bb in the brain. Although the murine model has been recently utilized to trace the spirochetes and neuroinflammation in the brain (Brissette et al., 2012; Divan et al., 2018), the differences between rodents and NHPs are non-negligible; for example, in rodents, Bb was colonized in the dura mater rather than pia mater (Divan et al., 2018), and the activation of astrocytes in the rat brain couldn’t be detected (Brissette et al., 2012). In addition, it is questionable whether the various Bb strains can infect the brains of mice, considering that the culture results that were obtained in strain 297 and could not be replicated with strain B31 (Divan et al., 2018); this discrepancy could perhaps be illuminated within the perspective of the correlation between strains and disease severity (Wang et al., 2002; Li et al., 2006). For example, the most frequent manifestation of LNB in the US is meningitis, caused by B. burgdorferi, sensu stricto rather than B. garinii which is characterized by robust inflammatory responses of neuroborreliosis in Europe, most likely due to the differences in antigenic expression (Fallon et al., 2010). Overall, rhesus macaques which can manifest all of the characteristics are the best model of Lyme disease (Cadavid et al., 2003, 2004) including LNB (Bai et al., 2004).
In this study, a high number of significantly perturbed transcripts of FOLR2 was revealed in our transcriptome analysis of live spirochete-stimulated brain tissues. Indeed, FOLR2 was the most significantly altered gene among all DEGs (5.8588-fold increase), and the differential mRNA expression was observed in our real-time PCR results (Figure 7). It is possible that there was an increased translation of exiting transcripts of FOLR2 or the regulation of translation (Schwanhausser et al., 2013), resulting in the persistent overexpression of the protein even at 6 h post-Bb infection.
Intriguingly, it is believed that FOLR2 (also referred to as FR-β) is commonly overexpressed in activated macrophages involved in the pathogenesis of inflammation and autoimmune diseases, such as autoimmune encephalomyelitis (Lu et al., 2014), ulcerative colitis (Poh et al., 2017b), atherosclerotic (Muller et al., 2014; Poh et al., 2017b), acute myeloid leukemia (Lynn et al., 2015), lung inflammation (Han et al., 2015), and rheumatoid arthritis (Nogueira et al., 2016; Poh et al., 2017a). In addition, FOLR2 has not been detected in the peripheral blood monocytes in mice, whereas it was observed at sites of inflammation in the macrophages of mice (Shen et al., 2014). Based upon these studies, FOLR2 is a specific marker of the macrophages, and the activated macrophages play a vital role in the development and maintenance of inflammatory diseases. Indeed, functional FOLR2 is predominantly found in CD14highCD16- monocytes, which are regarded as the classical subpopulation of proinflammation monocytes (Shen et al., 2014). Based on this premise, folate-targeted imaging and therapeutic agents have been widely introduced into clinical studies as a popular strategy, acting as a locator or targeting drugs selectively to the inflammatory cells (Lu et al., 2015; Poh et al., 2017a,b, 2018).
Transcriptome results obtained from the interaction of Bb with the CNS indicate that FOLR2 could be involved in the pathogenesis of neurological Lyme disease, however, to our knowledge FOLR2 is not yet reported in Bb- induced infection. Based on the PPI analysis, we hypothesize that the over-expression of FOLR2 may contribute to mediating inflammatory and apoptotic signaling cascades in the CNS following Bb infection through the involvement of STAB1 and C1QB in various immune signaling pathways, including the Ras, MAPK, Rap1, PI3K-Akt, NF-kappa B signaling pathway and chemokine signaling pathways (Table 1 and Additional file 10: Supplementary Table S10). MAPK and NF-kappa B signaling have been widely reported to regulate the neuroinflammation and apoptosis in Bb-induced CNS infection, contributing to the progression of LNB (Parthasarathy and Philipp, 2014; Martinez et al., 2015). Additionally, C1Q is the initial recognition subcomponent of the classical complement cascade which contributes to the pathology of neuroinflammatory and neurodegenerative in CNS and is expressed by microglia and macrophage (Depboylu et al., 2005). As previously mentioned, FOLR2 is also specifically overexpressed in macrophage based on the previous literature. Our KEGG pathway enrichment analysis indicates that the up-regulated DEGs including C3, PLG, CFD, CR1, and C1QB are still enriched in complement and coagulation cascades, up to 24 h after infection (Figure 5C). It is possible that FOLR2 could play a critical role in initiating and promoting inflammatory and apoptotic signaling cascades, perhaps augmenting the effects of innate immune response against the infectious pathogens through C1QB (the first neighbor) which result in the pathogenesis of CNS Lyme disease.
FOLR2 is a glycosylphosphatidylinositol – anchored membrane protein that mediates the transport of folate which is indispensable in many metabolic pathways, including amino acid interconversions, nucleotide (DNA) synthesis, and methylation reactions, by transporting one-carbon groups (Han et al., 2015). From the pertinent literature, folates play a crucial role in the regeneration and repair of the adult CNS after injury (Iskandar et al., 2010). However, the underlying mechanism of FOLR2 regulation remained elusive.
Here, we present the transcriptomic response of neurons and glial cells to the exposure of Bb and the aggregate results from this study reveal that the expression levels of genes involved in immune and defense responses are affected significantly after Bb infection. In addition, we propose that FOLR2 is closely related to pathogenesis of Bb-induced infection in brain for the first time. The molecular mechanisms of FOLR2 leading to neuroimmune modulation in LNB are lacked and are currently being investigated in our laboratory. Further detailed studies on a cellular level are warranted to gain a better understanding of FOLR2 as well as the crosstalk in a complex immune network that contribute to the pathogenesis of LNB.
Data Availability
The datasets generated for this study are available on request to the corresponding author.
Ethics Statement
The study was reviewed and approved by the Animal Ethical and Welfare Committee of KMU. Approval for the animal experimentation was granted by the Guide for the Care and Use of Laboratory Animals and the ARRIVE Guidelines for Reporting Animal Research.
Author Contributions
ZD conducted all the experiments, analyzed the data, and drafted the manuscript. MM, LT, and YP cultured the spirochetes and established the ex vivo model. LS and FB participated in the real-time PCR experiments. FB conceived the project and revised the manuscript. XD and RB coordinated the whole experiments. AL supervised the experiments. YH, ZJ, MJ, TC, LS, and FW provided technical and administrative support. All authors read and approved the final manuscript.
Funding
This study was supported by grants from the National Natural Science Foundation of China (Nos. 81560596, 81860644, and 31560051) and the Yunnan Applied Basic Research Projects (Nos. 2017FE467-001 and 2014FA011).
Conflict of Interest Statement
The authors declare that the research was conducted in the absence of any commercial or financial relationships that could be construed as a potential conflict of interest.
Acknowledgments
We thank the Wuhan GeneCreate Biological Engineering Co., Ltd. for their technical assistance in RNA sequencing.
Supplementary Material
The Supplementary Material for this article can be found online at: https://www.frontiersin.org/articles/10.3389/fnins.2019.00651/full#supplementary-material
Abbreviations
AD, Alzheimer’s disease; Bb, Borrelia burgdorferi; BiNGO, the Biological Networks Gene Ontology tool; BP, biological processes; CC, cellular components; CNS, central nervous system; CPM, counts per million reads; DEGs, differentially expressed genes; FBS, fetal bovine serum; FC, fold change; FCB, frontal cortex brain; FDR, False Discovery Rate; GO, Gene Ontology; IFN-γ, interferon-gamma; IL-1, interleukin-1; KEGG, Kyoto Encyclopedia of Genes and Genomes; LNB, Lyme neuroborreliosis; MF, molecular functions; NHP, non-human primate; PBS, phosphate-buffered saline; PD, Parkinson’s disease; PNS, peripheral nervous system; PPI, protein–protein interaction; RPKM, reads per kilobase per million reads.
References
Bai, Y., Narayan, K., Dail, D., Sondey, M., Hodzic, E., Barthold, S. W., et al. (2004). Spinal cord involvement in the nonhuman primate model of Lyme disease. Lab. Invest. 84, 160–172. doi: 10.1038/labinvest.3700024
Beuchat, I., Dunet, V., Meylan, P., and Du Pasquier, R. (2018). Late Lyme neuroborreliosis with chronic encephalomyelitis. Neurology 91, 627–628. doi: 10.1212/wnl.0000000000006252
Bimber, B. N., Ramakrishnan, R., Cervera-Juanes, R., Madhira, R., Peterson, S. M., Norgren, R. B. Jr., et al. (2017). Whole genome sequencing predicts novel human disease models in rhesus macaques. Genomics 109, 214–220. doi: 10.1016/j.ygeno.2017.04.001
Bouquet, J., Soloski, M. J., Swei, A., Cheadle, C., Federman, S., Billaud, J. N., et al. (2016). Longitudinal transcriptome analysis reveals a sustained differential gene expression signature in patients treated for acute lyme disease. MBio 7:e00100-16. doi: 10.1128/mBio.00100-16
Bramwell, K. K., Ma, Y., Weis, J. H., Chen, X., Zachary, J. F., Teuscher, C., et al. (2014). Lysosomal beta-glucuronidase regulates Lyme and rheumatoid arthritis severity. J. Clin. Invest. 124, 311–320. doi: 10.1172/jci72339
Brissette, C. A., Houdek, H. M., Floden, A. M., and Rosenberger, T. A. (2012). Acetate supplementation reduces microglia activation and brain interleukin-1β levels in a rat model of Lyme neuroborreliosis. J. Neuroinflammation 9:249. doi: 10.1186/1742-2094-9-249
Byram, R., Gaultney, R. A., Floden, A. M., Hellekson, C., Stone, B. L., Bowman, A., et al. (2015). Borrelia burgdorferi RevA significantly affects pathogenicity and host response in the mouse model of lyme disease. Infect. Immun. 83, 3675–3683. doi: 10.1128/iai.00530-15
Cadavid, D., Bai, Y., Dail, D., Hurd, M., Narayan, K., Hodzic, E., et al. (2003). Infection and inflammation in skeletal muscle from nonhuman primates infected with different genospecies of the Lyme disease spirochete Borrelia burgdorferi. Infect. Immun. 71, 7087–7098. doi: 10.1128/iai.71.12.7087-7098.2003
Cadavid, D., Bai, Y., Hodzic, E., Narayan, K., Barthold, S. W., and Pachner, A. R. (2004). Cardiac involvement in non-human primates infected with the Lyme disease spirochete Borrelia burgdorferi. Lab. Invest. 84, 1439–1450. doi: 10.1038/labinvest.3700177
Carbone, L. (2012). Pain management standards in the eighth edition of the guide for the care and use of laboratory animals. J. Am. Assoc. Lab. Anim. Sci. 51, 322–328.
Casselli, T., Qureshi, H., Peterson, E., Perley, D., Blake, E., Jokinen, B., et al. (2017). MicroRNA and mRNA transcriptome profiling in primary human astrocytes infected with Borrelia burgdorferi. PLoS One 12:e0170961. doi: 10.1371/journal.pone.0170961
Croke, C. L., Munson, E. L., Lovrich, S. D., Christopherson, J. A., Remington, M. C., England, D. M., et al. (2000). Occurrence of severe destructive lyme arthritis in hamsters vaccinated with outer surface protein A and challenged with Borrelia burgdorferi. Infect. Immun. 68, 658–663. doi: 10.1128/iai.68.2.658-663.2000
Depboylu, C., Schafer, M. K., Schwaeble, W. J., Reinhart, T. A., Maeda, H., Mitsuya, H., et al. (2005). Increase of C1q biosynthesis in brain microglia and macrophages during lentivirus infection in the rhesus macaque is sensitive to antiretroviral treatment with 6-chloro-2’,3’-dideoxyguanosine. Neurobiol. Dis. 20, 12–26. doi: 10.1016/j.nbd.2005.01.030
Divan, A., Casselli, T., Narayanan, S. A., Mukherjee, S., Zawieja, D. C., Watt, J. A., et al. (2018). Borrelia burgdorferi adhere to blood vessels in the dura mater and are associated with increased meningeal T cells during murine disseminated borreliosis. PLoS One 13:e0196893. doi: 10.1371/journal.pone.0196893
Fallon, B. A., Levin, E. S., Schweitzer, P. J., and Hardesty, D. (2010). Inflammation and central nervous system Lyme disease. Neurobiol. Dis. 37, 534–541. doi: 10.1016/j.nbd.2009.11.016
Ghosh, R., Gilda, J. E., and Gomes, A. V. (2014). The necessity of and strategies for improving confidence in the accuracy of western blots. Expert Rev. Proteomics 11, 549–560. doi: 10.1586/14789450.2014.939635
Gilda, J. E., and Gomes, A. V. (2013). Stain-free total protein staining is a superior loading control to beta-actin for Western blots. Anal. Biochem. 440, 186–188. doi: 10.1016/j.ab.2013.05.027
Gilda, J. E., and Gomes, A. V. (2015). Western blotting using in-gel protein labeling as a normalization control: stain-free technology. Methods Mol. Biol. 1295, 381–391. doi: 10.1007/978-1-4939-2550-6_27
Halperin, J. J. (1997). Neuroborreliosis: central nervous system involvement. Semin. Neurol. 17, 19–24. doi: 10.1055/s-2008-1040908
Han, W., Zaynagetdinov, R., Yull, F. E., Polosukhin, V. V., Gleaves, L. A., Tanjore, H., et al. (2015). Molecular imaging of folate receptor beta-positive macrophages during acute lung inflammation. Am. J. Respir. Cell Mol. Biol. 53, 50–59. doi: 10.1165/rcmb.2014-0289OC
Hansen, E. S., Johnson, M. E., Schell, R. F., and Nardelli, D. T. (2016). CD4+ cell-derived interleukin-17 in a model of dysregulated, Borrelia-induced arthritis. Pathog. Dis. 74:ftw084. doi: 10.1093/femspd/ftw084
Hansen, K., Crone, C., and Kristoferitsch, W. (2013). Lyme neuroborreliosis. Handb. Clin. Neurol. 115, 559–575. doi: 10.1016/b978-0-444-52902-2.00032-1
Holub, M., Kluckova, Z., Beran, O., Aster, V., and Lobovska, A. (2002). Lymphocyte subset numbers in cerebrospinal fluid: comparison of tick-borne encephalitis and neuroborreliosis. Acta Neurol. Scand 106, 302–308. doi: 10.1034/j.1600-0404.2002.01314.x
Iskandar, B. J., Rizk, E., Meier, B., Hariharan, N., Bottiglieri, T., Finnell, R. H., et al. (2010). Folate regulation of axonal regeneration in the rodent central nervous system through DNA methylation. J. Clin. Invest. 120, 1603–1616. doi: 10.1172/jci40000
Iyer, R., and Schwartz, I. (2016). Microarray-based comparative genomic and transcriptome analysis of Borrelia burgdorferi. Microarrays 5:E9. doi: 10.3390/microarrays5020009
Kilkenny, C., Browne, W. J., Cuthill, I. C., Emerson, M., and Altman, D. G. (2010). Improving bioscience research reporting: the ARRIVE guidelines for reporting animal research. PLoS Biol. 8:e1000412. doi: 10.1371/journal.pbio.1000412
Koedel, U., Fingerle, V., and Pfister, H. W. (2015). Lyme neuroborreliosis-epidemiology, diagnosis and management. Nat. Rev. Neurol. 11, 446–456. doi: 10.1038/nrneurol.2015.121
Li, L., Narayan, K., Pak, E., and Pachner, A. R. (2006). Intrathecal antibody production in a mouse model of Lyme neuroborreliosis. J. Neuroimmunol. 173, 56–68. doi: 10.1016/j.jneuroim.2005.11.019
Lu, Y., Parker, N., Kleindl, P. J., Cross, V. A., Wollak, K., Westrick, E., et al. (2015). Antiinflammatory activity of a novel folic acid targeted conjugate of the mTOR inhibitor everolimus. Mol. Med. 21, 584–596. doi: 10.2119/molmed.2015.00040
Lu, Y., Wollak, K. N., Cross, V. A., Westrick, E., Wheeler, L. W., Stinnette, T. W., et al. (2014). Folate receptor-targeted aminopterin therapy is highly effective and specific in experimental models of autoimmune uveitis and autoimmune encephalomyelitis. Clin. Immunol. 150, 64–77. doi: 10.1016/j.clim.2013.10.010
Lynn, R. C., Poussin, M., Kalota, A., Feng, Y., Low, P. S., Dimitrov, D. S., et al. (2015). Targeting of folate receptor beta on acute myeloid leukemia blasts with chimeric antigen receptor-expressing T cells. Blood 125, 3466–3476. doi: 10.1182/blood-2014-11-612721
MacDonald, A. B. (2007). Alzheimer’s neuroborreliosis with trans-synaptic spread of infection and neurofibrillary tangles derived from intraneuronal spirochetes. Med. Hypotheses 68, 822–825. doi: 10.1016/j.mehy.2006.08.043
Madar, V., and Batista, S. (2016). FastLSU: a more practical approach for the Benjamini-Hochberg FDR controlling procedure for huge-scale testing problems. Bioinformatics 32, 1716–1723. doi: 10.1093/bioinformatics/btw029
Maere, S., Heymans, K., and Kuiper, M. (2005). BiNGO: a cytoscape plugin to assess overrepresentation of gene ontology categories in biological networks. Bioinformatics 21, 3448–3449. doi: 10.1093/bioinformatics/bti551
Marques, A., Schwartz, I., Wormser, G. P., Wang, Y., Hornung, R. L., Demirkale, C. Y., et al. (2017). Transcriptome assessment of erythema migrans skin lesions in patients with early lyme disease reveals predominant interferon signaling. J. Infect. Dis. 217, 158–167. doi: 10.1093/infdis/jix563
Martinez, A. N., Ramesh, G., Jacobs, M. B., and Philipp, M. T. (2015). Antagonist of the neurokinin-1 receptor curbs neuroinflammation in ex vivo and in vitro models of Lyme neuroborreliosis. J. Neuroinflammation 12, 243. doi: 10.1186/s12974-015-0453-y
Miklossy, J. (2011). Alzheimer’s disease - a neurospirochetosis. analysis of the evidence following Koch’s and Hill’s criteria. J. Neuroinflammation 8:90. doi: 10.1186/1742-2094-8-90
Miklossy, J. (2015). Historic evidence to support a causal relationship between spirochetal infections and Alzheimer’s disease. Front. Aging Neurosci. 7:46. doi: 10.3389/fnagi.2015.00046
Miklossy, J., Khalili, K., Gern, L., Ericson, R. L., Darekar, P., Bolle, L., et al. (2004). Borrelia burgdorferi persists in the brain in chronic lyme neuroborreliosis and may be associated with Alzheimer disease. J. Alzheimers Dis. 6, 639–649; discussion 673–681. doi: 10.3233/jad-2004-6608
Muller, A., Beck, K., Rancic, Z., Muller, C., Fischer, C. R., Betzel, T., et al. (2014). Imaging atherosclerotic plaque inflammation via folate receptor targeting using a novel 18F-folate radiotracer. Mol. Imaging. 13, 1–11.
Munson, E., Nardelli, D. T., Du Chateau, B. K., Callister, S. M., and Schell, R. F. (2012). Hamster and murine models of severe destructive Lyme arthritis. Clin. Dev. Immunol. 2012:504215. doi: 10.1155/2012/504215
Nogueira, E., Gomes, A. C., Preto, A., and Cavaco-Paulo, A. (2016). Folate-targeted nanoparticles for rheumatoid arthritis therapy. Nanomedicine 12, 1113–1126. doi: 10.1016/j.nano.2015.12.365
Pachner, A. R., Gelderblom, H., and Cadavid, D. (2001). The rhesus model of Lyme neuroborreliosis. Immunol. Rev. 183, 186–204. doi: 10.1034/j.1600-065x.2001.1830115.x
Pachner, A. R., and Steiner, I. (2007). Lyme neuroborreliosis: infection, immunity, and inflammation. Lancet. Neurol. 6, 544–552. doi: 10.1016/s1474-4422(07)70128-x
Parthasarathy, G., and Philipp, M. T. (2014). The MEK/ERK pathway is the primary conduit for Borrelia burgdorferi-induced inflammation and P53-mediated apoptosis in oligodendrocytes. Apoptosis 19, 76–89. doi: 10.1007/s10495-013-0913-8
Poh, S., Chelvam, V., Ayala-Lopez, W., Putt, K. S., and Low, P. S. (2018). Selective liposome targeting of folate receptor positive immune cells in inflammatory diseases. Nanomedicine 14, 1033–1043. doi: 10.1016/j.nano.2018.01.009
Poh, S., Chelvam, V., Kelderhouse, L. E., Ayala-Lopez, W., Vaitilingam, B., Putt, K. S., et al. (2017a). Folate-conjugated liposomes target and deliver therapeutics to immune cells in a rat model of rheumatoid arthritis. Nanomedicine 12, 2441–2451. doi: 10.2217/nnm-2017-0166
Poh, S., Putt, K. S., and Low, P. S. (2017b). Folate-targeted dendrimers selectively accumulate at sites of inflammation in mouse models of ulcerative colitis and atherosclerosis. Biomacromolecules 18, 3082–3088. doi: 10.1021/acs.biomac.7b00728
Popitsch, N., Bilusic, I., Rescheneder, P., Schroeder, R., and Lybecker, M. (2017). Temperature-dependent sRNA transcriptome of the Lyme disease spirochete. BMC Genomics 18:28. doi: 10.1186/s12864-016-3398-3
Posch, A., Kohn, J., Oh, K., Hammond, M., and Liu, N. (2013). V3 stain-free workflow for a practical, convenient, and reliable total protein loading control in western blotting. J. Vis. Exp. 82:50948. doi: 10.3791/50948
Ramesh, G., Borda, J. T., Dufour, J., Kaushal, D., Ramamoorthy, R., Lackner, A. A., et al. (2008). Interaction of the Lyme disease spirochete Borrelia burgdorferi with brain parenchyma elicits inflammatory mediators from glial cells as well as glial and neuronal apoptosis. Am. J. Pathol. 173, 1415–1427. doi: 10.2353/ajpath.2008.080483
Ramesh, G., Borda, J. T., Gill, A., Ribka, E. P., Morici, L. A., Mottram, P., et al. (2009). Possible role of glial cells in the onset and progression of Lyme neuroborreliosis. J. Neuroinflammation 6:23. doi: 10.1186/1742-2094-6-23
Ramesh, G., Didier, P. J., England, J. D., Santana-Gould, L., Doyle-Meyers, L. A., Martin, D. S., et al. (2015). Inflammation in the pathogenesis of lyme neuroborreliosis. Am. J. Pathol. 185, 1344–1360. doi: 10.1016/j.ajpath.2015.01.024
Ramesh, G., MacLean, A. G., and Philipp, M. T. (2013a). Cytokines and chemokines at the crossroads of neuroinflammation, neurodegeneration, and neuropathic pain. Mediators Inflamm. 2013:480739. doi: 10.1155/2013/480739
Ramesh, G., Santana-Gould, L., Inglis, F. M., England, J. D., and Philipp, M. T. (2013b). The Lyme disease spirochete Borrelia burgdorferi induces inflammation and apoptosis in cells from dorsal root ganglia. J. Neuroinflammation 10:88. doi: 10.1186/1742-2094-10-88
Ramesh, G., Martinez, A. N., Martin, D. S., and Philipp, M. T. (2017). Effects of dexamethasone and meloxicam on Borrelia burgdorferi-induced inflammation in glial and neuronal cells of the central nervous system. J. Neuroinflammation 14:28. doi: 10.1186/s12974-017-0806-9
Reichelt, W. N., Waldschitz, D., Herwig, C., and Neutsch, L. (2016). Bioprocess monitoring: minimizing sample matrix effects for total protein quantification with bicinchoninic acid assay. J. Ind. Microbiol. Biotechnol. 43, 1271–1280. doi: 10.1007/s10295-016-1796-9
Roberts, E. D., Bohm, R. P. Jr., Lowrie, R. C. Jr., Habicht, G., Katona, L., Piesman, J., et al. (1998). Pathogenesis of Lyme neuroborreliosis in the rhesus monkey: the early disseminated and chronic phases of disease in the peripheral nervous system. J. Infect. Dis. 178, 722–732. doi: 10.1086/515357
Ruzic-Sabljic, E., Lotric-Furlan, S., Maraspin, V., Cimperman, J., Logar, M., Jurca, T., et al. (2006). Comparison of isolation rate of Borrelia burgdorferi sensu lato in MKP and BSK-II medium. Int. J. Med. Microbiol. 296(Suppl. 40), 267–273. doi: 10.1016/j.ijmm.2006.01.005
Sallay, B., Vaculova, T., Derdakova, M., Rusnakova Taragelova, V., Spitalska, E., and Skultety, L. (2017). Two mice models for transferability of zoonotic bacteria via tick vector. Acta Virol. 61, 372–376. doi: 10.4149/av_2017_319
Schwanhausser, B., Busse, D., Li, N., Dittmar, G., Schuchhardt, J., Wolf, J., et al. (2013). Corrigendum: Global quantification of mammalian gene expression control. Nature 495, 126–127. doi: 10.1038/nature11848
Scott, J. D., Clark, K. L., Foley, J. E., Anderson, J. F., Durden, L. A., Manord, J. M., et al. (2017). Detection of borrelia genomospecies 2 in ixodes spinipalpis ticks collected from a Rabbit in Canada. J. Parasitol. 103, 38–46. doi: 10.1645/16-127
Shang, E. S., Champion, C. I., Wu, X. Y., Skare, J. T., Blanco, D. R., Miller, J. N., et al. (2000). Comparison of protection in rabbits against host-adapted and cultivated Borrelia burgdorferi following infection-derived immunity or immunization with outer membrane vesicles or outer surface protein A. Infect. Immun. 68, 4189–4199. doi: 10.1128/iai.68.7.4189-4199.2000
Shen, J., Hilgenbrink, A. R., Xia, W., Feng, Y., Dimitrov, D. S., Lockwood, M. B., et al. (2014). Folate receptor-beta constitutes a marker for human proinflammatory monocytes. J. Leukoc. Biol. 96, 563–570. doi: 10.1189/jlb.2AB0713-372R
Smith, F. D., Ballantyne, R., Morgan, E. R., and Wall, R. (2012). Estimating Lyme disease risk using pet dogs as sentinels. Comp. Immunol. Microbiol. Infect. Dis. 35, 163–167. doi: 10.1016/j.cimid.2011.12.009
Wagner, B., Johnson, J., Garcia-Tapia, D., Honsberger, N., King, V., Strietzel, C., et al. (2015). Comparison of effectiveness of cefovecin, doxycycline, and amoxicillin for the treatment of experimentally induced early Lyme borreliosis in dogs. BMC Vet. Res. 11:163. doi: 10.1186/s12917-015-0475-9
Wagner, G. P., Kin, K., and Lynch, V. J. (2012). Measurement of mRNA abundance using RNA-seq data: RPKM measure is inconsistent among samples. Theory Biosci. 131, 281–285. doi: 10.1007/s12064-012-0162-3
Wang, G., Ojaimi, C., Wu, H., Saksenberg, V., Iyer, R., Liveris, D., et al. (2002). Disease severity in a murine model of lyme borreliosis is associated with the genotype of the infecting Borrelia burgdorferi sensu stricto strain. J. Infect. Dis. 186, 782–791. doi: 10.1086/343043
Xue, C., Raveendran, M., Harris, R. A., Fawcett, G. L., Liu, X., White, S., et al. (2016). The population genomics of rhesus macaques (Macaca mulatta) based on whole-genome sequences. Genome Res. 26, 1651–1662. doi: 10.1101/gr.204255.116
Keywords: transcriptomic analysis, innate immune system, neuroinflammation, CNS, Borrelia burgdorferi, Lyme neuroborreliosis, FOLR2
Citation: Ding Z, Ma M, Tao L, Peng Y, Han Y, Sun L, Dai X, Ji Z, Bai R, Jian M, Chen T, Luo L, Wang F, Bi Y, Liu A and Bao F (2019) Rhesus Brain Transcriptomic Landscape in an ex vivo Model of the Interaction of Live Borrelia Burgdorferi With Frontal Cortex Tissue Explants. Front. Neurosci. 13:651. doi: 10.3389/fnins.2019.00651
Received: 28 March 2019; Accepted: 06 June 2019;
Published: 28 June 2019.
Edited by:
Michael F. Miles, Virginia Commonwealth University, United StatesReviewed by:
Nathan T. Mortimer, Illinois State University, United StatesSilvia Solis-Ortiz, University of Guanajuato, Mexico
Copyright © 2019 Ding, Ma, Tao, Peng, Han, Sun, Dai, Ji, Bai, Jian, Chen, Luo, Wang, Bi, Liu and Bao. This is an open-access article distributed under the terms of the Creative Commons Attribution License (CC BY). The use, distribution or reproduction in other forums is permitted, provided the original author(s) and the copyright owner(s) are credited and that the original publication in this journal is cited, in accordance with accepted academic practice. No use, distribution or reproduction is permitted which does not comply with these terms.
*Correspondence: Aihua Liu, TGl1YWlodWFAa21tdS5lZHUuY24=; Fukai Bao, YmFvZnVrYWlAa21tdS5lZHUuY24=