 Yi-Jing Gan1
 Ai-Wu Fang1Chang Liu1
 Bai-Jing Liu1
 Feng-Mei Yang1
 Ji-Tian Guan1
 Chun-Lin Lan1
 Xiao-Dan Dai1
 Tong Li1Ying Cao1Yun Ran1Xian-Hui Gong1
 Zi-Bing Jin1,2Ren-Zhe Cui3
 Takeshi Iwata4Jia Qu1*Fan Lu1,2*
 Zai-Long Chi1,2*
- 1State Key Laboratory of Ophthalmology, Optometry and Visual Science, The Eye Hospital of Wenzhou Medical University, Wenzhou, China
- 2International Joint Research Center for Regenerative Medicine and Neurogenetics, Wenzhou Medical University, Wenzhou, China
- 3Department of Ophthalmology, Affiliated Hospital of Yanbian University, Yanji, China
- 4Division of Molecular and Cellular Biology, National Institute of Sensory Organs, National Hospital Organization Tokyo Medical Center, Tokyo, Japan
Glaucoma is an optic neuropathy characterized by progressive degeneration of retinal ganglion cells (RGCs). Aberrations in several cytoskeletal proteins, such as tau have been implicated in the pathogenesis of neurodegenerative diseases, could be initiating factors in glaucoma progression and occurring prior to axon degeneration. Developmentally regulated brain protein (Drebrin or DBN1) is an evolutionarily conserved actin-binding protein playing a prominent role in neurons and is implicated in neurodegenerative diseases. However, the relationship between circulating DBN1 levels and RGC degeneration in glaucoma patients remains unclear. In our preliminary study, we detected drebrin protein in the plasma of glaucoma patients using proteomic analysis. Subsequently, we recruited a total of 232 patients including primary angle-closure glaucoma (PACG), primary open-angle glaucoma (POAG) and Posner-Schlossman syndrome (PS) and measured its DBN1 plasma levels. We observed elevated DBN1 plasma levels in patients with primary glaucoma but not in patients with PS compared to nonaxonopathic controls. Interestingly, in contrast to tau plasma levels increased in all groups of patients, elevated drebrin plasma levels correlated with retinal nerve fiber layer defect (RNFLD) in glaucoma patients. To further explore the expression of DBN1 in neurodegeneration, we conducted experiment of optic nerve crush (ONC) models, and observed increased expression of DBN1 in the serum as well as in the retina and then decreased after ONC. This result reinforces the potentiality of circulating DBN1 levels are increased in glaucoma patients with neurodegeneration. Taken together, our findings suggest that circulating DBN1 levels correlated with RNFLD and may reflect the severity of RGCs injury in glaucoma patients. Combining measurement of circulating drebrin and tau levels may be a useful indicator for monitoring progression of neurodegenerative diseases.
Introduction
Glaucoma comprises a group of optic neuropathies characterized by progressive degeneration of RGCs (Weinreb et al., 2014), resulting in characteristic changes in the ONH and RNFL, and associated VF defects (Venkataraman et al., 2010; Almasieh et al., 2012; Chen et al., 2017; Choi et al., 2017). The biological basis of glaucoma is poorly understood, and the factors contributing to its progression have not been fully characterized (Nickells et al., 2012). Diagnosis of glaucoma is made by a combination of identifying characteristic changes of the RGCs and ONH, functional testing such as VFs, and structural imaging of the retina (Mantravadi and Vadhar, 2015). Sometimes, however, OCT analysis and the VF test are infeasible because of refractive medium opacity and unexpected conditions. More importantly, as many as 30 to 50% of RGCs may be lost before VF defects are detectable in clinical examination (Weinreb et al., 2014). Early diagnosis and treatment of glaucoma are key to preventing vision loss. To date, no biochemistry indexes have been used for diagnosis or evaluation of the severity of axonal injury or axonopathy.
Axonal transport deficits or axonopathy is a component of early glaucoma pathogenesis. Aberrations in several cytoskeletal proteins, such as neurofilaments, microtubules, and tau, have been implicated in the pathogenesis of neurodegenerative diseases, could be initiating factors in glaucoma progression and occurring prior to axon degeneration (Wilson et al., 2016). Previous studies have suggested that tau protein and Aβ may serve as both diagnosis and prognosis biomarkers for the most common neurodegenerative disorder AD (Perrin et al., 2009; Jack et al., 2010; Nucci et al., 2010). Glaucoma progression is associated with altered CSF levels of tau proteins (Chiasseu et al., 2016). Several studies have also revealed links between AD and glaucoma; neuropathological progression occurs in the brain as well as in the eye and is mediated by a common neurodegenerative pathway (Javaid et al., 2016). Tau is a cytosolic protein predominantly expressed in neurons and regulates microtubule stability within the axon. It is increasingly recognized that tau accumulates with age and ocular hypertension glaucoma and displays signature pathological features of tauopathies, leading to neurodegeneration (Chiasseu et al., 2016). However, these pathological hallmarks of neurodegenerative diseases are either measured through CSF analysis with invasive collection or diagnosed postmortem (Javaid et al., 2016).
Drebrin is a cytoplasmic actin-binding protein that plays a role in the process of neuronal growth (Sekino et al., 2007), which is classified into two major isoforms in mammals produced by alternative splicing from a single DBN1 gene: drebrin A (adult) and drebrin E (embryonic) (Shirao and Sekino, 2017). Drebrin A is neuron specific (Koganezawa et al., 2017) and highly concentrated in dendritic spines (Hayashi et al., 1996), and its accumulation level is regulated by synaptic activity (Takahashi et al., 2009; Takahashi and Naito, 2017). In contrast, drebrin E is found in widespread but not ubiquitous cell types in various tissues (Shirao and Obata, 1986; Ishikawa et al., 1994; Luna et al., 1997; Peitsch et al., 1999). DBN1 decorating filamentous actin (F-actin) is found at the recipient side of cell-cell communication systems, such as neuronal synapses (Shirao and Sekino, 2017). It has been studied that the hippocampal levels of DBN1 in AD mice model were significantly lower than control, implying that DBN1 may be involved in the degeneration of the central nervous system (Liu et al., 2017). Other studies also found that DBN1 levels were significantly decreased in hippocampal synapses and in the frontal and temporal cortex in patients with AD and DS (Harigaya et al., 1996; Shim and Lubec, 2002).
In our preliminary study, we detected DBN1 in the plasma of patients with POAG by proteomic analysis. To investigate the relationship between DBN1 levels and RGC degeneration in glaucoma patients, a correlation analysis has been performed between the DBN1 plasma levels and RNFLD. In this study, we demonstrated that DBN1 plasma levels increased significantly in glaucoma patients with neurodegeneration and were correlated with RNFLD. In contrast, tau plasma levels were elevated in all groups including PS patients with mild RNFLD. Moreover, we also observed elevated DBN1 levels in the serum of ONC model. Our data suggest that DBN1 plasma levels may reflect the severity of RGC damage in glaucoma patients.
Materials and Methods
Patients
The study was performed according to the tenets of the World Medical Association’s Declaration of Helsinki and was approved by the Clinical Research Ethics Committee at the Eye Hospital of Wenzhou Medical University. A total of 232 patients including 164 PACG, 46 POAG, and 22 PS patients were recruited at the Eye Hospital of Wenzhou Medical University from October 2016 to December 2017. The nonaxonopathic control group (n = 50) comprised patients without any neurodegenerative disease. All participants were questioned about age, gender, history of ocular disease, and systemic clinical symptoms. VF test and IOP were measured bilaterally, and a slit-lamp examination and OCT examination were performed. A consensus was developed before the laboratory and clinical information.
Inclusion / Exclusion Criteria
• All the patients included in this study were diagnosed with PS, PACG, POAG, or cataract (control) by experienced clinical doctors from outpatient.
• Only those patients and controls were included who gave their consent for the study either by themselves or with the help of their close kin.
• All the subjects under the prescription of other preexisting neurodegenerative diseases either in ocular or nervous system at the time of sample collection were excluded.
OCT Analysis
Optical coherence tomography images were obtained for the RNFL thickness analysis. All OCT images scanning the optic disc were acquired from the RTVue FD-OCT device (Optovue, Inc., Fremont, CA, United States) conducted by experienced operators who were blinded to the research. The RTVue FD-OCT has a light source center wavelength of 830 nm, with a scanning depth of 1.984 mm, maximum scanning width of 6 mm, axial resolution of 5 μm, and scanning speed of 26,000 lines per second. RNFL thickness was divided into eight quadrants TU, ST, SN, NU, NL, IN, IT, and TL (Figure 1A).
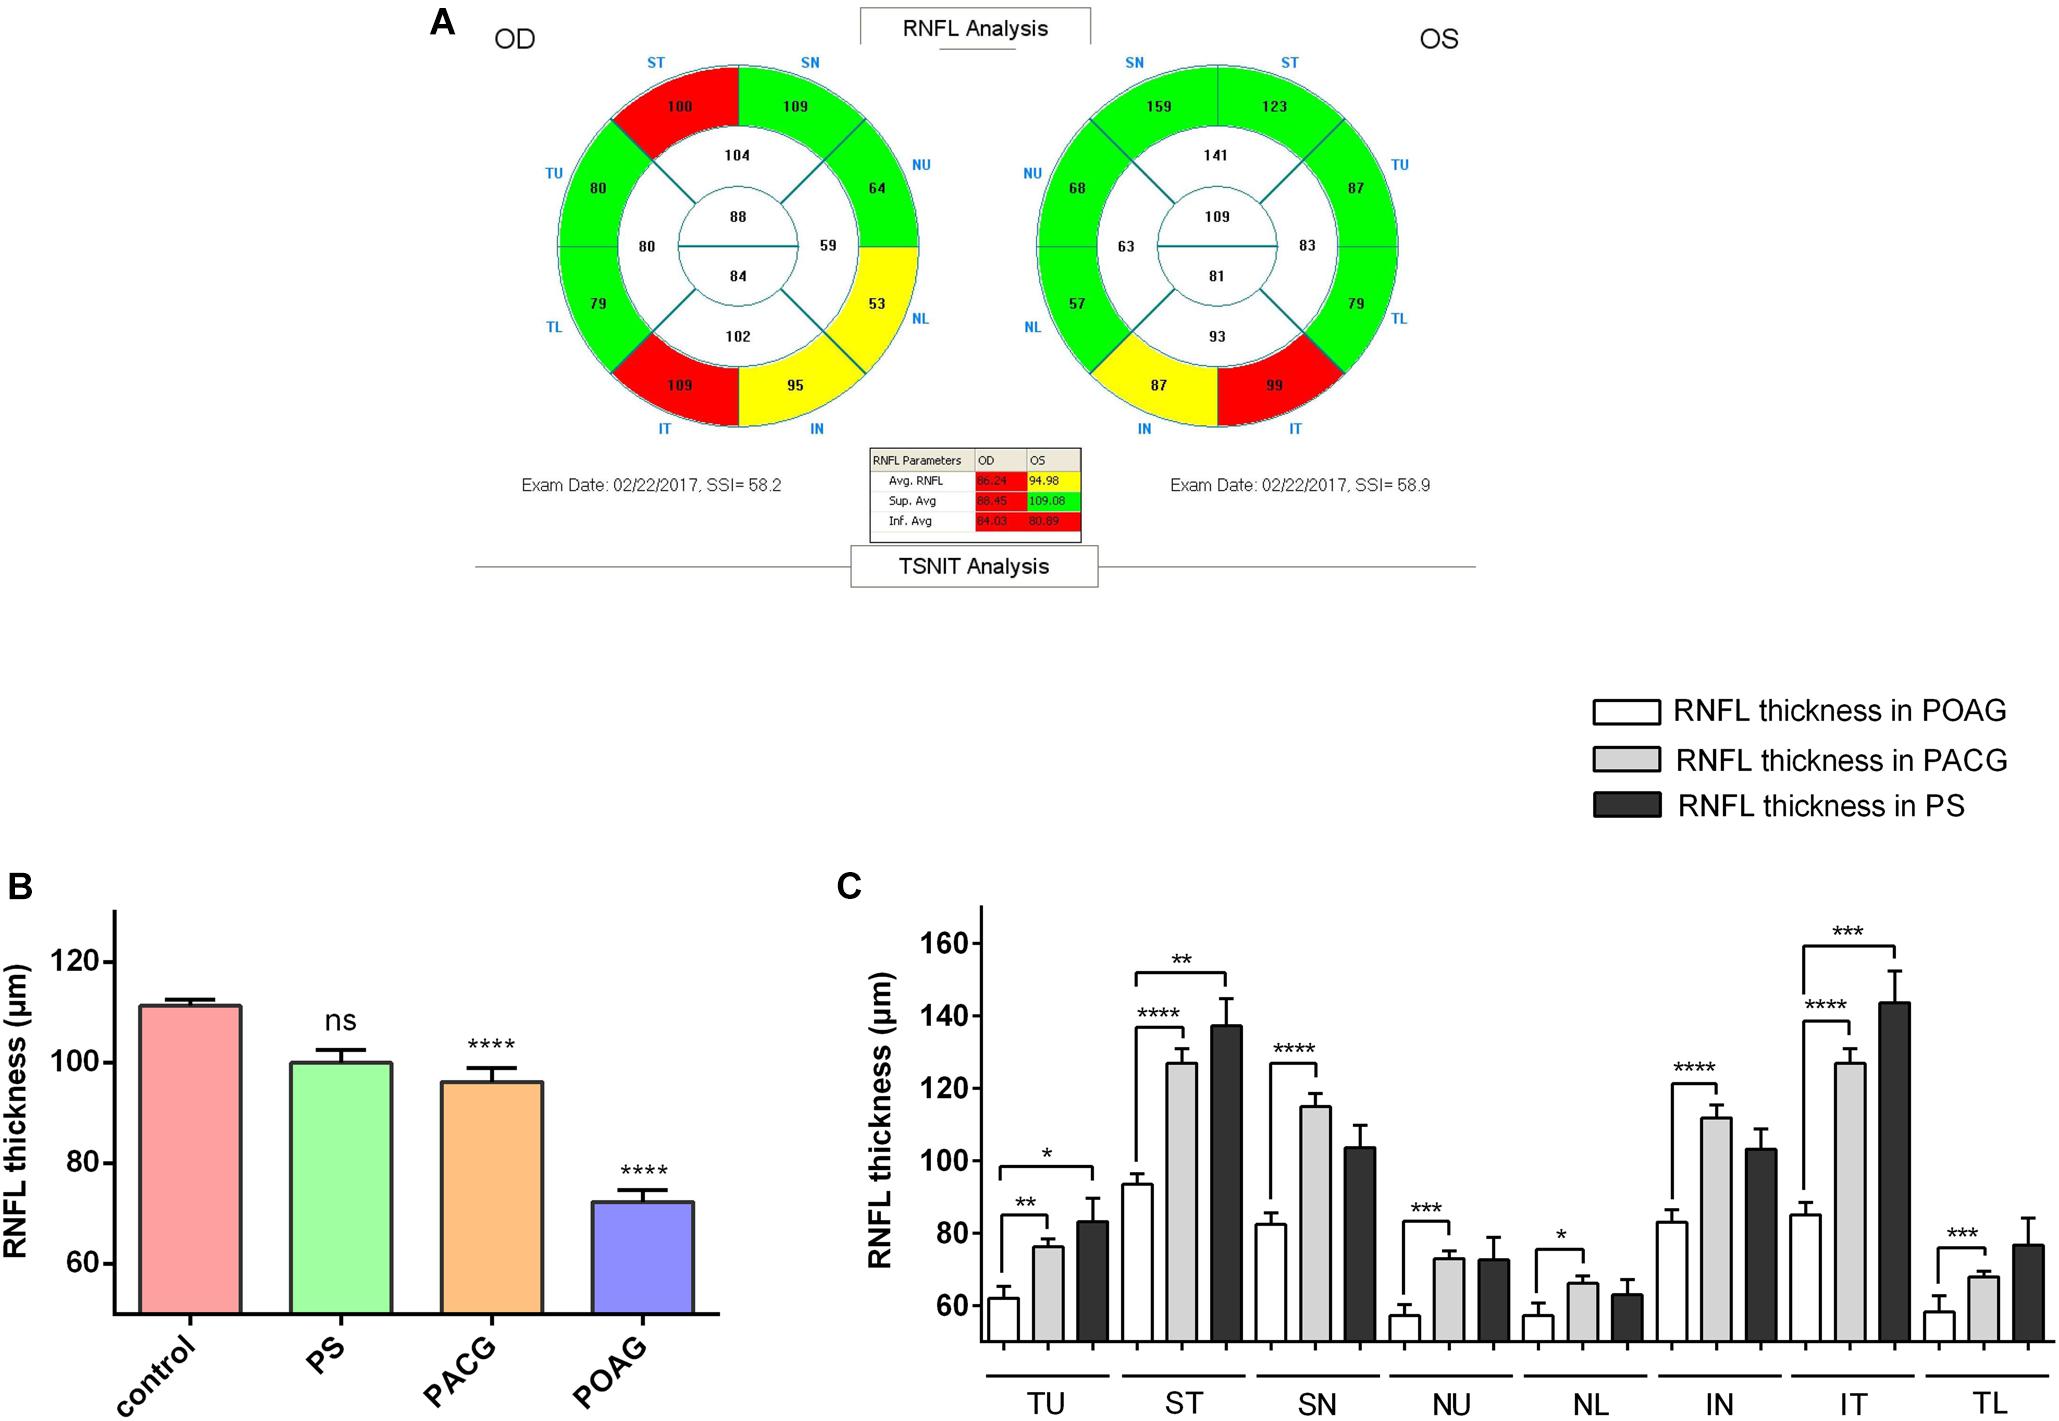
Figure 1. Retinal nerve fiber layer thickness in patients. (A) A typical image shown from the OCT scanning result. (B) RNFL thickness in control, PS, PACG, and POAG groups. ∗∗∗∗p < 0.0001 compared to nonaxonopathic control. Mean ± SEM are shown. (C) Comparison of the RNFL thickness of the eight quadrants between the glaucoma patients. ∗p < 0.05, ∗∗p < 0.01, ∗∗∗p < 0.001, ∗∗∗∗p < 0.0001 compared to each other groups. Mean ± SEM are shown.
VF Test
All VF tests were performed with a Humphrey 750i automatic field analyzer, with SITA FAST checking strategy. The field analyzer has screen of semispherical shape, with a VF testing distance of 330 mm, cursor of Goldmann III, cursor area of 0.43 mm2, background illumination of 31.50 asb, stimulus cursor intensity of 0.008–10,000 asb, and stimulus duration of 200 ms. Results with fixation losses and false-negative and false-positive results ≤ 33% were considered an effective outcome.
ONC
All animal studies were conducted according to protocols approved by the Institutional Animal Care and Use Committee of Wenzhou Medical University and were in accordance with the ARVO Statement for the Use of Animals in Vision Research. Male Fischer rats and C57BL/6 mice were purchased from Vital River Laboratories (Beijing, China) and were kept in standard cages and fed ad libitum. ONC surgery was carried out bilaterally on male 6- to 8-week-old rats (200–230 g) as described (Leon et al., 2000; Yin et al., 2006). The vascular integrity of the retina was evaluated by fundoscopic examination.
ELISA
The human blood samples were collected in a Vacutainer EDTA tube (BD, Franklin Lakes, NJ, United States). After centrifugation at 2,000 g for 10 min at 4°C, the supernatant was transferred and stored at –80°C until analysis. Rat cardiac blood was collected and refrigerated for 2 h, and centrifuged at 2,000 g for 10 min at 4°C, the serum was stored in a deep freezer. The protein levels were measured using DBN1 (DL-DBN1-Hu, Dldevelop, Wuxi, China; or KL-DBN1-Ra, Kanglang Biotech, Shanghai, China) according to the manufacturer’s instructions. The minimum detectable dose of DBN1 ELISA kit is 0.047 ng/mL. The standard is recombinant drebrin purified from transformed E. coli. The Tau ELISA kit was purchased from Qidibio (Wuhan, China).
Immunohistochemistry
All the paraffin tissue sections were dewaxed and rehydrated, and blocked with hydrogen peroxide (0.3% H2O2) for 30 min. Antigen retrieval was performed by heating the slides in sodium citrate buffer for 10 min. Immunohistochemistry analysis were performed using ABC reagent kit (Vector Laboratories, Burlingame, CA, United States). The slides were blocked with prediluted normal horse serum, followed by incubation with anti-drebrin (1:500 dilutions; Abcam, Cambridge, MA, United States) overnight at 4°C. After incubating with a secondary antibody of prediluted biotinylated horse anti-mouse Ig/rabbit Ig for 30 min and R.T.U ABC reagent for another 30 min at RT, DAB was used for color development, and then counterstained with hematoxylin. The stained sections were examined with an inverted microscope (DMi8, Leica, Wetzlar, Germany).
Statistical Analysis
Characteristics of patients are reported as numbers and percentages for categoric variables and as the mean ± SEM for continuous variables. Experimental data were analyzed using GraphPad Prism or SPSS software. Kruskal–Wallis test was used in age, highest IOP, RNFL thickness and plasma DBN1 and Tau. Chi-square with Bonferroni correction was used for gender comparisons. Logistic regression was used to evaluate the relationship between the DBN1 value and RNFL thickness, which was shown in a meta-analysis (Forest) plot. Statistical differences were analyzed by Student’s t-test or Tukey’s post hoc test after One-way ANOVA for multiple comparisons of mean values. p < 0.05 was considered statistically significant.
Results
Characteristics of Patients
General characteristics of glaucoma patients are displayed in Table 1. A total of 232 glaucoma patients and 50 nonaxonopathic controls were recruited for this study. Glaucoma patients as well as controls with preexisting ocular or systemic neurodegenerative diseases were excluded from this study. The mean age of the patients ranged from 44.05 to 64.30 years among the groups. IOP in the glaucoma groups was significantly higher than in the control group. OCT analysis observed that RNFL thickness in POAG and PACG was significantly thinner than in PS patients. The VF test revealed that the VF index (VFI), mean deviation (MD), and pattern standard deviation (PSD) in PS patients was close to normal, whereas a significant loss in PACG and POAG patients was indicated.
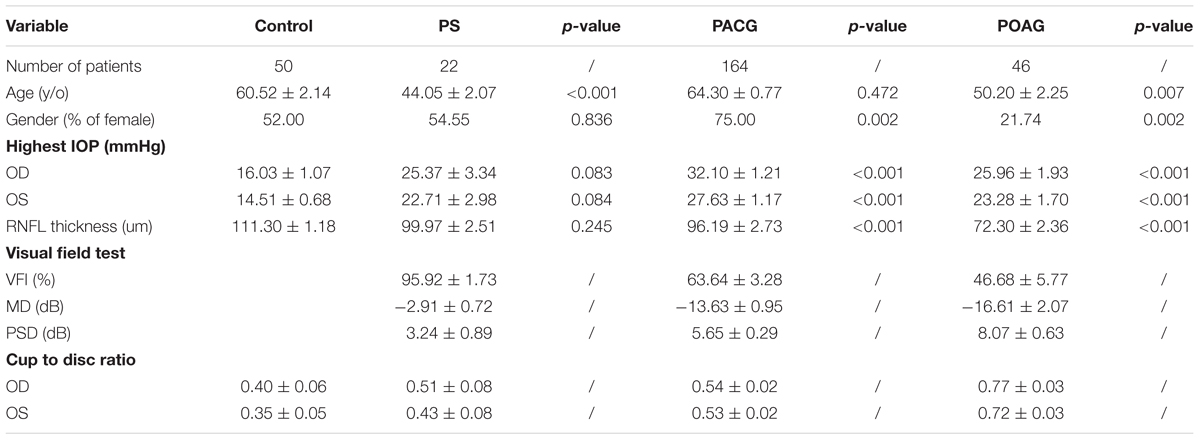
Table 1. General characteristics of patients.
Retinal nerve fiber layer thickness was shown in three colors: within normal was shown in green, borderline was shown in yellow, and outside normal was shown in red, as indicated in OCT reports (Figure 1A). As shown in Figure 1B, among our recruited patients, the RNFLD was severe in POAG and moderate in PACG while close to normal in PS patients. To analyze the characteristics of the RNFL thickness, we divided OCT images into 8 quadrants for analysis. As indicated in Figure 1C, the most significant difference was observed in the ST and IT quadrants in patients with primary glaucoma compared with PS patients.
Correlation Between DBN1 Levels and RNFL Thickness in Patients With Glaucoma
Interestingly, similar to the severity observed during the clinical observation, DBN1 plasma levels were the highest in POAG (1.370 ± 0.412 ng/mL) and increased significantly in PACG (0.721 ± 0.160 ng/mL) patients compared with controls (0.003 ± 0.002 ng/mL) as well as PS (0.003 ± 0.002 ng/mL) (Figure 2A). Meanwhile, for comparison, we also measured the plasma levels of tau protein in those patients (Figure 2B). The mean values of tau proteins increased significantly in all three groups of PACG (1.897 ± 0.155 ng/mL) and POAG (1.582 ± 0.230 ng/mL) as well as in PS (2.022 ± 0.306 ng/mL) patients compared with controls (0.221 ± 0.086 ng/mL). In contrast to DBN1, circulating tau levels increased in PS patients more significantly, and the levels in POAG and PACG were also inconsistent with RNFLD and VF defects.
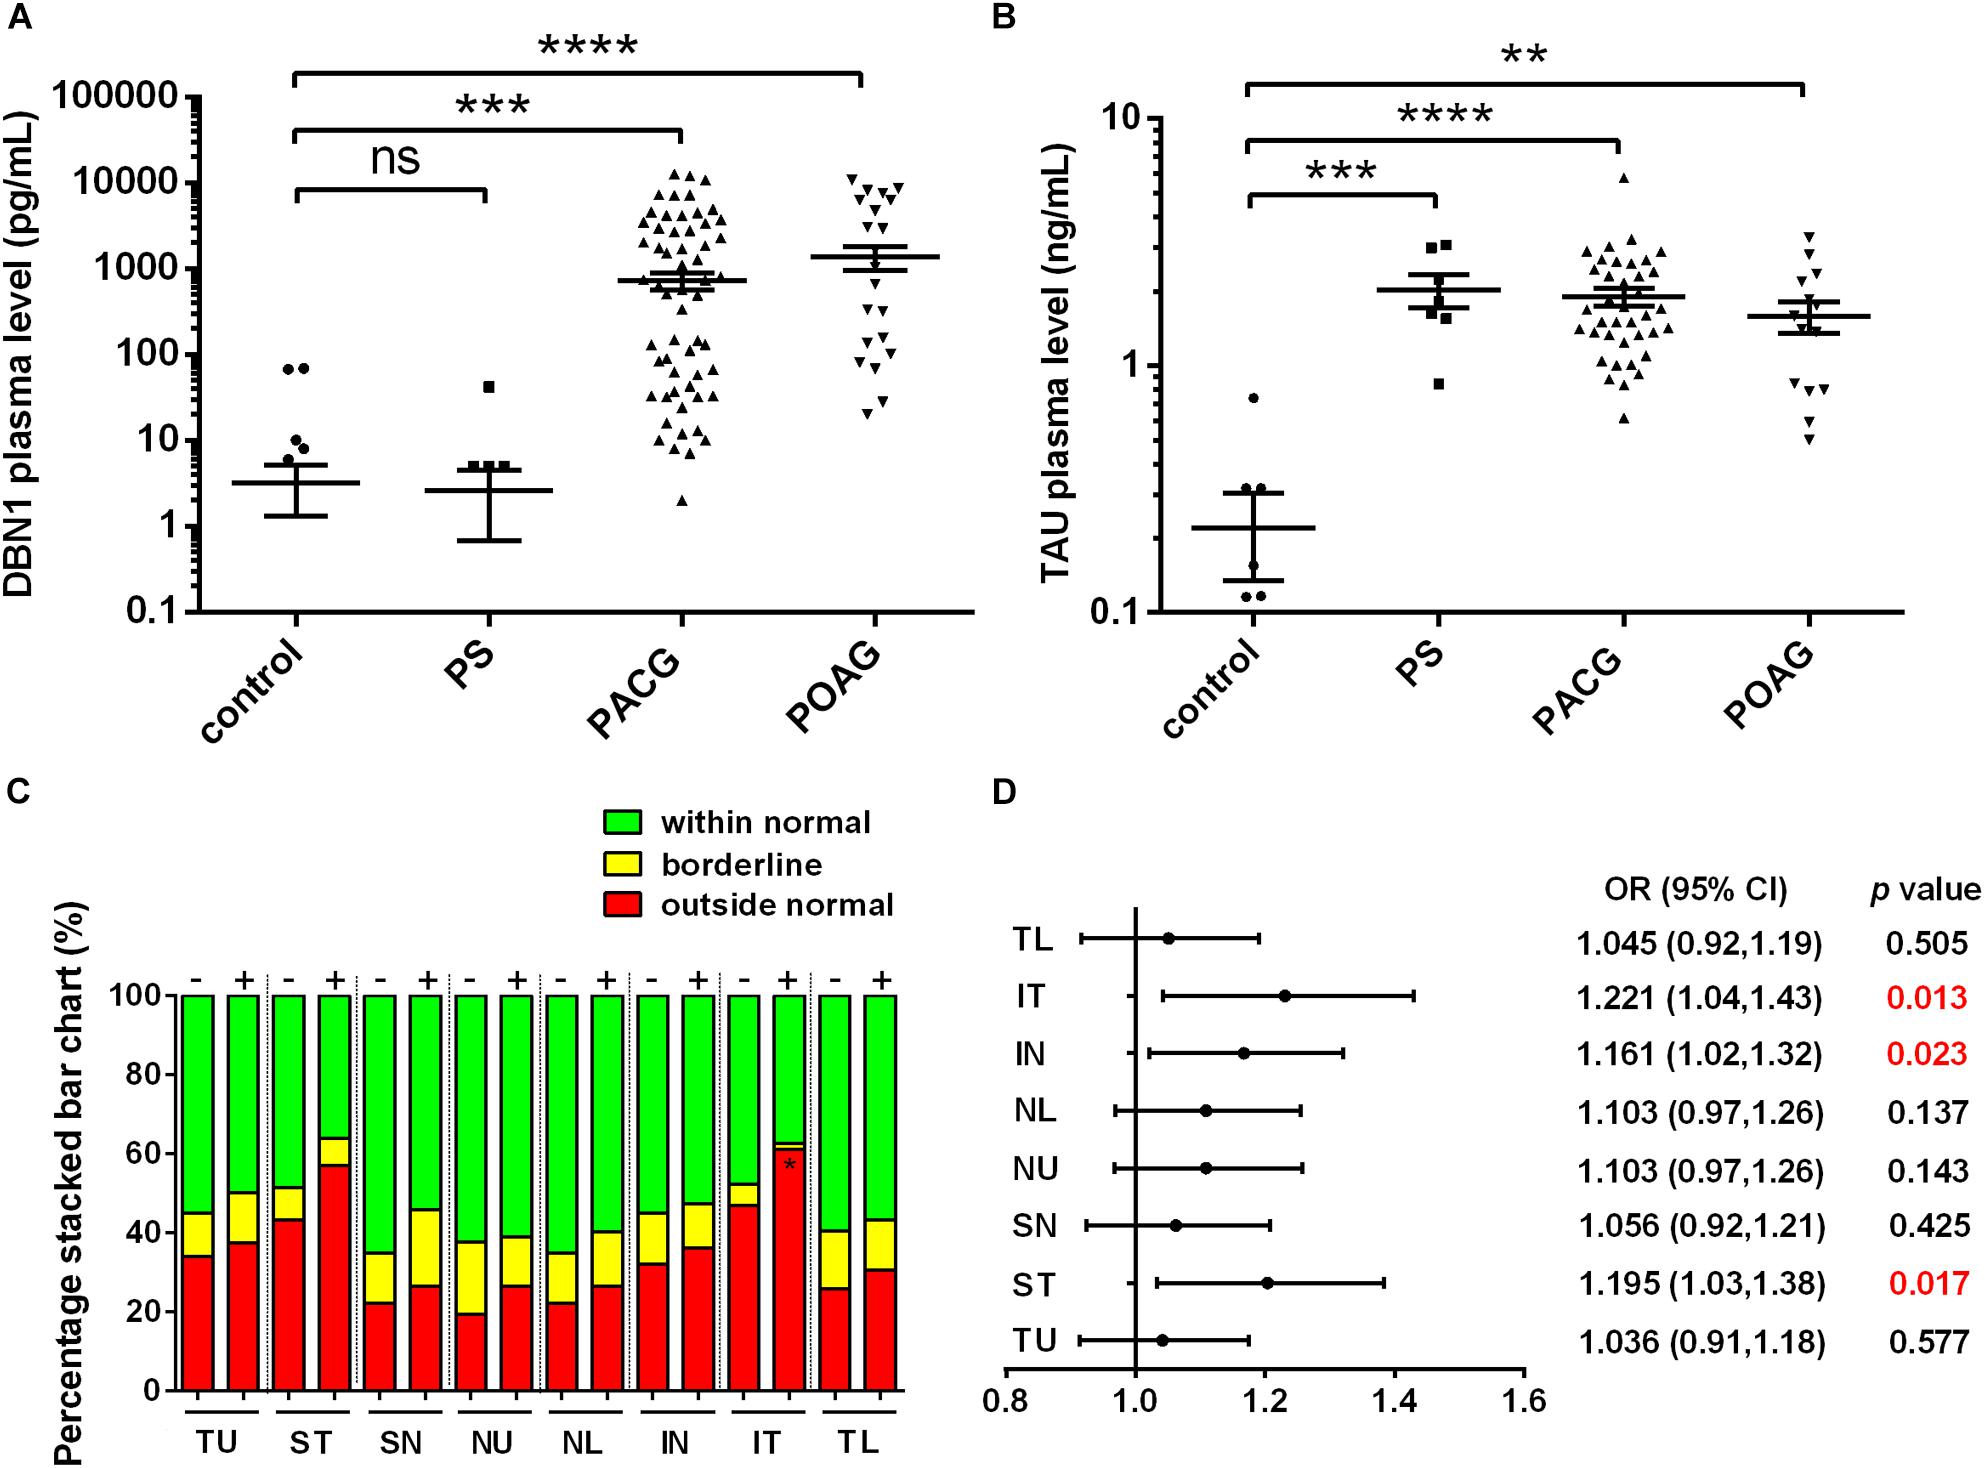
Figure 2. Developmentally regulated brain protein and tau plasma levels in glaucoma patients. (A) DBN1 plasma levels in control, PS, PACG, and POAG groups. ∗∗∗p < 0.001, ∗∗∗∗p < 0.0001 compared to nonaxonopathic control. Mean ± SEM are shown. (B) Tau plasma levels in control, PS, PACG, and POAG groups. ∗∗p < 0.01, ∗∗∗p < 0.001, ∗∗∗∗p < 0.0001 compared to nonaxonopathic control. Mean ± SEM are shown. (C) Percentage stacked bar chart shows severity of RNFLD of DBN1-negative (–) and –positive (+) patients. RNFLD in ST quadrant shows significant difference between DBN1-negative (–) and –positive (+) patients (∗p < 0.05). (D) Meta-analysis (forest) plot of logistic regression analysis shows DBN1 plasma levels and RNFL thickness as a dichotomized dependent variable in eight quadrants.
To further explore the relationship between DBN1 levels and the severity of glaucoma, we divided glaucoma patients into two groups of DBN1-negative and DBN1-positive patients. Based on the detection sensitivity of the kit, patients with DBN1 levels that were under the detectable threshold were regarded as negative. The percentage stacked bar chart showed a more obvious tendency in IT and ST quadrants such that the percentage of outside normal (red) in the DBN1-positive group was higher than in the DBN1-negative group (Figure 2C). To verify the relationship between DBN1 levels and RNFL thickness, we performed logistic regression analyses with RNFL thickness as a dichotomized variable in eight quadrants. Meta-analysis (Forest) plot (Figure 2D) showed a significant difference in the ST, IN, and IT quadrants (p < 0.05) with high odd ratio values and 95% confidence intervals.
Circulating DBN1 Levels Increased in ONC Model
To verify the expression of DBN1 proteins after RGC injury, we generated an ONC model, which is frequently used for optical neuropathy studies. Immunohistochemistry showed that DBN1 protein was expressed in whole retina and higher in the RGC layer and IPL, it increased from 3 to 7 days, while decreased at 14 days after ONC (Figure 3A). Similar to expression changes in the retina, DBN1 serum levels increased 3 to 7 days after ONC (p < 0.05) as the degeneration of RGCs progressed, and they decreased at 14 days (Figure 3B). These findings suggest that DBN1 protein is released in the circulating blood with neurodegeneration.
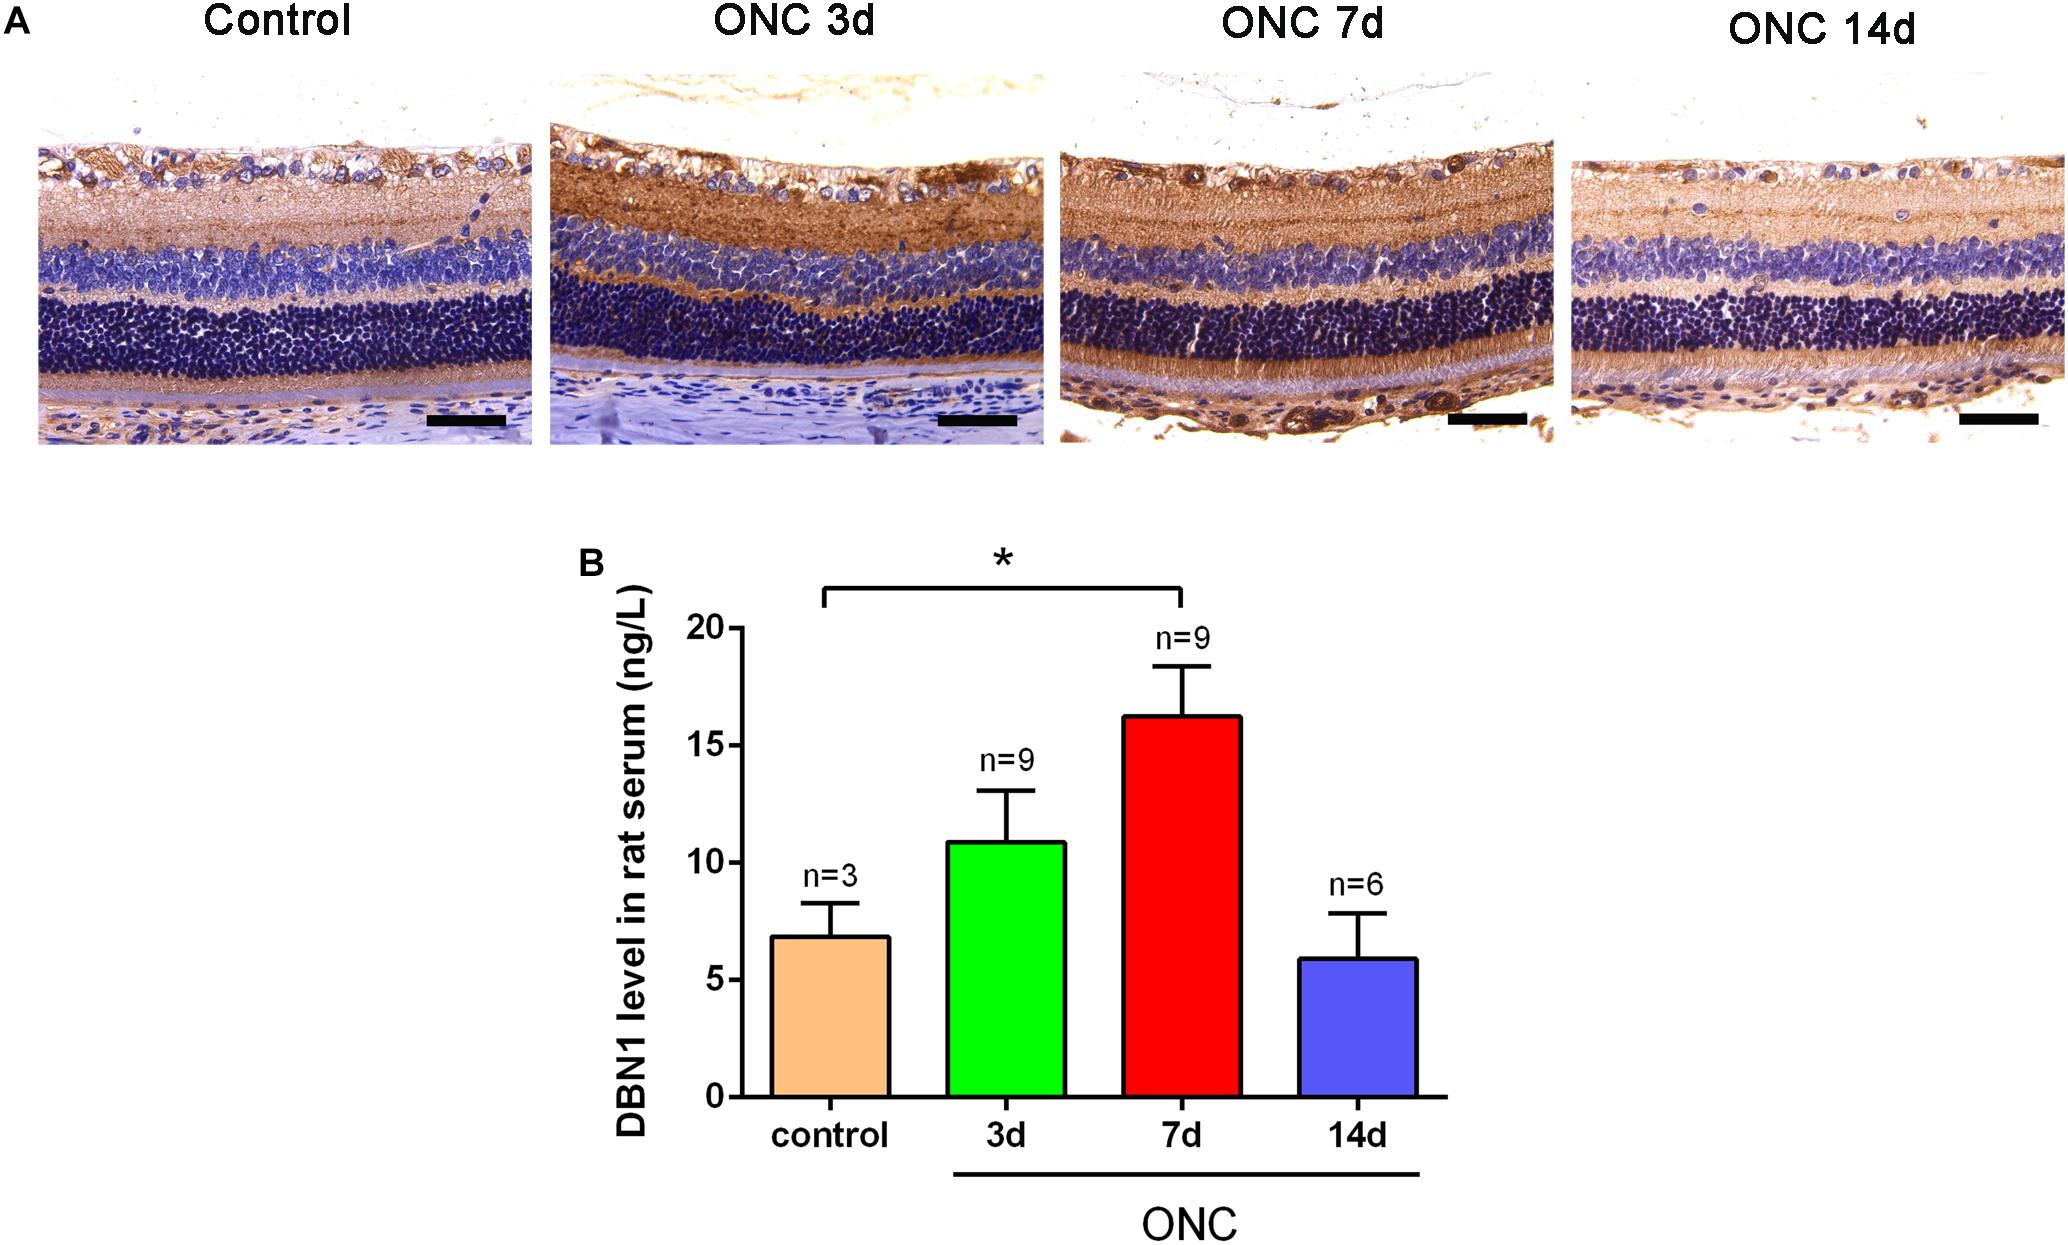
Figure 3. Expression changes of DBN1 proteins in the serum and retina of ONC models. (A) Immunohistochemistry of DBN1 in the retina of ONC model. Bars indicate 50 μm. (B) Serum DBN1 levels in ONC model. ∗p < 0.05 compared to control. Mean ± SEM are shown.
Discussion
Glaucoma represents a group of neurodegenerative diseases characterized by RGC degeneration (Almasieh et al., 2012; Weinreb et al., 2014; Choi et al., 2017). The biological basis of glaucoma is poorly understood, and the factors contributing to its progression have not been fully elucidated. Elevated IOP is considered to be the most important risk factor for glaucoma. One of the known mechanisms of axon degeneration is that nerve insults lead to impaired axonal transport from the cell body, which results in cytoskeletal breakdown, and this process depends on calcium influx and calpain-mediated degradation of DBN1 (Weinreb et al., 2014; Chimura et al., 2015; Choi et al., 2017). Axonal degeneration in glaucoma comprises secondary neurodegenerative events, such as glial activation, homeostatic dysfunction, and neuroinflammation (Tezel and the Fourth ARVO/Pfizer Ophthalmics Research Institute Conference Working Group, 2009; Tezel, 2011, 2013). To date, no biomarkers have been used for diagnosis or evaluation of axonal degeneration of glaucoma. Identification of molecular biomarkers is important to evaluate the severity of RGC axonopathy and may be useful for early diagnosis and prognosis of glaucoma.
Tau plays a pivotal role in axonal transport through regulation and stabilization of microtubule dynamics in neurons, and tauopathy has been extensively studied in the retina (Ho et al., 2012). Recent evidence indicates that altered CSF circulatory dynamics can reduce the clearance of both Aβ and tau, whereas decreased Aβ and increased tau levels in the CSF have been associated with the risk of rapid glaucoma progression (Yang et al., 2010). In this study, we observed that tau plasma levels increased significantly in glaucoma patients compared with nonaxonopathic controls (Figure 1). This is consistent with the observation that tau plasma levels in AD as well as in acute brain injury were significantly elevated compared with normal subjects (Zetterberg et al., 2013). However, the tau plasma level did not precisely reveal the severity of the RGC injury in PS patients, and those levels were also significantly increased in patients with mild RNFLD (Figure 2B).
Our preliminary study detected DBN1 in the plasma of POAG patients using proteome analysis. Subsequently, we recruited over two hundred of glaucoma patients and measured DBN1 plasma levels. In this study, we observed that DBN1 plasma levels increased significantly in glaucoma patients with RNFLD but not in patients without RNFLD or nonaxonopathic controls (Figure 1). To investigate the relationship between DBN1 plasma levels and RGC degeneration in glaucoma patients, we conducted OCT analysis and performed a correlation study. In general, the VF test is important in the evaluation of visual loss in glaucoma patients, but it is sometimes unreliable because of the opacity of refractive media and training differences among patients. Therefore, we used a more objective method based on morphologic, anatomic OCT images. Interestingly, DBN1 plasma levels were positively correlated with RNFLD, especially in IT and ST quadrants (Figure 2).
Drebrin A is specific to neurons and postsynaptic terminals in the adult brain (Harigaya et al., 1996) and highly accumulated within dendritic spines, and regulates actin dynamics (Mizui et al., 2014). DBN1 also plays a role in inhibiting Aβ generation or accelerating its degradation (Liu et al., 2017). It is has been reported that DBN1 mediate the scission of ectosomes from cilia tips (Nager et al., 2017). Neuronal DBN1 levels in the brain are reduced in patients with AD (Harigaya et al., 1996) and DS (Shim and Lubec, 2002), suggesting that DBN1 may serve as an important molecular indicator of brain pathophysiology (Chimura et al., 2015). Numerous laboratory studies as well as human clinical evidence have demonstrated that decreased DBN1 expression in the brain results in cognitive decline (Liu et al., 2015, 2017; Koganezawa et al., 2017; Shirao et al., 2017). Our study also demonstrated that DBN1 was expressed especially in the RGC layer and IPL of retina and its expression was increased at early stages and then finally decreased in ONC model (Figure 3A).
The embryonic-type (drebrin E) is expressed in the embryonic and early postnatal brain and is replaced by the adult-type (drebrin A) during development. Drebrin A is a minor isoform in the early embryonic brain, but the expression increases in parallel with synapse formation. In the adult brain, drebrin A is the major isoform and is highly concentrated in dendritic spines. Although drebrin E is the major isoform in the embryonic brain, some expression continues in the adult brain (Kajita et al., 2017). In this study, our recruited subjects all from adult patients. Although some of the drebrin E may still exist like as in SVZ of brain (Shirao et al., 2017) and may also express in the growing axons after RGC injury. On the other hand, neurons in the adult central nervous system regenerate poorly after damage, suggests that regeneration after RGC injury is limited (Dietmar and Marco, 2012; Norsworthy et al., 2017). Moreover, we cannot be sure that the released drebrin in the blood all from neurons, because that drebrin E is also expressed in non-neuronal cells. However, the drebrin levels are very low in control group as well as PS patients with slight damage in RGCs.
To clarify the correlation of circulating DBN1 levels and RGC degeneration, we subsequently performed an in vivo study. The ONC animal model is an experimental disease model for optic neuropathy, which can lead to axonal degeneration, followed by a gradual death of RGCs (Tang et al., 2011). In this study, we observed that DBN1 serum levels increased significantly in ONC rats at days 3 to 7 and then decreased at day 14 after injury (Figure 3B). This result allows us to speculate that circulating DBN1 levels may depend on the severity of RGC degeneration and timing after injury. Thus, our data reveal that DBN1 plasma levels increased with axonopathy of glaucoma patients and then decreased with the progress of axonal degeneration. However, there are also some restrictions, such as correlation with the VF test and follow-up study. Interestingly, previous study have reported that the cytoskeletal proteins, such as tau, neurofilament, calpain-mediated spectrin breakdown product, β-tubulin, and Aβ were changed expressions not only in retina and optic nerve but also throughout the entire retinal projection (primary projection target in mouse, the superior colliculus) in glaucoma mouse model (Wilson et al., 2016). This result gives us some idea of the DBN1 sources in glaucoma patients with neurodegeneration.
In summary, we reported a novel finding that DBN1 plasma levels increased in glaucoma patients. Moreover, DBN1 plasma levels correlated with RNFLD in glaucoma patients and may reflect the severity of RGC injury. DBN1 plasma levels may relate to the timing after injury and RGC damage progression. In conclusion, combining the measurement of circulating DBN1 and tau levels may be a useful indicator for the diagnosis or evaluation of the severity of axonopathy in neurodegenerative diseases.
Data Availability
All datasets generated for this study are included in the manuscript and/or the supplementary files.
Ethics Statement
The study was performed according to the tenets of the World Medical Association’s Declaration of Helsinki and was approved by the Clinical Research Ethics Committee at the Eye Hospital of Wenzhou Medical University. All animal studies were conducted according to protocols approved by the Institutional Animal Care and Use Committee of Wenzhou Medical University and were in accordance with the ARVO Statement for the Use of Animals in Vision Research.
Author Contributions
Z-LC and Y-JG designed the experiments. A-WF, X-HG, R-ZC, B-JL, F-MY, J-TG, C-LL, YC, and YR recruited the patients and collected the blood samples. Y-JG, CL, X-DD, TL, Z-BJ, and TI carried out experiments and acquired and analyzed the data. Z-LC, FL, and JQ designed the study. Z-LC and Y-JG drafted the manuscript.
Funding
This research was supported by the National Natural Science Foundation of China (81770918), Zhejiang Provincial Natural Science Foundation of China (LY16H120006), and the departmental funds from Wenzhou Medical University (89214018).
Conflict of Interest Statement
The authors declare that the research was conducted in the absence of any commercial or financial relationships that could be construed as a potential conflict of interest.
Abbreviations
Aβ, amyloid beta; AD, Alzheimer’s disease; ANOVA, analysis of variance; CSF, cerebrospinal fluid; DAPI, 4’, 6-diamidino-2-phenylindole; Drebrin or DBN1, developmentally regulated brain protein; DS, Down syndrome; ELISA, enzyme-linked immunosorbent assay; HP, high pressure; IN, inferior nasal; IOP, intraocular pressure; IPL, inner plexiform layer; IT, inferior temporal; Neuro-2a, neuroblastoma cells; NL, nasal lower; NU, nasal upper; OCT, optical coherence tomography; ONC, optic nerve crush; ONH, optic nerve head; PACG, primary angle-closure glaucoma; PBS, phosphate-buffered saline; PFA, paraformaldehyde; POAG, primary open-angle glaucoma; RGCs, retinal ganglion cells; RNFL, retinal nerve fiber layer; RT, room temperature; SDS-PAGE, sodium dodecyl sulfate-polyacrylamide gel electrophoresis; SEM, standard error of mean; SN, superior nasal; ST, superior temporal; TBST, Tris buffer saline containing 0.1% Tween-20; TL, temporal lower; TU, temporal upper; VF, visual field.
References
Almasieh, M., Wilson, A. M., Morquette, B., Vargas, J. L. C., and Polo, A. D. (2012). The molecular basis of retinal ganglion cell death in glaucoma. Prog. Retin. Eye Res. 31, 152–181. doi: 10.1016/j.preteyeres.2011.11.002
Chen, C. L., Bojikian, K. D., Wen, J. C., Zhang, Q. Q., Xin, C., Mudumbai, R. C., et al. (2017). Peripapillary retinal nerve fiber layer vascular microcirculation in eyes with glaucoma and single-hemifield visual field loss. JAMA Ophthalmol. 135, 461–468. doi: 10.1001/jamaophthalmol.2017.0261
Chiasseu, M., Vargas, J. L. C., Destroismaisons, L., Velde, C. V., and Leclerc, N. (2016). Tau accumulation, altered phosphorylation, and missorting promote neurodegeneration in glaucoma. J. Neurosci. 36, 5785–5798. doi: 10.1523/JNEUROSCI.3986-15.2016
Chimura, T., Launey, T., and Yoshida, N. (2015). Calpain-mediated degradation of drebrin by excitotoxicity in vitro and in vivo. PLoS One 10:e0125119. doi: 10.1371/journal.pone.0125119
Choi, J. A., Shin, H. Y., Park, H. Y. L., and Park, C. K. (2017). The pattern of retinal nerve fiber layer and macular ganglion cell-inner plexiform layer thickness changes in glaucoma. J. Ophthalmol. 2017:6078365. doi: 10.1155/2017/6078365
Dietmar, F., and Marco, L. (2012). Promoting optic nerve regeneration. Prog. Retin. Eye Res. 31, 688–701. doi: 10.1016/j.preteyeres.2012.06.005
Harigaya, Y., Shoji, M., Shirao, T., and Hirai, S. (1996). Disappearance of actin-binding protein, drebrin, from hippocampal synapses in Alzheimer’s disease. J. Neurosci. Res. 43, 87–92. doi: 10.1002/jnr.490430111
Hayashi, K., Ishikawa, R., Ye, L. H., He, X. L., Takata, K., Kohama, K., et al. (1996). Modulatory role of drebrin on the cytoskeleton within dendritic spines in the rat cerebral cortex. J. Neurosci. 16, 7161–7170. doi: 10.1523/JNEUROSCI.16-22-07161.1996
Ho, W. L., Leung, Y., Tsang, A. W. T., So, K. F., Chiu, K., and Chang, R. C. C. (2012). Review: tauopathy in the retina and optic nerve: does it shadow pathological changes in the brain? Mol. Vis. 18, 2700–2710.
Ishikawa, R., Hayashi, K., Shirao, T., Xue, Y., Takagi, T., Sasaki, Y., et al. (1994). Drebrin, a development-associated brain protein from rat embryo, causes the dissociation of tropomyosin from actin filaments. J. Biol. Chem. 269, 29928–29933.
Jack, C. R., Knopman, D. S., Jagust, W. J., Shaw, L. M., Aisen, P. S., Weiner, M. W., et al. (2010). Hypothetical model of dynamic biomarkers of the Alzheimer’s pathological cascade. Lancet Neurol. 9, 119–128. doi: 10.1016/S1474-4422(09)70299-6
Javaid, F. Z., Brenton, J., Guo, L., and Cordeiro, M. F. (2016). Visual and ocular manifestations of Alzheimer’s disease and their use as biomarkers for diagnosis and progression. Front. Neurol. 7:55. doi: 10.3389/fneur.2016.00055
Kajita, Y., Kojima, N., Koganezawa, N., Yamazaki, H., Sakimura, K., and Shirao, T. (2017). Drebrin E regulates neuroblast proliferation and chain migration in the adult brain. Eur. J. Neurosci. 46, 2214–2228. doi: 10.1111/ejn.13668
Koganezawa, N., Hanamura, K., Sekino, Y., and Shirao, T. (2017). The role of drebrin in dendritic spines. Mol. Cell. Neurosci. 84, 85–92. doi: 10.1016/j.mcn.2017.01.004
Leon, S., Yin, Y. Q., Nguyen, J., Irwin, N., and Benowitz, L. I. (2000). Lens injury stimulates axon regeneration in the mature rat optic nerve. J. Neurosci. 20, 4615–4626. doi: 10.1523/JNEUROSCI.20-12-04615.2000
Liu, D. S., Pan, X. D., Zhang, J., Shen, H., Collins, N. C., Cole, A. M., et al. (2015). APOE4 enhances age-dependent decline in cognitive function by down-regulating an NMDA receptor pathway in EFAD-Tg mice. Mol. Neurodegener. 10:7. doi: 10.1186/s13024-015-0002-2
Liu, Y., Xu, Y. F., Zhang, L., Huang, L., Yu, P., Zhu, H., et al. (2017). Effective expression of Drebrin in hippocampus improves cognitive function and alleviates lesions of Alzheimer’s disease in APP (swe)/PS1 (ΔE9) mice. CNS Neurosci. Ther. 23, 590–604. doi: 10.1111/cns.12706
Luna, E. J., Pestonjamasp, K. N., Cheney, R. E., Strassel, C. P., Lu, T. H., and Chia, C. P. (1997). Actin-binding membrane proteins identified by F-actin blot overlays. Soc. Gen. Physiol. Ser. 52, 3–18.
Mantravadi, A. V., and Vadhar, N. (2015). Glaucoma. Prim. Care 42, 437–449. doi: 10.1016/j.pop.2015.05.008
Mizui, T., Sekino, Y., Yamazaki, H., Ishizuka, Y., Takahashi, H., Kojima, N., et al. (2014). Myosin II ATPase activity mediates the long-term potentiation-induced exodus of stable F-actin bound by Drebrin A from dendritic spines. PLoS One 9:85367. doi: 10.1371/journal.pone.0085367
Nager, A. R., Goldstein, J. S., Herranz-Pérez, V., Portran, D., Ye, F., Garcia-Verdugo, J. M., et al. (2017). An actin network dispatches ciliary GPCRs into extracellular vesicles to modulate signaling. Cell 168, 252–263. doi: 10.1016/j.cell.2016.11.036
Nickells, R. W., Howell, G. R., Soto, I., and John, S. W. M. (2012). Under pressure: cellular and molecular responses during glaucoma, a common neurodegeneration with axonopathy. Annu. Rev. Neurosci. 35, 153–179. doi: 10.1146/annurev.neuro.051508.135728
Norsworthy, M. W., Bei, F., Kawaguchi, R., Wang, Q., Tran, N. M., Li, Y., et al. (2017). Sox11 expression promotes regeneration of some retinal ganglion cell types but kills others. Neuron 94, 1112.e4–1120.e4. doi: 10.1016/j.neuron.2017.05.035
Nucci, C., Martucci, A., Martorana, A., Sancesario, G. M., and Cerulli, L. (2010). Glaucoma progression associated with altered cerebral spinal fluid levels of amyloid beta and tau proteins. Clin. Exp. Ophthalmol. 39, 279–281. doi: 10.1111/j.1442-9071.2010.02452.x
Peitsch, W. K., Grund, C., Kuhn, C., Schnölzer, M., Spring, H., and Schmelz, M. (1999). Drebrin is a widespread actin-associating protein enriched at junctional plaques, defining a specific microfilament anchorage system in polar epithelial cells. Eur. J. Cell Biol. 78, 767–778. doi: 10.1016/S0171-9335(99)80027-2
Perrin, R. J., Fagan, A. M., and Holtzman, D. M. (2009). Multimodal techniques for diagnosis and prognosis of Alzheimer’s disease. Nature 461, 916–922. doi: 10.1038/nature08538
Sekino, Y., Kojima, N., and Shirao, T. (2007). Role of actin cytoskeleton in dendritic spine morphogenesis. Neurochem. Int. 51, 92–104. doi: 10.1016/j.neuint.2007.04.029
Shim, K. S., and Lubec, G. (2002). Drebrin, a dendritic spine protein, is manifold decreased in brains of patients with Alzheimer’s disease and Down syndrome. Neurosci. Lett. 324, 209–212. doi: 10.1016/S0304-3940(02)00210-0
Shirao, T., Hanamura, K., Koganezawa, N., Ishizuka, Y., Yamazaki, H., and Sekino, Y. (2017). The role of drebrin in neurons. J. Neurochem. 141, 819–834. doi: 10.1111/jnc.13988
Shirao, T., and Obata, K. (1986). Immunochemical homology of 3 developmentally regulated brain proteins and their developmental change in neuronal distribution. Dev. Brain Res. 29, 233–244. doi: 10.1016/0165-3806(86)90099-4
Shirao, T., and Sekino, Y. (2017). General introduction to drebrin. Adv. Exp. Med. Biol. 1006, 3–22. doi: 10.1007/978-4-431-56550-5_1
Takahashi, H., and Naito, Y. (2017). Drebrin and spine formation. Adv. Exp. Med. Biol. 1006, 157–181. doi: 10.1007/978-4-431-56550-5_10
Takahashi, H., Yamazaki, H., Hanamura, K., Sekino, Y., and Shirao, T. (2009). Activity of the AMPA receptor regulates drebrin stabilization in dendritic spine morphogenesis. J. Cell Sci. 122, 1211–1219. doi: 10.1242/jcs.043729
Tang, Z. S., Zhang, S. H., Lee, C., Kumar, A., Arjunan, P., Li, Y., et al. (2011). An optic nerve crush injury murine model to study retinal ganglion cell survival. J. Vis. Exp. 50:2685. doi: 10.3791/2685
Tezel, G. (2011). The immune response in glaucoma: a perspective on the roles of oxidative stress. Exp. Eye Res. 93, 178–186. doi: 10.1016/j.exer.2010.07.009
Tezel, G. (2013). Immune regulation toward immunomodulation for neuroprotection in glaucoma. Curr. Opin. Pharmacol. 13, 23–31. doi: 10.1016/j.coph.2012.09.013
Tezel, G., and the Fourth ARVO/Pfizer Ophthalmics Research Institute Conference Working Group (2009). The role of glia, mitochondria, and the immune system in glaucoma. Invest. Ophthalmol. Vis. Sci. 50, 1001–1012. doi: 10.1167/iovs.08-2717
Venkataraman, S. T., Flanagan, J. G., and Hudson, C. (2010). Vascular reactivity of optic nerve head and retinal blood vessels in glaucoma-a review. Microcirculation 17, 568–581. doi: 10.1111/j.1549-8719
Weinreb, R. N., Aung, T., and Medeiros, F. A. (2014). The pathophysiology and treatment of glaucoma: a review. JAMA 311, 1901–1911. doi: 10.1001/jama.2014.3192
Wilson, G. N., Smith, M. A., Inman, D. M., Dengler-Crish, C. M., and Crish, S. D. (2016). Early cytoskeletal protein modifications precede overt structural degeneration in the DBA/2J mouse model of glaucoma. Front. Neurosci. 10:494. doi: 10.3389/fnins.2016.00494
Yang, Y., Yu, M., Zhu, J., Chen, X. M., and Liu, X. Y. (2010). Role of cerebrospinal fluid in glaucoma: pressure and beyond. Med. Hypotheses 74, 31–34. doi: 10.1016/j.mehy.2009.08.024
Yin, Y. Q., Henzl, M. T., Lorber, B., Nakazava, T., Thomas, T. T., Jiang, F., et al. (2006). Oncomodulin is a macrophage-derived signal for axon regeneration in retinal ganglion cells. Nat. Neurosci. 9, 843–852. doi: 10.1038/nn1701
Keywords: DBN1, glaucoma, axonal degeneration, RGCs, RNFLD
Citation: Gan Y-J, Fang A-W, Liu C, Liu B-J, Yang F-M, Guan J-T, Lan C-L, Dai X-D, Li T, Cao Y, Ran Y, Gong X-H, Jin Z-B, Cui R-Z, Iwata T, Qu J, Lu F and Chi Z-L (2019) Elevated Plasma Levels of Drebrin in Glaucoma Patients With Neurodegeneration. Front. Neurosci. 13:326. doi: 10.3389/fnins.2019.00326
Received: 07 January 2019; Accepted: 21 March 2019;
Published: 03 April 2019.
Edited by:
Olivia Belbin, Sant Pau Biomedical Research Institute, SpainCopyright © 2019 Gan, Fang, Liu, Liu, Yang, Guan, Lan, Dai, Li, Cao, Ran, Gong, Jin, Cui, Iwata, Qu, Lu and Chi. This is an open-access article distributed under the terms of the Creative Commons Attribution License (CC BY). The use, distribution or reproduction in other forums is permitted, provided the original author(s) and the copyright owner(s) are credited and that the original publication in this journal is cited, in accordance with accepted academic practice. No use, distribution or reproduction is permitted which does not comply with these terms.
*Correspondence: Jia Qu, amlhLnF1QGV5ZS5hYy5jbg== Fan Lu, bHVmYW5AZXllLmFjLmNu Zai-Long Chi, emFpbG9uZy5jaGlAZXllLmFjLmNu