 Jianqiang Lin
 Supratik Guha1,2
 Shriram Ramanathan
95% of researchers rate our articles as excellent or good
Learn more about the work of our research integrity team to safeguard the quality of each article we publish.
Find out more
ORIGINAL RESEARCH article
Front. Neurosci. , 30 November 2018
Sec. Neuromorphic Engineering
Volume 12 - 2018 | https://doi.org/10.3389/fnins.2018.00856
Information in the central nervous system (CNS) is conducted via electrical signals known as action potentials and is encoded in time. Several neurological disorders including depression, Attention Deficit Hyperactivity Disorder (ADHD), originate in faulty brain signaling frequencies. Here, we present a Hodgkin-Huxley model analog for a strongly correlated VO2 artificial neuron system that undergoes an electrically-driven insulator-metal transition. We demonstrate that tuning of the insulating phase resistance in VO2 threshold switch circuits can enable direct mimicry of neuronal origins of disorders in the CNS. The results introduce use of circuits based on quantum materials as complementary to model animal studies for neuroscience, especially when precise measurements of local electrical properties or competing parallel paths for conduction in complex neural circuits can be a challenge to identify onset of breakdown or diagnose early symptoms of disease.
Action potentials (AP) are generated in neurons and propagated to other neurons via synapses (Hodgkin and Huxley, 1952; Kandel, 2012). The frequency of the spikes carries information and is critical for brain function. How frequently neurons spike for a given stimulus and whether or not they are able to travel without losing signal strength dictate normal vs. abnormal brain function (Salinas and Sejnowski, 2001; Bartzokis, 2005; Wulff et al., 2009). Alteration in neural oscillations caused by abnormal excitation of action potential has been found to play an important role in a number of neurological disorders. Many research works on molecular neurophysiology have suggested the correlation of pathologically altered action potential excitability. Various neurological diseases are briefly summarized as follows.
Wu. et al. reported that the dysfunctional calcium channel in mutant mouse model is associated with the hypokalemic periodic paralysis which is a form of paroxysmal weakness that occurs in motor neuron disease (Wu, 2012). Research has shown that the Alzheimer's disease can occur due to disruption of neuronal excitability. As examples, Chakroborty et al. showed that increase of frequency and amplitude of AP due to certain protein channel dysregulation results in excitability impairment, with which the Triple Tg expression model is developed (Chakroborty et al., 2009; Santos et al., 2010). Drug addiction is also strongly related to abnormal excitation of action potential. Kourrich et al. revealed the relationship between drug addiction and brain activity. They found that neurons subjected to certain dose of Cocaine will fire about 30% faster at high input current, and 200% faster at low input current (Kourrich et al., 2015). Global Burden of Disease Study revealed that major depression was the second largest cause of disability (estimated by the loss of productivity from the disease) and it affected approximately 300 million people worldwide in 2010 (Vos et al., 2012). Friedman et al. showed that the midbrain dopamine neurons have played important in certain depressions. When the dopamine neuron (in mice) fire rate increases by 50% (from 1.6 to 2.4 Hz), the social interaction (measured by a special experiment, see reference) dropped by about 60% (Friedman et al., 2014). Bipolar disorder, also known as manic depression, has been studied in monkeys and it is found that the mental disorder is related to the prefrontal cortical neurons firing and signaling at the molecular level (Birnbaum et al., 2004). Another example in the context of understanding and curing neurological syndromes is the research on neuropathic pain. Researchers sought for treatment for pain by treatments to tune the neuron oscillation frequency (Campbell and Meyer, 2006). These studies and references contained in them strongly indicate the crucial role of controlling the spiking frequencies and action potential generation in order-disorder transitions in biological neural circuits. Besides these examples, other neurological disorders that are resulted from pathologically-altered brain signaling frequencies also include neuromuscular diseases (Younger, 1999; Hutchison et al., 2004; Nelson and Valakh, 2015), ADHD (Brennan and Arnsten, 2008) and etc.
Understanding their origins and the mechanisms to minimize damage to neural pathways is a principal area of study in neuroscience. However, diagnosis of neurological disorder at the molecular level is challenging (Brown et al., 2004). One widely adopted method for neurophysiological measurements is the multiple-electrode recording of the electrical signal of AP spikes in brain tissue (Brown et al., 2004). To-date, neural recording experiments usually involve invasive probing (Kinney et al., 2015) and the in vivo measurements are mostly carried out on small animals such as mice (Schulz et al., 2014; Barry, 2015). Artificial circuits that mimic desired signal propagation characteristics along neurons and can provide parametric information on normal-abnormal signaling transitions from electrical properties of circuit components could be valuable in evaluating or directing animal studies. Here, we propose understanding electrical behavior of neurons and neurological disorders via synthetic circuits comprised of a strongly correlated oxide VO2 that undergoes an electrically-driven insulator-metal transition (IMT).
Oxides have been studied for electronic devices such as resonant tunneling diodes, single-electron transistors, and steep slope switches (Mannhart and Schlom, 2010; Vitale et al., 2015). Among these emerging oxide-based electronic device concepts, phase changing artificial neurons has primarily focused on applications in neuromorphic computing to mimic the leaky-integrate-fire function (Pickett et al., 2013; Lin et al., 2016; Mehonic and Kenyon, 2016; Tuma et al., 2016; Dutta et al., 2017). Here, we present a Hodgkin-Huxley (HH) model analog for the intrinsic properties of a solid-state material, VO2. The strongly correlated VO2 artificial neuron system can undergo an electrically driven IMT akin to the excitable membrane in the biological neuron. Changes in composition of the material synergistically modifies the ground state resistivity, IMT strength defined as resistance ratio in the two phases as well as the threshold voltage required for initiating a phase change. Such material property is designed to capture the Intrinsic Membrane Excitability (IME) in biological neurons, which refers to a neuron's propensity for generating action potential at a given input. Building on this fundamental concept, we demonstrate neuronal function mimicking a vast range of neuron types found in animal brains and simulate an archetypal monosynaptic circuit (e.g., the knee-jerk reaction). Long term, our results may help in creating artificial systems to generate knowledge about thresholds for onset for brain disorders due to neuronal malfunction.
VO2 thin films of 200 nm thickness were deposited on SiO2/Si by reactive sputtering at 775 K. The stoichiometry and IMT transition strength in VO2 is controlled by the oxygen partial pressure in the sputtering chamber. The IMT occurs at a critical temperature Tc. IMT transition strength (Rins/Rmet) is defined by the ratio of high resistance state (Rins, measured at room temperature) and low resistance state (Rmet, measured at above critical transition temperature). In VO2, Tc is 67°C. The low resistance state is taken at 120°C that is significantly higher than Tc. Our film growth experiments have shown controllable thermal IMT strength variation from Rins/Rmet >105 to Rins/Rmet = 1 (complete loss of IMT characteristic) (Ha et al., 2013; Zhou and Ramanathan, 2015; Lin et al., 2016). Rins and Rmet are respectively, the resistivity for the insulating state and metallic state, and is characterized by temperature-dependent Hall measurement. The IMT strength can be controlled by substrate temperature during film deposition, oxygen partial pressure during growth, and the choice of substrates (Savo et al., 2015). In this study, we used a VO2 thin film with IMT strength of 2 × 10⁵ (Lin et al., 2017).
After VO2 thin film growth, we fabricated lateral device for artificial neuron circuit testing. Electron-beam lithography (EBL) was used to define the length of the VO2 device, L. As shown in Figure 1A, L is along the channel direction. Devices of L = 200 nm were used for this study. Ti/Au of thickness 5/100 nm were evaporated and lifted off to form electrical contacts to the VO2. A “neck-down” design for the contact were used as illustrated in Figure 1B. The neck-down device drives only a small volume of the VO2 into transition and reduces the voltage required to trigger the transition (Lin et al., 2017). In our experiment, the variation in material property is limited. In addition, the degradation of VO2 under the experimental condition is largely un-controllable. Therefore, we use a model that has been calibrated with experiment with a circuit simulation approach to derive a systematic understanding for the impact of VO2 resistive state on neuron behavior. The model is discussed in the following sessions.
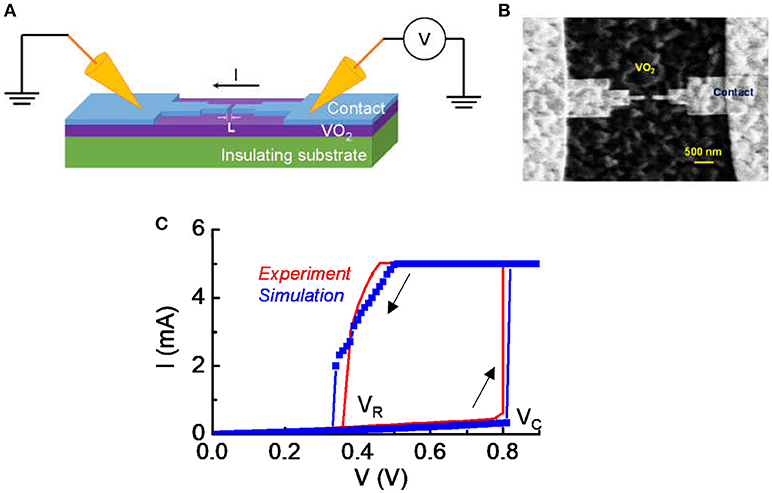
Figure 1. Experimental details for the VO2 device. (A) The schematic of the VO2 devices under DC probing. (B) The top view of the lateral VO2 device with a “neck-down” layout. The “neck-down” layout leads to lower forward critical transition voltage (Vc) and lower power in the switching operation. (C) The typical current vs. voltage characteristic in DC measurement. The voltage sweep is in the sequence of forward (0–0.9 V) and reverse (0.8–0 V) direction. The switch is reversible. The forward critical voltage and reverse voltage are denoted. A current compliance is set at 5 mA. Simulation shows a nice match with experiment.
All experiments were carried out at room temperature. The DC sweeping and current-clamp are both performed using Keysight B1500A. Waveforms for the current-clamp experiment were acquired by Keysight Digital Oscilloscope DSO9104A. For DC sweeping, a current compliance is set to 5 mA. For current-clamp response, the IMT device is protected by a series resistance through a circuit board so that the measurement can be repeated reliably by avoiding excess heating and burnout.
Figure 1A shows the schematic of the VO2 devices under DC probing and Figure 1B is the top view of the lateral VO2 device with a “neck-down” layout. The “neck-down” layout is used to minimize the volume of VO2 that undergoes transition (Lin et al., 2017). It leads to lower critical transition voltage (Vc) and lower power in the switching operation. The spacing between two contacts is L = 200 nm for the device being studied in this work. Figure 1C shows a measured current vs. voltage characteristic under DC condition. A hysteresis sweep is performed and the switch between insulator-state and metal-state is reversible if the operation satisfies the safe criteria introduced in Lin et al. (2017).
Excessive bias stress to the VO2 device can result in non-reversible damage to the material which is manifested in a permeant change in critical transition voltage under DC measurement. This can happen when the device is subjected to a bias outside the safe operating criteria. Two forms of non-reversible damages are shown in Figure 2. Two forward DC sweeps (in the positive direction) are carried out consecutively in one device. Figure 2A shows an increase in Vc caused by an increase of the HRS resistance (+ΔR). The current drops over the whole range of applied voltage in the second sweep. Figure 2B shows a reduction in Vc which is the indication of a drop in the HRS resistance (–ΔR). The current is higher over the span of applied voltage.
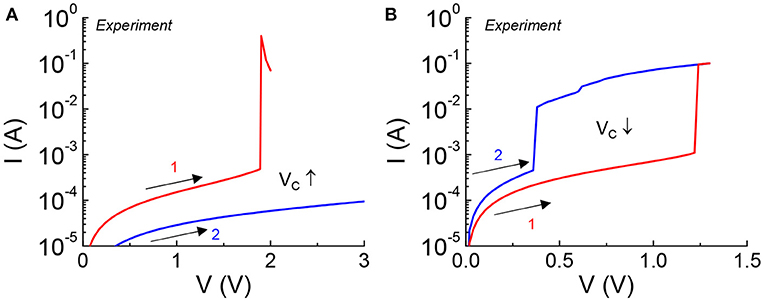
Figure 2. VO2 device under excessive DC stress experiencing non-reversible change in critical transition voltage. Two consecutive sweeps are applied to the VO2 device with the first sweep stresses the device. (A) Increase in Vc is caused by an increase of HRS resistance, +ΔR. (B) Reduction in Vc is the indication of a drop in HRS resistance, –ΔR.
Figure 3 shows schematic of a biological neuron and an analogous VO2 neuron. The membrane of the biological neuron (Figure 3A) comprises of an insulating phospholipid bilayer that separates the intracellular and extracellular fluids, and protein channels that control the permeation of various ions. As described in the HH model, the neuron membrane is equivalent to a parallel combination of membrane capacitance, Cm, and transmembrane conductance, Gm. Gm is the sum of various ion channels conductance and it can go through a reversible insulator-to-metal transition depending on the voltage across the membrane. An input stimulus can trigger a train of action potentials (AP) that is a temporary reversal of the polarity across the neuron membrane. The AP propagates along the axon through which information is transmitted. In the central nervous system (CNS) such as in the brain and spinal cord, the neuron is myelinated—the myelin sheath surrounds the axon of the neuron cells and promotes rapid signal transmission. Experimentally, the neuron can be stimulated with an input current Iin. The output AP waveforms depend on the input current, the electrical and geometric parameters of the cell, and the environment such as temperature. The HH model and its parameters are described later in Sec. II.A.
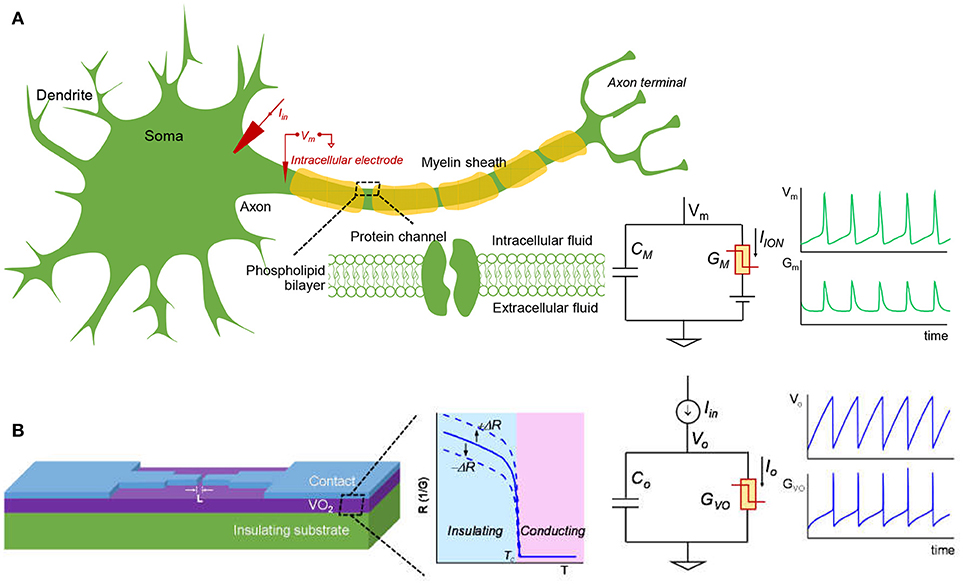
Figure 3. The biological neuron and analogous VO2 neuron. (A) The membrane of the biological neuron can be viewed as a parallel connection of a membrane capacitance (CM) and a membrane conductance (GM) that can go through insulator-to-metal transition under stimulus. The membrane is polarized at the resting potential due to the different ionic concentration in the intracellular and extracellular fluids. When the neuron is subjected to a steady current clamping, a continuous action potential (AP) is generated, in which the trans-membrane potential (VM) and the membrane conductance (GM) oscillate. The AP can propagate along the axon and transmit signal to the other connected neurons. The myelin sheath surrounding the axon of some neuron cells can enhance the speed at which impulses propagate. (B) A lateral VO2 device and a capacitor are used to construct the VO2 artificial neuron circuit. The VO2 material exhibits a reversible electrothermal insulator-to-metal transition. This state change is used to mimic the biological neuron. At constant current input, the VO2 neuron output node and VO2 conductance oscillate, similar to that of the biological neuron. The insulating-state resistance can be changed when VO2 degrades, and this feature is utilized to model spike-timing related neural disorders. Here +ΔR represents an increase of resistance and –ΔR represents a drop in resistance.
The VO2 device and analogous VO2 neuron circuit are shown in Figure 3B. The VO2 is well-known for its reversible IMT proximal to room temperature. Joule heating in two-terminal devices can locally drive the phase change rapidly. This property can be exploited to demonstrate highly non-linear switches (Son et al., 2011; Lin et al., 2017) and artificial neurons (Pickett et al., 2013; Lin et al., 2016; Tuma et al., 2016). The VO2 artificial neuron is a circuit that comprises, a minimum of, only two components, the capacitor Co and the conductor (i.e. resistor) GVO as shown in Figure 3B. When the input stimulus Iin starts, the VO2 neuron exhibits an oscillatory behavior similar to that in the biological neuron. The model and experiment for standalone VO2 devices are discussed, respectively in Sec. II.B and Sec. II.C. The VO2 neuron circuit is described in Sec. II.D.
The complete circuit schematic for a patch of the neuron membrane with the HH model is illustrated in Figure 4. The conduction occurs via three channels: The Na+ channel, the K+ channel and the leakage channel.
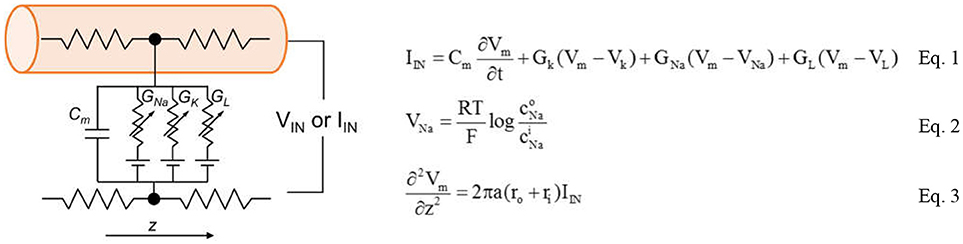
Figure 4. Full schematic of biological neuron that contains two ion channels, leaky capacitive membranes. The equations the form the Hodgkin-Huxley model are shown in the Equations 1–3.
The basic mechanisms in the HH model contains ion transport and transmission lines for Action Potential (AP) propagation. The key equations are shown in Equations 1–3. Equation 1 relates the membrane current density IIN to membrane potential Vm. The area-normalized membrane capacitance is Cm. Two ion channels with the leaky conductance are included in the model. Their conductance is denoted as GNa, GK, and GL. The Nernst equilibrium potential in Equation 2 relates extracellular and intracellular ion concentrations, respectively denoted as Ci and C°. Through Equation 2, the Nernst equilibrium potentials VNa and VK can be obtained for the given Na+ and K+ concentrations. The molar gas constant R and Faraday's constant F are physical constants. Finally, the propagation of AP along z direction is described by the core conductor equation in Equation 3. It couples the voltage and current along a cylindrical cell where the resistances per unit length inside and outside the cell are, respectively, ri and ro. The cylindrical cell has diameter a. The baseline values of the parameters in the HH model are listed in Table 1. The HH neuron model is constructed in Matlab.
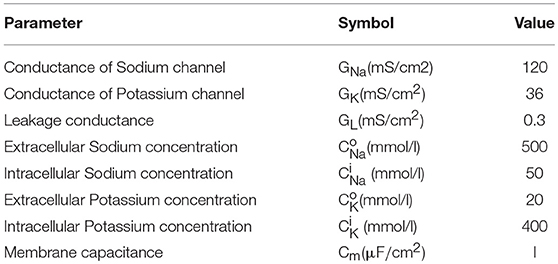
Table 1. Baseline input parameters for the Hodgkin-Huxley model.
Figure 5 shows the results from the HH model with a current clamp. The input is two discrete current pulses. The current-clamped neuron is subjected to the deposition of charge from each of the pulse. The deposited charge of one pulse is merely enough to trigger one neuron firing. The solid red lines are the results for pulse width of 3 ms, and the dashed black lines are for pulse width of 6 ms. The resultant AP profiles are identical for different pulse width, even the long pulse (dashed black) has deposited twice as many charges as the short pulse (solid red). The additional charges are not integrated because it falls into the “refractory period.” A new integration cycle starts only after the neuron resets itself.
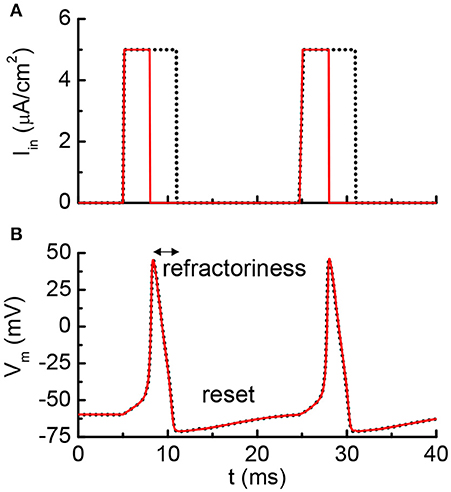
Figure 5. Simulated results from the Hodgkin-Huxley model. (A) The neuron is clamped to pulse current input, and (B) cross membrane potential. The red solid lines and black dot lines are two different inputs that result in the same firing patterns. The extra current inputs are not being integrated to the membrane capacitance due to the existence of post-refractory period.
The model for electrothermal IMT is first introduced in Lin et al. (2016, 2018), and the relevant detail is discussed in this section. The basic form of heat equation is a parabolic partial differential equation (Equation 4) that describes the relationship of temperature variation in a given volume over time. Equation 4 assumes an isotropic and homogeneous medium in a 3-dimensional space and zero heat flux. The 3D heat transport is simplified by the quasi-1D assumption that the temperature variation perpendicular to the current transport direction along y and z is much smaller than that in the transport direction along x. This is illustrated in Figure 6 with the current flowing in x direction, and the heat equation is converted to Equation 5. Under this assumption, the temperature for a given segment at location x and time t is obtained as T(x, t). The parameters describing the IMT property are given as follows, specific heat capacity Cth, density ρo, and thermal conductivity K.
There are two origins of heat flux. Firstly, Joule heating results in incoming heat flux to the medium. The power generated by Joule heat follows Ohm's law, and for a unit volume it is:
where I is the total current through the IMT, A is the cross sectional area, and ρr is the temperature-dependent resistivity of the IMT. Secondly, the outgoing heat flux is generated by convective heat loss, modeled by the effective convective heat transfer coefficient h. Here h is assumed to be a constant and is independent of the IMT temperature. Besides h, the heat loss through convection for a unit volume is also related to the ambient temperature Ta, and IMT's surface to volume ratio Lp/A where Lp is the cross sectional perimeter. The power dissipated through side wall heat convection is:
Taking into account the heat fluxes, the differential equation for heat transfer is shown in Equation 8.
As shown in Figure 6, the IMT with length L is connected to two metal contacts with length Lc. As the boundary condition, Lc is assumed to be long enough so that the value of Lc has negligible impact – Lc should be significantly longer than the heat diffusion length. Equation 8 is solved using a numerical method: forward difference for the time domain and central difference for spatial domain. In the spatial domain, the IMT bar is discretized into segment of length dx. Each segment has its resistivity ρr(x). The total IMT resistance RIMT is obtained by integrating the resistance of all segments:
The current through the IMT can then be obtained by
Where RS is the series resistance. The IMT resistivity as a function of temperature follows a look-up table of resistivity vs. temperature as measured in the experimental VO2 device. A typical example of the resistivity vs. temperature is shown in Figure 3B, which is characterized by the insulator-state resistivity ρH, the metal-state resistivity ρL, and the critical transition temperature (Tc). The baseline values of other physical parameters are listed in Table 2.
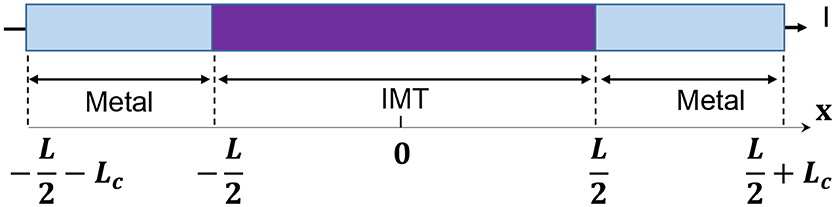
Figure 6. Full schematic of an IMT device with length L between two metal contacts. The device is discretized into segment of dx, etch with its own temperature and resistivity. Heat conduction is along x direction while convective heat loss through the side wall.
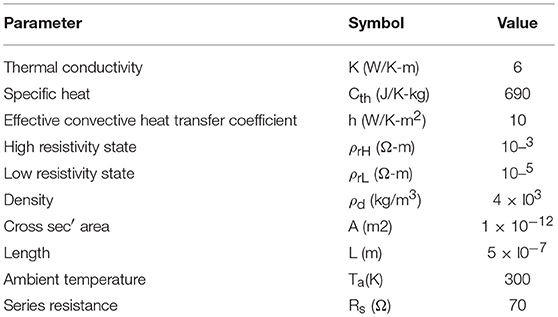
Table 2. Input parameters for the coupled electrical-thermal model IMT model.
The complete VO2 neuron circuit is shown in Figure 7. This is one of the simplest artificial neuron circuits that has been reported, which comprises of only two or three elements. Despite its simplicity, it exhibits striking similarity to the biological neuron (Figure 3A). To investigate the many unexplored functions of the artificial neuron, particularly its connection to neurological diseases, a physical neuron model is imperative.
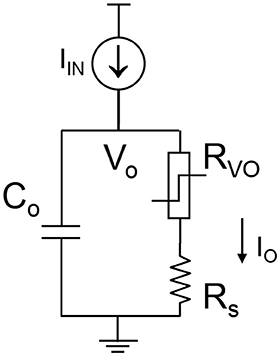
Figure 7. The complete VO2 neuron circuit. The whole circuit contains three elements: a capacitor as well as the VO2 device with a sensing resistor in series. The output current is sensed by the sensing resistor. The voltage at the capacitor node is denoted as Vo. It is also the input node for the injected current.
The model is focuses on the material properties of VO2 that emulate biological neuron functions. A series resistance Rs is added in series with the VO2 for two reasons. First, it limits the current when the VO2 device transitions to the metallic state, and ensures reliable switching. The safe operating design follows the theoretical guideline derived in Lin et al. (2017). Second, it converts the output current to an output voltage which is measured by the oscilloscope. Each spiking event includes the following four steps: integration, fire, refractoriness and reset as discussed in Figure 8.
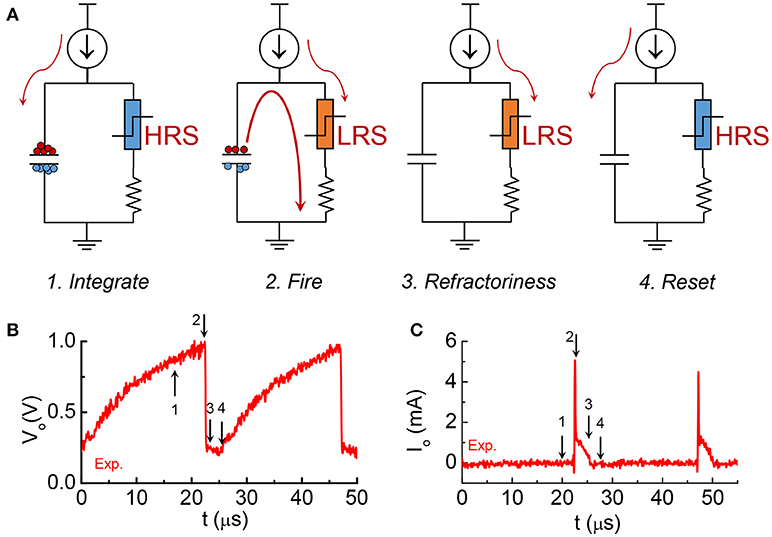
Figure 8. The four stages in one spike cycle in the VO2 neuron and the corresponding experimental output waveforms. (A) At the integration stage, current is integrated to the capacitance. Very small current goes through the resistor at the right branch as the VO2 is at HRS. Voltage at across the capacitor Vo is increasing. This is stage 1. When Vo reaches Vc, VO2 become metallic and it discharges the capacitor. An instantaneous large current spike appears at the output. Vo drops sharply. It is stage 2, fire, which is followed by stage 3, refractoriness (refractory period). In stage 3 the VO2 remains in its LRS for some time. Any input current will be drained to ground without integrating to the capacitor. After the refractory period, the neuron resets and is ready for another spike cycle (stage 4). (B) The experimental output voltage Vo for the 4 stages. (C) The experimental output current across the resistance for the 4 stages.
One example of the simulation result is shown in Figure 9. Two discrete current pulses are fed to the input node of the neuron circuits. The deposited charge from each pulse is enough to fire the neuron once. The pulse duration is 0.9 μs for the red solid lines and 1.8 μs for the black lines (Figure 9A). After each neuron firing, the VO2 stays in low resistance state for a finite period (Figure 9B). During this period, the input current are directly drained to ground through the VO2. The charge is not integrated. As a result, inputs with two pulse durations generates the same firing patterns (Figure 9C). This results show similar post-firing refractoriness as the biological neuron (Figure 5).
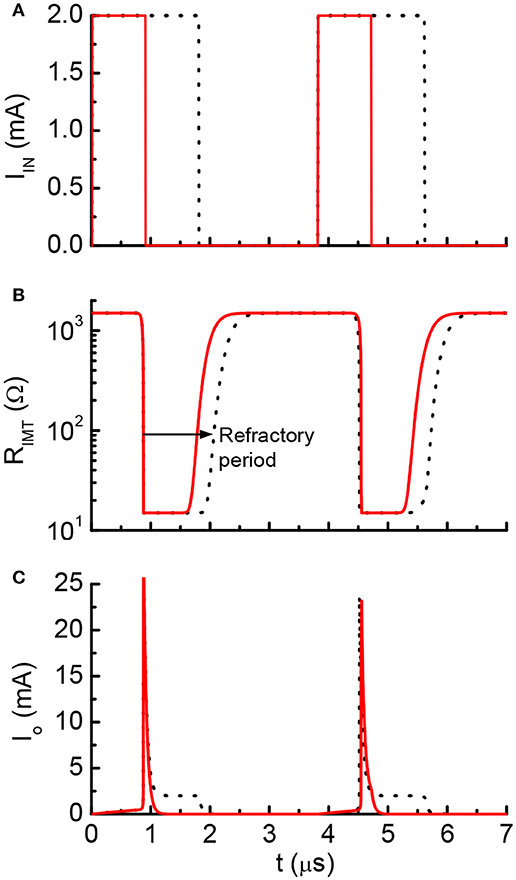
Figure 9. Simulated waveform for current-clamp VO2 neuron. (A) Input current, (B) VO2 resistance and (C) Output current. The red solid lines and black dot lines are two different inputs that result in the same firing patterns. The extra current inputs are not being integrated to the capacitor due to the existence of post-refractory period. This property directly mimics the biological neuron.
Post-firing refractoriness is another important feature in both biological and VO2 neurons. A second AP is difficult to be produced immediately following the occurrence of an AP when the cell is regarded to be refractory (Weiss, 1996). Following each firing, the VO2 element remains at a temperature above the critical temperature for a time, ~τth+τel, where τth and τel are the thermal and electrical time constants, respectively. τth is related to the thermal mass and heat dissipation. For the electrical time constant τel, it is given by RmetCo+RsCo. Rmet is the metallic-state resistance and Rs is the series resistance. Usually, Rmet is much >Rs in normal operation (Lin et al., 2017). To the first order, the refractory period is given by RsCo. In addition, the continuous high input current can keep the VO2 in LRS for longer time. During this period, the VO2 element remains in metallic state and new input charge is continuously discharged without being integrated in the capacitor Co. Our coupled electrothermal model captures this process and can be used to design the “refractory period” in the VO2 neuron circuit. Subsequently, the VO2 element resets and starts another integrate-and-fire cycle. The steps mimic the electrically excitable membrane in neuron cells.
In biological neurons, the inter-spiking interval (ISI) is defined as the time interval between two adjacent spikes (Fadool et al., 2011; Okubo et al., 2015). The spiking frequency is the reciprocal of ISI. The AP recorded as a function of time is shown for a healthy neuron (Figure 10A) along with two abnormal neurons (Figures 10B,C), simulated with the HH model. A pathological change of the action potential firing frequency can lead to neurological and psychological disorders. For instance, a decrease in AP frequency is tied to CNS depression and cognitive dysfunction (Friedman et al., 2014). In contrary, an increase in firing frequency is responsible for seizures, pain, ADHD, and anxiety (Wulff et al., 2009). Therapeutic treatment can be designed to restore AP frequency according to the dysfunction mechanisms.
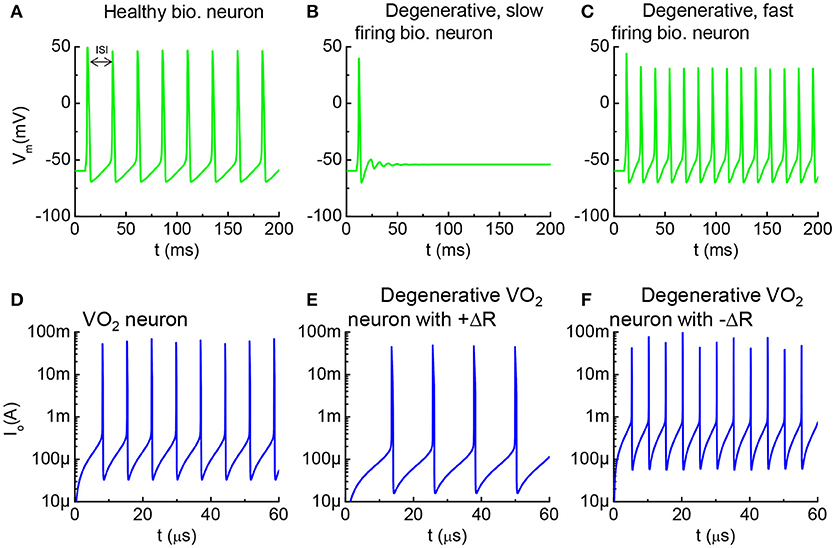
Figure 10. Healthy vs. degenerative fast-firing and slow-firing neurons, and VO2 analogy. (A) A healthy biological neuron generates AP under a constant current stimulus. The time between two adjacent spikes is termed as the inter-spike interval (ISI). (B) A degenerated neuron stimulated by the same input generates AP at longer ISI. (C) A degenerated neuron generates AP at shorter ISI. (D) Simulation using the VO2 neuron model, the intact VO2 neuron exhibits oscillatory behavior at a constant input current. (E) Simulation of a case where the VO2 device is degraded and its insulating state resistance increases (+ΔR). Such degenerative VO2 neuron results in longer ISI. (F) Simulation of a case where the VO2 device is degraded by decreasing its insulating state resistance increases (–ΔR). The leakier VO2 neuron results in shorter ISI. (A–C) are simulated by the HH model. (D–F) are simulated from the VO2 neuron model.
Similar characteristics can be observed in the VO2 neurons. The simulation results for three VO2 neurons are shown in Figure 10. Figure 10D is the VO2 neuron for baseline reference, and Figures 10E,F are the cases where the HRS resistance is modified. ISI for the VO2 neuron is defined in the same way as for the case of a biological neuron. The AP frequency reduces if the VO2 undergoes a +ΔR degradation, and vice versa. Analytically, the value for ISI can be derived from the VO2 neuron parameters as tISI = CoVc/Iin where Vc is the critical voltage to trigger an insulator-to-metal transition in the VO2 device under DC I-V measurement and Iin is the input current. Vc is related to the HRS resistance of the VO2 device. Definition of Vc is illustrated in Figure 2. Experimentally, we have observed the change of Vc (ΔVc) due to electrical-stress-induced resistance degradation in the VO2 (Figure 7). ΔVc be positive or negative depending on the degradation mechanism. Positive ΔVc indicates an increase in the VO2 HRS resistance, and vice versa.
The pathologically-altered spike timing is linked to other serious degenerative diseases. For example, certain neuromuscular disorders and motor neuron disease (MND) are resulted from the ionic leakage of degenerating membrane and increase of rest conductance (Younger, 1999; Priori et al., 2002). The electrical breakdown of the myelin sheath is one origin for a leaky membrane. Excessive leakage in the membrane makes weak muscles (Wu, 2012). The HH model for biological neuron shows that a neuron fails to fire when conductance is significantly increased (Figures 11A,B). AP generation in a healthy neuron is accompanied by an insulator-to-metal transition in the membrane. However, no transition can be observed in a leaky membrane at the same current input since the charge cannot be integrated effectively.
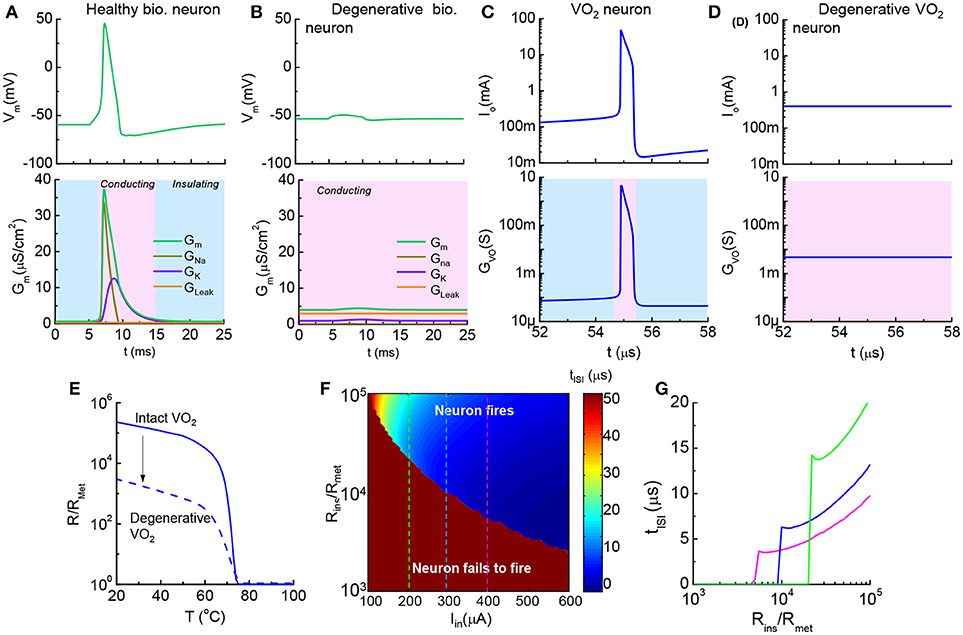
Figure 11. Healthy vs. degenerative leaky neurons, and VO2 artificial neurons (A). Healthy biological neuron shows an insulator-to-metal transition during one spike event. GNa, GK, and GLeak are respectively the Na+ conductance, K+ conductance and leakage conductance through the membrane, while GM is the the sum of the conductance (B). Degenerative biological neuron with excess leakage GLeak, while GK and GNa remain unchanged. No AP spike is observed (C). In one spike of the VO2 neuron, the VO2 device goes through an insulator-to-metal transition (D). Degenerative VO2 neuron with excess leakage (–ΔR) (E). The resistance as a function of temperature normalized to the metallic state resistance (Rins/Rmet) illustrates the reduction of resistance of the insulating state by ~100 (F). Contour of ISI shows its dependency on material properties (Rins/Rmet) and input stimulus (Iin). Reduction of insulating-state resistance narrows the neuron operating region for a given input stimulus (G). Three cut lines across Iin = 200, 300 and 400 μA in the contour plot (F). (A,B) are simulated by the HH model. (C–G) are the simulated results from the VO2 neuron model.
The increase of conductance in a degenerative, leaky neuron can be modeled in a straightforward manner in the VO2 circuit. The resistance vs. temperature of the VO2 device is normalized to the low resistance state, Rmet. Figures 11C,D show two neurons at a fixed Iin: (a), VO2 neuron with Rins/Rmet = 105 fires regularly and demonstrates an insulator-to-metal transition (b) while the neuron with Rins/Rmet = 103 fails to fire. The change of VO2 properties is shown in Figure 11E.
To provide a systematical perspective on the design of VO2 neurons to mimic the corresponding neural disorder, Figure 11F collectively illustrates the impact of HRS resistance and input current on neuron functions. The value of inter-spike interval depends on Rins and Iin and is shown as a contour plot. The dark red color is the case where the combination of low input current and small Rins results in failure in spike generation (tISI → ∞). At a given Iin, tISI decreases as Rins drops. When Rins drops to a critical value, the VO2 neuron fails to fire (Figure 11G).
The AP pulse width is another distinctive characteristic related to timing in different kinds of mammalian central neurons (Bean, 2007). A short pulse and a long pulse in biological neurons are respectively, illustrated in Figures 12A,B, with the tw change by 10X. The pulse width can be simulated in the VO2 neuron by altering the LRS resistance, Rmet, in the VO2 devices according to tw = CoRmet. The VO2 neuron with short pulses of 0.2 μs and 2 μs are shown in Figures 12C,D. Figure 12E compares the biological neurons and VO2 neurons (both simulations and experiments). The AP pulse width can range from a few 100 μs−10 ms which can be matched by the VO2 neuron with appropriate capacitance.
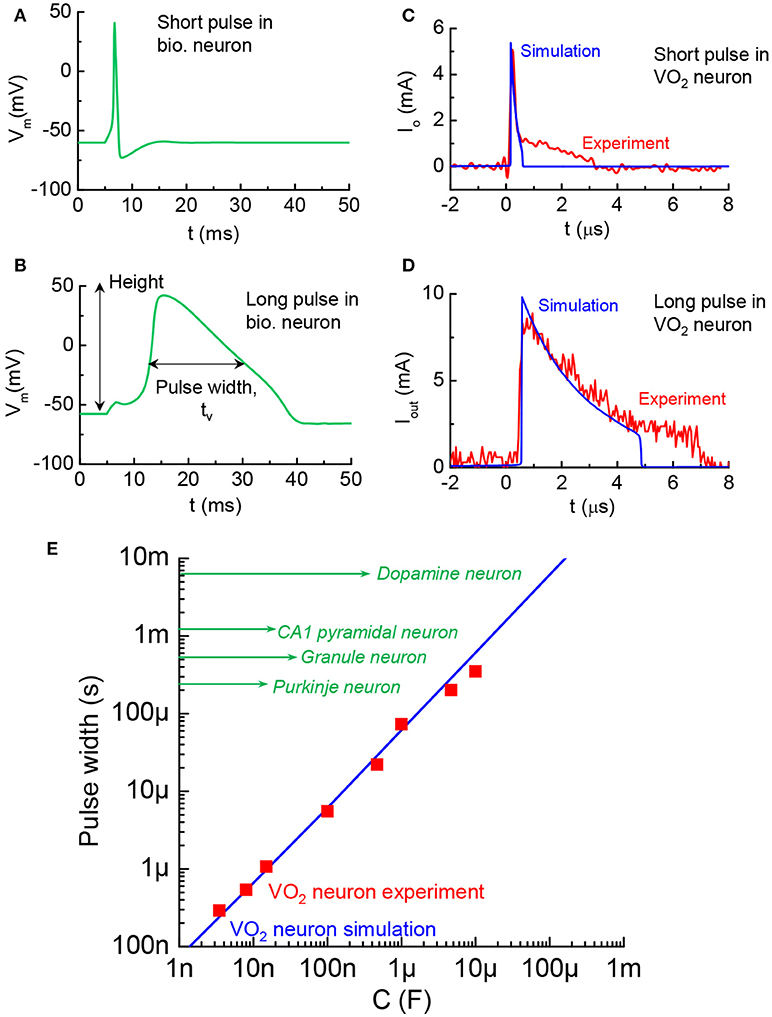
Figure 12. Diversity in AP pulse width across biological neurons, and VO2 artificial neuron analogy (A). AP with short pulse width in a biological neuron. The value of tw is taken at full width half maximum (B). AP with long pulse width (C). VO2 neuron with short pulse of 0.2 μs. Experiment and simulation show good agreement. The pulse width control is achieved by changing resistance in the circuit (D) VO2 neuron with long pulse of 2 μs (E). Pulse width of the VO2 neuron and the range spans biological neuron studies reported in the neuroscience literature.
The HH model has been proven to be useful as a fundamental description of neuron behavior (Hodgkin and Huxley, 1952). However, the HH model is known to have limitations. According to HH model, AP spike trains under constant excitation should be uniform. Neurophysiological experiments reveal that the interval of the AP spike (ie ISI) can change. Current clamp experiments show that at low current, the spike rate is random (Fadool et al., 2011). When the injected current is above a certain level the neuron fires continuously at very short and more uniform ISI. The spike rate histogram follows an apparent Gaussian profile. The spike rate histogram for neurons have important implication on the proper function of many animal species. One reprehensive example is the mitral cells in the human olfactory system (Fadool et al., 2011). In a different context, the application of insulin for diabetes treatment and obesity are found to disturb spike rate of the sensory neuron, resulting in incorrect signaling for hunger. Another example is the correlation of neural sequence and learning of vocalization in songbirds. It has been reported that in songbird vocal development, each syllable is produced by a different sequence of action potential bursts in the premotor cortical HVC neurons (Okubo et al., 2015). We can extend our VO2 neuron study to emulate such spike rate histogram. Figure 13 shows ISI histogram of VO2 neuron for six input currents. The variation of ISI at low input current (IIN = 110 μA) is significant. Such variation reduces as input current increases. The statistical behaviors are related to the cycle-to-cycle operation in VO2 device. These characteristics mimic the behavior of biological neurons under various current stimulus.
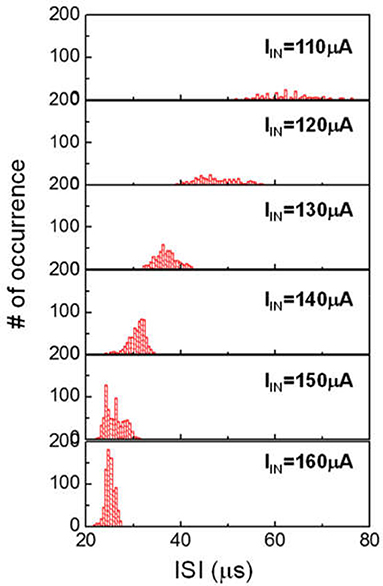
Figure 13. Spike rate (ISI) histogram of VO2 neuron for six input currents. In each case, about 500–1000 spike events are measured. The ISI follows the Gaussian distribution. At increased input current, the variance and the mean value of ISI both decreased. These characteristics can mimic the behavior of biological neurons under various current stimulus.
We further extend this concept to two-stage cascading neuron circuits in Figure 14. The circuit is a modeling system for the monosynaptic motor neuron in muscular tissue that is responsible for certain motion responses such as the knee-jerk reaction that is a model system in neuroscience. Neuron 2 (in red) is the receptive neuron that is driven by Neuron 1 (in blue). Neuron 2 can either fire or not fire depending on the output waveform of Neuron 1 as well as the synaptic resistor Rx.
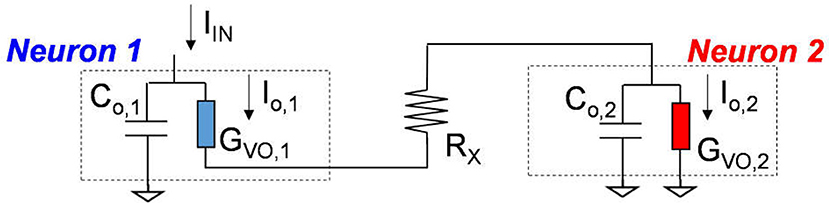
Figure 14. VO2 monosynaptic neuron circuit.
We emulate a monosynaptic circuit that corresponds to the well-known knee-jerk reaction used to monitor responses in nerves (Kandel, 2012) as shown in Figure 15. In the two cases for Figures 15A,B, Neuron 2 is the same while the HRS resistance of VO2 in Neuron 1 are different. Both neurons are initially at rest. Their temperatures are at equilibrium with the environment and is below the critical transition temperature Tc. At t = 0, a current is injected to Neuron 1 (see Figure 9). The neuron 1 in case A is intact with high Rins/Rmet, The output current as a function of time in Figure 15A shows the spike events for Neurons 1 and 2. The separation of spikes indicate the reaction time (tdiff = 0.6 μs) for the signal to propagate between the two VO2 neurons. The neuron 1 in case B has a lower HRS resistance. Premature spike in Neuron 1 results in a weak spike and it cannot trigger a spike in Neuron 2 (Figure 15B).
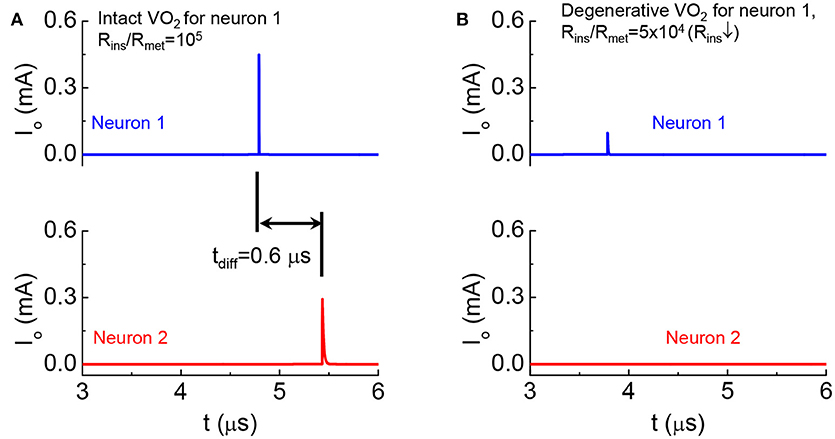
Figure 15. Demonstration of degenerative Neuron 1 leading to the failed signal reception for Neuron 2 in a monosynaptic circuit (A). Output current as a function of time shows the spike events for the intact case (B). Premature spike in Neuron 1 when its HRS resistance is reduced and Neuron 2 fails to spike.
VO2 based circuits can emulate neuronal function and disorders. By carefully varying the electrical properties of the ground state resistance of the artificial neuron, we can precisely identify thresholds for firing and signal propagation that present an analogy to neuronal activity in the brain. While the present study has focused on VO2 as a model system, a vast range of threshold switching Mott semiconductors can further be explored in the future.
JL and SR developed the method, carried out the data analysis, wrote the manuscript. JL and SG fabricated and characterized the VO2 devices. JL developed the VO2 model and HH neuron model.
The authors declare that the research was conducted in the absence of any commercial or financial relationships that could be construed as a potential conflict of interest.
This work was performed, in part, at the Center for Nanoscale Materials, a U.S. Department of Energy Office of Science User Facility. Use of the Center for Nanoscale Materials, an Office of Science user facility, was supported by the U.S. Department of Energy, Office of Science, Office of Basic Energy Sciences, under Contract No. DE-AC02-06CH11357. Aspects of the device work was supported by the National Science Foundation under grant 1640081, and the Nanoelectronics Research Corporation (NERC), a wholly owned subsidiary of the Semiconductor Research Corporation (SRC), through Extremely Energy Efficient Collective Electronics (EXCEL), an SRC-NRI Nanoelectronics Research Initiative under Research Task ID 2698.001. S.R. acknowledges the support by ARO W911NF-16-1-0289 and ONR N00014-16-1-2398. The authors acknowledge K. V. L. V. Achari for providing vanadium dioxide film samples.
Barry, J. M. (2015). Axonal activity in vivo: technical considerations and implications for the exploration of neural circuits in freely moving animals. Front. Neurosci. 9:153. doi: 10.3389/fnins.2015.00153
Bartzokis, G. (2005). Brain myelination in prevalent neuropsychiatric developmental disorders. Adolesc. Psychiatry 29, 55–96.
Bean, B. P. (2007). The action potential in mammalian central neurons. Nat. Rev. Neurosci. 8, 451–465. doi: 10.1038/nrn2148
Birnbaum, S. G., Yuan, P. X., Wang, M., Vijayraghavan, S., Bloom, A. K., Davis, D. J., et al. (2004). Protein kinase c overactivity impairs prefrontal cortical regulation of working memory. Science 306, 882–884. doi: 10.1126/science.1100021
Brennan, A. R., and Arnsten, A. F. T. (2008). Neuronal mechanisms underlying attention deficit hyperactivity disorder. Ann. N. Y. Acad. Sci. 1129, 236–245. doi: 10.1196/annals.1417.007
Brown, E. N., Kass, R. E., and Mitra, P. P. (2004). Multiple neural spike train data analysis: state-of-the-art and future challenges. Nat. Neurosci. 7, 456–461. doi: 10.1038/nn1228
Campbell, J. N., and Meyer, R. A. (2006). Mechanisms of neuropathic pain. Neuron 52, 77–92. doi: 10.1016/j.neuron.2006.09.021
Chakroborty, S., Goussakov, I., Miller, M., and Stutzmann, G. (2009). Deviant ryanodine receptormediated calcium release resets synaptic homeostasis in presymptomatic 3xTg-AD mice. J. Neurosci. 30, 9458–9470. doi: 10.1523/JNEUROSCI.2047-09.2009
Dutta, S., Kumar, V., Shukla, A., Mohapatra, N. R., and Ganguly, U. (2017). Leaky integrate and fire neuron by charge-discharge dynamics in floating-body MOSFET. Sci. Rep. 7:8257. doi: 10.1038/s41598-017-07418-y
Fadool, D. A., Tucker, K., and Pedarzani, P. (2011). Mitral cells of the olfactory bulb perform metabolic sensing and are disrupted by obesity at the level of the Kv1.3 Ion channel. PLoS ONE 6:e24921. doi: 10.1371/journal.pone.0024921
Friedman, A. K., Walsh, J. J., Juarez, B., Ku, S. M., Chaudhury, D., Wang, J., et al. (2014). Enhancing depression mechanisms in midbrain dopamine neurons achieves homeostatic resilience. Science 344, 313–319. doi: 10.1126/science.1249240
Ha, S. D., Zhou, Y., Fisher, C. J., Ramanathan, S., and Treadway, J. P. (2013). Electrical switching dynamics and broadband microwave characteristics of VO2 radio frequency devices. J. Appl. Phys. 113:184501. doi: 10.1063/1.4803688
Hodgkin, A. L., and Huxley, A. F. (1952). A quantitative description of membrane current and its application to conduction and excitation in nerve. J. Physiol. 117, 500–544.
Hutchison, W. D., Dostrovsky, J. O., Walters, J. R., Courtemanche, R., Boraud, T., Goldberg, J., et al. (2004). Neuronal oscillations in the basal ganglia and movement disorders: evidence from whole animal and human recordings. J. Neurosci. 24, 9240–9243. doi: 10.1523/JNEUROSCI.3366-04.2004
Kinney, J. P., Bernstein, J. G., Meyer, A. J., Barber, J. B., Bolivar, M., Newbold, B., et al. (2015). A direct-to-drive neural data acquisition system. Front. Neural. Circuits 9:46. doi: 10.3389/fncir.2015.00046
Kourrich, S., Calu, D. J., and Bonci, A. (2015). Intrinsic plasticity: an emerging player in addiction. Nat. Rev. Neurosci. 16, 173–184. doi: 10.1038/nrn3877
Lin, J., Alam, K., Ocola, L. E., Zhang, Z., Datta, S., Ramanathan, S., et al. (2017). “Physics and technology of electronic insulator-to-metal transition (E-IMT) for record high on/off ratio and low voltage in device applications,” in 2017 IEEE International Electron Devices Meeting (IEDM) (San Francisco, CA: Tech. Dig) p. 23.
Lin, J., Annadi, A., Sonde, S., Chen, C., Stan, L., Narayanachari, K., et al. (2016). “Low-Voltage Artificial Neuron using Feedback Engineered Insulator-to-Metal-Transition Devices,” in 2017 IEEE International Electron Devices Meeting (IEDM) (San Francisco, CA: Tech. Dig) pp. 862–865.
Lin, J., Ramanathan, S., and Guha, S. (2018). Electrically driven insulator–metal transition-based devices—Part I: the electrothermal model and experimental analysis for the DC Characteristics. IEEE Trans. Electron Devices 65, 3982–3988. doi: 10.1109/TED.2018.2859180
Mannhart, J., and Schlom, D. G. (2010). Oxide interfaces—an opportunity for electronics. Science 327, 1607–1611. doi: 10.1126/science.1181862
Mehonic, A., and Kenyon, A. J. (2016). Emulating the electrical activity of the neuron using a silicon oxide RRAM Cell. Front. Neurosci. 10:57. doi: 10.3389/fnins.2016.00057
Nelson, S. B., and Valakh, V. (2015). Excitatory/Inhibitory balance and circuit homeostasis in Autism Spectrum Disorders. Neuron 87, 684–698. doi: 10.1016/j.neuron.2015.07.033
Okubo, T. S., Mackevicius, E. L., Payne, H. L., Lynch, G. F., and Fee, M. S. (2015). Growth and splitting of neural sequences in songbird vocal development. Nature 528, 352–357. doi: 10.1038/nature15741
Pickett, M. D., Medeiros-Ribeiro, G., and Williams, R. S. (2013). A scalable neuristor built with Mott memristors. Nat. Mater. 12, 114–117. doi: 10.1038/nmat3510
Priori, A., Cinnante, C., Pesenti, A., Carpo, M., Cappellari, A., Nobile-Orazio, E., et al. (2002). Distinctive abnormalities of motor axonal strength–duration properties in multifocal motor neuropathy and in motor neurone disease. Brain 125, 2481–2490. doi: 10.1093/brain/awf255
Salinas, E., and Sejnowski, T. J. (2001). Correlated neuronal activity and the flow of neural information. Nat. Rev. Neurosci. 2, 539–550. doi: 10.1038/35086012
Santos, S. F., Pierrot, N., and Octave, J.-N. (2010). Network excitability dysfunction in Alzheimer's disease: insights from in vitro and in vivo models. Rev. Neurosci. 21, 153–171. doi: 10.1515/REVNEURO.2010.21.3.153
Savo, S., Zhou, Y., Castaldi, G., Moccia, M., Galdi, V., Ramanathan, S., et al. (2015). Reconfigurable anisotropy and functional transformations with VO2-based metamaterial electric circuits. Phys. Rev. B 91:134105. doi: 10.1103/PhysRevB.91.134105
Schulz, A., Walther, C., Morrison, H., and Bauer, R. (2014). In vivo electrophysiological measurements on mouse sciatic nerves. J. Vis. Exp. 86:51181. doi: 10.3791/51181
Son, M., Lee, J., Park, J., Shin, J., Choi, G., Jung, S., et al. (2011). Excellent selector characteristics of nanoscale VO2 for High-Density Bipolar ReRAM Applications. IEEE Electron Device Lett. 32, 1579–1581. doi: 10.1109/LED.2011.2163697
Tuma, T., Pantazi, A., Le Gallo, M., Sebastian, A., and Eleftheriou, E. (2016). Stochastic phase-change neurons. Nat. Nanotechnol. 11, 693–699. doi: 10.1038/nnano.2016.70
Vitale, W. A., Moldovan, C. F., Tamagnone, M., Paone, A., Schüler, A., and Ionescu, A. M. (2015). Steep-slope metal insulator-transition VO2 switches with temperature-stable High ION. IEEE Electron Device Lett. 36, 972–974. doi: 10.1109/LED.2015.2454535
Vos, T., Flaxman, A., Naghavi, M., Lozano, R, Michaud, C, Ezzati, M, et al. (2012). Years lived with disability (YLDs) for 1160 sequelae of 289 diseases and injuries 1990–2010. A systematic analysis for the Global Burden of Disease Study 2010. Lancet 30, 2163–2196. doi: 10.1016/S0140-6736(12)61729-2
Wu, F. (2012). Calcium channel mutant mouse model of hypokalemic periodic paralysis. J. Clin. Invest. 122, 4580–4591. doi: 10.1172/JCI66091
Wulff, H., Castle, N. A., and Pardo, L. A. (2009). Voltage-gated potassium channels as therapeutic targets. Nat. Rev. Drug Discov. 8, 982–1001. doi: 10.1038/nrd2983
Keywords: strongly correlated systems, VO2, central nervous system diseases, Hodgkin-Huxley model, artificial neurons
Citation: Lin J, Guha S and Ramanathan S (2018) Vanadium Dioxide Circuits Emulate Neurological Disorders. Front. Neurosci. 12:856. doi: 10.3389/fnins.2018.00856
Received: 31 May 2018; Accepted: 01 November 2018;
Published: 30 November 2018.
Edited by:
Themis Prodromakis, University of Southampton, United KingdomReviewed by:
Adnan Mehonic, University College London, United KingdomCopyright © 2018 Lin, Guha and Ramanathan. This is an open-access article distributed under the terms of the Creative Commons Attribution License (CC BY). The use, distribution or reproduction in other forums is permitted, provided the original author(s) and the copyright owner(s) are credited and that the original publication in this journal is cited, in accordance with accepted academic practice. No use, distribution or reproduction is permitted which does not comply with these terms.
*Correspondence: Shriram Ramanathan, c2hyaXJhbUBwdXJkdWUuZWR1
Disclaimer: All claims expressed in this article are solely those of the authors and do not necessarily represent those of their affiliated organizations, or those of the publisher, the editors and the reviewers. Any product that may be evaluated in this article or claim that may be made by its manufacturer is not guaranteed or endorsed by the publisher.
Research integrity at Frontiers
Learn more about the work of our research integrity team to safeguard the quality of each article we publish.