 Ke Zhang
 Dengfeng Huang
 N. Jon Shah
- 1Institute of Neuroscience and Medicine INM-4, Medical Imaging Physics, Forschungszentrum Jülich, Jülich, Germany
- 2Department of Neurology, Faculty of Medicine, JARA, RWTH Aachen University, Aachen, Germany
Resting-state brain activity has been widely investigated using blood oxygenation level dependent (BOLD) contrast techniques. However, BOLD signal changes reflect a combination of the effects of cerebral blood flow (CBF), cerebral blood volume (CBV), as well as the cerebral metabolic rate of oxygen (CMRO2). In this study, resting-state brain activation was detected and compared using the following techniques: (a) BOLD, using a gradient-echo echo planar imaging (GE-EPI) sequence; (b) CBV-weighted signal, acquired using gradient and spin echo (GRASE) based vascular space occupancy (VASO); and (c) CBF, using pseudo-continuous arterial spin labeling (pCASL). Reliable brain networks were detected using VASO and ASL, including sensorimotor, auditory, primary visual, higher visual, default mode, salience and left/right executive control networks. Differences between the resting-state activation detected with ASL, VASO and BOLD could potentially be due to the different temporal signal-to-noise ratio (tSNR) and the short post-labeling delay (PLD) in ASL, along with differences in the spin-echo readout of VASO. It is also possible that the dynamics of spontaneous fluctuations in BOLD, CBV and CBF could differ due to biological reasons, according to their location within the brain.
Introduction
The measurement of functional connectivity (FC) in the resting state has been a powerful method with which to characterize the intrinsic functional architecture of the brain (Biswal et al., 1995; Greicius et al., 2003; Fox et al., 2005). It has been suggested that FC may reflect relevant task-induced activation and behavioral performance (Hampson et al., 2006; Zou et al., 2013), and could be a biomarker for diagnosing diseases and for the monitoring of treatment outcomes (Buckner et al., 2008; Fornito and Bullmore, 2010; Salvador et al., 2010; Menon, 2011; Miao et al., 2014). It is possible to acquire functional signals using magnetic resonance imaging (MRI) based on blood oxygenation level dependent (BOLD) contrast, cerebral blood flow (CBF), cerebral blood volume (CBV) and cerebral metabolic rate of oxygen (CMRO2).
Among these techniques, resting-state BOLD fMRI is the most widely used. This is due to its simple MRI acquisition sequence, high sensitivity and relatively high spatial and temporal resolution. However, BOLD signal changes reflect a combination of effects from blood oxygenation, CBV, CBF and CMRO2 (Davis et al., 1998; Hoge et al., 1999; Buxton et al., 2004). In contrast, imaging techniques based on the physiological parameters of CBV, CBF or CMRO2 are collected with fewer confounds and are straightforward to interpret. In addition, although the literature relating to BOLD-based FC is extensive, it is relatively disorganized and there is proportionately very little relating to CBF-CBV- and CMRO2-based FC. A non-BOLD approach is therefore highly desirable in order to clarify the meaning of the BOLD-based FC literature.
It has been widely demonstrated that CBF is coupled with BOLD, which has also been shown to be linked to brain metabolism (Raichle, 1998). This is the case in both active and resting states (Fox and Raichle, 1986; Fox et al., 1988; Raichle et al., 2001; Jann et al., 2015; Storti et al., 2017; Chiacchiaretta et al., 2018). Changes in CBF can be measured non-invasively with arterial spin labeling (ASL; Barbier et al., 2001; Golay et al., 2004). In ASL, the perfusion contrast in the images is generated by the subtraction of successively acquired images: one with and one without the proximal labeling of arterial spins after a delay time. The subtracted signal is on the order of 1% of the baseline signal, and resting-state fluctuations cause merely an additional fractional change. The main challenges in using ASL to observe resting-state CBF fluctuations are the low signal-to-noise ratio (SNR), low temporal resolution and possible contamination from BOLD fluctuations. Continuous ASL imaging, which provides higher SNR compared to pulsed ASL, has been used to investigate resting-state brain activity as a comparison with BOLD (Chuang et al., 2008; Viviani et al., 2011; Li et al., 2012). High-pass filtering of the ASL signal allows for CBF oscillations to be isolated with reduced BOLD contamination (Chuang et al., 2008). Connectivity maps from the CBF and the BOLD signal have been demonstrated to be regionally similar (Fukunaga et al., 2008; Viviani et al., 2011; Li et al., 2012; Chen et al., 2015).
The use of the spontaneous fluctuation of the CBV-weighted signal using whole-brain gradient and spin echo (GRASE) based vascular space occupancy (VASO) to detect resting-state networks has also been demonstrated (Miao et al., 2014). The VASO technique makes use of the T1 difference between blood and the surrounding brain tissue and uses an inversion recovery pulse sequence to null the blood signal while maintaining part of the tissue signal. The VASO signal intensity is thus proportional to 1-CBV. When neural activation causes the CBV to increase, the VASO signal shows a decrease, allowing the detection of activated regions in the brain (Lu and van Zijl, 2012). Using 3D-GRASE as a readout method, the data from the entire brain can be collected at the blood nulling time. This implies the possibility of observing changes in CBV in the entire brain (Gunther et al., 2005; Poser and Norris, 2009; Miao et al., 2014). Reliable brain networks were detected from the CBV-based, whole-brain images, including the default mode network, the salience, the executive control, the visual, the auditory and the sensorimotor networks. The improved spatial location offered by the VASO technique, compared to BOLD, was shown in task-evoked brain activation, in which activation aligned well with gray matter in VASO but extended to other areas in BOLD. Moreover, 3D-GRASE VASO images showed less sensitivity to susceptibility artifacts.
Great effort has been devoted to the comparison of BOLD, CBV and CBF (Chen and Pike, 2009; Wu et al., 2009; Shih et al., 2011; Sforazzini et al., 2014; Krieger et al., 2015; Donahue et al., 2017), and comparisons between BOLD, CBV and CBF have been performed in visual and in sensorimotor stimulations in human studies (Chen and Pike, 2009; Krieger et al., 2015). Resting-state FC maps from the CMRO2 signal are, in general, similar to those from BOLD and perfusion in human studies (Wu et al., 2009). Multimodal functional imaging was also performed in animal models for the study of pain (Shih et al., 2011). It was found that BOLD and CBV contrast produced consistent resting-state networks in mouse models (Sforazzini et al., 2014). However, thus far, no comparison of resting-state networks has been reported in relation to the combined use of BOLD, CBV and CBF in human studies. In this work, resting-state brain activation, detected by three contrasts including BOLD, CBV and CBF, were compared in order to investigate/observe differences in: (a) seed-based FC; (b) temporal and frequency characteristics; and (c) FC matrices.
Materials and Methods
Subjects
Sixteen healthy subjects (eight male, eight female; mean age 28 ± 5 years) were scanned using a 32-channel head receive RF coil on a 3T Trio Siemens scanner (Siemens Healthcare, Erlangen, Germany). All subjects were highly educated, relatively young, healthy volunteers (20 < age < 40 years). Participants were excluded if they suffered from a neurological or psychiatric illness, any untreated medical illness, such as uncontrolled diabetes or treatment-resistant hypertension, or if they had any metallic implants. Written informed consent was obtained from all subjects and the study was approved by the Ethics Committee of the Medicine Faculty of the Rheinisch-Westfälischen Technischen Hochschule Aachen (RWTH Aachen University). The study was conducted in accordance with the Declaration of Helsinki. The order of BOLD, VASO and ASL scans was pseudo-randomized among participants. The subjects were instructed to close their eyes and to refrain from falling asleep during the scans.
Image Acquisition
A gradient-echo echo planar imaging (GE-EPI) sequence was used for BOLD imaging acquisition. The sequence parameters of the EPI measurement were: α/TE/TR = 90°/30/2,500 ms, matrix = 64 × 64 × 36, resolution = 3.4 × 3.4 × 3 mm3. Each BOLD measurement included 130 repetitions and was performed in 5.4 min.
A VASO sequence with a global inversion pulse, for the purpose of blood nulling and a single-shot GRASE, for readout, was implemented. The specific sequence parameters of the 3D-GRASE based readout were: TI/TE/TR = 740/16.4/2,500 ms, flip angle = 180°, matrix = 64 × 64 × 24, resolution = 3.4 × 3.4 × 5 mm3, GRAPPA factor along ky = 3, partial Fourier along kz = 6/8, bandwidth = 1,776 Hz/pixel and total readout length = 295. TI was determined based on the blood T1 of 1,627 ms (Lu et al., 2004; Poser and Norris, 2011; Miao et al., 2014). Each VASO measurement included 130 repetitions and was performed in 5.4 min.
For ASL-MRI, a pseudo-continuous arterial spin labeling (pCASL) sequence was considered as it offers a high SNR (Wu et al., 2007; Dai et al., 2008). pCASL uses a 1 s train of RF and gradient pulses to invert the magnetization of blood water flowing through the labeling plane (Okell et al., 2010). In our experiments, the position of the labeling plane was selected from a quick time-of-flight angiography to ensure the optimal orientation of the carotid and vertebral arteries. The positioning of the labeling plane was located at the point where the main arteries run approximately in the inferior-superior direction, and twists in the arteries were avoided. Typically, a position between the two “twists” in the vertebral arteries, before they fuse to form the basilar artery, was chosen. A delay of 1,050 ms between labeling and readout was included to guarantee blood perfusion in the majority of the voxels. Pre-saturation pulses were applied to the imaging region before labeling to avoid the spin perturbation in imaging planes caused by the labeling train. By using readouts with single-shot 2D EPI, 130 measurements with 65 pairs of label-control volumes were obtained. Explicitly, sequence parameters were as follows: α/TE/TR = 90°/14/3,000 ms, dim: 64 × 64 × 20, Partial Fourier = 6/8, resolution: 3.4 × 3.4 × 5 mm3. The total measurement time for pCASL acquisitions was 7.6 min.
Finally, a conventional 3D MP-RAGE sequence of 6 min was performed to acquire T1-weighted anatomical images (resolution = 1 mm3 isotropic, TI/TR = 1,100/2,530 ms, flip angle = 7°, 256 × 256 × 176, GRAPPA factor = 2).
Data Processing
Preprocessing
The resting-state BOLD, VASO and ASL were preprocessed using DPARSF1 with the following steps: slice-timing (only applied to BOLD), motion correction, spatial normalization to the standard Montreal Neurological Institute (MNI) space, smoothing along three directions with FWHM = 6 mm (CBF calculation), detrending and band-filtering (0.01–0.08 Hz) to remove certain nuisance covariates, including six head motion parameters, global mean signal, white matter signal and cerebrospinal fluid signal. The functional images were normalized to MNI space by using a unified segmentation on T1 to improve the accuracy of the spatial normalization. This procedure contains three steps: co-registration, segmentation and the writing of normalization parameters. To ensure that CBF values were not contaminated by the BOLD effect, spatially smoothed ASL raw data was split into a high-pass filtered series with a cut-off at 1/(4*TR) (Chuang et al., 2008), which was 0.08 Hz in our case. A low-pass series was obtained as a residual of the filtering. The high-pass filtering range applied to the ASL signal to generate uncontaminated CBF fluctuations was 0.08–0.2 Hz. The high-passed filtered series was used to obtain the CBF signal. The calculation of the CBF was obtained using ASLtbx (Wang et al., 2008) and a surround subtraction method was used on the high-pass filtered series. After CBF calculation, the CBF data were detrended and nuisance covariates were removed by regression, as was also the case for BOLD and VASO.
Seed-Based Functional Connectivity Analyses
To obtain the corresponding networks in the resting-state, eight seed spherical regions-of-interest (ROIs), with radii of 6 mm, were placed in the left precentral gyrus (Talairach coordinates: −53, −7, 29), left transverse temporal gyrus (−50, −21, 11), left cuneus (BA17: −6, −76, 11), left inferior occipital gyrus (BA17: −20, −94, −8), left posterior cingulate cortex (−12, −54, 10), left dorsal cingulate cortex (−4, 26, 34), left inferior parietal cortex (−48, −63, 38) and right inferior parietal cortex (45, −58, 42). The cross-correlation coefficient (cc) maps for each subject were calculated based on the extracted average time course of each seed ROI. These maps were then transformed to z-value maps using Fisher’s z transform. A one-sample t-test was performed on these z-value maps to acquire significant FC maps at a group level, which were thresholded at t > 7.68, with a cluster size resulting in a p-value p < 0.05 (FWE). The numbers of active voxels and the summed t of these active voxels in different networks were compared.
Time Courses and Spectra
To explore the frequency characteristic of the three contrasts, unfiltered resting-state BOLD, VASO and ASL time courses were extracted from seed ROIs in the primary visual cortex and default-mode network of all subjects, and their spectra were computed.
Adjacency Matrix Construction
One hundred and sixteen network nodes were defined using the anatomical automatic labeling (AAL) atlas (Tzourio-Mazoyer et al., 2002). Subsequently, 116 region-wise, mean time-courses were employed to calculate the functional connection based on their Pearson’s correlation. This resulted in one (116 × 116) correlation matrix for each subject, representing interregional FC. The group-level connectivity matrix was averaged across the individual network matrix under BOLD, VASO and ASL. A one-sample t-test was performed to confirm the significance of connectivity in each group.
Results
For comparison, the seed-based function networks generated from BOLD, VASO and ASL are displayed side by side in Figure 1. Eight resting functional networks were generated, which included the sensorimotor network, the auditory network, the primary visual network, the higher visual network, the default-mode network, the salience network, the left executive-control network (ECN) and the right ECN. The location and strength of the connectivities, based on their t values, are similar among all three contrasts. In all the networks observed, with the exception of the higher visual network, the connectivities based on BOLD were found to be higher than those of VASO and ASL. Most of the networks show higher connectivity in VASO than in ASL. Compared to VASO, the sensorimotor and the salience network in ASL had higher connectivities.
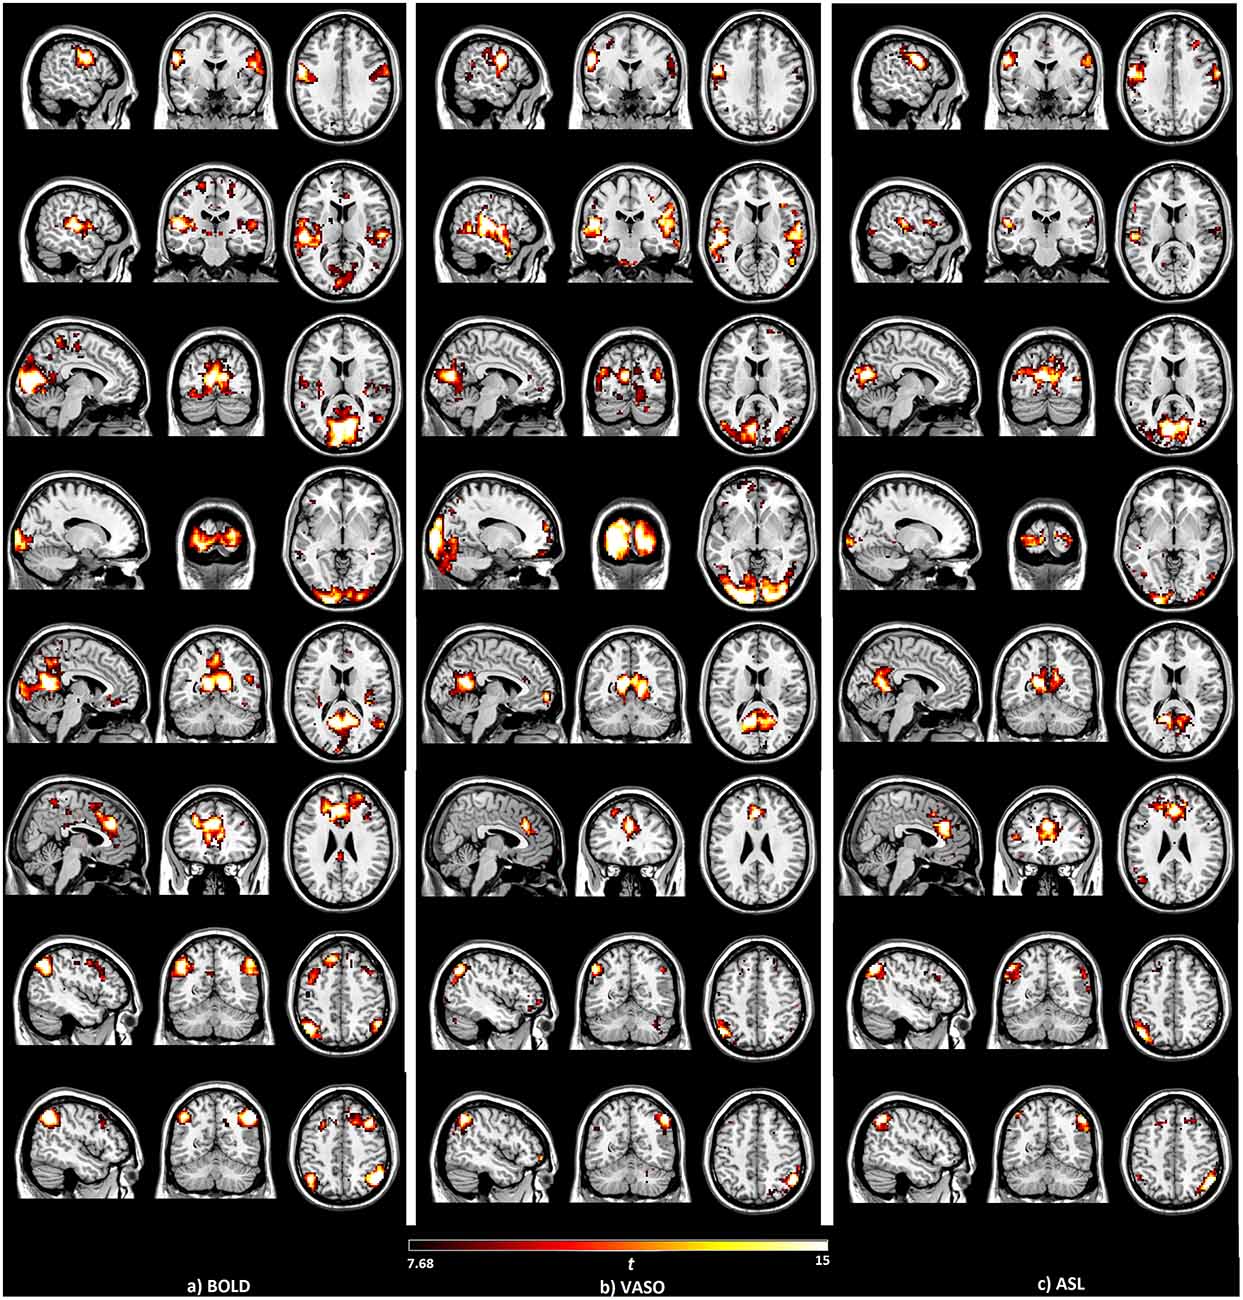
Figure 1. Brain networks detected by the seed-based analysis of the (A) blood oxygenation level dependent (BOLD), (B) vascular space occupancy (VASO) and (C) arterial spin labeling (ASL) data, including sensorimotor, auditory, primary visual, higher visual, default mode, salience and left/right executive control networks.
The numbers of active voxels with a t-value >7.68 in BOLD, VASO and ASL network maps are presented in Figure 2A. The summed t of these active voxels is presented in Figure 2B and the averaged t (summed t/number of active voxels) is presented in Figure 2C. It can be observed that in most of the networks, again with the exception of the higher visual network, BOLD has the highest number of active voxels, and the summed t-scores, VASO remains in the middle and ASL has the lowest values. In the sensorimotor network and salience network, BOLD has the highest active voxel number and summed t-scores, ASL stays in the middle and VASO has the lowest value. In the higher visual network, VASO has the highest active voxel number and summed t-scores while ASL has the lowest value. Averaged t-scores show similar values between different contrasts. Figure 3 shows the averaged spectra from all subjects. The frequency domain representation of the time courses shows that the spectral energy of BOLD fluctuation mostly falls into the low-frequency range from 0.01 Hz to 0.04 Hz. However, the spectral energy of ASL fluctuation shows more high-frequency oscillations in the default mode network. In addition to the low frequency, the high-frequency range of the ASL fluctuation is between 0.08 Hz and 0.16 Hz in the default mode network. Since the fluctuation components of BOLD, and although CBF signals are well separated in the frequency domain, BOLD contamination in the CBF signal can be suppressed by a high-pass filtering of the ASL data. As shown in Figure 4, similar networks can be identified in the correlation matrices. The functional networks around AAL regions, i.e., region number 12 (Frontal_Inf_Oper_R), 27 (Rectus_L), 40 (ParaHippocampal_R), 50 (Occipital_Sup_R), 60 (Parietal_Sup_R), 75 (Pallidum_L), 80 (Heschl_R), are found to be significant using the t-test (p < 0.05) in all contrasts (Figure 4).
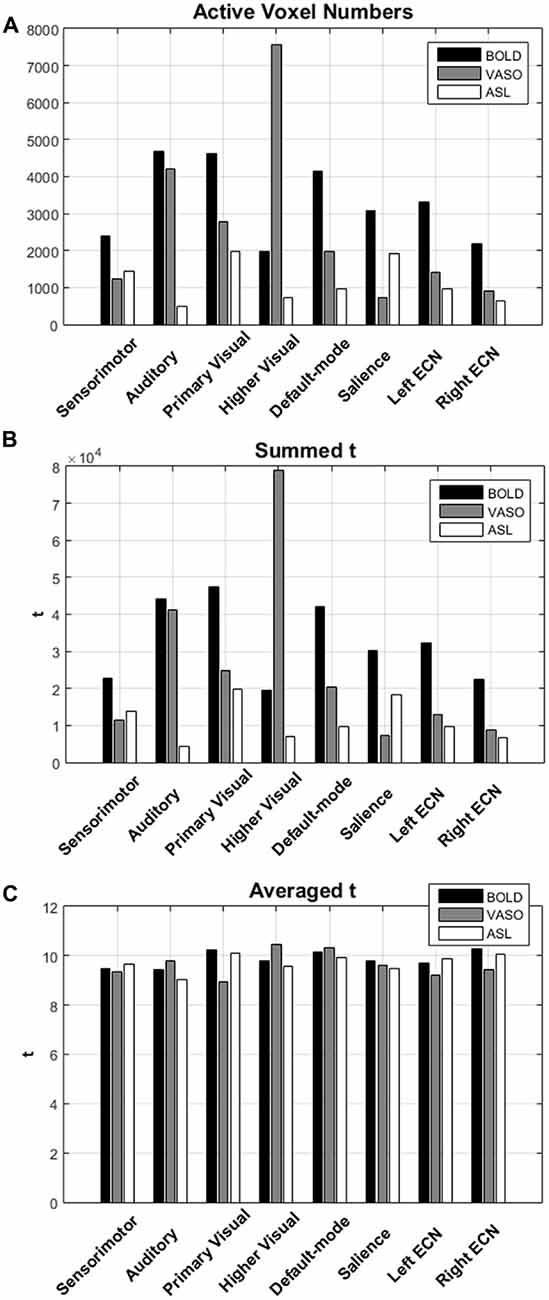
Figure 2. (A) The numbers of active voxels with t value >7.68 in BOLD, VASO and ASL network. (B) The summed t and (C) averaged t of these active voxels in different networks.
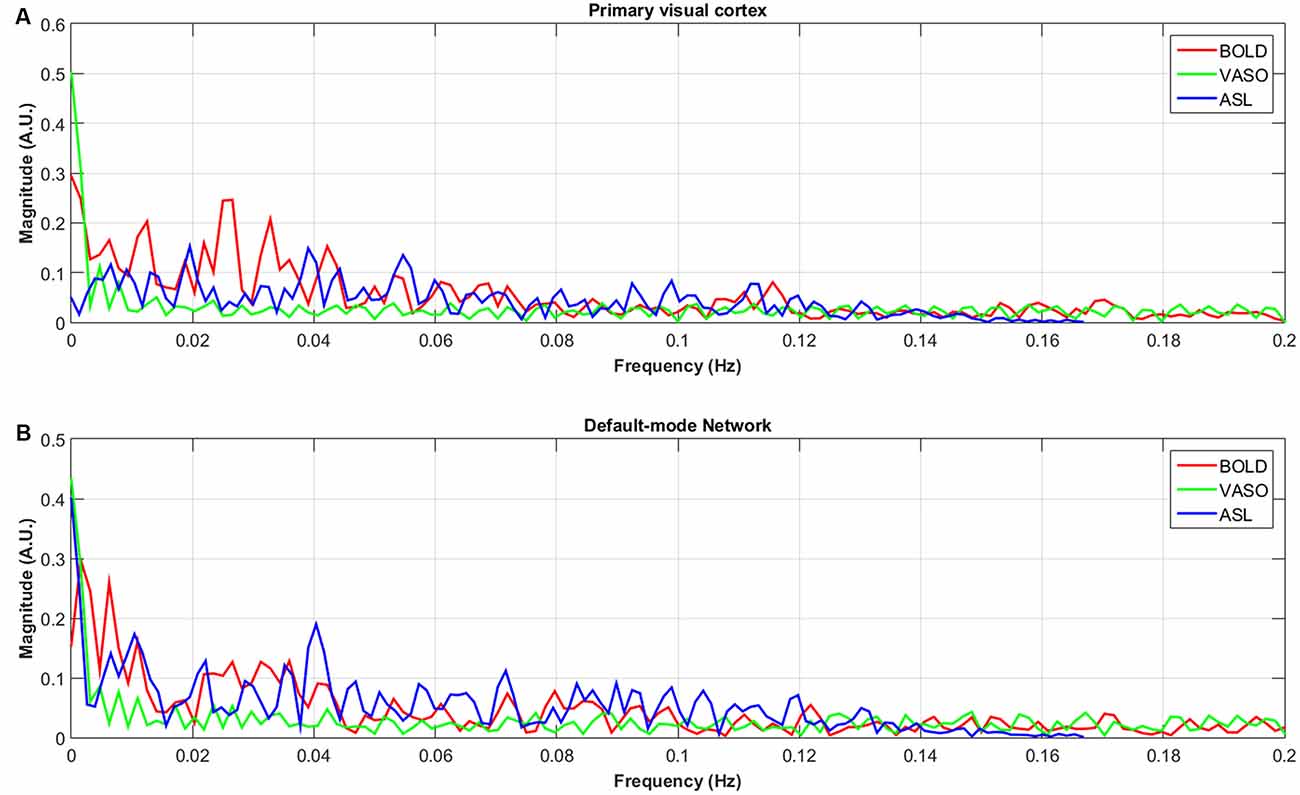
Figure 3. Averaged spectra of unfiltered BOLD, VASO and ASL signals in the default-node network (B) and primary visual cortex (A) of all subjects.
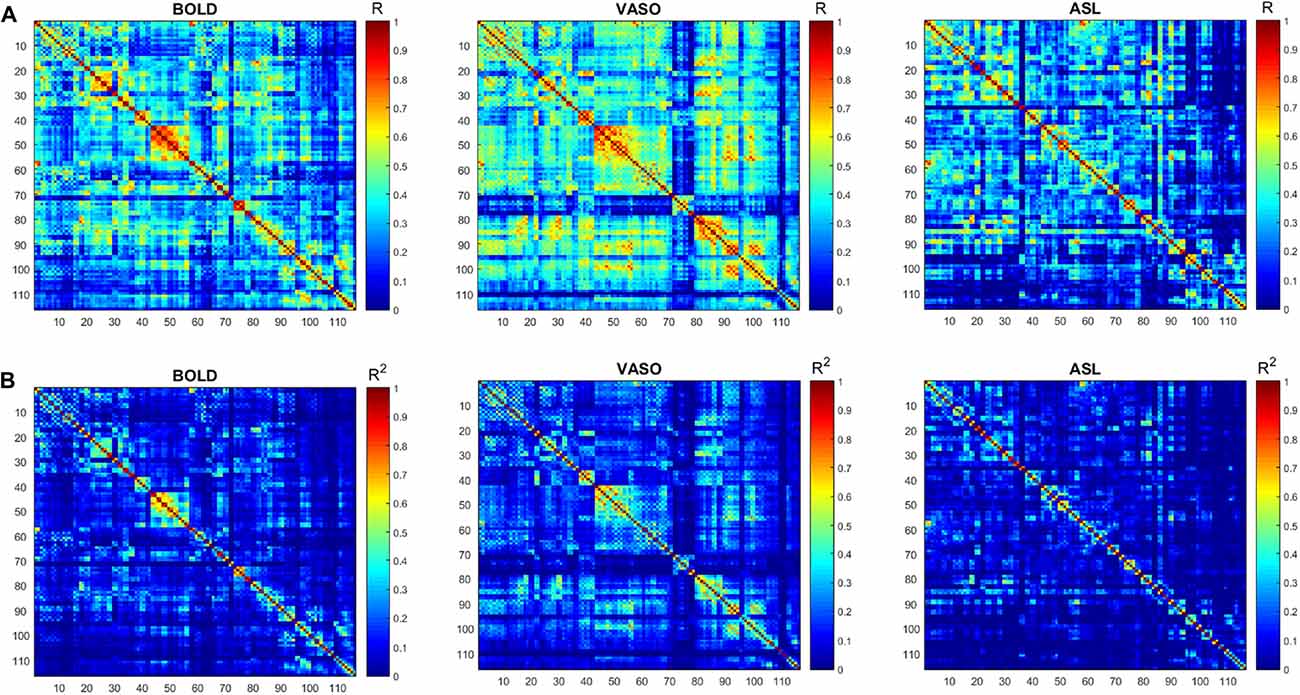
Figure 4. (A) Functional connectivity (FC) matrices (correlation coefficient R) derived from the BOLD, VASO and ASL. (B) The respective R2 matrices. Similar networks (red box) are identified by the three contrasts.
Discussion
The measurement of FC in the brain has attracted tremendous interest in the neurosciences as well as in clinical practice. For this purpose, BOLD imaging has been widely used in resting-state fMRI studies. BOLD has high sensitivity and is easy to implement. However, BOLD signal fluctuations represent combined changes in blood oxygenation, CBV, CBF and CMRO2, making it challenging to interpret the BOLD signal (Davis et al., 1998; Hoge et al., 1999; Buxton et al., 2004). Furthermore, CBV and CBF-based signals provide better spatial localization than the BOLD signal (Jin and Kima, 2008; Donahue et al., 2009). Therefore, imaging of less-confounding physiological parameters, such as CBV or CBF, is needed for further investigation.
In this work, resting-state brain activation detected using BOLD, CBV and CBF were compared. The spontaneous fluctuation of the CBV-weighted signal was measured using whole-brain 3D GRASE based VASO imaging. Compared to GE-EPI BOLD, the 3D-GRASE sequence used for VASO has a comparable temporal resolution, higher SNR and is less sensitive to susceptibility-induced image distortions. Quantitative CBF was measured using a 2D EPI-based pCASL sequence. High perfusion sensitivity was achieved by using a long labeling pulse. Subtraction of surrounding tissue was used to achieve a similar temporal resolution to BOLD. High-pass filtering was added into the post processing of CBF to suppress BOLD fluctuations.
ASL usually has reduced sensitivity to neural activity compared to BOLD due to the lower SNR (Viviani et al., 2011; Chen et al., 2015). In this study, VASO has been shown to be more sensitive than ASL and less sensitive than BOLD in most of the networks. One reason behind this phenomenon is the lower SNR caused by the subtraction of images in ASL. In ASL, the perfusion contrast comes from the subtraction of successively acquired images: one with and one without the labeling of arterial spins after a delay time. The subtracted signal is on the order of 1% of the baseline signal, and the resting-state fluctuations cause merely an additional fractional change. After comparing temporal SNR (tSNR) with BOLD, VASO and ASL, it was found that BOLD has the highest tSNR (in the range of 0–350), VASO is in the middle (in the range of 0–300) and the CBF of ASL has the lowest tSNR (in the range of 0–8), as presented in Figures 5, 6. The order of tSNR scores coincides with the order of the sensitivity of the functional activity in the resting-state from each contrast-based measurement. ASL has the added advantage that CBF is fully quantitative, while VASO and BOLD are not.
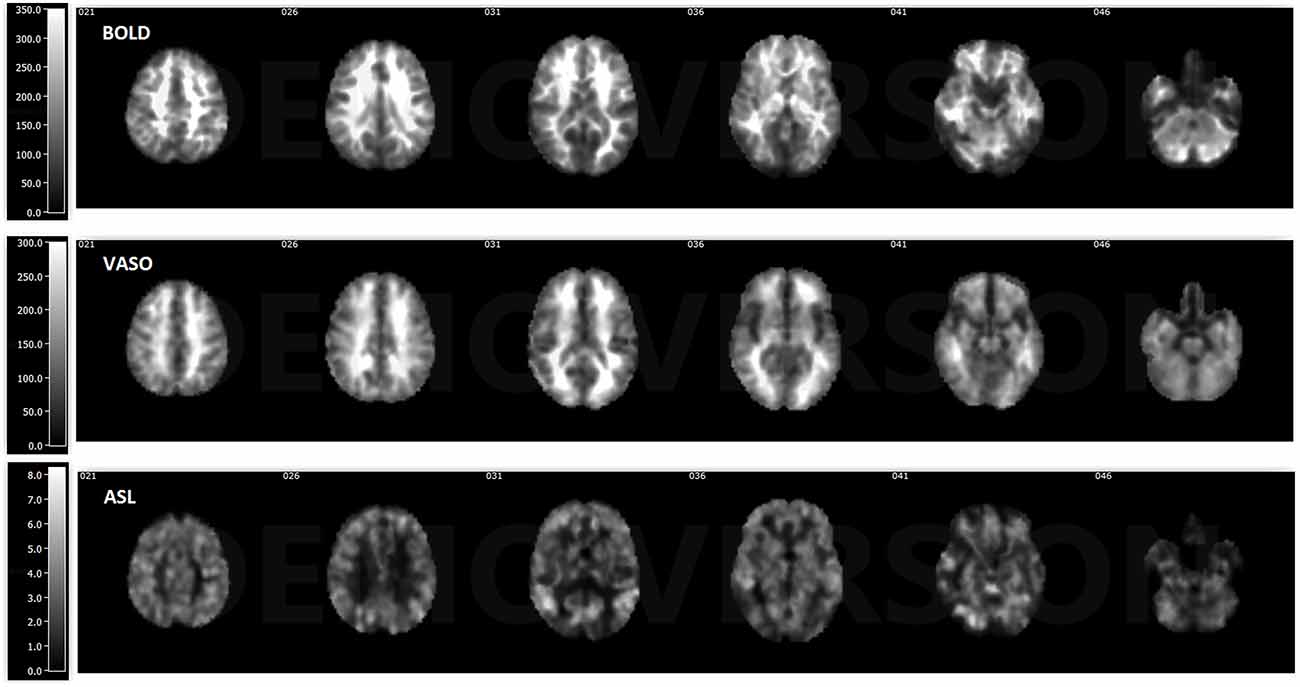
Figure 5. Temporal signal-to-noise ratio (tSNR) maps of BOLD, VASO and cerebral blood flow (CBF) based ASL from a representative subject. BOLD has the highest tSNR at the range of 0–350, the tSNR of VASO is in the range of 0–300 and ASL has the lowest tSNR in the range of 0–8.
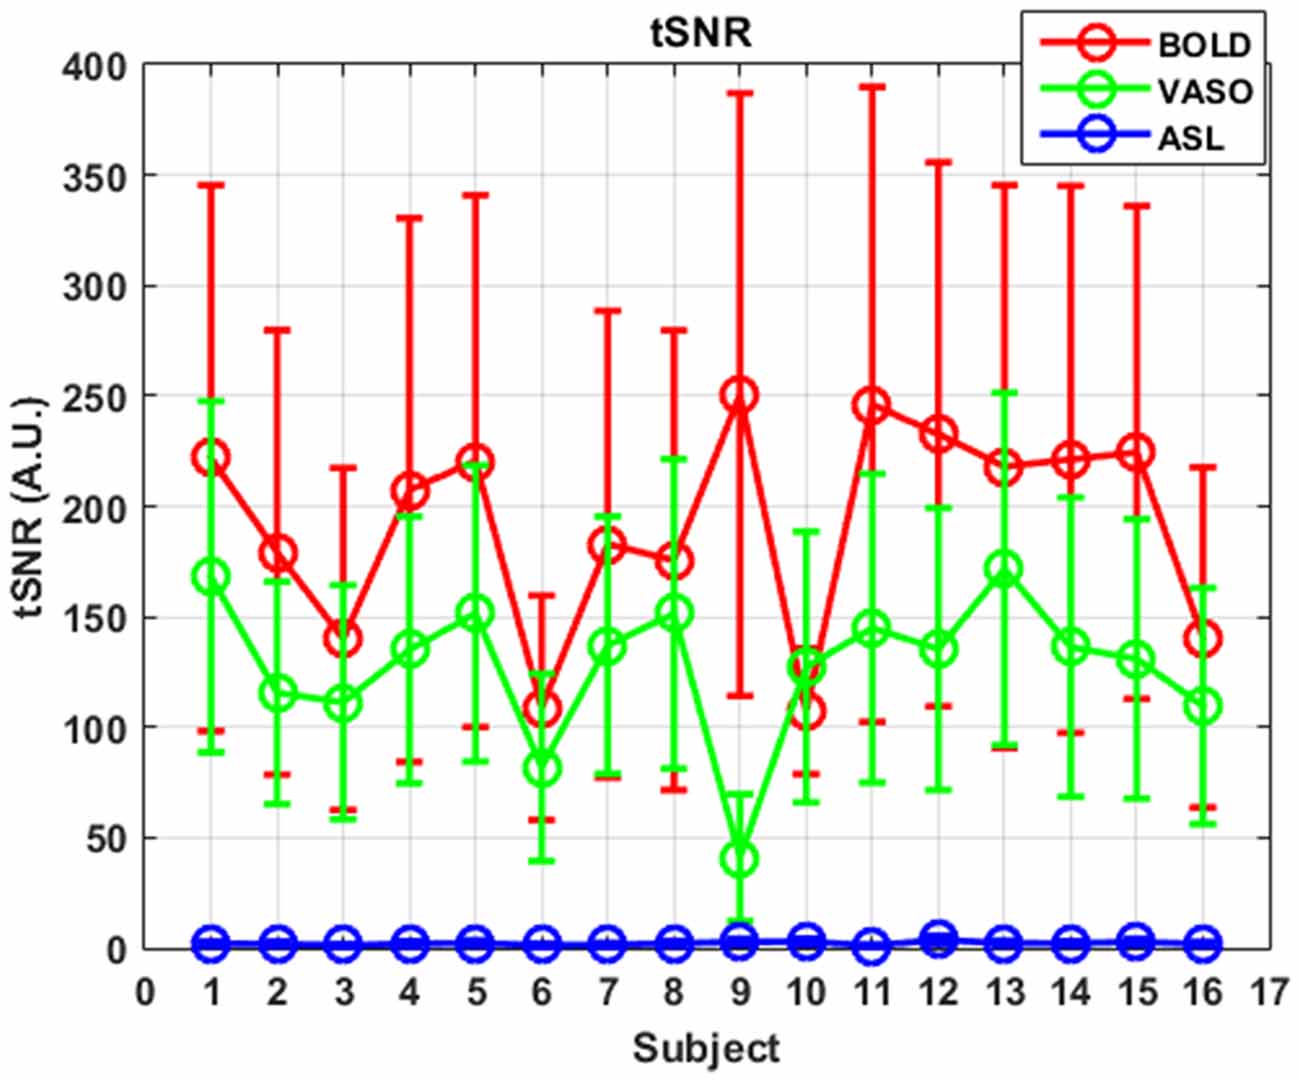
Figure 6. tSNR curves of three different contrasts along subjects. Mean values are marked with circles and standard deviations are shown as error bars.
The seed-based analysis of the BOLD, VASO and ASL resting-state data produced similar network maps (Figure 1). Differences mainly exist in the higher visual network of VASO and the sensorimotor network, and also in the salience network resulting from ASL. CBF connectivity was found to be less extensively distributed than BOLD connectivity, which supports the findings of previous studies (Viviani et al., 2011; Chen et al., 2015). According to the number of active voxels and summed t-scores at t > 7.68, ASL shows higher values in the sensorimotor network and the salience network than in VASO. This suggests that CBF-based measurements may provide better sensitivity for detecting resting-state functional activity than VASO in these networks. One reason behind these phenomena is the short post-labeling delay (PLD) used in the ASL sequence. Although a long delay is favorable to obtain more accurate values for white matter CBF, it leads to a lower SNR owing to the magnetization decay. Higher SNR due to the short PLD increases the sensitivity of ASL in detecting the resting state networks. A short PLD will underestimate the perfusion in regions with long blood arrival time (BAT), such as white matter. Long PLD can ensure that the majority of the voxels are filled with blood but leads to decreased SNR due to signal decay (Zhang et al., 2014). With a short PLD, there is a significant large-vessel contribution to the functional CBF (fCBF) signal (Gonzalez-At et al., 2000; Zappe et al., 2008). At lower resolutions (lower than 1 × 1 × 2 mm), a shorter PLD can lead to increased t-values. At high resolutions, a long PLD is needed to decrease the fCBF arising from vessels. The BAT in the above networks could be lower than in other networks. In future studies, the PLD needs to be carefully decided based on the BAT in the ROIs to be accessed.
In comparison to BOLD, VASO active regions are more confined, partially due to reduced contributions from large vessels (Magnuson et al., 2010; Kim and Ogawa, 2012). The 3D-GRASE VASO sequence is intrinsically spin-echo weighted with a short TE. Compared to the gradient-echo readout, the spin-echo signal sensitivity is significantly reduced due to the refocusing of the dephasing effect around large vessels. Both BOLD and ASL techniques in this study are based on GE EPI readouts. GE BOLD sensitivity for FC is larger compared to SE BOLD, and has been demonstrated in a small number of studies (Bandettini et al., 1994; Chiacchiaretta and Ferretti, 2015). T2 weighted SE sequences have been proposed as an interesting alternative when increased functional localization to the capillary bed is desired. This is because static dephasing effects around larger vessels are refocused by the 180° radiofrequency pulse, trading sensitivity for a higher spatial specificity for the microvasculature (Norris, 2012). Furthermore, the sensitivity of VASO is even lower due to the decreased SNR caused by the inversion pulse. Although 3D-GRASE VASO has lower sensitivity compared to BOLD, it exhibits less susceptibility distortion in the air-tissue regions such as those around the nasal sinuses, orbital frontal lobe and temporal lobe (Figure 5). SE EPI may, therefore, provide an interesting alternative for fMRI in regions affected by macroscopic magnetic field inhomogeneities (Schwarzbauer et al., 2010; Chiacchiaretta and Ferretti, 2015; Khatamian et al., 2016). In the future, the same readout for the three modalities should be chosen for a fair comparison. For VASO, a 3D readout, such as 3D fast GRE (Cheng et al., 2017), is needed for whole brain coverage.
It is also possible that the dynamics of spontaneous fluctuations in CBF, CBV and BOLD differ depending on their location within the brain. In other words, many of these network differences could be biologically driven rather than being driven by the specifics of the selected measurement technique.
One limitation of this study is that no respiratory, cardiac, or pulse oxygenation monitoring took place during scanning, and thus no RETROICOR type physiological signal correction was possible post hoc.
For FC analysis, a seed-based approach was applied in this study instead of independent component analysis (ICA). ICA decomposes fMRI data into a set of independent spatial maps and associated time courses and has the advantage of being a data-driven technique. However, although similar resting state networks can be obtained with either of the two analysis methods (Van Dijk et al., 2010), recent studies suggest that the seed-based method offers greater reliability and reproducibility of connectivity measures at the individual subject level (Franco et al., 2013). Since there is still a possibility that CBF-specific or CBV-specific networks could emerge from the data if a novel seed location were used, “negative controls” need to be performed. Networks from brain locations known to play no part in any network at all were extracted. The results from this type of negative control (Supplementary Figure S1) show no recognized network in all three modalities.
Except for the fluctuations in the low-frequency range from 0.01 Hz to 0.04 Hz, the spectral energy of ASL fluctuations in the default mode network show more high-frequency oscillations. These results are consistent with previous studies (Chuang et al., 2008; Miao et al., 2014). Unfiltered resting state ASL and BOLD spectra show well separated BOLD (<0.08 Hz) and CBF (>0.08 Hz) fluctuations in the frequency domain (Chuang et al., 2008), suggesting that BOLD contamination in the CBF signal can be suppressed by high-pass filtering the ASL data.
The correlation matrices of BOLD, VASO and ASL show a similar distribution of different networks. Further topological analysis of function networks can be performed based on these correlation matrices (Stam and Reijneveld, 2007; Melie-García et al., 2013; Liang et al., 2014).
Conclusion
This study demonstrates a comparison of resting-state brain activation detected by three different contrasts, including BOLD, CBV and CBF. The non-invasive and non-contrast agent methods of 3D-GRASE based VASO and pCASL were used to obtain separate CBV and CBF signals. Reliable brain networks were detected using VASO and ASL, and included the sensorimotor, the auditory, the primary visual, the higher visual, the default mode, the salience and the left/right executive control networks. Differences between the resting-state activation detected by ASL, VASO and BOLD might be technique-dependent due to the different tSNR, the short PLD in ASL and the spin-echo readout of VASO. It is also possible that the dynamics of spontaneous fluctuations in BOLD, CBV and CBF are biologically driven and differ depending on their location within the brain.
Author Contributions
KZ designed the work and drafted the article. KZ and DH collected the data, performed the data analysis and interpretation. DH and NS provided critical revision of the article. All authors approved the final version to be published.
Conflict of Interest Statement
The authors declare that the research was conducted in the absence of any commercial or financial relationships that could be construed as a potential conflict of interest.
Footnotes
Supplementary Material
The Supplementary Material for this article can be found online at: https://www.frontiersin.org/articles/10.3389/fnhum.2018.00443/full#supplementary-material
References
Bandettini, P. A., Wong, E. C., Jesmanowicz, A., Hinks, R. S., and Hyde, J. S. (1994). Spin-echo and gradient-echo EPI of human brain activation using BOLD contrast: a comparative-study at 1.5 T. NMR Biomed. 7, 12–20. doi: 10.1002/nbm.1940070104
Barbier, E. L., Lamalle, L., and Décorps, M. (2001). Methodology of brain perfusion imaging. J. Magn. Reson. Imaging 13, 496–520. doi: 10.1002/jmri.1073
Biswal, B., Yetkin, F. Z., Haughton, V. M., and Hyde, J. S. (1995). Functional connectivity in the motor cortex of resting human brain using echo-planar MRI. Magn. Reson. Med. 34, 537–541. doi: 10.1002/mrm.1910340409
Buckner, R. L., Andrews-Hanna, J. R., and Schacter, D. L. (2008). The brain’s default network: anatomy, function, and relevance to disease. Ann. N Y Acad. Sci. 1124, 1–38. doi: 10.1196/annals.1440.011
Buxton, R. B., Uludag, K., Dubowitz, D. J., and Liu, T. T. (2004). Modeling the hemodynamic response to brain activation. Neuroimage 23, S220–S233. doi: 10.1016/j.neuroimage.2004.07.013
Chen, J. J., Jann, K., and Wang, D. J. (2015). Characterizing resting-state brain function using arterial spin labeling. Brain Connect. 5, 527–542. doi: 10.1089/brain.2015.0344
Chen, J. J., and Pike, G. B. (2009). BOLD-specific cerebral blood volume and blood flow changes during neuronal activation in humans. NMR Biomed. 22, 1054–1062. doi: 10.1002/nbm.1411
Cheng, Y., Qin, Q., van Zijl, P. C. M., Pekar, J. J., and Hua, J. (2017). A three-dimensional single-scan approach for the measurement of changes in cerebral blood volume, blood flow, and blood oxygenation-weighted signals during functional stimulation. Neuroimage 147, 976–984. doi: 10.1016/j.neuroimage.2016.12.082
Chiacchiaretta, P., Cerritelli, F., Bubbico, G., Perrucci, M. G., and Ferretti, A. (2018). Reduced dynamic coupling between spontaneous BOLD-CBF fluctuations in older adults: a dual-echo pCASL study. Front. Aging Neurosci. 10:115. doi: 10.3389/fnagi.2018.00115
Chiacchiaretta, P., and Ferretti, A. (2015). Resting state BOLD functional connectivity at 3T: spin echo versus gradient echo EPI. PLoS One 10:e0120398. doi: 10.1371/journal.pone.0120398
Chuang, K. H., van Gelderen, P., Merkle, H., Bodurka, J., Ikonomidou, V. N., Koretsky, A. P., et al. (2008). Mapping resting-state functional connectivity using perfusion MRI. Neuroimage 40, 1595–1605. doi: 10.1016/j.neuroimage.2008.01.006
Dai, W., Garcia, D., de Bazelaire, C., and Alsop, D. C. (2008). Continuous flow-driven inversion for arterial spin labeling using pulsed radio frequency and gradient fields. Magn. Reson. Med. 60, 1488–1497. doi: 10.1002/mrm.21790
Davis, T. L., Kwong, K. K., Weisskoff, R. M., and Rosen, B. R. (1998). Calibrated functional MRI: mapping the dynamics of oxidative metabolism. Proc. Natl. Acad. Sci. U S A 95, 1834–1839. doi: 10.1073/pnas.95.4.1834
Donahue, M. J., Blicher, J. U., Ostergaard, L., Feinberg, D. A., MacIntosh, B. J., Miller, K. L., et al. (2009). Cerebral blood flow, blood volume, and oxygen metabolism dynamics in human visual and motor cortex as measured by whole-brain multi-modal magnetic resonance imaging. J. Cereb. Blood Flow Metab. 29, 1856–1866. doi: 10.1038/jcbfm.2009.107
Donahue, M. J., Juttukonda, M. R., and Watchmaker, J. M. (2017). Noise concerns and post-processing procedures in cerebral blood flow (CBF) and cerebral blood volume (CBV) functional magnetic resonance imaging. Neuroimage 154, 43–58. doi: 10.1016/j.neuroimage.2016.09.007
Fornito, A., and Bullmore, E. T. (2010). What can spontaneous fluctuations of the blood oxygenation-level-dependent signal tell us about psychiatric disorders? Curr. Opin. Psychiatry 23, 239–249. doi: 10.1097/yco.0b013e328337d78d
Fox, P. T., and Raichle, M. E. (1986). Focal physiological uncoupling of cerebral blood flow and oxidative metabolism during somatosensory stimulation in human subjects. Proc. Natl. Acad. Sci. U S A 83, 1140–1144. doi: 10.1073/pnas.83.4.1140
Fox, P. T., Raichle, M. E., Mintun, M. A., and Dence, C. (1988). Nonoxidative glucose consumption during focal physiologic neural activity. Science 241, 462–464. doi: 10.1126/science.3260686
Fox, M. D., Snyder, A. Z., Vincent, J. L., Corbetta, M., Van Essen, D. C., and Raichle, M. E. (2005). The human brain is intrinsically organized into dynamic, anticorrelated functional networks. Proc. Natl. Acad. Sci. U S A 102, 9673–9678. doi: 10.1073/pnas.0504136102
Franco, A. R., Mannell, M. V., Calhoun, V. D., and Mayer, A. R. (2013). Impact of analysis methods on the reproducibility and reliability of resting-state networks. Brain Connect. 3, 363–374. doi: 10.1089/brain.2012.0134
Fukunaga, M., Horovitz, S. G., de Zwart, J. A., van Gelderen, P., Balkin, T. J., Braun, A. R., et al. (2008). Metabolic origin of BOLD signal fluctuations in the absence of stimuli. J. Cereb. Blood Flow Metab. 28, 1377–1387. doi: 10.1038/jcbfm.2008.25
Golay, X., Hendrikse, J., and Lim, T. C. (2004). Perfusion imaging using arterial spin labeling. Top. Magn. Reson. Imaging 15, 10–27. doi: 10.1097/00002142-200402000-00003
Gonzalez-At, J. B., Alsop, D. C., and Detre, J. A. (2000). Cerebral perfusion and arterial transit time changes during task activation determined with continuous arterial spin labeling. Magn. Reson. Med. 43, 739–746. doi: 10.1002/(sici)1522-2594(200005)43:5<739::aid-mrm17>3.0.co;2-2
Greicius, M. D., Krasnow, B., Reiss, A. L., and Menon, V. (2003). Functional connectivity in the resting brain: a network analysis of the default mode hypothesis. Proc. Natl. Acad. Sci. U S A 100, 253–258. doi: 10.1073/pnas.0135058100
Gunther, M., Oshio, K., and Feinberg, D. A. (2005). Single-shot 3D imaging techniques improve arterial spin labeling perfusion measurements. Magn. Reson. Med. 54, 491–498. doi: 10.1002/mrm.20580
Hampson, M., Driesen, N. R., Skudlarski, P., Gore, J. C., and Constable, R. T. (2006). Brain connectivity related to working memory performance. J. Neurosci. 26, 13338–13343. doi: 10.1523/JNEUROSCI.3408-06.2006
Hoge, R. D., Atkinson, J., Gill, B., Crelier, G. R., Marrett, S., and Pike, G. B. (1999). Linear coupling between cerebral blood flow and oxygen consumption in activated human cortex. Proc. Natl. Acad. Sci. U S A 96, 9403–9408. doi: 10.1073/pnas.96.16.9403
Jann, K., Gee, D. G., Kilroy, E., Schwab, S., Smith, R. X., Cannon, T. D., et al. (2015). Functional connectivity in BOLD and CBF data: similarity and reliability of resting brain networks. Neuroimage 106, 111–122. doi: 10.1016/j.neuroimage.2014.11.028
Jin, T., and Kima, S. G. (2008). Improved cortical-layer specificity of vascular space occupancy fMRI with slab inversion relative to spin-echo BOLD at 9.4 T. Neuroimage 40, 59–67. doi: 10.1016/j.neuroimage.2007.11.045
Khatamian, Y. B., Golestani, A. M., Ragot, D. M., and Chen, J. J. (2016). Spin-echo resting-state functional connectivity in high-susceptibility regions: accuracy, reliability, and the impact of physiological noise. Brain Connect. 6, 283–297. doi: 10.1089/brain.2015.0365
Kim, S. G., and Ogawa, S. (2012). Biophysical and physiological origins of blood oxygenation level-dependent fMRI signals. J. Cereb. Blood Flow Metab. 32, 1188–1206. doi: 10.1038/jcbfm.2012.23
Krieger, S. N., Huber, L., Poser, B. A., Turner, R., and Egan, G. F. (2015). Simultaneous acquisition of cerebral blood volume-, blood flow-, and blood oxygenation-weighted MRI signals at ultra-high magnetic field. Magn. Reson. Med. 74, 513–517. doi: 10.1002/mrm.25431
Li, Z. J., Zhu, Y. S., Childress, A. R., Detre, J. A., and Wang, Z. (2012). Relations between BOLD fMRI-derived resting brain activity and cerebral blood flow. PLoS One 7:e44556. doi: 10.1371/journal.pone.0044556
Liang, X., Connelly, A., and Calamante, F. (2014). Graph analysis of resting-state ASL perfusion MRI data: nonlinear correlations among CBF and network metrics. Neuroimage 87, 265–275. doi: 10.1016/j.neuroimage.2013.11.013
Lu, H., Clingman, C., Golay, X., and van Zijl, P. C. (2004). Determining the longitudinal relaxation time (T1) of blood at 3.0 Tesla. Magn. Reson. Med. 52, 679–682. doi: 10.1002/mrm.20178
Lu, H., and van Zijl, P. C. (2012). A review of the development of vascular-space-occupancy (VASO) fMRI. Neuroimage 62, 736–742. doi: 10.1016/j.neuroimage.2012.01.013
Magnuson, M., Majeed, W., and Keilholz, S. D. (2010). Functional connectivity in blood oxygenation level-dependent and cerebral blood volume-weighted resting state functional magnetic resonance imaging in the rat brain. J. Magn. Reson. Imaging 32, 584–592. doi: 10.1002/jmri.22295
Melie-García, L., Sanabria-Diaz, G., and Sánchez-Catasús, C. (2013). Studying the topological organization of the cerebral blood flow fluctuations in resting state. Neuroimage 64, 173–184. doi: 10.1016/j.neuroimage.2012.08.082
Menon, V. (2011). Large-scale brain networks and psychopathology: a unifying triple network model. Trends Cogn. Sci. 15, 483–506. doi: 10.1016/j.tics.2011.08.003
Miao, X., Gu, H., Yan, L., Lu, H., Wang, D. J., Zhou, X. J., et al. (2014). Detecting resting-state brain activity by spontaneous cerebral blood volume fluctuations using whole brain vascular space occupancy imaging. Neuroimage 84, 575–584. doi: 10.1016/j.neuroimage.2013.09.019
Norris, D. G. (2012). Spin-echo fMRI: the poor relation? Neuroimage 62, 1109–1115. doi: 10.1016/j.neuroimage.2012.01.003
Okell, T. W., Chappell, M. A., Woolrich, M. W., Günther, M., Feinberg, D. A., and Jezzard, P. (2010). Vessel-encoded dynamic magnetic resonance angiography using arterial spin labeling. Magn. Reson. Med. 64, 430–438. doi: 10.1002/mrm.22412
Poser, B. A., and Norris, D. G. (2009). 3D single-shot VASO using a Maxwell gradient compensated GRASE sequence. Magn. Reson. Med. 62, 255–262. doi: 10.1002/mrm.22000
Poser, B. A., and Norris, D. G. (2011). Application of whole-brain CBV-weighted fMRI to a cognitive stimulation paradigm: robust activation detection in a stroop task experiment using 3D GRASE VASO. Hum. Brain Mapp. 32, 974–981. doi: 10.1002/hbm.21083
Raichle, M. E. (1998). Behind the scenes of functional brain imaging: a historical and physiological perspective. Proc. Natl. Acad. Sci. U S A 95, 765–772. doi: 10.1073/pnas.95.3.765
Raichle, M. E., MacLeod, A. M., Snyder, A. Z., Powers, W. J., Gusnard, D. A., and Shulman, G. L. (2001). A default mode of brain function. Proc. Natl. Acad. Sci. U S A 98, 676–682. doi: 10.1073/pnas.98.2.676
Salvador, R., Sarro, S., Gomar, J. J., Ortiz-Gil, J., Vila, F., Capdevila, A., et al. (2010). Overall brain connectivity maps show cortico-subcortical abnormalities in schizophrenia. Hum. Brain Mapp. 31, 2003–2014. doi: 10.1002/hbm.20993
Schwarzbauer, C., Mildner, T., Heinke, W., Brett, M., and Deichmann, R. (2010). Dual echo EPI—the method of choice for fMRI in the presence of magnetic field inhomogeneities? Neuroimage 49, 316–326. doi: 10.1016/j.neuroimage.2009.08.032
Sforazzini, F., Schwarz, A. J., Galbusera, A., Bifone, A., and Gozzi, A. (2014). Distributed BOLD and CBV-weighted resting-state networks in the mouse brain. Neuroimage 87, 403–415. doi: 10.1016/j.neuroimage.2013.09.050
Shih, Y. Y., Wey, H. Y., De La Garza, B. H., and Duong, T. Q. (2011). Striatal and cortical BOLD, blood flow, blood volume, oxygen consumption, and glucose consumption changes in noxious forepaw electrical stimulation. J. Cereb. Blood Flow Metab. 31, 832–841. doi: 10.1038/jcbfm.2010.173
Stam, C. J., and Reijneveld, J. C. (2007). Graph theoretical analysis of complex networks in the brain. Nonlinear Biomed. Phys. 1:3. doi: 10.1186/1753-4631-1-3
Storti, S. F., Boscolo Galazzo, I., Montemezzi, S., Menegaz, G., and Pizzini, F. B. (2017). Dual-echo ASL contributes to decrypting the link between functional connectivity and cerebral blow flow. Hum. Brain Mapp. 38, 5831–5844. doi: 10.1002/hbm.23804
Tzourio-Mazoyer, N., Landeau, B., Papathanassiou, D., Crivello, F., Etard, O., Delcroix, N., et al. (2002). Automated anatomical labeling of activations in SPM using a macroscopic anatomical parcellation of the MNI MRI single-subject brain. Neuroimage 15, 273–289. doi: 10.1006/nimg.2001.0978
Van Dijk, K. R. A., Hedden, T., Venkataraman, A., Evans, K. C., Lazar, S. W., and Buckner, R. L. (2010). Intrinsic functional connectivity as a tool for human connectomics: theory, properties, and optimization. J. Neurophysiol. 103, 297–321. doi: 10.1152/jn.00783.2009
Viviani, R., Messina, I., and Walter, M. (2011). Resting state functional connectivity in perfusion imaging: correlation maps with BOLD connectivity and resting state perfusion. PLoS One 6:e27050. doi: 10.1371/journal.pone.0027050
Wang, Z., Aguirre, G. K., Rao, H., Wang, J., Fernandez-Seara, M. A., Childress, A. R., et al. (2008). Empirical optimization of ASL data analysis using an ASL data processing toolbox: ASLtbx. Magn. Reson. Imaging 26, 261–269. doi: 10.1016/j.mri.2007.07.003
Wu, W. C., Fernández-Seara, M., Detre, J. A., Wehrli, F. W., and Wang, J. (2007). A theoretical and experimental investigation of the tagging efficiency of pseudocontinuous arterial spin labeling. Magn. Reson. Med. 58, 1020–1027. doi: 10.1002/mrm.21403
Wu, C. W., Gu, H., Lu, H., Stein, E. A., Chen, J. H., and Yang, Y. (2009). Mapping functional connectivity based on synchronized CMRO2 fluctuations during the resting state. Neuroimage 45, 694–701. doi: 10.1016/j.neuroimage.2008.12.066
Zappe, A. C., Pfeuffer, J., Merkle, H., Logothetis, N. K., and Goense, J. B. (2008). The effect of labeling parameters on perfusion-based fMRI in nonhuman primates. J. Cereb. Blood Flow Metab. 28, 640–652. doi: 10.1038/sj.jcbfm.9600564
Zhang, K., Herzog, H., Mauler, J., Filss, C., Okell, T. W., Kops, E. R., et al. (2014). Comparison of cerebral blood flow acquired by simultaneous [15O]water positron emission tomography and arterial spin labeling magnetic resonance imaging. J. Cereb. Blood Flow Metab. 34, 1373–1380. doi: 10.1038/jcbfm.2014.92
Keywords: resting-state fMRI, brain networks, cerebral blood flow, cerebral blood volume, VASO, ASL, BOLD
Citation: Zhang K, Huang D and Shah NJ (2018) Comparison of Resting-State Brain Activation Detected by BOLD, Blood Volume and Blood Flow. Front. Hum. Neurosci. 12:443. doi: 10.3389/fnhum.2018.00443
Received: 12 June 2018; Accepted: 15 October 2018;
Published: 08 November 2018.
Edited by:
Hubert Preissl, Institut für Diabetesforschung und Metabolische Erkrankungen (IDM), GermanyReviewed by:
Owen T. Carmichael, Pennington Biomedical Research Center, United StatesAntonio Ferretti, Università degli Studi G. d’Annunzio Chieti e Pescara, Italy
Copyright © 2018 Zhang, Huang and Shah. This is an open-access article distributed under the terms of the Creative Commons Attribution License (CC BY). The use, distribution or reproduction in other forums is permitted, provided the original author(s) and the copyright owner(s) are credited and that the original publication in this journal is cited, in accordance with accepted academic practice. No use, distribution or reproduction is permitted which does not comply with these terms.
*Correspondence: N. Jon Shah, bi5qLnNoYWhAZnotanVlbGljaC5kZQ==
† Present address: Ke Zhang, Department of Radiology, German Cancer Research Center, Heidelberg, Germany
Dengfeng Huang, Department of Radiology, Medical Physics, University Medical Center Freiburg, Freiburg, Germany