
94% of researchers rate our articles as excellent or good
Learn more about the work of our research integrity team to safeguard the quality of each article we publish.
Find out more
ORIGINAL RESEARCH article
Front. Neurol. , 07 August 2020
Sec. Movement Disorders
Volume 11 - 2020 | https://doi.org/10.3389/fneur.2020.00821
This article is part of the Research Topic Measurement Tools for Clinical Assessment, Characterization and Neurorehabilitation of Parkinson's Disease View all 21 articles
 Hong-Zhe Bei1,2†
 Ju-Ping Chen3†
 Cheng-Jie Mao2,4*
 Ying-Chun Zhang5
 Jing Chen2,4
 Qiao-Qiao Du6
 Fei Xue2
 Pei-Cheng He2
 Hong Jin2
 Fu-Yu Wang2
 Chun-Feng Liu2,4,7
Background: Decreased brainstem raphe (BR) echogenicity detected by transcranial parenchymal sonography (TCS) is associated with depression in psychiatric and neurologic diseases. However, previous studies focusing on the relationship between motor and non-motor symptoms and echogenicity changes in BR in patients with PD yielded controversial results.
Objectives: To investigate the relationship between echogenicity changes in BR detected by TCS and motor and a series of non-motor symptoms in patients with PD.
Methods: Consecutive PD patients were recruited from the Second Affiliated Hospital of Soochow University. Demographic information and Motor and non-motor symptoms for all subjects were collected. TCS was used to detect the echogenicity changes in BR in PD patients.
Results: One hundred and thirty-five consecutive patients with PD were enrolled in the study. The BR abnormal rate was significantly higher in PD patients with anxiety (p = 0.003) or depression (p = 0.022) than patients without. Spearman correlation analyses showed that Hamilton Rating Scale for Depression(HRSD) (r = 0.274, p = 0.002) and Parkinson's Disease Questionnaire 39-item(PDQ-39) (r = 0.208, p = 0.034) scores were positively correlated with abnormal BR echogenicity. Multivariate logistic regression analyses showed that HRSD and HAMA scores were associated with BR hypoechogenicity, the corresponding odds ratios (confidence intervals) were 1.07 (95% CI, 1.01–1.13) and 1.10(1.01–1.18), respectively. However, the PDQ-39 score was not associated with BR hypoechogenicity.
Conclusion: The abnormal reduction in BR echogenicity detected by TCS is associated with depression and anxiety, but not motor symptoms in PD patients.
Parkinson's disease (PD) is pathologically characterized by degeneration and loss of dopamine neurons in the substantia nigra (SN) and decreased dopamine content in the striatum, which result in motor symptoms such as tremor, rigidity and bradykinesia, and non-motor symptoms such as psychiatric symptoms, cognitive dysfunction, autonomic dysfunction, sleep disorder, and abnormal sensation. Transcranial parenchymal sonography (TCS), a type of non-invasive neuroimaging technology can detect brain parenchymal lesions directly in vivo and was first used in PD patients by Becker in 1995 (1). Abnormal hyperechogenicity of the SN is also considered to be a prodromal marker of PD. The sensitivity and specificity of SN hyperechogenicity for predicting PD are 82.4 and 82.5%, respectively (2). Recent studies have shown that patients with depression have abnormal brainstem raphe (BR) echogenicity (3–5). Combining SN hyperechogenicity with BR hypoechogenicity may be useful to detect individuals at risk for developing PD (6). The incidence of BR hypoechogenicity was much higher in PD patients with depression than patients without depression and controls (7, 8). Besides depression, reduced echogenicity of BR also indicated an increased risk of other non-motor symptoms in PD patients, such as urinary incontinence (9). However, previous studies focusing on the relationship between motor and non-motor symptoms and echogenicity changes in BR in patients with PD yielded controversial results. For example, Bouwmans et al. found no association between depression and hyperechogenic SN or hypoechogenic BR in PD patients (10).
In this study, TCS was used to detect the changes in BR echogenicity in PD patients whose motor and non-motor symptoms were comprehensively evaluated by the Unified Parkinson's Disease Rating Scale (UPDRS) and several non-motor symptom scales. We aimed to investigate the relationship between the changes in BR echogenicity and motor and a series of non-motor symptoms in PD patients.
All PD subjects come from outpatient and hospitalized patients in the Second Affiliated Hospital of Soochow University from January 2011 to December 2015 and satisfied the UK Parkinson's Disease Society Brain Bank clinical diagnostic criteria (11). All subjects underwent TCS. Subjects were excluded if they had a secondary parkinsonism syndrome, deep brain stimulation, parkinson-plus syndrome, atypical parkinsonian syndrome, malignant neoplasm, epilepsy, or severe cardiopulmonary disease. Subjects who could not complete the motor or non-motor symptoms evaluation were also excluded. The flow chart shows the procedure for subject enrollment (Figure 1).
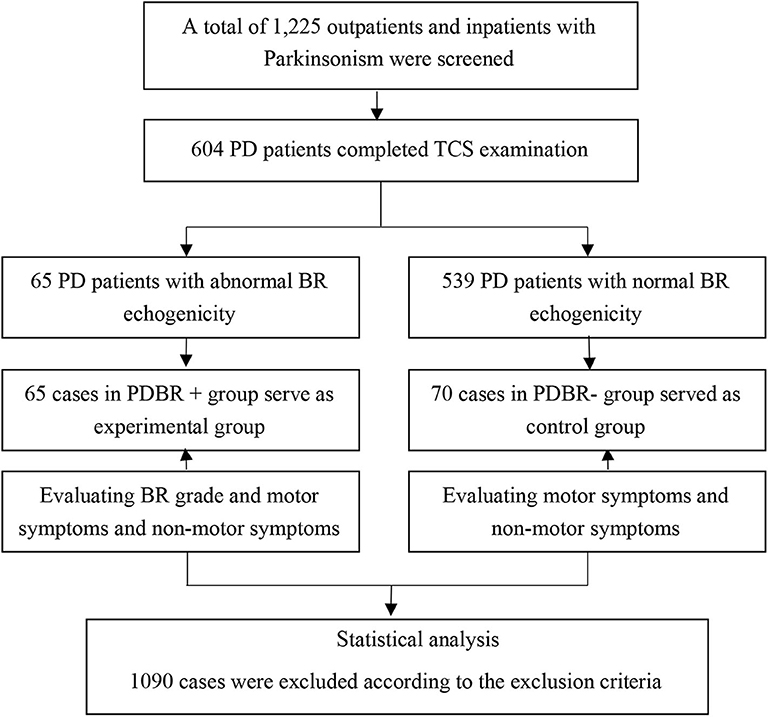
Figure 1. Flowchart of patient enrollment. This figure shows how the subjects enrolled in the study.
Demographic data, including age, gender, age at onset, disease duration, and detailed medical history were collected. All subjects were carefully evaluated by a movement disorder specialist. The UPDRS (12) and Hoehn & Yahr (H&Y) (13) scale were applied in all PD subjects during the “ON” medication state to evaluate motor symptoms. A Chinese version of the Montreal Cognitive Assessment (MoCA) (14) questionnaire (Beijing version) were used to evaluate the cognitive function of these patients. Neuropsychiatric symptoms were evaluated by the Hamilton Rating Scale for Depression (HRSD-24) (15)and the Hamilton Anxiety Scale (HAMA-14) (16). For HRSD-24, each item can range from 0 to 4 points. Patients with PD with HRSD-24 score ≥8 were defined as PD with depression. Parkinson's Disease Questionnaire 39-item (PDQ-39) (17) were also used in PD patients (Figure 1).
Calculation of a daily levodopa equivalent dose (LED) for each patient was based on theoretical equivalence to levodopa as follows: levodopa dose + levodopa dose × 1/3 if on entacapone + piribedil (mg) + pramipexole (mg) 100 + selegiline (mg) × 10 +amantadine (mg) + controlled release levodopa (mg) × 0.75.
Only one patient was on the treatment with antidepressants.
A color-coded phased-array ultrasound system, equipped with a 2.5 MHz transducer (Sequoia 512, Siemens Medical Solutions USA, Inc. 4V1C transducer) was used to detect signals through the right and left temporal bone windows in the axial plane (18–21).
The midbrain was identified as a butterfly-shaped low-echogenic area, surrounded by the hyperechogenic basal cistern. SN is a hyperechogenic area with respect to surrounding structures. SN echogenic size measurements were performed on axial TCS scans automatically after manually encircling the outer circumference of the SN's echogenic area. Areas with SN echogenicity ≥0.20 cm2 on either side were classified as hyperechogenic (22).
The BR was detected as a hyperechogenic continuous line in the middle of the midbrain with the same echogenicity as the red nucleus. The best images were selected for the study (20, 21). BR echogenicity was categorized according to current guideline recommendations on 2 grades of BR echogenicity (normal vs. reduced echogenicity) (20). Patients with BR echogenicity same as red nucleus were determined as BR echogenicity normal group, while patients with BR echogenicity as reduced, interrupt or not visible were determined as BR echogenicity abnormal group in this study (Figure 2).
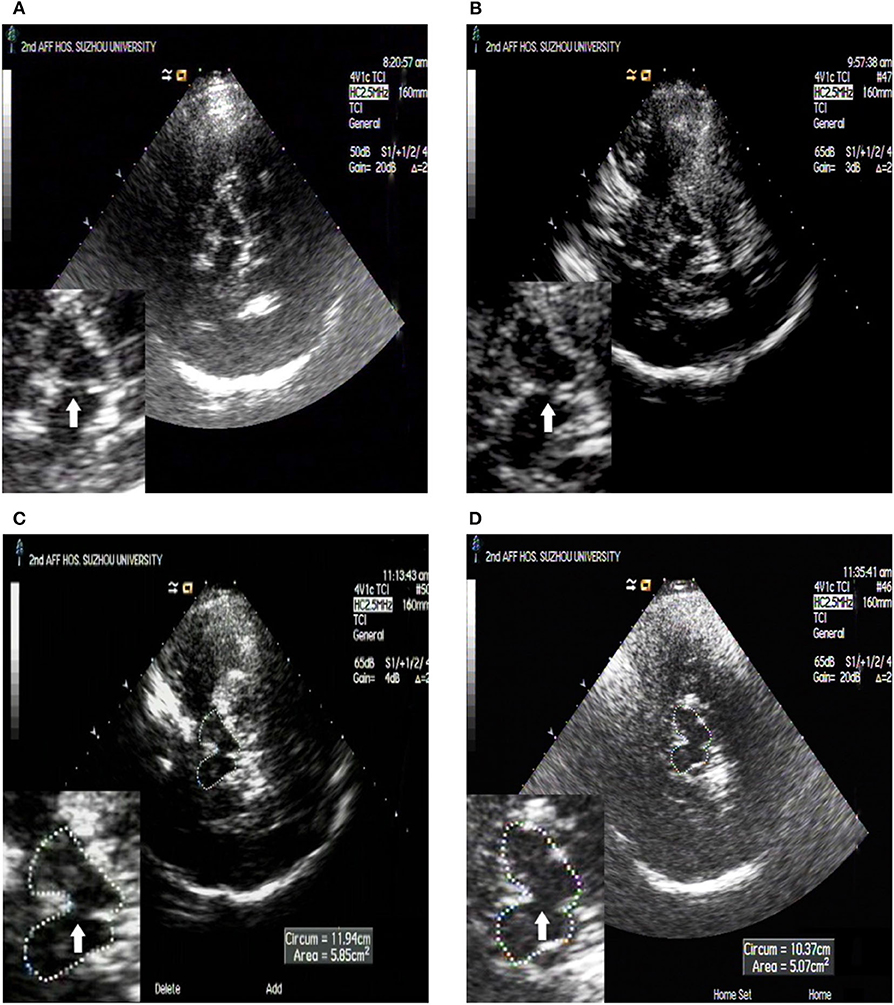
Figure 2. TCS images of BR echogenicity. BR semiquantitatively rated grade scale: the white arrow shows the BR. (A) Normal raphe, with the same echogenicity as the red nucleus according to previous recommendations; (B) Decreased raphe, echogenic raphe was decreased compared with the red nucleus but it was continuous; (C) Interrupted raphe, echogenic raphe was interrupted compared with the red nucleus; (D) Invisible raphe, echogenic raphe was not visible.
All TCS assessments were performed by two experienced examiners who were blinded to the clinical data. Patients with different BR grades as rated by the two sonologists were excluded.
This study was approved by the ethics committee of our hospital and an informed consent was obtained from each patient.
Normally distributed continuous variables are presented as means ± standard deviations (SD), skewed distributed continuous variables are presented as median (interquartile range), and comparisons between two groups were performed by the Student's t-test or non-parametric test, respectively. Categorical variables are described as frequencies (percentages) and compared between groups using the Chi-square test. Bonferroni correction has been applied for multiple comparisons. Spearman rank correlation and multivariate logistic regression analysis were used to assess the correlation between BR echogenicity score and the motor and non-motor symptoms. All p-values were 2 tailed, and a significance level of 0.05 was used. Statistical analysis was conducted using SPSS version 21 (IBM SPSS, Chicago, IL, USA).
There were 652 PD patients undergoing the TCS examination. Forty-eight (7.36%, 48/652) PD patients were excluded due to insufficient transtemporal bone window. Six hundred four patients with PD completed the TCS examination. One hundred and thirty-five consecutive patients with PD were enrolled in this study, eventually.
Sixty-five (35 males and 30 females) patients had abnormal BR echogenicity and were aged 64.15 ± 8.42 years, age at onset was 60.13 ± 8.63 years, and disease duration was 46.5 (42.25) months. Seventy (48 males and 22 females) patients had normal BR echogenicity. The average age of the patients was 63.13 ± 9.36 years, age at onset was 59.66 ± 9.60 years, and disease duration was 33–39 months. No statistically significant differences were observed for gender, age, age at onset, disease duration, and education between the BR echogenicity normal group and abnormal group (Table 1).
The HRSD (Z = 3.052, p = 0.002), HAMA (t = 2.472, p = 0.017), and PDQ-39 (Z = 2.117, p = 0.034) scores were higher in the BR abnormal group than in the BR normal group. The BR abnormal rate was significantly higher in PD patients with anxiety (p = 0.003) or depression (p = 0.022) than patients without. For multiple comparisons, the threshold for statistical significance after Bonferroni correction was set at p < 0.007 (correcting for 7 comparisons: 0.05/7 ≈ 0.007). HRSD was statistically significant after Bonferroni correction (p < 0.007) (Table 2).
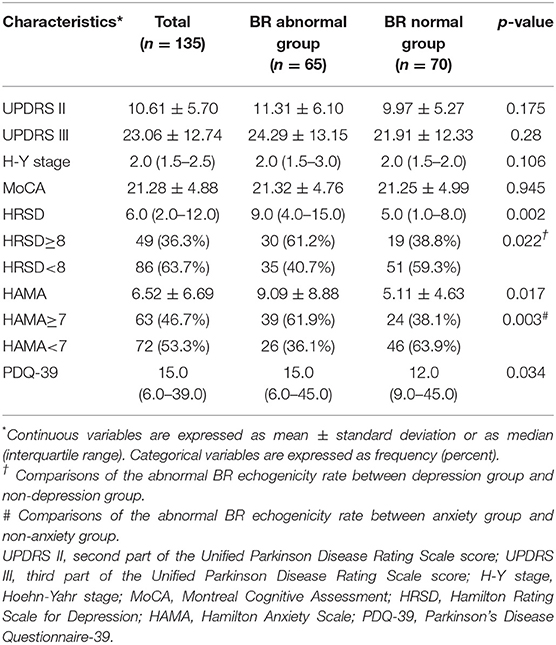
Table 2. Comparison of motor and non-motor symptoms between the abnormal and normal BR echogenicity group.
Spearman rank correlation analysis revealed that abnormal BR echogenicity was positively correlated with the HRSD and PDQ-39 score, with low correlation coefficients (r = 0.274, p = 0.002 for HRSD; r = 0.208, p = 0.034 for PDQ-39). Spearman rank correlation analysis suggested a marginally statistical significant association between BR hypoechogenicity and HAMA score (r = 0.201, p = 0.047). After adjusting age, gender, age at onset of PD, education, disease duration, LED, UPDRS II, UPDRS III, and H-Y stage, only HRSD, and HAMA score were associated with BR hypoechogenicity with ORs 1.07 (95% CI, 1.01–1.13), and 1.10 (1.01–1.18), respectively (Tables 3, 4).
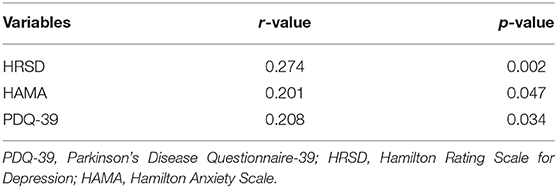
Table 3. Spearman rank correlation analysis between BR echogenicity and depression, anxiety and PDQ-39.
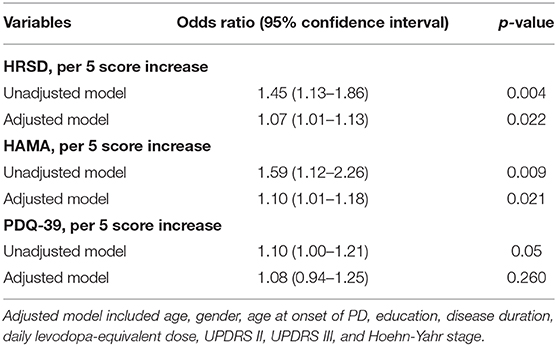
Table 4. Multivariate logistic regression analysis of depression, anxiety, and PDQ-39 with BR hypoechogenicity.
It has been proved that TCS is reliable and sensitive in detecting basal ganglia abnormalities, e.g., of SN in PD. Many studies focusing on the echogenicity of the SN and PD diagnosis or clinical characteristics. Hyperechogenicity of SN has high diagnostic accuracy in the diagnosis of PD patients from healthy controls (23). In addition, PD patients with depression had marked SN hyperechogenicity and reduced echogenicity of BR indicating SN hyperechogenicity combined with reduced echogenicity of BR might be useful to detect individuals at risk for developing PD (24). Some studies have demonstrated a correlation between abnormal BR echogenicity and depression (3). BR hypoechogenicity is more common in certain types of PD, such as glucocerebrosidase gene(GBA) mutations related to PD (25). The present study aims to investigate the relationship between changes in BR echogenicity and motor and a series of non-motor symptoms, such as depression, anxiety, and cognition in PD patients.
Spearman rank correlation analysis showed weak correlations between HRSD and PDQ-39 scores and the reduction in BR echogenicity, and multivariate logistic regression revealed that HRSD and HAMA scores were associated with BR hypoechogenicity in the adjusted model. No association was found between PDQ-39 scores and BR hypoechogenicity. Cho et al. found that decreased BR echogenicity was much higher in PD patients with depression (7). PD patients with depression and patients with depression only showed a significantly higher presence of abnormal BR than those without depression and healthy controls (6). A significant direct relationship was also found between the BDI score and BR hypoechogenicity (8). Our study confirmed the relationship between BR hypoechogenicity and depression. BR alterations in TCS may be a biomarker for depression and apathy in PD patients (26). Decreased BR echogenicity indicates morphological alterations in the midbrain which is involved in the pathogenesis of depression not only in PD patients with depression but also in unipolar depression patients (6, 8, 25). Abnormal BR echogenicity could also be seen in de novo PD patients with depression, which could also be found in both control and PD groups without depression (7). These TCS findings support the hypothesis of a pathogenetic link between depression and PD (9). However, conflicting findings have also been reported (6, 10). Bouwmans et al. found no association between depression and hyperechogenic SN or hypoechogenic BR in PD patients (10). The main reason for the difference may be the disease severity. We noticed that the patients included in their study were early PD patients. UPDRS III score of patients was significantly lower than the score of our patients and others (10).
Furthermore, spearman rank correlation analysis suggested a marginal statistical significance association between BR hypoechogenicity and HAMA score. Besides the dopamine system, neurodegeneration of neurons involved several other neurotransmitter systems, such as the norepinephrine system, serotonin system, and acetylcholine system. BR is the main source of serotonin in the prefrontal cortex. Changes in BR echogenicity may reflect a decline in the function of the serotonin system (27). The overlap of widespread dysfunction of the limbic system and complex neurotransmission abnormalities in PD patients with depression and anxiety may explain the correlation between reduced echogenicity of BR and anxiety (28).
In this study, we noticed that only 48 (7.36%, 48/652) PD patients were excluded due to insufficient transtemporal bone window, which is remarkably lower compared to other studies in the Asian population (7, 29), but consistent with our previous studies (30–32). This may be because of the 2.5 MHz transducer we used (Sequoia 512, Siemens Medical Solutions USA, Inc. 4V1C transducer), which was compared with other transducers and showed the best penetration.
There were some limitations of the study. This was a cross-sectional study, and we were unable to draw a conclusion about the relationship between changes in BR echogenicity and the clinical manifestations of PD as the disease progressed. Also, the sample size in this study was relatively small, and studies with a large number of PD patients from multiple centers are needed to confirm the results.
In summary, an abnormal reduction in BR echogenicity detected by TCS is associated with depression and anxiety, but not motor symptoms in PD patients.
The raw data supporting the conclusions of this article will be made available by the authors, without undue reservation.
The studies involving human participants were reviewed and approved by the ethics committee of the Second Affiliated Hospital of Soochow University. The patients/participants provided their written informed consent to participate in this study.
H-ZB, J-PC, and C-JM designed the study, collected the data, and drafted the manuscript. Y-CZ, JC, FX, P-CH, HJ, and F-YW collected the data. Q-QD analyzed the data. C-FL designed the study. All authors contributed to the article and approved the submitted version.
This work was supported by the National Key R&D Program of China (grant number 2017YFC0909100); National Natural Science Foundation of China (grant number 81801258); Youth Fund of Jiangsu Province's Natural Science Foundation (grant number BK20170355); Social Development Projects in Jiangsu Province (grant number BE2017653); Joint Project of Science and Technology Million Project of Inner Mongolia Medical University [grant number YKD2017KJBW(LH)051]; Jiangsu Provincial Key R&D Program (grant number BE2018658); Gusu Health Talents Training Project (GSWS2019041); Jiangsu Provincial Medical Key Discipline Project (grant number ZDXKB2016022); Suzhou Clinical Research Center of Neurological Disease (grant number Szzx201503); and Key and Youth Projects of Changshu Health Commission (csws201824, cswsq201801).
The authors declare that the research was conducted in the absence of any commercial or financial relationships that could be construed as a potential conflict of interest.
We thank the study participants and their relatives, and the clinical staff for their support and contribution to this study.
1. Becker G, Becker T, Struck M, Lindner A, Burzer K, Retz W, et al. Reduced echogenicity of brainstem raphe specific to unipolar depression: a transcranial color-coded real-time sonography study. Biol Psychiatry. (1995) 38:180–4. doi: 10.1016/0006-3223(94)00263-3
2. Berg D, Postuma RB, Adler CH, Bloem BR, Chan P, Dubois B, et al. MDS research criteria for prodromal parkinson's disease. Mov Disord. (2015) 30:1600–11. doi: 10.1002/mds.26431
3. Walter U, Skoloudik D. Transcranial sonography (TCS) of brain parenchyma in movement disorders: quality standards, diagnostic applications and novel technologies. Ultraschall Med. (2014) 35:322–31. doi: 10.1055/s-0033-1356415
4. Walter U, Prudente-Morrissey L, Herpertz SC, Benecke R, Hoeppner J. Relationship of brainstem raphe echogenicity and clinical findings in depressive states. Psychiatry Res. (2007) 155:67–73. doi: 10.1016/j.pscychresns.2006.12.001
5. Krogias C, Walter U. Transcranial sonography findings in depression in association with psychiatric and neurologic diseases: a review. J Neuroimaging. (2016) 26:257–63. doi: 10.1111/jon.12328
6. Liu XJ, Zhang L, Zhang YF, Xu W, Hu Y, Liu Y, et al. Echogenic alteration in the raphe nuclei measured by transcranial sonography in patients with parkinson disease and depression. Medicine. (2018) 97:e13524. doi: 10.1097/MD.0000000000013524
7. Cho JW, Baik JS, Lee MS. Mesencephalic midline change on transcranial sonography in early parkinson's disease patients with depression. J Neurol Sci. (2011) 310:50–2. doi: 10.1016/j.jns.2011.07.055
8. Toomsoo T, Randver R, Liepelt-Scarfone I, Kadastik-Eerme L, Asser T, Rubanovits I, et al. Prevalence of depressive symptoms and their association with brainstem raphe echogenicity in patients with parkinson's disease and non-PD controls. Psychiatry Res Neuroimaging. (2017) 268:45–49. doi: 10.1016/j.pscychresns.2017.08.005
9. Walter U, Skoloudik D, Berg D. Transcranial sonography findings related to non-motor features of parkinson's disease. J Neurol Sci. (2010) 289:123–7. doi: 10.1016/j.jns.2009.08.027
10. Bouwmans AE, Weber WE, Leentjens AF, Mess WH. Transcranial sonography findings related to depression in parkinsonian disorders: cross-sectional study in 126 patients. PeerJ. (2016) 4:e2037. doi: 10.7717/peerj.2037
11. Gelb DJ, Oliver E, Gilman S. Diagnostic criteria for parkinson disease. Arch Neurol. (1999) 56:33–9. doi: 10.1001/archneur.56.1.33
12. Goetz CG, Tilley BC, Shaftman SR, Stebbins GT, Fahn S, Martinez-Martin P, et al. Movement disorder society URTF movement disorder society-sponsored revision of the unified parkinson's disease rating scale (MDS-UPDRS): scale presentation and clinimetric testing results. Mov Disord. (2008) 23:2129–70. doi: 10.1002/mds.22340
13. Hoehn MM, Yahr MD. Parkinsonism: onset, progression and mortality. Neurology. (1967) 17:427–42. doi: 10.1212/WNL.17.5.427
14. Nasreddine ZS, Phillips NA, Bedirian V, Charbonneau S, Whitehead V, Collin I, et al. The montreal cognitive assessment, MoCA: a brief screening tool for mild cognitive impairment. J Am Geriatr Soc. (2005) 53:695–9. doi: 10.1111/j.1532-5415.2005.53221.x
15. Hamilton M. A rating scale for depression. J Neurol Neurosurg Psychiatry. (1960) 23:56–62. doi: 10.1136/jnnp.23.1.56
16. Hamilton M. The assessment of anxiety states by rating. Br J Med Psychol. (1959) 32:50–5. doi: 10.1111/j.2044-8341.1959.tb00467.x
17. Jenkinson C, Fitzpatrick R, Peto V, Greenhall R, Hyman N. The parkinson's disease questionnaire (PDQ-39): development and validation of a parkinson's disease summary index score. Age Ageing. (1997) 26:353–7. doi: 10.1093/ageing/26.5.353
18. Becker G, Naumann M, Scheubeck M, Hofmann E, Deimling M, Lindner A, et al. Comparison of transcranial sonography, magnetic resonance imaging, and single photon emission computed tomography findings in idiopathic spasmodic torticollis. Mov Disord. (1997) 12:79–88. doi: 10.1002/mds.870120114
19. Becker G, Berg D, Kruse N, Schroder U, Warmuth-Metz M, Rieckmann P, et al. Evidence for shoulder girdle dystonia in selected patients with cervical disc prolapse. Mov Disord. (2002) 17:710–16. doi: 10.1002/mds.10132
20. Walter U, Behnke S, Eyding J, Niehaus L, Postert T, Seidel G, et al. Transcranial brain parenchyma sonography in movement disorders: state of the art. Ultrasound Med Biol. (2007) 33:15–25. doi: 10.1016/j.ultrasmedbio.2006.07.021
21. Berg D, Behnke S, Walter U. Application of transcranial sonography in extrapyramidal disorders: updated recommendations. Ultraschall Med. (2006) 27:12–19. doi: 10.1055/s-2005-858962
22. Berg D, Godau J, Walter U. Transcranial sonography in movement disorders. Lancet Neurol. (2008) 7:1044–55. doi: 10.1016/S1474-4422(08)70239-4
23. Tao A, Chen G, Deng Y, Xu R. Accuracy of transcranial sonography of the substantia nigra for detection of parkinson's disease: a systematic review and meta-analysis. Ultrasound Med Biol. (2019) 45:628–41. doi: 10.1016/j.ultrasmedbio.2018.11.010
24. Walter U, Hoeppner J, Prudente-Morrissey L, Horowski S, Herpertz SC, Benecke R. Parkinson's disease-like midbrain sonography abnormalities are frequent in depressive disorders. Brain. (2007) 130:1799–807. doi: 10.1093/brain/awm017
25. Bottcher T, Rolfs A, Meyer B, Grossmann A, Berg D, Kropp P, et al. Clinical, genetic, and brain sonographic features related to parkinson's disease in gaucher disease. J Neurol. (2013) 260:2523–31. doi: 10.1007/s00415-013-7011-2
26. Richter D, Woitalla D, Muhlack S, Gold R, Tonges L, Krogias C. Brainstem raphe alterations in TCS: a biomarker for depression and apathy in parkinson's disease patients. Front Neurol. (2018) 9:645. doi: 10.3389/fneur.2018.00645
27. Becker T, Becker G, Seufert J, Hofmann E, Lange KW, Naumann M, et al. Parkinson's disease and depression: evidence for an alteration of the basal limbic system detected by transcranial sonography. J Neurol Neurosurg Psychiatry. (1997) 63:590–6. doi: 10.1136/jnnp.63.5.590
28. Thobois S, Prange S, Sgambato-Faure V, Tremblay L, Broussolle E. Imaging the etiology of apathy, anxiety, and depression in parkinson's disease: implication for treatment. Curr Neurol Neurosci Rep. (2017) 17:76. doi: 10.1007/s11910-017-0788-0
29. Komatsu T, Terasawa Y, Arai A, Sakuta K, Mitsumura H, Iguchi Y. Transcranial color-coded sonography of vertebral artery for diagnosis of right-to-left shunts. J Neurol Sci. (2017) 376:97–101. doi: 10.1016/j.jns.2017.03.012
30. Zhang Y, Zhang YC, Sheng YJ, Chen XF, Wang CS, Ma Q, et al. Sonographic alteration of basal ganglia in different forms of primary focal dystonia: a cross-sectional study. Chin Med J. (2016) 129:942–5. doi: 10.4103/0366-6999.179792
31. Zhang YC, Hu H, Luo WF, Sheng YJ, Chen XF, Mao CJ, et al. Alteration of brainstem raphe measured by transcranial sonography in depression patients with or without parkinson's disease. Neurol Sci. (2016) 37:45–50. doi: 10.1007/s10072-015-2350-7
Keywords: Parkinson's disease, depression, anxiety, transcranial parenchymal sonography, brainstem raphe
Citation: Bei H-Z, Chen J-P, Mao C-J, Zhang Y-C, Chen J, Du Q-Q, Xue F, He P-C, Jin H, Wang F-Y and Liu C-F (2020) Echogenicity Changes in Brainstem Raphe Detected by Transcranial Parenchymal Sonography and Clinical Characteristics in Parkinson's Disease. Front. Neurol. 11:821. doi: 10.3389/fneur.2020.00821
Received: 12 April 2020; Accepted: 30 June 2020;
Published: 07 August 2020.
Edited by:
Carmen Rodriguez-Blazquez, Instituto de Salud Carlos III (ISCIII), SpainReviewed by:
Christos Krogias, Ruhr University Bochum, GermanyCopyright © 2020 Bei, Chen, Mao, Zhang, Chen, Du, Xue, He, Jin, Wang and Liu. This is an open-access article distributed under the terms of the Creative Commons Attribution License (CC BY). The use, distribution or reproduction in other forums is permitted, provided the original author(s) and the copyright owner(s) are credited and that the original publication in this journal is cited, in accordance with accepted academic practice. No use, distribution or reproduction is permitted which does not comply with these terms.
*Correspondence: Cheng-Jie Mao, ZHJjaGVuZ2ppZW1hb0AxNjMuY29t
†These authors have contributed equally to this work and share first authorship
Disclaimer: All claims expressed in this article are solely those of the authors and do not necessarily represent those of their affiliated organizations, or those of the publisher, the editors and the reviewers. Any product that may be evaluated in this article or claim that may be made by its manufacturer is not guaranteed or endorsed by the publisher.
Research integrity at Frontiers

Learn more about the work of our research integrity team to safeguard the quality of each article we publish.