
94% of researchers rate our articles as excellent or good
Learn more about the work of our research integrity team to safeguard the quality of each article we publish.
Find out more
REVIEW article
Front. Neurol. , 17 June 2020
Sec. Multiple Sclerosis and Neuroimmunology
Volume 11 - 2020 | https://doi.org/10.3389/fneur.2020.00450
This article is part of the Research Topic Update on Translational Neuroimmunology - Research of ISNI 2018 View all 21 articles
 Joseph Kuchling1,2,3,4
 Friedemann Paul1,2,3,4*
Multiple sclerosis (MS) and neuromyelitis optica spectrum disorders (NMOSD) are autoimmune central nervous system conditions with increasing incidence and prevalence. While MS is the most frequent inflammatory CNS disorder in young adults, NMOSD is a rare disease, that is pathogenetically distinct from MS, and accounts for approximately 1% of demyelinating disorders, with the relative proportion within the demyelinating CNS diseases varying widely among different races and regions. Most immunomodulatory drugs used in MS are inefficacious or even harmful in NMOSD, emphasizing the need for a timely and accurate diagnosis and distinction from MS. Despite distinct immunopathology and differences in disease course and severity there might be considerable overlap in clinical and imaging findings, posing a diagnostic challenge for managing neurologists. Differential diagnosis is facilitated by positive serology for AQP4-antibodies (AQP4-ab) in NMOSD, but might be difficult in seronegative cases. Imaging of the brain, optic nerve, retina and spinal cord is of paramount importance when managing patients with autoimmune CNS conditions. Once a diagnosis has been established, imaging techniques are often deployed at regular intervals over the disease course as surrogate measures for disease activity and progression and to surveil treatment effects. While the application of some imaging modalities for monitoring of disease course was established decades ago in MS, the situation is unclear in NMOSD where work on longitudinal imaging findings and their association with clinical disability is scant. Moreover, as long-term disability is mostly attack-related in NMOSD and does not stem from insidious progression as in MS, regular follow-up imaging might not be useful in the absence of clinical events. However, with accumulating evidence for covert tissue alteration in NMOSD and with the advent of approved immunotherapies the role of imaging in the management of NMOSD may be reconsidered. By contrast, MS management still faces the challenge of implementing imaging techniques that are capable of monitoring progressive tissue loss in clinical trials and cohort studies into treatment algorithms for individual patients. This article reviews the current status of imaging research in MS and NMOSD with an emphasis on emerging modalities that have the potential to be implemented in clinical practice.
Multiple sclerosis (MS) and neuromyelitis optica spectrum disorders (NMOSD) are inflammatory, autoimmune central nervous system conditions that have shown increasing incidence and prevalence over the past decades (1–5). While MS is the most frequent inflammatory CNS disorder in young adults, NMOSD is a rare disease. Relative frequency within the demyelinating CNS diseases varies widely among different ethnicities and regions, accounting for ~1% of demyelinating disorders (6, 7). Based on results from population-based studies, NMOSD prevalence broadly ranges from 0.52 to 7.7 per 100,000 (7). Although NMOSD frequency in Asian and White/Caucasian ethnicities seems to be comparably similar (4, 8), Blacks seem to have highest NMOSD prevalence of up to 13/100,000 as inferred from mixed Northern American populations (9, 10).
For a long time, NMOSD had been seen as a rare variant of MS; however, the seminal discovery of a highly specific serum IgG autoantibody to the astrocyte water channel aquaporin-4 (AQP4) in up to 80% of NMOSD patients and subsequent research into the role of these antibodies in disease pathogenesis and lesion formation has made clear that this is a condition distinct from MS (11–17). Clinical experience has then shown that most immunomodulatory drugs used in MS are inefficacious or even harmful in NMOSD, emphasizing the need for a timely and accurate diagnosis and distinction from MS (18–21). Despite distinct immunopathology and differences in disease course and severity, there might be considerable overlap in clinical and imaging findings, posing a diagnostic challenge for managing neurologists. Differential diagnosis is facilitated in case of a positive serology for AQP4-abs obtained with a highly specific cell-based assay but might be difficult in seronegative cases or when less specific assays for AQP4-abs are used (22, 23).
Imaging of the brain, optic nerve, retina, and spinal cord is a procedure of paramount importance when managing patients with inflammatory CNS conditions at first presentation to enable diagnosis and differential diagnosis (24–28). Once a diagnosis has been established, imaging techniques are often deployed at regular intervals over the disease course as surrogate measures for disease activity and progression and to surveil treatment effects (29, 30). Although the application of some imaging modalities for monitoring of disease course was established decades ago in MS, the situation is less clear in NMOSD in which work on longitudinal imaging findings and their association with clinical disability is scant (26). Moreover, as long-term disability is mostly attack-related in NMOSD and does not stem from insidious progression as in MS, regular follow-up imaging might not be useful in the absence of clinical events. However, with accumulating evidence for covert tissue alteration in NMOSD and with the advent of approved immunotherapies, the role of imaging in the management of NMOSD might have to be reconsidered in the near future (31–37). In addition, imaging markers indicating impending relapses are an unmet need in NMOSD. On the contrary, MS management still faces the challenge of implementing imaging techniques that are capable of monitoring progressive tissue loss (for example brain or spinal cord atrophy) in clinical trials and cohort studies into treatment algorithms for individual patients (38–40).
This article reviews the current status of imaging research in MS and NMOSD with an emphasis on emerging modalities that have the potential to be implemented in clinical practice for diagnosis, differential diagnosis, and monitoring of disease course and immunotherapies.
As in previous versions of the MS diagnostic criteria, conventional MRI of the brain and spinal cord (T2/Flair/T1 post gadolinium sequences) is a cornerstone for an MS diagnosis within the 2017 revision of the McDonald criteria (41, 42), taking potential “red flags” and “MS mimics” into consideration that may point to an alternative diagnosis (24, 25). However, sensitivity of the 2017 criteria might have improved, and time to diagnosis appears to be shorter at the expense of specificity (43–45). Thus, frequent misdiagnosis of MS based upon misinterpretation of imaging findings on conventional MRI in conjunction with atypical clinical presentations even by MS experts has remained an alarming issue (46–49).
Recently the so-called “central vein sign” (CVS) was proposed as a potential new biomarker for a more specific MS diagnosis, emerging from observations, mostly at ultra-high field MRI studies, that MS lesions are frequently characterized by a small intralesional vein in contrast to relevant imaging differential diagnoses, such as NMOSD, small vessel disease, inflammatory CNS vasculopathies, Susac syndrome, and others (50–56).
CVS is now reliably assessable at 3T, for example, using T2*/FLAIR and co-registered SWI images, and might, therefore, become a clinically applicable imaging feature to discriminate MS from classical mimics at a high specificity (56–58) (Figure 1). In one study, a threshold of 50% perivenular lesions discriminated MS from inflammatory vasculopathies, such as Behcet disease, primary angiitis of the CNS, antiphospholipid syndrome, Sjögren syndrome, and systemic lupus erythematosus (SLE), with 100% accuracy (56), and another multicenter study conducted by the MAGNIMS consortium reported a specificity of 83% for a 35% CVS proportion threshold for discriminating MS from mimics such as NMOSD, SLE, migraine, cluster headache, diabetes, and other types of small vessel disease (58). Perhaps less onerous in the clinical situation is the three-lesion CVS criterion, which yielded a specificity of 89% for discriminating MS from other conditions. In this study, sensitivity was better with an optimized T2*-weighted sequence. These findings require replication in prospective studies enrolling patients with various ethnic backgrounds and from different regions of the world and will hopefully lead to a novel imaging biomarker with high specificity for MS that might find its way into a future revision of the McDonald criteria.
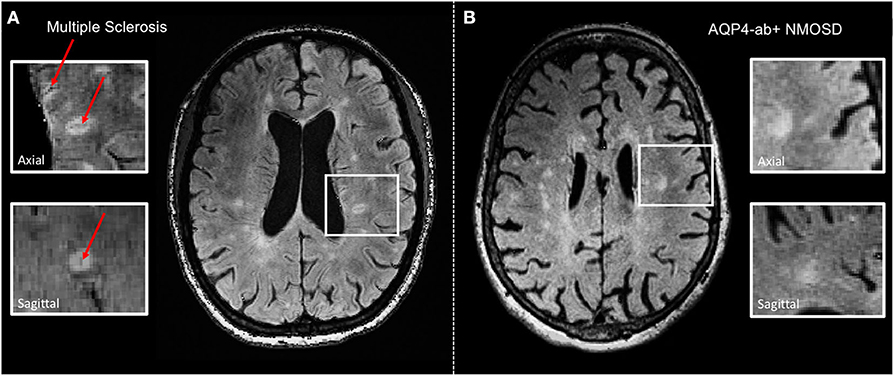
Figure 1. Representative axial 3 T FLAIR-SWI images from individuals with (A) relapsing–remitting multiple sclerosis (RRMS; 28-year-old woman) and (B) AQP4-antibody-positive neuromyelitis optica spectrum disorder (AQP4+-NMOSD; 76-year-old woman). The central vein sign (red arrows) is present in the majority of MS lesions but not in white matter lesions in NMOSD. White boxes show magnified views of lesions in axial and sagittal plane. T, Tesla; FLAIR, fluid-attenuated inversion recovery; SWI, susceptibility-weighted imaging; RRMS, relapsing-remitting multiple sclerosis; AQP4-ab+, AQP4-antibody positive; NMOSD, neuromyelitis optica spectrum disorder.
Although MRI T2 hyperintense lesions represent one of the major diagnostic hallmarks of MS, macroscopic MRI-visible lesions are commonly termed as “tip of the iceberg” because many more lesions are detected by histopathology at a microscopic level (59). Particularly, cortical lesions are widely elusive to conventional MRI at 3 Tesla although introduction of ultra-high field 7 T MRI more than doubles detection of cortical MS lesions (60) (Figure 2). Of note, post mortem studies showed that sensitivity to detect cortical lesions at 7 T is strongly influenced by their histopathological subtype, ranging from 11 to 100% (61). Hence, cortical pathology still remains more extensive than even 7 T MRI can reveal.
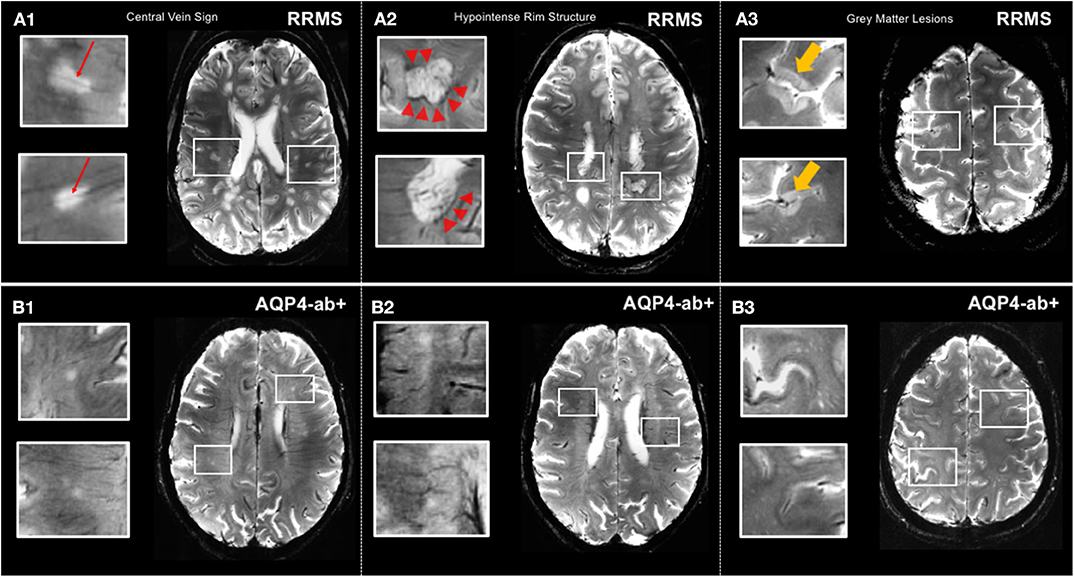
Figure 2. MS-specific 7 T MR imaging markers displayed by T2*-weighted sequence. (A1) Lesions in relapsing-remitting MS commonly exhibit a central vein (red arrows). (A2) Hypointense rim structures (red arrow-heads) are prevalent in a subset of MS lesions. (A3) 7 T MRI allows for the delineation of gray matter lesions in great detail. (B1,B2) Central vein sign and hypointense rim structures are absent in lesions of AQP4+-NMOSD patients. (B3) Gray matter lesions are commonly absent in AQP4+-NMOSD. MS, multiple sclerosis; T, Tesla; FLAIR, fluid-attenuated inversion recovery; SWI, susceptibility-weighted imaging; RRMS, relapsing-remitting multiple sclerosis; AQP4-ab+, AQP4-antibody positive; NMOSD, neuromyelitis optica spectrum disorder. LGN, lateral geniculate nucleus; V1, primary visual cortex.
Cortical lesions are considered a distinctive feature of MS and are rarely present or even totally absent in other conditions mimicking multiple sclerosis, such as migraine or NMOSD (60). Intriguingly, presence and number of cortical pathology appears to correlate with clinical outcomes, most notably cognitive impairment in MS (62). However, clinical significance of cortical lesions is controversially discussed throughout the literature, and further 7 T MR studies, including investigations with improved visualization at magnetization-prepared 2 rapid acquisition gradient echoes (MP2RAGE), are highly warranted to clarify potential diagnostic and prognostic value of MS cortical pathology (63).
Brain and spinal cord volumetric imaging is another MR-based measure that might have the potential to be used in clinical practice to monitor disease progression and treatment response. Both neuropathology and imaging studies have shown that atrophy of the entire brain, including cortical and deep gray matter (DGM) as well as the spinal cord, are typical hallmarks of MS from earliest disease stages (64–68) and that, particularly, cerebral gray matter volume loss (above all, the deep gray matter) and spinal cord atrophy correlate with clinical disability and cognitive impairment and are predictive of further disease progression in longitudinal studies (69–78). In clinically stable and untreated MS patients, annual brain volume loss ranges from ~0.5 to 1.0% in comparison to 0.1–0.3% for healthy subjects (73, 79). In a recent large European multicenter study comprising more than 1,200 patients with MS and more than 200 healthy subjects, volumes of deep and cortical gray and white matter were obtained, and participants followed over an average of 2.41 years (69). Deep gray matter showed the fastest annual atrophy rates, which ranged from −1.34 to −1.66% in various MS forms and was −0.88% in CIS and −0.94% in HC. Of all regional volumes quantified at baseline, only deep gray matter volume predicted time to EDSS progression, which underscores the relevance of DGM loss for disability accumulation. A 7.5-year longitudinal study (range 1–12 years), 206 MS patients and 35 healthy controls reported a cutoff of −0.4% annualized brain volume change to have a sensitivity of 65% and a specificity of 80% for discriminating physiological from pathological brain volume loss (80). The clinical relevance of this cutoff remains to be demonstrated. Various immunotherapies have been shown to decelerate brain volume loss; however, it is currently unclear how this observation would inform treatment decisions in individual patients (81–85). Brain volumetric measurements for use in individual patients are still hampered by numerous technical challenges, such as inter-session variability, influence of physiological factors (for example, hydration status), normal aging and comorbidities on brain volumes, time of day of MR scan, effect of lesion filling on post-acquisition quantitation procedures, and systematic differences pertaining to scanners and sequences parameters (38, 86). Therefore, despite sufficient accuracy of brain volume measurements in observational and interventional cohort studies, the technology is not yet apt to reliably investigate changes in individual patients within periods of less than a few years and therefore—also in light of the various physiological sources of error—atrophy measurements are currently not usable to monitor therapy in MS (30, 73, 87). Besides technical advances to reduce measurement variability, a better understanding into the neuropathological correlates and drivers of deep and cortical gray matter atrophy and whole brain volume loss is urgently required (38). The same applies to spinal cord atrophy, which is relatively easy to measure at the cervical level (mean upper cervical cord area or MUCCA) even on brain scans that cover the superior part of the spinal cord down to the C2/C3 level (88). However, physiological fluctuations and change over time of this measure in healthy subjects are unknown, and although some studies have reported spinal cord atrophy rates of between <0.5% and more than 2% per year, with progressive and clinically deteriorating patients exhibiting faster atrophy rates, it is not established how MUCCA could be used to monitor individual patients (88–93). However, a recent study suggests that conventional measures of spinal cord involvement, such as focal lesions and emergence of new lesions, can be used to estimate risk of secondary progressive MS and EDSS at 15 years in patients with clinically isolated syndrome (94).
Other advanced MRI techniques have been recently applied to investigate pathogenetic processes associated with neurodegeneration and disease progression. Amid other emerging quantitative MRI approaches, diffusion tensor imaging (DTI), which relies on the detection of changes in the random translational motion of water molecules and thereby estimates the level of tissue degradation in the normal-appearing white matter, provides promising imaging markers to detect neuronal damage (83). Post mortem investigations showed fractional anisotropy (FA) decrease to be to associated with axonal loss and myelin density, thereby suggesting DTI FA to be a useful indicator of both neurodegeneration and demyelination in MS (95) (Figure 3). However, future histopathological and clinical studies on quantitative MR markers are highly warranted to validate the capacity of modern MRI in detecting and monitoring neurodegenerative MS pathology that remains elusive to conventional structural MRI.
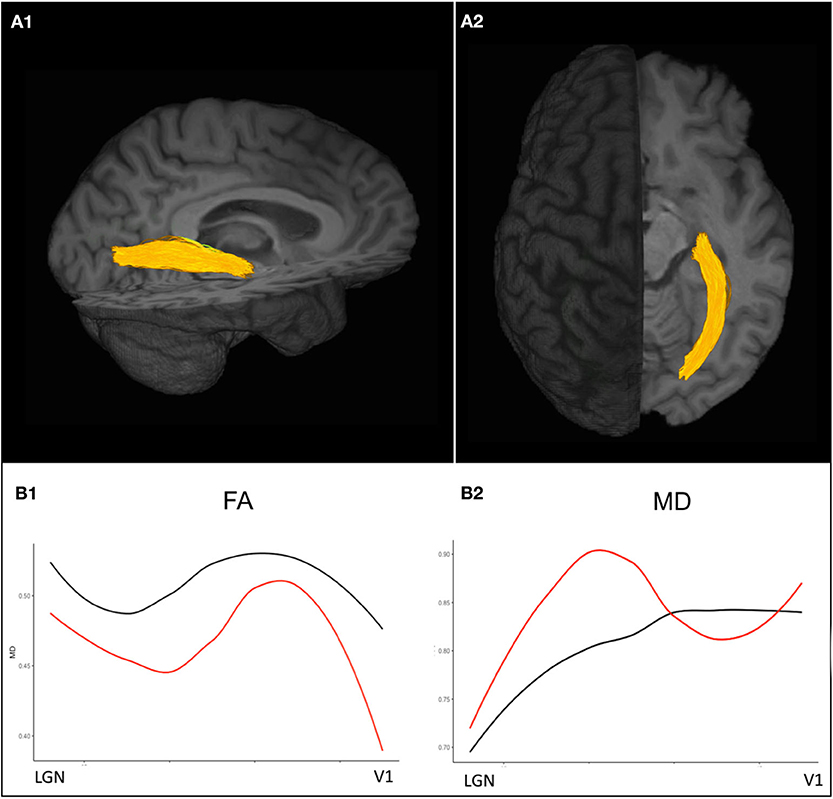
Figure 3. Diffusion-weighted imaging based probabilistic tractography allows for the delineation of the optic radiations displayed in (A1) sagittal and (A2) axial view. (B1) Diffusion tensor imaging (DTI) values along the optic radiation of an exemplary ON patient 3 years after attack (red) show decreased FA values compared to a healthy control (black) indicating trans-synaptic neurodegeneration after ON. (B2) MD values are pathologically increased in an exemplary ON patient almost throughout the entire course of the optic radiations compared to the exemplary healthy control. ON, optic neuritis; FA, fractional anisotropy; MD, mean diffusivity.
In clinical management, the use of MRI to monitor treatment response still relies on conventional parameters, such as new or enlarging T2 lesions and gadolinium-enhancing lesions in conjunction with clinical measures (relapses, disability progression), measures summarized under the term “NEDA” (no evidence of disease activity) (30). However, NEDA seems to be a questionable treatment goal given that, in real-world observational studies, <10% of patients retain a NEDA status after more than 5 years (96), and even with highly effective immunotherapies, NEDA rates hardly exceed 50% (97). Moreover, the clinical relevance of this composite score has been called into question, for example, by data from a large prospective observational study with more than 500 MS patients from California showing that meeting the NEDA status at 2 years was not predictive of long-term stability (98). In addition, the NEDA concept has been heavily criticized because of ignoring other relevant and disabling symptoms of the disease, such as fatigue, cognitive problems, sleep disorders, depression, etc. (71, 99–109). Moreover, recent safety concerns as to the deposition of gadolinium-based contrast agents (predominantly linear compounds) in the dentate nucleus and other brain regions provide arguments against their frequent use in monitoring radiographic disease activity in otherwise stable patients (110–113). For detection of new brain lesions, a T2/FLAIR sequence is sufficient as long as rigorous standardization of image acquisition to ensure maximum comparability is guaranteed (29). To overcome the shortcomings and downsides of the current NEDA concept, a new term (“minimal evidence of disease activity” or MEDA) has been proposed as well as a more sophisticated approach to monitor MS therapy taking also patient-reported outcomes into consideration (“multiple sclerosis decision model” or MDSM) (114, 115). However, both concepts lack prospective validation, so their use in clinical management cannot be unambiguously recommended. The same applies to the upgraded NEDA concept that includes brain atrophy into the composite measure (NEDA-4) (116, 117).
Numerous non-conventional and advanced imaging modalities are currently under investigation that may help improve visualization and quantification of (covert) tissue damage in the gray and white matter of the brain and the spinal cord and could be used as an imaging surrogate of remyelination and repair; among them are magnetization transfer imaging, diffusion tensor imaging, myelin water imaging, susceptibility weighted imaging, magnetic resonance spectroscopy, sodium imaging, PET imaging, ultra-high field imaging at 7 Tesla, functional imaging with resting state fMRI, T1/T2-weighted ratio calculable from conventional T1- and T2-weighted images, machine-learning based imaging, magnetic resonance elastography, and several others, none of which will probably be used in clinical practice in the near future (27, 52, 83, 88, 118–135). Nonetheless, these endeavors are important to deepen our understanding of mechanisms of tissue damage in MS and to devise better imaging endpoints for clinical trials and routine care than those currently in use.
A recent emerging imaging tool in neuroinflammation is retinal optical coherence tomography (OCT), a technique that takes advantage of the retinal backscatter and reflection of low coherent light and enables the reconstruction of structural images of the various retinal layers with a resolution of a few microns and a very time-efficient image acquisition of only a few minutes in a cooperative patient (136).
OCT has been used for more than a decade in clinical neuroimmunology, mostly in cohort studies and occasionally as an endpoint in acute optic neuritis trials (137–139), and it is at the verge of entering clinical management of patients with MS and related disorders. Most widely used retinal measures of neuro-axonal damage are the (peripapillary) retinal nerve fiber layer (pRNFL) and the ganglion cell layer (GCL) that is often reported together with the inner plexiform layer (IPL) due to inaccuracy of segmentation and then displayed as ganglion cell/inner plexiform layer (GCIPL) (39, 136). In MS, OCT has been shown to be reliably applicable in a multicenter setting (140). Certain standards for quality control of OCT scans and reporting of data have been proposed, and confounders, for example, the influence of retinal vessels on neuroaxonal measures, have to be taken into consideration (141–143). Thinning of the RNFL or the GCL/GCIPL are consistently reduced according to a high number of studies both in MS eyes with a history of prior optic neuritis as well as to a lesser extent in MS eyes without prior ON (144–146). Retinal thinning in MS is detectable from the earliest disease stages (147, 148) and is associated with altered visual function, visual quality of life, VEP latencies, overall disability, cognitive performance, inflammatory brain lesions, and both spinal cord and brain atrophy, and has been shown to reflect clinical and radiographic disease activity in longitudinal studies (149–162). A recent meta-analysis comprising more than 1,000 eyes calculated an average pRNFL loss of 20 μm in eyes with prior ON and of 7 μm in eyes without history of ON (NON), and average GCIPL thinning was 16 μm in ON eyes and 6 μm in NON eyes (144). Annual rates of RNFL thinning in longitudinal studies range from ~0.2 to 2.0 μm per year and depend on disease stage and treatment status. In general, patients with progressive MS tend to show more severe retinal thinning than RRMS patients (145). A retrospective, non-randomized “real-world” study suggested that MS immunotherapies may differentially affect the rate of annual ganglion cell loss with faster thinning in patients treated with interferon beta or glatiramer acetate and slower thinning in patients on natalizumab (163). In a longitudinal monocenter study in 72 patients with MS from Italy, NEDA status was associated with relatively preserved RNFL over 2 years; patients with NEDA (32% of the cohort) had an average RNFL loss of −0.93 μm as compared to −2.83 μm in the evidence of disease activity (EDA) group (164). Patients with stable EDSS over the course of the study had on average a RNFL loss of −1.33 μm as in contrast to −3.23 μm in patients with an EDSS worsening of ≥0.5 points. A cutoff of −1.25 μm RNFL loss was able to classify the NEDA status with a sensitivity of 80% and a specificity of 81.4%. A large retrospective multicenter study conducted by the International Multiple Sclerosis Visual System Consortium (www.imsvisual.org) in 879 patients with various stages of MS suggests that pRNFL may be used to predict disability worsening (165). Patients with a pRNFL below 92/93 μm (different OCT machines used) had a 60% increased risk of disability progression after 1 year, and those with a pRNFL <87/88 μm had a 4-fold increased risk of progression on the EDSS after 4–5 years.
Another retrospective study in 305 MS patients in different stages of the disease and with a median interval of 7.9 years from the acquisition of an OCT scan (using the older time domain technology to measure the pRNFL) (166) to the last EDSS assessment evaluated the relationship between both parameters (167). Each 1 μm decrease in the baseline pRNFL was associated with an increase in EDSS of 0.024 points, suggesting that a pRNFL measurement may help to prognosticate disability within 6–9 years later. Similar results were obtained when adjusting for the presence of previous optic neuritis episodes.
Also in a clinically isolated syndrome (CIS) scenario OCT may be helpful to assess the risk of further disease activity. A bicenter study from Germany grouped 89 patients with a CIS as a qualifying event into three groups according to their baseline GCIPL values in NON eyes (168). Patients in the lowest tertile (ranging from 58.7 to 69.2 μm) had a hazard ratio of 3.43 for not meeting NEDA status within the follow-up period (max 2.5 years) as compared to patients in the highest GCIPL tertile (ranging from 74.2 to 84.8 μm). In contrast, other established predictors of further disease activity in CIS patients, such as MRI T2 lesion load, sex, or ON as a qualifying symptom, were not predictive of a subsequent NEDA status. For the most recent revision of the McDonald criteria it was controversially discussed whether affection of the visual system should be used to demonstrate dissemination in space or time. However, “the panel felt the data … were insufficient to support incorporation into the McDonald criteria” but “studies to validate MRI, visual evoked potentials, or optical coherence tomography in fulfilling DIS or DIT in support of a multiple sclerosis diagnosis were identified as a high priority.” (41). A first step toward this direction has been undertaken by the IMSVISUAL Consortium that recently pooled data from more than 1,500 patients with MS to determine the optimal intereye differences in RNFL and GCIPL thicknesses for identifying unilateral optic nerve lesions defined as history of acute unilateral optic neuritis (169). Using receiver-operating characteristic curve analysis, an intereye difference of 5 μm for RNFL and of 4 μm for GCIPL was demonstrated as an optimal threshold for identifying unilateral optic nerve lesions. Eighteen percent of patients in the entire cohort had intereye differences of >5 μm for RNFL and 12% of >4 μm for GCIPL without history of acute ON. In line with another recent study (170), these findings suggest that these measures may complement MRI to demonstrate dissemination in space and time.
In 2015, new diagnostic criteria for NMOSD with and without (or with unknown) AQP4 antibodies have been proposed against the background of a broadening clinical spectrum that was recognized with the increasing number of patients tested for AQP4 antibodies (171). Imaging features regarded as characteristic yet not pathognomonic for NMOSD are a core element of the 2015 IPND criteria, in particular in seronegative patients or in subjects with unknown AQP4 ab status. The main goal of listing these imaging findings is to help clinicians discriminate NMOSD from other conditions, namely MS, and thus reduce the chance of misdiagnosis. Imaging abnormalities in NMOSD are described according to the anatomical location in the brain, optic nerve, and spinal cord. The establishment of the 2015 IPND criteria have led to a rise in the number of diagnosed NMOSD cases by up to 76%, and fortunately, diagnostic delay was considerably decreased from 53 months by the 2006 criteria to 11 months by the 2015 criteria (172, 173).
Over the past 15 years, an impressive number of imaging studies have made clear that—in contrast to earlier views—most NMOSD patients exhibit some kind of brain lesions. Lesions are not always located in areas of high AQP4 expression, and a considerable proportion (42%) may even meet Barkhof criteria for multiple sclerosis (24, 26, 174, 175). Most studies in NMOSD have used conventional MR sequences; non-conventional and advanced imaging studies are scant and have mostly yielded inconsistent results (176).
According to newer studies, the majority of NMOSD patients show some kind of brain lesions although findings considered highly suggestive and suspicious of an NMOSD diagnosis are less prevalent. Between 43 and 70% of NMOSD patients have brain lesions at onset, and up to 85% of patients meeting the 2006 Wingerchuk criteria for NMO and up to 89% of seropositive patients were reported to have brain abnormalities (12, 26, 177–180). Brain lesions considered highly suggestive of NMOSD are diencephalic lesions surrounding the third ventricle and cerebral aqueduct, which are often asymptomatic but may occasionally present with inappropriate antidiuretic hormone secretion, narcolepsy, hypothermia, hypotension, or hyperprolactinemia. Another very characteristic predilection site is the dorsal brainstem: Lesions adjacent to the fourth ventricle, including the area postrema and the nucleus tractus solitarii, are highly specific for NMOSD, reported in 7–46% of patients with NMO (26, 181). The typical clinical manifestation is with intractable hiccups, nausea, and vomiting (171). Lesions in the corpus callosum (CC) have been described in 12–40% of patients with NMOSD. Although the location in the CC is not a unique finding that differentiates NMOSD from MS, NMOSD callosal lesions are in contrast to MS located immediately next to the ventricles and follow the ependymal lining (26). CC lesions may extend into the cerebral hemisphere, forming an extensive and confluent white matter lesion. Acute CC lesions are often edematous and heterogeneous with a “marbled pattern” (182). Hemispheric white matter lesions may appear extensive and confluent, are often tumefactive (>3 cm in longest diameter), or have a long spindle-like or radial shape following white matter tracts; they usually have no mass effect. They may occasionally mimic posterior reversible encephalopathy syndrome (PRES) or Baló-like lesions or may resemble acute disseminated encephalomyelitis (ADEM) or CNS malignancies and were reported to be more frequent in AQP4 ab seropositive than seronegative patients (26). Hemispheric white matter lesions may disappear but may also remain as cyst-like or cavitary changes. Also corticospinal tracts may be involved in NMOSD with either unilateral or bilateral involvement and were reported in up to 44% of patients. These lesions may extend from the deep white matter in the cerebral hemisphere through the posterior limb of the internal capsule to the cerebral peduncles of the midbrain or pons. They are often contiguous, longitudinally extensive, and may follow pyramidal tracts. The reason for involvement in NMOSD is unclear as corticospinal tracts are not areas of high AQP4 expression. The probably most frequent type of brain lesions in NMOSD reported in up to 84% of patients are “non-specific” lesions: punctate or small (<3 mm) dots or patches of hyperintensities on T2-weighted or FLAIR sequences in the subcortical or deep white matter that are usually asymptomatic and tend to increase with age, presumably owing to age-related vascular comorbidities. These lesions may nonetheless pose diagnostic challenges vs. MS and other conditions. Few studies have looked into gadolinium-enhancing brain lesions in NMOSD; up to 36% of patients have shown enhancing lesions that are often poorly marginated, subtle, or show a patchy pattern. One study from Japan suggested “cloud-like enhancement” to be a characteristic enhancement pattern in NMOSD (178). Nodular enhancement or meningeal enhancement have also been described, and linear enhancement of the ependymal surface of the lateral ventricles (“pencil-thin lesion”) was proposed as another imaging feature characteristic of NMOSD (183, 184).
In contrast to MS, cortical lesions are usually absent in NMOSD, which is supported by 3 T double inversion recovery and ultra-high field MR studies that investigated the cortex in NMO as well as by several histopathologic studies (54, 185, 186) (Figure 2). Additionally, a lower proportion of NMOSD lesions show the CVS or display hypointense rims compared to lesions in MS (54, 57) (Figure 2). The challenging overlap of brain lesion occurrence and numbers between NMOSD and MS have prompted the use of algorithmic approaches to improve differential diagnosis. For example, one study from the UK in 26 AQP4 ab seropositive NMOSD (63% of whom had brain T2 lesions and 16% met Barkhof criteria) and 50 RRMS patients replicated a few key features in both conditions that appeared to be discriminative, among them a smaller lesion size and fewer numbers in NMOSD as compared to MS, and MS exhibited a greater coherence of lesion location (most likely to occur adjacent to the posterior of the body of the lateral ventricle in the parietal white matter) (187). In contrast, the lesional region with the greatest likelihood to be within the NMOSD group and not the MS group was adjacent to the fourth ventricle in the pons. Both groups had callosal lesions, but NMOSD patients showed no U fiber lesions and no Dawson's fingers. A combination of morphologic and locational criteria (at least one lesion adjacent to the body of the lateral ventricle and in the inferior temporal lobe or the presence of a subcortical U fiber lesion or a Dawson's finger–type lesion) could distinguish patients with MS from those with NMOSD with 92% sensitivity, 96% specificity, 98% positive predictive value, and 86% negative predictive value (187).
Of note, previous research shows that non-lesional tissue damage as measured by non-conventional imaging, such as DTI, may not occur in NMOSD except in the connecting tracts upstream and downstream of lesions (26). Although these findings lend support to the notion that NMOSD, in contrast to MS, may be a lesion-dependent disease that produces relapses without more generalized neurodegenerative pathology, the presence of potential subclinical tissue alterations in NMOSD affecting the afferent visual system has been controversially discussed. Recent DTI investigations in NMOSD patients without a clinical history of visual pathway affection showed structural retinal damage and pathological optic radiation DTI FA decrease outside attack-related lesions, suggesting a presumptive AQP4-ab–related astrocytopathy (188). These findings are in accordance with histopathological studies reporting on astrocytic end feet changes within LETM lesions and spinal cord atrophy in AQP4-ab–positive patients without previous myelitis attacks (189). Yet the question as to whether neurodegenerative non-lesion-related pathology exists in NMOSD is still under debate and needs to be further elucidated by future combined in vivo and ex vivo MRI investigations.
Longitudinally extensive myelitis lesions (LETM) spanning three or more contiguous vertebral segments have long been regarded as an imaging feature highly suggestive of NMOSD (Figure 4). Sensitivity and specificity for this criterion were 98 and 83%, respectively, in the patient cohort underlying the 2006 Wingerchuk criteria (177). Long cord lesions occur more frequently in the cervical cord from which they may extend into the brainstem and the upper thoracic spinal cord than in lower cord regions. Moreover, NMOSD spinal cord lesions occupy more than half of the cord area and show preferential involvement in the spinal central gray matter during the acute and chronic stages of spinal cord inflammation. By contrast, the majority of MS spinal cord lesions are localized in the lateral and posterior white matter regions of the cord (190, 191). In the acute stage, spinal cord lesions often appear hypointense on T1 weighted scans (in contrast to MS); the inflamed cord is often swollen and may show patchy contrast enhancement. In the chronic stage, extensive cord atrophy with or without T2 signal changes may develop in NMOSD (Figure 4). It is important to bear in mind that the timing of the spinal MRI in relation to the onset of clinical symptoms may be crucial for the detection of longitudinally extensive cord lesions (192) and that ~15–20% of myelitis attacks in NMOSD may show short transverse myelitis lesions, spanning 2.5 vertebral segments or less (193, 194). This means that a spinal cord lesion shorter than three vertebral segments does not rule out an NMOSD diagnosis. Interestingly, a recent study on 91 Chinese NMOSD patients compared patients with LETM and patients with short transverse myelitis and showed that the latter suffered less motor and bowel or bladder disability and had minor EDSS at clinical onset but exhibited shorter time to relapse (195). Moreover, although extensive spinal cord lesions are highly suggestive of NMOSD, numerous other conditions have to be taken into consideration, such as sarcoidosis, spondylotic myelopathy, autoimmune GFAP astrocytopathy, neoplasms, lymphoma, spinal cord infarction, and many others (196–201). Recently, “bright spotty lesions” on T2 weighted sequences were reported to be a discriminative feature of NMOSD myelitis with specificity values up to 100% (202, 203).
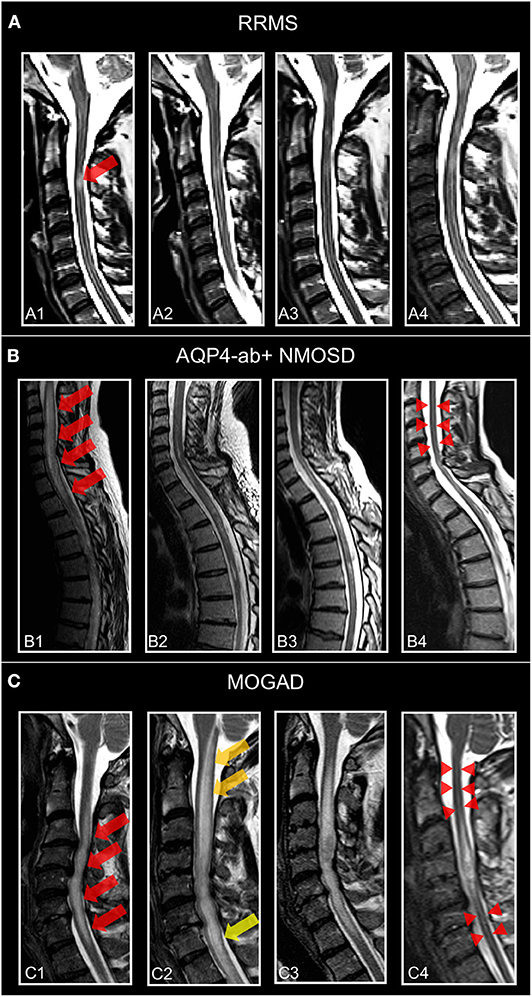
Figure 4. Representative T2-weighted spinal cord images from individuals. (A) Patient with relapsing–remitting multiple sclerosis (30-year-old woman) and MS-related myelitis and spinal cord imaging at (A1) 1 months, (A2) 2 months, (A3) 24 months, and (A4) 72 months after attack. Short extent (<3 segments) spinal cord lesion (red arrow) at C3 with typical morphology of MS-related myelitis. (B) Patient with AQP4-antibody-positive neuromyelitis optica spectrum disorder (36-year-old woman) and NMOSD-related LETM and spinal cord imaging at (B1) 2 months, (B2) 5 months, (B3) 12 months, and (B4) 60 months after attack. Spinal cord lesion (red arrows) with longitudinal morphology (C2-Th1; >3 segments) and subsequent atrophy (red arrow-heads) typical of NMOSD-related LETM. (C) Patient with MOG antibody associated disease (41-year-old woman) and MOGAD-related LETM and spinal cord imaging at (C1) 7 months, (C2) 8 months, (C3) 24 months, and (C4) 48 months after attack. Initial LETM (C3-C7; red arrows) with remarkable increase in length after relapse at month 8 (C2) (yellow arrows) and subsequent atrophy (red arrow-heads). RRMS, relapsing-remitting multiple sclerosis; AQP4-ab+, AQP4-antibody positive; NMOSD, neuromyelitis optica spectrum disorder; LETM, longitudinally-extensive transverse myelitis; MOGAD, myelin-oligodendrocyte-glycoprotein associated disease.
Recently, a study in 48 NMOSD (all AQP4 ab positive), 22 MS patients, and 24 patients with other causes of LETM from the United States assessed spinal cord imaging features that may help discriminate NMOSD from MS. Four findings were found to be most distinctive of NMOSD vs. other etiologies: bright spotty lesions, T1 dark lesions, centrally located lesions, and lesions involving more than 50% of the cord area on axial sequences (190).
Another study in 116 NMOSD patients (98 AQP4 ab positive) found a high proportion of patients (49%) without typical NMOSD brain and spinal cord lesions and 37% meeting the 2010 McDonald criteria. Nonetheless, a combination of easily applicable criteria for brain and spinal cord images enabled distinction from matched MS patients with good sensitivity and specificity regardless of serostatus (204).
Although the optic nerve is frequently involved in NMOSD, few studies with orbital MRI have been conducted. AQP4 ab–positive NMOSD tends to show more often posterior involvement of the optic nerve(s) including the chiasm and a more frequent intracranial and bilateral affection of the optic nerve as compared to MS (205). In AQP4 ab–positive patients with ON, lesion length on orbital MRI in the acute phase was a strong predictor of visual outcome (206). Another study reported a longitudinally extensive optic nerve lesion exceeding 17.6 mm to have a sensitivity of 81% and a specificity of 77% for NMOSD vs. RRMS (207).
Advanced imaging with volumetric analyses, DTI, spectroscopy, and others have increasingly been performed over the past 10 years (176), albeit with many inconsistent results, presumably owing to small sample sizes, ethnic differences of the cohorts investigated, heterogeneity of the samples with regard to AQP4 ab serostatus, and others. It is, for example, still a matter of debate as to whether progressive brain volume loss occurs in NMOSD over time as is the case in MS and how different compartments, such as white matter, cortex, or deep gray matter, are differentially affected (208–218) and how this might be associated with often-overlooked and insufficiently treated symptoms, such as cognitive impairment and pain (219–222). Presence of occult white matter damage as measured, for example, by DTI, MTR, or T1 relaxation time, has also remained contentious, presumably again owing to differences in inclusion criteria and different approaches to the correction for multiple comparisons problem (223–228). Few functional imaging studies with resting state fMRI (rs-fMRI) in NMOSD suggest that visual impairment due to severe optic neuritis causes brain network connectivity changes, in particular in visual networks (229–232). The vast majority of MR spectroscopy studies of the brain has found no clear indication for covert white matter damage (233–237), and low myoinositol/creatine values in the lesional cervical cord of NMOSD patients suggest astrocytic damage (238).
Spinal cord atrophy and reductions of MUCCA are a consistent feature of AQP4 ab–positive NMOSD even in the absence of myelitis attacks/spinal cord lesions (209, 239, 240) (Figure 4). In one study in 27 NMOSD patients with a history of myelitis and six NMOSD without history of myelitis and without spinal cord lesions (all participants AQP4 ab positive), MUCCA was reduced in both groups vs. healthy controls and correlated with clinical disability (241). The clinical relevance of MUCCA to monitor disease activity and covert progression requires further studies.
With the introduction of retinal OCT into clinical neuroimmunology, an increasing number of studies measuring retinal damage in NMOSD have been conducted over the past 10 years (242). Most studies have consistently shown that thinning of the RNFL and the GCIPL after an ON attack is on average more severe in AQP4 ab–positive NMOSD as compared to MS, a finding that aligns with the clinical experience of more severe vision loss in NMOSD (243–246). Impairment of visual quality of life caused by ON in NMOSD correlates with the extent of retinal damage measured by OCT, which underscores the potential clinical relevance of this technique (247) (Figure 5). Furthermore, this finding supports the strong recommendation for clinicians to treat ON as a neuroimmunological emergency as quickly and consequentially as possible because retinal ganglion cell loss starts early after clinical onset of symptoms, so timely administration of steroids or plasma exchange might help preserve retinal tissue and improve visual outcome (248–252). In NMOSD, ~25% of patients show so-called microcystic macular edema (MME) in the inner nuclear layer (INL) following ON, a frequency that is higher than in MS (5–10%) (242, 253–255). MME is not specific to NMOSD as it was described in a wide range of optic neuropathies. MME may be dynamic over time and seems to be associated with a less favorable visual outcome although neither its clinical relevance nor its pathophysiological underpinnings are entirely clear. Presumed mechanisms causing MME are vascular damage with extracellular fluid accumulation, Mueller cell pathology, and vitreous traction (242, 256, 257). A contentious issue in vision research in NMOSD is the occurrence of subclinical and progressive retinal thinning in NMOSD. In line with the clinical experience that disability is almost exclusively attack-related in NMOSD, some studies did not find progressive retinal thinning independent of ON (258). However, recent work has suggested that there is attack-independent ganglion cell loss in NMOSD—a finding whose clinical relevance needs to be further investigated (259). In addition, foveal changes have been detected in NMOSD patients without clinical evidence of optic neuritis of affection of the visual system, which suggests that AQP4 ab may directly target astrocytic Mueller cells in the retina, thus causing a primary retinal astrocytopathy (188, 260, 261). This finding is backed by animal work and human neuropathology data, both providing evidence for complement-independent AQP4 loss in Mueller cells and a retinal astrocytopathy (262, 263). Mathematical models to investigate the foveal shape will help investigate whether fovea changes may be used as a differential diagnostic feature for NMOSD and how these change over time in conjunction with functional visual outcomes (264).
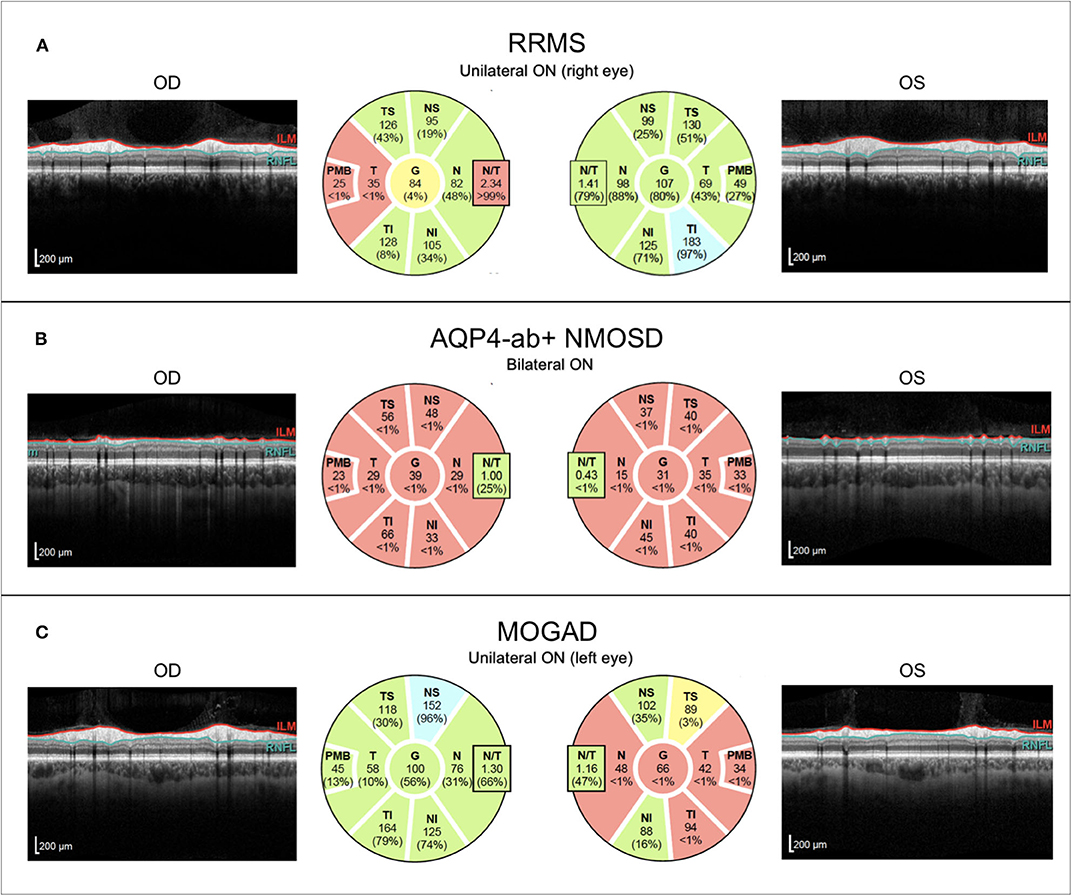
Figure 5. Representative OCT images from individuals with (A) relapsing–remitting multiple sclerosis with unilateral right-sided ON (RRMS; 41-year-old woman), (B) AQP4-antibody-positive neuromyelitis optica spectrum disorder with recurrent bilateral ON episodes (AQP4+-NMOSD; 25-year-old woman), and (C) MOG antibody associated disease with left-sided unilateral ON (MOGAD; 46-year-old man). OCT, optical coherence tomography; RRMS, relapsing-remitting multiple sclerosis; ON, optic neuritis; OD, right eye; OS, left eye; ILM, inner limiting membrane; RNFL, retinal nerve fiber layer; AQP4-ab+, AQP4-antibody positive; NMOSD, neuromyelitis optica spectrum disorder; MOGAD, myelin-oligodendrocyte-glycoprotein associated disease.
In the past few years, a plethora of publications has reported on serum antibodies to myelin oligodendrocyte glycoprotein (MOG) in a subset of adult patients with an NMOSD phenotype (with optic neuritis being the most frequent clinical manifestation) and beyond (involvement of cranial and peripheral nerves and encephalopathy with seizures have been reported) using highly specific immunoassays (265–275). The current discussion evolves toward recognizing this condition as a disease entity distinct from AQP4 ab positive NMOSD and MS for which the acronyms “MOGAD” (MOG antibody associated disease) or “MOG-EM” (MOG antibody associated encephalomyelitis) were proposed (15, 276–279).
Neuroimaging studies with MRI in MOGAD are scant, and the few reports suggest that there is a broad overlap with AQP4 ab–positive NMOSD as to the presentation on conventional brain and spinal cord MRIs (279–284) although MOG patients were reported to show a more frequent involvement of the conus/lumbar spinal cord (285). From a clinical standpoint, it is important to bear in mind that up to 27% of patients with MOGAD may meet Barkhof criteria for MS (24). As in AQP4 ab–positive NMOSD, an algorithmic approach combining several criteria assessable on conventional brain MRIs (lesion adjacent to the body of a lateral ventricle and inferior temporal lobe lesion, U fiber lesion and Dawson's fingers) was able to discriminate between RRMS and MOGAD with good sensitivity and specificity but failed to distinguish MOGAD from AQP4 ab–positive NMOSD (286). These findings were replicated in Korean and Chinese populations in whom a distinction of MS from AQP4 ab–positive NMOSD and MOGAD was achievable with good sensitivity and specificity (287, 288); data on a distinction between MOGAD and AQP4 ab–positive NMOSD were not provided. Using principal component analysis on conventional brain images, another study was also not successful in accurately discriminating MOGAD from AQP ab–positive NMOSD (289).
In contrast, orbital MRI seems to exhibit distinctive features. A combined brain and optic nerve MRI study from Australia in 11 AQP4 ab–positive, 19 MOGAD, and 13 MS patients with a first ON in the investigated eye found more frequent optic nerve swelling in MOGAD and more frequent bilateral optic tract and chiasmal involvement in AQP4 ab–positive NMOSD (205). A predominant affection of the anterior structures of the optic nerve and bilateral involvement were also reported in MOGAD patients from the United States (281).
Retinal OCT findings in MOGAD have been inconclusive. Although some studies suggest that ON in MOGAD causes less severe retinal damage in comparison to AQP4 ab–positive NMOSD (206, 290, 291), others have found comparable thinning of the RNFL and the GCIPL in MOGAD and AQP4 ab–positive NMOSD, probably resulting from the higher ON attack rate in MOGAD (292) (Figure 5). These studies are consistent in suggesting that a single ON episode in MOGAD probably is more benign regarding its effect on the retina than a single ON attack in AQP4 ab–positive NMOSD. This is in line with several other studies reporting a generally favorable outcome from ON in MOGAD; however, exceptions to this rule with poor outcome have also been published (293–296). Interestingly, MOGAD patients seem to have better visual outcomes after ON than AQP4 ab–positive NMOSD despite similar severity of macular GCIPL thinning (297). The issue of subclinical retinal involvement in MOGAD in the absence of ON has not been well-explored. One cross-sectional study found pRNFL thinning in MOGAD NON eyes and an MME prevalence of 26% (298), and one longitudinal study with 38 eyes (18 without ON history, 20 with ON) from 24 MOGAD patients detected a higher rate of annual RNFL thinning than in healthy subjects (299). However, this was not accompanied by progressive GCIPL thinning and the reduction of RNFL over time was driven by a subgroup of patients with thicker RNFL at baseline so the question as to whether progressive retinal thinning occurs in MOGAD requires further investigation.
Although previous research in advanced neuroimaging led to a tremendous amount of new methods, parameters, and insights into MS and NMOSD diagnostic approaches and pathophysiological processes, further efforts are highly required to make these advances applicable to the clinical setting. Main short- to mid-term aims are (1) standardization of MRI and OCT parameters related to image acquisition and post-processing, (2) transfer and integration of non-conventional techniques into clinically usable procedures, and (3) validation by comparing these readily accessible techniques with current standards within the framework of large patient cohort studies and real-world research. The ultimate goal is to provide the most accurate and most cost- and time-effective markers for clinical diagnostics, therapeutic monitoring, and prognostic forecasting in individual MS and NMOSD patients.
Among the multitude of potential candidates, a selection of promising markers to be introduced into the clinical setting in the near future are the central vein sign at 3 Tesla MRI that has proven to substantially increase specificity of current McDonald 2017 diagnostic criteria in the detection of MS (58), global cerebral and specific regional cortical and deep-gray matter atrophy for monitoring and predicting disease progression and cognitive dysfunction in MS (73), OCT retinal ganglion cell layer thickness as a prognostic marker for future disease activity in patients with clinically isolated syndrome (168), and spinal cord atrophy markers for diagnostic discrimination between AQP4 ab-positive NMOSD and MOGAD and to monitor disease activity in these entities (239). However, strong efforts in terms of observational studies and testing of these markers in clinical trials are necessary to foster their establishment in clinical research and routine.
Because availability of ultra-high field (7 T) scanners has gradually increased during recent years, a noticeable shift of neuroimaging research to higher field strengths will take place in the future. By use of its higher spatial resolution and benefits to imaging contrasts inherent to higher field strengths, 7 T MRI may be used to advance quantitative neuroimaging that may have reached its technical limits at 3 T (131, 300). Moreover, readily accessible 7 T MRI markers, i.e., central vein sign, lesional hypointense rim structures, and gray matter lesion detection might aid to establish accurate diagnoses of MS, especially in patients with conflicting neuroinflammatory disease presentation, when introduced into clinical work-up (52). However, thorough research efforts are necessary to prove potential benefits of ultra-high field MRI compared to conventional MRI in the clinical setting.
Another steadily expanding field of research in MS and NMOSD that will be of interest in the long-term future of neuroimaging, is the emerging application of MRI functional and structural connectome analyses. These techniques provide novel measures by assessing the integrity and functionality of the entire CNS system rather than evaluating separate regional or qualitative alterations in isolation (301). Pathological changes in the functional network integrity in terms of network disruption or even “network collapse” show close correlations to higher order dysfunctions, i.e., predominantly cognitive deficits, in patients with MS (302). Analogously, ON status of CIS and NMOSD patients is associated with decreased connectivity in visual network density as revealed by recent application of graph theory–based tools to analyze functional imaging data (303). These findings are complemented by similar evidence in structural connectome disruption with associations to disease burden in CIS and MS (304). In addition, recent graph theory–based investigations that showed associations between decreased nucleus accumbens and caudate nucleus volumes with higher combined attack type count and longer disease duration in NMOSD lend support to the notion that multimodal network analyses including OCT and MRI parameters may help to identify subsets of promising useful imaging markers (305). However, because validity and potential clinical usefulness of these methods are still unclear, future studies will be undertaken to assess the true capacity of modern neuroimaging connectomics and graph theory–based methods to explain pathological mechanisms and to aid in monitoring and predicting specific disease activity in MS and NMOSD patients.
Imaging research in autoimmune inflammatory CNS disease has made impressive progress over the past 20 years. Yet, although we are able to deploy structural and functional imaging techniques even in patients at almost subcellular resolution that have significantly contributed to our understanding of mechanisms of tissue damage in these conditions, most of these technologies still await a validated implementation in clinical practice. This, however, is an indispensable prerequisite to make use of these advances to inform treatment decisions and monitor disease activity in individual patients. Because this has remained an unmet need from our patients' perspective, this task will hopefully be tackled despite further thrilling developments in the field of neuroimaging in autoimmune neuroinflammation, for example, OCT angiography, improved post-processing and segmentation techniques, and the use of deep learning and artificial intelligence algorithms (264, 306, 307). Similar endeavors are underway in magnetic resonance imaging that will likely revolutionize our approaches to visualize the brain (128).
FP designed the concept of the manuscript, drafted and wrote the work, and critically revised the manuscript. JK assembled, prepared and interpreted imaging data and critically revised, and added to the manuscript regarding important intellectual content.
The authors declare that the research was conducted in the absence of any commercial or financial relationships that could be construed as a potential conflict of interest. JK received congress registration fees from Biogen, speaker honoraria from Sanofi Genzyme and Bayer Schering, and research support from Krankheitsbezogenes Kompetenznetz, Multiple Sklerose (KKNMS), not related to this work. JK is participant in the BIH-Charité Junior Clinician Scientist Program funded by the Charité-Universitätsmedizin Berlin and Berlin Institute of Health.
The authors thank Charlotte Bereuter for her excellent technical support regarding OCT imaging.
1. Magyari M, Sorensen PS. The changing course of multiple sclerosis: rising incidence, change in geographic distribution, disease course, and prognosis. Curr Opin Neurol. (2019) 32:320–6. doi: 10.1097/WCO.0000000000000695
2. Koch-Henriksen N, Thygesen LC, Stenager E, Laursen B, Magyari M. Incidence of MS has increased markedly over six decades in Denmark particularly with late onset and in women. Neurology. (2018) 90:e1954–63. doi: 10.1212/WNL.0000000000005612
3. Krieger SC, Cook K, De Nino S, Fletcher M. The topographical model of multiple sclerosis: a dynamic visualization of disease course. Neurol Neuroimmunol Neuroinflamm. (2016) 3:e279. doi: 10.1212/NXI.0000000000000279
4. Mori M, Kuwabara S, Paul F. Worldwide prevalence of neuromyelitis optica spectrum disorders. J Neurol Neurosurg Psychiatry. (2018) 89:555–6. doi: 10.1136/jnnp-2017-317566
5. Gold SM, Willing A, Leypoldt F, Paul F, Friese MA. Sex differences in autoimmune disorders of the central nervous system. Semin Immunopathol. (2019) 41:177–88. doi: 10.1007/s00281-018-0723-8
6. Jarius S, Wildemann B, Paul F. Neuromyelitis optica: clinical features, immunopathogenesis and treatment. Clin Exp Immunol. (2014) 176:149–64. doi: 10.1111/cei.12271
7. Pandit L, Asgari N, Apiwattanakul M, Palace J, Paul F, Leite MI, et al. Demographic and clinical features of neuromyelitis optica: a review. Mult Scler. (2015) 21:845–53. doi: 10.1177/1352458515572406
8. Houzen H, Kondo K, Niino M, Horiuchi K, Takahashi T, Nakashima I, et al. Prevalence and clinical features of neuromyelitis optica spectrum disorders in Northern Japan. Neurology. (2017) 89:1995–2001. doi: 10.1212/WNL.0000000000004611
9. Flanagan EP, Cabre P, Weinshenker BG, Sauver JS, Jacobson DJ, Majed M, et al. Epidemiology of aquaporin-4 autoimmunity and neuromyelitis optica spectrum. Ann Neurol. (2016) 79:775–83. doi: 10.1002/ana.24617
10. Hor JY, Lim TT, Chia YK, Ching YM, Cheah CF, Tan K, et al. Prevalence of neuromyelitis optica spectrum disorder in the multi-ethnic Penang island, Malaysia, and a review of worldwide prevalence. Mult Scler Relat Disord. (2018) 19:20–4. doi: 10.1016/j.msard.2017.10.015
11. Melamed E, Levy M, Waters PJ, Sato DK, Bennett JL, John GR, et al. Update on biomarkers in neuromyelitis optica. Neurol Neuroimmunol Neuroinflamm. (2015) 2:e134. doi: 10.1212/NXI.0000000000000134
12. Jarius S, Ruprecht K, Wildemann B, Kuempfel T, Ringelstein M, Geis C, et al. Contrasting disease patterns in seropositive and seronegative neuromyelitis optica: a multicentre study of 175 patients. J Neuroinflammation. (2012) 9:14. doi: 10.1186/1742-2094-9-14
13. Metz I, Beißbarth T, Ellenberger D, Pache F, Stork L, Ringelstein M, et al. Serum peptide reactivities may distinguish neuromyelitis optica subgroups and multiple sclerosis. Neurol Neuroimmunol Neuroinflamm. (2016) 3:e204. doi: 10.1212/NXI.0000000000000204
14. Jarius S, Paul F, Franciotta D, Waters P, Zipp F, Hohlfeld R, et al. Mechanisms of disease: aquaporin-4 antibodies in neuromyelitis optica. Nat Clin Pract Neurol. (2008) 4:202–14. doi: 10.1038/ncpneuro0764
15. Borisow N, Mori M, Kuwabara S, Scheel M, Paul F. Diagnosis and treatment of NMO spectrum disorder and MOG-encephalomyelitis. Front Neurol. (2018) 9:888. doi: 10.3389/fneur.2018.00888
16. Zekeridou A, Lennon VA. Aquaporin-4 autoimmunity. Neurol Neuroimmunol Neuroinflamm. (2015) 2:e110. doi: 10.1212/NXI.0000000000000110
17. Takeshita Y, Obermeier B, Cotleur AC, Spampinato SF, Shimizu F, Yamamoto E, et al. Effects of neuromyelitis optica-IgG at the blood-brain barrier in vitro. Neurol Neuroimmunol Neuroinflamm. (2017) 4:e311. doi: 10.1212/NXI.0000000000000311
18. Trebst C, Jarius S, Berthele A, Paul F, Schippling S, Wildemann B, et al. Update on the diagnosis and treatment of neuromyelitis optica: recommendations of the neuromyelitis optica study group (NEMOS). J Neurol. (2014) 261:1–16. doi: 10.1007/s00415-013-7169-7
19. Kleiter I, Hellwig K, Berthele A, Kümpfel T, Linker RA, Hartung H-P, et al. Failure of natalizumab to prevent relapses in neuromyelitis optica. Arch Neurol. (2012) 69:239–45. doi: 10.1001/archneurol.2011.216
20. Stellmann J-P, Krumbholz M, Friede T, Gahlen A, Borisow N, Fischer K, et al. Immunotherapies in neuromyelitis optica spectrum disorder: efficacy and predictors of response. J Neurol Neurosurg Psychiatry. (2017) 88:639–47. doi: 10.1136/jnnp-2017-315603
21. Gahlen A, Trampe A-K, Haupeltshofer S, Ringelstein M, Aktas O, Berthele A, et al. Aquaporin-4 antibodies in patients treated with natalizumab for suspected MS. Neurol Neuroimmunol Neuroinflamm. (2017) 4:e363. doi: 10.1212/NXI.0000000000000363
22. Waters P, Reindl M, Saiz A, Schanda K, Tuller F, Kral V, et al. Multicentre comparison of a diagnostic assay: aquaporin-4 antibodies in neuromyelitis optica. J Neurol Neurosurg Psychiatry. (2016) 87:1005–15. doi: 10.1136/jnnp-2015-312601
23. Jurynczyk M, Weinshenker B, Akman-Demir G, Asgari N, Barnes D, Boggild M, et al. Status of diagnostic approaches to AQP4-IgG seronegative NMO and NMO/MS overlap syndromes. J Neurol. (2016) 263:140–9. doi: 10.1007/s00415-015-7952-8
24. Geraldes R, Ciccarelli O, Barkhof F, De Stefano N, Enzinger C, Filippi M, et al. The current role of MRI in differentiating multiple sclerosis from its imaging mimics. Nat Rev Neurol. (2018) 14:199–213. doi: 10.1038/nrneurol.2018.14
25. Filippi M, Preziosa P, Banwell BL, Barkhof F, Ciccarelli O, De Stefano N, et al. Assessment of lesions on magnetic resonance imaging in multiple sclerosis: practical guidelines. Brain. (2019) 142:1858–75. doi: 10.1093/brain/awz144
26. Kim HJ, Paul F, Lana-Peixoto MA, Tenembaum S, Asgari N, Palace J, et al. MRI characteristics of neuromyelitis optica spectrum disorder an international update. Neurology. (2015) 84:1165–73. doi: 10.1212/WNL.0000000000001367
27. Ciccarelli O, Cohen JA, Reingold SC, Weinshenker BG, International Conference on Spinal Cord Involvement and Imaging in Multiple Sclerosis and Neuromyelitis Optica Spectrum Disorders. Spinal cord involvement in multiple sclerosis and neuromyelitis optica spectrum disorders. Lancet Neurol. (2019) 18:185–97. doi: 10.1016/S1474-4422(18)30460-5
28. Petzold A, Wattjes MP, Costello F, Flores-Rivera J, Fraser CL, Fujihara K, et al. The investigation of acute optic neuritis: a review and proposed protocol. Nat Rev Neurol. (2014) 10:447–58. doi: 10.1038/nrneurol.2014.108
29. Rovira À, Wattjes MP, Tintoré M, Tur C, Yousry TA, Sormani MP, et al. Evidence-based guidelines: MAGNIMS consensus guidelines on the use of MRI in multiple sclerosis-clinical implementation in the diagnostic process. Nat Rev Neurol. (2015) 11:471–82. doi: 10.1038/nrneurol.2015.106
30. Tur C, Moccia M, Barkhof F, Chataway J, Sastre-Garriga J, Thompson AJ, et al. Assessing treatment outcomes in multiple sclerosis trials and in the clinical setting. Nat Rev Neurol. (2018) 14:75–93. doi: 10.1038/nrneurol.2017.171
31. Kawachi I, Lassmann H. Neurodegeneration in multiple sclerosis and neuromyelitis optica. J Neurol Neurosurg Psychiatry. (2017) 88:137–45. doi: 10.1136/jnnp-2016-313300
32. Akaishi T, Nakashima I, Sato DK, Takahashi T, Fujihara K. Neuromyelitis optica spectrum disorders. Neuroimaging Clin N Am. (2017) 27:251–65. doi: 10.1016/j.nic.2016.12.010
33. Cree BA, Bennett JL, Sheehan M, Cohen J, Hartung H-P, Aktas O, et al. Placebo-controlled study in neuromyelitis optica-Ethical and design considerations. Mult Scler. (2016) 22:862–72. doi: 10.1177/1352458515620934
34. Cree BAC, Bennett JL, Kim HJ, Weinshenker BG, Pittock SJ, Wingerchuk DM, et al. Inebilizumab for the treatment of neuromyelitis optica spectrum disorder (N-MOmentum): a double-blind, randomised placebo-controlled phase 2/3 trial. Lancet. (2019) 394:1352–63. doi: 10.1016/S0140-6736(19)31817-3
35. Paul F, Murphy O, Pardo S, Levy M. Investigational drugs in development to prevent neuromyelitis optica relapses. Expert Opin Investig Drugs. (2018) 27:265–71. doi: 10.1080/13543784.2018.1443077
36. Pittock SJ, Berthele A, Fujihara K, Kim HJ, Levy M, Palace J, et al. Eculizumab in aquaporin-4-positive neuromyelitis optica spectrum disorder. N Engl J Med. (2019) 381:614–25. doi: 10.1056/NEJMoa1900866
37. Duchow A, Paul F, Bellmann-Strobl J. Current and emerging biologics for the treatment of neuromyelitis optica spectrum disorders. Expert Opin Biol Ther. (2020). doi: 10.1080/14712598.2020.1749259. [Epub ahead of print].
38. Amiri H, de Sitter A, Bendfeldt K, Battaglini M, Gandini Wheeler-Kingshott CAM, Calabrese M, et al. Urgent challenges in quantification and interpretation of brain grey matter atrophy in individual MS patients using MRI. Neuroimage Clin. (2018) 19:466–75. doi: 10.1016/j.nicl.2018.04.023
39. Oertel FC, Zimmermann HG, Brandt AU, Paul F. Novel uses of retinal imaging with optical coherence tomography in multiple sclerosis. Expert Rev Neurother. (2019) 19:31–43. doi: 10.1080/14737175.2019.1559051
40. Chien C, Brandt AU, Schmidt F, Bellmann-Strobl J, Ruprecht K, Paul F, et al. MRI-based methods for spinal cord atrophy evaluation: a comparison of cervical cord cross-sectional area, cervical cord volume, and full spinal cord volume in patients with aquaporin-4 antibody seropositive neuromyelitis optica spectrum disorders. AJNR Am J Neuroradiol. (2018) 39:1362–8. doi: 10.3174/ajnr.A5665
41. Thompson AJ, Banwell BL, Barkhof F, Carroll WM, Coetzee T, Comi G, et al. Diagnosis of multiple sclerosis: 2017 revisions of the McDonald criteria. Lancet Neurol. (2018) 17:162–73. doi: 10.1016/S1474-4422(17)30470-2
42. Schwenkenbecher P, Wurster U, Konen FF, Gingele S, Sühs K-W, Wattjes MP, et al. Impact of the McDonald criteria 2017 on early diagnosis of relapsing-remitting multiple sclerosis. Front Neurol. (2019) 10:188. doi: 10.3389/fneur.2019.00188
43. van der Vuurst de Vries RM, Mescheriakova JY, Wong YYM, Runia TF, Jafari N, Samijn JP, et al. Application of the 2017 revised McDonald criteria for multiple sclerosis to patients with a typical clinically isolated syndrome. JAMA Neurol. (2018) 75:1392–8. doi: 10.1001/jamaneurol.2018.2160
44. Gobbin F, Zanoni M, Marangi A, Orlandi R, Crestani L, Benedetti MD, et al. 2017 McDonald criteria for multiple sclerosis: earlier diagnosis with reduced specificity? Mult Scler Relat Disord. (2019). 29:23–5. doi: 10.1016/j.msard.2019.01.008
45. Wong YYM, de Mol CL, van der Vuurst de Vries RM, van Pelt ED, Ketelslegers IA, Catsman-Berrevoets CE, et al. Real-world validation of the 2017 McDonald criteria for pediatric MS. Neurol Neuroimmunol Neuroinflamm. (2019) 6:e528. doi: 10.1212/NXI.0000000000000528
46. Kaisey M, Solomon AJ, Luu M, Giesser BS, Sicotte NL. Incidence of multiple sclerosis misdiagnosis in referrals to two academic centers. Mult Scler Relat Disord. (2019) 30:51–6. doi: 10.1016/j.msard.2019.01.048
47. Calabrese M, Gasperini C, Tortorella C, Schiavi G, Frisullo G, Ragonese P, et al. “Better explanations” in multiple sclerosis diagnostic workup: a 3-year longitudinal study. Neurology. (2019) 92:e2527–37. doi: 10.1212/WNL.0000000000007573
48. Solomon AJ, Naismith RT, Cross AH. Misdiagnosis of multiple sclerosis: impact of the 2017 McDonald criteria on clinical practice. Neurology. (2019) 92:26–33. doi: 10.1212/WNL.0000000000006583
49. Solomon AJ. Instead of tweaking the diagnostic criteria for MS in those with CIS, we should develop diagnostic criteria that distinguish MS from other conditions - Yes. Mult Scler. (2019) 25:766–8. doi: 10.1177/1352458518813107
50. Mistry N, Abdel-Fahim R, Samaraweera A, Mougin O, Tallantyre E, Tench C, et al. Imaging central veins in brain lesions with 3-T T2*-weighted magnetic resonance imaging differentiates multiple sclerosis from microangiopathic brain lesions. Mult Scler. (2016) 22:1289–96. doi: 10.1177/1352458515616700
51. Tallantyre EC, Dixon JE, Donaldson I, Owens T, Morgan PS, Morris PG, et al. Ultra-high-field imaging distinguishes MS lesions from asymptomatic white matter lesions. Neurology. (2011) 76:534–9. doi: 10.1212/WNL.0b013e31820b7630
52. Sinnecker T, Kuchling J, Dusek P, Dörr J, Niendorf T, Paul F, et al. Ultrahigh field MRI in clinical neuroimmunology: a potential contribution to improved diagnostics and personalised disease management. EPMA J. (2015) 6:16. doi: 10.1186/s13167-015-0038-y
53. Müller K, Kuchling J, Dörr J, Harms L, Ruprecht K, Niendorf T, et al. Detailing intra-lesional venous lumen shrinking in multiple sclerosis investigated by sFLAIR MRI at 7-T. J Neurol. (2014) 261:2032–6. doi: 10.1007/s00415-014-7460-2
54. Sinnecker T, Dorr J, Pfueller CF, Harms L, Ruprecht K, Jarius S, et al. Distinct lesion morphology at 7-T MRI differentiates neuromyelitis optica from multiple sclerosis. Neurology. (2012) 79:708–14. doi: 10.1212/WNL.0b013e3182648bc8
55. Wuerfel J, Sinnecker T, Ringelstein EB, Jarius S, Schwindt W, Niendorf T, et al. Lesion morphology at 7 tesla MRI differentiates Susac syndrome from multiple sclerosis. Mult Scler J. (2012) 18:1592–9. doi: 10.1177/1352458512441270
56. Maggi P, Absinta M, Grammatico M, Vuolo L, Emmi G, Carlucci G, et al. Central vein sign differentiates multiple sclerosis from central nervous system inflammatory vasculopathies. Ann Neurol. (2018) 83:283–94. doi: 10.1002/ana.25146
57. Cortese R, Magnollay L, Tur C, Abdel-Aziz K, Jacob A, De Angelis F, et al. Value of the central vein sign at 3T to differentiate MS from seropositive NMOSD. Neurology. (2018) 90:e1183–90. doi: 10.1212/WNL.0000000000005256
58. Sinnecker T, Clarke MA, Meier D, Enzinger C, Calabrese M, De Stefano N, et al. Evaluation of the central vein sign as a diagnostic imaging biomarker in multiple sclerosis. JAMA Neurol. (2019) 76:1446–56. doi: 10.1001/jamaneurol.2019.2478
59. Dobson R, Giovannoni G. Multiple sclerosis – a review. Eur J Neurol. (2019) 26:27–40. doi: 10.1111/ene.13819
60. Mainero C, Granberg T. Visualization of cortical MS lesions with MRI need not be further improved - NO. Mult Scler. (2017) 23:17–9. doi: 10.1177/1352458516666336
61. Kilsdonk ID, Jonkman LE, Klaver R, van Veluw SJ, Zwanenburg JJM, Kuijer JPA, et al. Increased cortical grey matter lesion detection in multiple sclerosis with 7 T MRI: a post-mortem verification study. Brain. (2016) 139:1472–81. doi: 10.1093/brain/aww037
62. Calabrese M, Filippi M, Gallo P. Cortical lesions in multiple sclerosis. Nat Rev Neurol. (2010) 6:438–44. doi: 10.1038/nrneurol.2010.93
63. Beck ES, Sati P, Sethi V, Kober T, Dewey B, Bhargava P, et al. Improved visualization of cortical lesions in multiple sclerosis using 7T MP2RAGE. AJNR Am J Neuroradiol. (2018) 39:459–66. doi: 10.3174/ajnr.A5534
64. Azevedo CJ, Overton E, Khadka S, Buckley J, Liu S, Sampat M, et al. Early CNS neurodegeneration in radiologically isolated syndrome. Neurol Neuroimmunol Neuroinflamm. (2015) 2:e102. doi: 10.1212/NXI.0000000000000102
65. Solomon AJ, Watts R, Dewey BE, Reich DS. MRI evaluation of thalamic volume differentiates MS from common mimics. Neurol Neuroimmunol Neuroinflamm. (2017) 4:e387. doi: 10.1212/NXI.0000000000000387
66. Alcaide-Leon P, Cybulsky K, Sankar S, Casserly C, Leung G, Hohol M, et al. Quantitative spinal cord MRI in radiologically isolated syndrome. Neurol Neuroimmunol Neuroinflamm. (2018) 5:e436. doi: 10.1212/NXI.0000000000000436
67. Minagar A, Barnett MH, Benedict RHB, Pelletier D, Pirko I, Sahraian MA, et al. The thalamus and multiple sclerosis: modern views on pathologic, imaging, and clinical aspects. Neurology. (2013) 80:210–9. doi: 10.1212/WNL.0b013e31827b910b
68. Sastre-Garriga J, Pareto D, Rovira À. Brain atrophy in multiple sclerosis: clinical relevance and technical aspects. Neuroimaging Clin N Am. (2017) 27:289–300. doi: 10.1016/j.nic.2017.01.002
69. Eshaghi A, Prados F, Brownlee WJ, Altmann DR, Tur C, Cardoso MJ, et al. Deep gray matter volume loss drives disability worsening in multiple sclerosis. Ann Neurol. (2018) 83:210–22. doi: 10.1002/ana.25145
70. Zeydan B, Gu X, Atkinson EJ, Keegan BM, Weinshenker BG, Tillema J-M, et al. Cervical spinal cord atrophy: an early marker of progressive MS onset. Neurol Neuroimmunol Neuroinflamm. (2018) 5:e435. doi: 10.1212/NXI.0000000000000435
71. Paul F. Pathology and MRI: exploring cognitive impairment in MS. Acta Neurol Scand. (2016) 134(Suppl. 200):24–33. doi: 10.1111/ane.12649
72. Rocca MA, Comi G, Filippi M. The role of T1-weighted derived measures of neurodegeneration for assessing disability progression in multiple sclerosis. Front Neurol. (2017) 8:433. doi: 10.3389/fneur.2017.00433
73. Rocca MA, Battaglini M, Benedict RHB, De Stefano N, Geurts JJG, Henry RG, et al. Brain MRI atrophy quantification in MS: from methods to clinical application. Neurology. (2017) 88:403–13. doi: 10.1212/WNL.0000000000003542
74. Schlaeger R, Papinutto N, Panara V, Bevan C, Lobach IV, Bucci M, et al. Spinal cord gray matter atrophy correlates with multiple sclerosis disability. Ann Neurol. (2014) 76:568–80. doi: 10.1002/ana.24241
75. Schlaeger R, Papinutto N, Zhu AH, Lobach IV, Bevan CJ, Bucci M, et al. Association between thoracic spinal cord gray matter atrophy and disability in multiple sclerosis. JAMA Neurol. (2015) 72:897–904. doi: 10.1001/jamaneurol.2015.0993
76. Lukas C, Knol DL, Sombekke MH, Bellenberg B, Hahn HK, Popescu V, et al. Cervical spinal cord volume loss is related to clinical disability progression in multiple sclerosis. J Neurol Neurosurg Psychiatry. (2015) 86:410–8. doi: 10.1136/jnnp-2014-308021
77. Rasche L, Scheel M, Otte K, Althoff P, van Vuuren AB, Gieß RM, et al. MRI markers and functional performance in patients with CIS and MS: a cross-sectional study. Front Neurol. (2018) 9:718. doi: 10.3389/fneur.2018.00718
78. Andelova M, Uher T, Krasensky J, Sobisek L, Kusova E, Srpova B, et al. Additive effect of spinal cord volume, diffuse and focal cord pathology on disability in multiple sclerosis. Front Neurol. (2019) 10:820. doi: 10.3389/fneur.2019.00820
79. Bermel RA, Bakshi R. The measurement and clinical relevance of brain atrophy in multiple sclerosis. Lancet Neurol. (2006) 5:158–70. doi: 10.1016/S1474-4422(06)70349-0
80. De Stefano N, Stromillo ML, Giorgio A, Bartolozzi ML, Battaglini M, Baldini M, et al. Establishing pathological cut-offs of brain atrophy rates in multiple sclerosis. J Neurol Neurosurg Psychiatry. (2016) 87:93–9. doi: 10.1136/jnnp-2014-309903
81. De Stefano N, Tomic D, Radue E-W, Sprenger T, Meier DP, Häring D, et al. Effect of fingolimod on diffuse brain tissue damage in relapsing-remitting multiple sclerosis patients. Mult Scler Relat Disord. (2016) 7:98–101. doi: 10.1016/j.msard.2016.03.017
82. Sinnecker T, Granziera C, Wuerfel J, Schlaeger R. Future brain and spinal cord volumetric imaging in the clinic for monitoring treatment response in MS. Curr Treat Options Neurol. (2018) 20:17. doi: 10.1007/s11940-018-0504-7
83. Cortese R, Collorone S, Ciccarelli O, Toosy AT. Advances in brain imaging in multiple sclerosis. Ther Adv Neurol Disord. (2019) 12:1756286419859722. doi: 10.1177/1756286419859722
84. Radue E-W, Sprenger T, Gaetano L, Mueller-Lenke N, Cavalier S, Thangavelu K, et al. Teriflunomide slows BVL in relapsing MS: a reanalysis of the TEMSO MRI data set using SIENA. Neurol Neuroimmunol Neuroinflamm. (2017) 4:e390. doi: 10.1212/NXI.0000000000000390
85. Spain R, Powers K, Murchison C, Heriza E, Winges K, Yadav V, et al. Lipoic acid in secondary progressive MS: a randomized controlled pilot trial. Neurol Neuroimmunol Neuroinflamm. (2017) 4:e374. doi: 10.1212/NXI.0000000000000374
86. Biberacher V, Schmidt P, Keshavan A, Boucard CC, Righart R, Sämann P, et al. Intra- and interscanner variability of magnetic resonance imaging based volumetry in multiple sclerosis. Neuroimage. (2016) 142:188–97. doi: 10.1016/j.neuroimage.2016.07.035
87. Barkhof F. Brain atrophy measurements should be used to guide therapy monitoring in MS - NO. Mult Scler. (2016) 22:1524–6. doi: 10.1177/1352458516649452
88. Moccia M, Ruggieri S, Ianniello A, Toosy A, Pozzilli C, Ciccarelli O. Advances in spinal cord imaging in multiple sclerosis. Ther Adv Neurol Disord. (2019) 12:1756286419840593. doi: 10.1177/1756286419840593
89. Brownlee WJ, Altmann DR, Alves Da Mota P, Swanton JK, Miszkiel KA, Wheeler-Kingshott CG, et al. Association of asymptomatic spinal cord lesions and atrophy with disability 5 years after a clinically isolated syndrome. Mult Scler J. (2017) 23:665–74. doi: 10.1177/1352458516663034
90. Rocca MA, Valsasina P, Meani A, Gobbi C, Zecca C, Rovira À, et al. Clinically relevant cranio-caudal patterns of cervical cord atrophy evolution in MS. Neurology. (2019) 93:e1852–66. doi: 10.1212/WNL.0000000000008466
91. Hagström IT, Schneider R, Bellenberg B, Salmen A, Weiler F, Köster O, et al. Relevance of early cervical cord volume loss in the disease evolution of clinically isolated syndrome and early multiple sclerosis: a 2-year follow-up study. J Neurol. (2017) 264:1402–12. doi: 10.1007/s00415-017-8537-5
92. Weeda MM, Middelkoop SM, Steenwijk MD, Daams M, Amiri H, Brouwer I, et al. Validation of mean upper cervical cord area (MUCCA) measurement techniques in multiple sclerosis (MS): high reproducibility and robustness to lesions, but large software and scanner effects. Neuroimage Clin. (2019) 24:101962. doi: 10.1016/j.nicl.2019.101962
93. Tsagkas C, Magon S, Gaetano L, Pezold S, Naegelin Y, Amann M, et al. Spinal cord volume loss: a marker of disease progression in multiple sclerosis. Neurology. (2018) 91:e349–58. doi: 10.1212/WNL.0000000000005853
94. Brownlee WJ, Altmann DR, Prados F, Miszkiel KA, Eshaghi A, Gandini Wheeler-Kingshott CAM, et al. Early imaging predictors of long-term outcomes in relapse-onset multiple sclerosis. Brain. (2019) 142:2276–87. doi: 10.1093/brain/awz156
95. Schmierer K, Wheeler-Kingshott CAM, Boulby PA, Scaravilli F, Altmann DR, Barker GJ, et al. Diffusion tensor imaging of post mortem multiple sclerosis brain. Neuroimage. (2007) 35:467–77. doi: 10.1016/j.neuroimage.2006.12.010
96. Rotstein DL, Healy BC, Malik MT, Chitnis T, Weiner HL. Evaluation of no evidence of disease activity in a 7-year longitudinal multiple sclerosis cohort. JAMA Neurol. (2015) 72:152–8. doi: 10.1001/jamaneurol.2014.3537
97. Bevan CJ, Cree BAC. Disease activity free status: a new end point for a new era in multiple sclerosis clinical research? JAMA Neurol. (2014) 71:269–70. doi: 10.1001/jamaneurol.2013.5486
98. University of California San Francisco MS-EPIC Team, Cree BAC, Gourraud P-A, Oksenberg JR, Bevan C, Crabtree-Hartman E, et al. Long-term evolution of multiple sclerosis disability in the treatment era. Ann Neurol. (2016) 80:499–510. doi: 10.1002/ana.24747
99. Penner I-K, Paul F. Fatigue as a symptom or comorbidity of neurological diseases. Nat Rev Neurol. (2017) 13:662–75. doi: 10.1038/nrneurol.2017.117
100. Veauthier C, Paul F. Sleep disorders in multiple sclerosis and their relationship to fatigue. Sleep Med. (2014) 15:5–14. doi: 10.1016/j.sleep.2013.08.791
101. Veauthier C, Hasselmann H, Gold SM, Paul F. The Berlin treatment algorithm: recommendations for tailored innovative therapeutic strategies for multiple sclerosis-related fatigue. EPMA J. (2016) 7:25. doi: 10.1186/s13167-016-0073-3
102. Veauthier C, Radbruch H, Gaede G, Pfueller CF, Dörr J, Bellmann-Strobl J, et al. Fatigue in multiple sclerosis is closely related to sleep disorders: a polysomnographic cross-sectional study. Mult Scler. (2011) 17:613–22. doi: 10.1177/1352458510393772
103. Heesen C, Haase R, Melzig S, Poettgen J, Berghoff M, Paul F, et al. Perceptions on the value of bodily functions in multiple sclerosis. Acta Neurol Scand. (2018) 137:356–62. doi: 10.1111/ane.12881
104. Hasselmann H, Bellmann-Strobl J, Ricken R, Oberwahrenbrock T, Rose M, Otte C, et al. Characterizing the phenotype of multiple sclerosis-associated depression in comparison with idiopathic major depression. Mult Scler. (2016) 22:1476–84. doi: 10.1177/1352458515622826
105. Damasceno A, Damasceno BP, Cendes F. No evidence of disease activity in multiple sclerosis: implications on cognition and brain atrophy. Mult Scler. (2016) 22:64–72. doi: 10.1177/1352458515604383
106. Finke C, Schlichting J, Papazoglou S, Scheel M, Freing A, Soemmer C, et al. Altered basal ganglia functional connectivity in multiple sclerosis patients with fatigue. Mult Scler. (2015) 21:925–34. doi: 10.1177/1352458514555784
107. Weinges-Evers N, Brandt AU, Bock M, Pfueller CF, Dorr J, Bellmann-Strobl J, et al. Correlation of self-assessed fatigue and alertness in multiple sclerosis. Mult Scler. (2010) 16:1134–40. doi: 10.1177/1352458510374202
108. Urbanek C, Weinges-Evers N, Bellmann-Strobl J, Bock M, Dorr J, Hahn E, et al. Attention network test reveals alerting network dysfunction in multiple sclerosis. Mult Scler J. (2010) 16:93–9. doi: 10.1177/1352458509350308
109. Gaede G, Tiede M, Lorenz I, Brandt AU, Pfueller C, Dörr J, et al. Safety and preliminary efficacy of deep transcranial magnetic stimulation in MS-related fatigue. Neurol Neuroimmunol Neuroinflamm. (2018) 5:e423. doi: 10.1212/NXI.0000000000000423
110. Schlemm L, Chien C, Bellmann-Strobl J, Dörr J, Wuerfel J, Brandt AU, et al. Gadopentetate but not gadobutrol accumulates in the dentate nucleus of multiple sclerosis patients. Mult Scler. (2017) 23:963–72. doi: 10.1177/1352458516670738
111. Zivadinov R, Bergsland N, Hagemeier J, Ramasamy DP, Dwyer MG, Schweser F, et al. Cumulative gadodiamide administration leads to brain gadolinium deposition in early MS. Neurology. (2019) 93:e611–23. doi: 10.1212/WNL.0000000000007892
112. El-Khatib AH, Radbruch H, Trog S, Neumann B, Paul F, Koch A, et al. Gadolinium in human brain sections and colocalization with other elements. Neurol Neuroimmunol Neuroinflamm. (2019) 6:e515. doi: 10.1212/NXI.0000000000000515
113. Gulani V, Calamante F, Shellock FG, Kanal E, Reeder SB, International Society for Magnetic Resonance in Medicine. Gadolinium deposition in the brain: summary of evidence and recommendations. Lancet Neurol. (2017) 16:564–70. doi: 10.1016/S1474-4422(17)30158-8
114. Gasperini C, Prosperini L, Tintoré M, Sormani MP, Filippi M, Rio J, et al. Unraveling treatment response in multiple sclerosis: a clinical and MRI challenge. Neurology. (2019) 92:180–92. doi: 10.1212/WNL.0000000000006810
115. Stangel M, Penner IK, Kallmann BA, Lukas C, Kieseier BC. Towards the implementation of “no evidence of disease activity” in multiple sclerosis treatment: the multiple sclerosis decision model. Ther Adv Neurol Disord. (2015) 8:3–13. doi: 10.1177/1756285614560733
116. Kappos L, De Stefano N, Freedman MS, Cree BA, Radue E-W, Sprenger T, et al. Inclusion of brain volume loss in a revised measure of “no evidence of disease activity” (NEDA-4) in relapsing-remitting multiple sclerosis. Mult Scler. (2016) 22:1297–305. doi: 10.1177/1352458515616701
117. Lu G, Beadnall HN, Barton J, Hardy TA, Wang C, Barnett MH. The evolution of “No evidence of disease activity” in multiple sclerosis. Mult Scler Relat Disord. (2018) 20:231–8. doi: 10.1016/j.msard.2017.12.016
118. Inglese M, Petracca M. MRI in multiple sclerosis: clinical and research update. Curr Opin Neurol. (2018) 31:249–55. doi: 10.1097/WCO.0000000000000559
119. Oh J, Ontaneda D, Azevedo C, Klawiter EC, Absinta M, Arnold DL, et al. Imaging outcome measures of neuroprotection and repair in MS: a consensus statement from NAIMS. Neurology. (2019) 92:519–33. doi: 10.1212/WNL.0000000000007099
120. Kuchling J, Brandt AU, Paul F, Scheel M. Diffusion tensor imaging for multilevel assessment of the visual pathway: possibilities for personalized outcome prediction in autoimmune disorders of the central nervous system. EPMA J. (2017) 8:279–94. doi: 10.1007/s13167-017-0102-x
121. Jaeger S, Paul F, Scheel M, Brandt A, Heine J, Pach D, et al. Multiple sclerosis-related fatigue: altered resting-state functional connectivity of the ventral striatum and dorsolateral prefrontal cortex. Mult Scler. (2019) 25:554–64. doi: 10.1177/1352458518758911
122. Weygandt M, Meyer-Arndt L, Behrens JR, Wakonig K, Bellmann-Strobl J, Ritter K, et al. Stress-induced brain activity, brain atrophy, and clinical disability in multiple sclerosis. Proc Natl Acad Sci USA. (2016) 113:13444–9. doi: 10.1073/pnas.1605829113
123. Backner Y, Kuchling J, Massarwa S, Oberwahrenbrock T, Finke C, Bellmann-Strobl J, et al. Anatomical wiring and functional networking changes in the visual system following optic neuritis. JAMA Neurol. (2018) 75:287–95. doi: 10.1001/jamaneurol.2017.3880
124. Righart R, Biberacher V, Jonkman LE, Klaver R, Schmidt P, Buck D, et al. Cortical pathology in multiple sclerosis detected by the T1/T2-weighted ratio from routine magnetic resonance imaging. Ann Neurol. (2017) 82:519–29. doi: 10.1002/ana.25020
125. Cooper G, Finke C, Chien C, Brandt AU, Asseyer S, Ruprecht K, et al. Standardization of T1w/T2w ratio improves detection of tissue damage in multiple sclerosis. Front Neurol. (2019) 10:334. doi: 10.3389/fneur.2019.00334
126. Ciccarelli O, Barkhof F, Bodini B, De Stefano N, Golay X, Nicolay K, et al. Pathogenesis of multiple sclerosis: insights from molecular and metabolic imaging. Lancet Neurol. (2014) 13:807–22. doi: 10.1016/S1474-4422(14)70101-2
127. Matthews PM. Chronic inflammation in multiple sclerosis - seeing what was always there. Nat Rev Neurol. (2019) 15:582–93. doi: 10.1038/s41582-019-0240-y
128. Eitel F, Soehler E, Bellmann-Strobl J, Brandt AU, Ruprecht K, Giess RM, et al. Uncovering convolutional neural network decisions for diagnosing multiple sclerosis on conventional MRI using layer-wise relevance propagation. Neuroimage Clin. (2019) 24:102003. doi: 10.1016/j.nicl.2019.102003
129. Kuchling J, Backner Y, Oertel FC, Raz N, Bellman-Strobl J, Ruprecht K, et al. Comparison of probabilistic tractography and tract-based spatial statistics for assessing optic radiation damage in patients with autoimmune inflammatory disorders of the central nervous system. Neuroimage Clin. (2018) 19:538–50. doi: 10.1016/j.nicl.2018.05.004
130. Fehlner A, Behrens JR, Streitberger K-J, Papazoglou S, Braun J, Bellmann-Strobl J, et al. Higher-resolution MR elastography reveals early mechanical signatures of neuroinflammation in patients with clinically isolated syndrome. J Magn Reson Imaging. (2016) 44:51–8. doi: 10.1002/jmri.25129
131. Sinnecker T, Schumacher S, Mueller K, Pache F, Dusek P, Harms L, et al. MRI phase changes in multiple sclerosis vs neuromyelitis optica lesions at 7T. Neurol Neuroimmunol Neuroinflamm. (2016) 3:e259. doi: 10.1212/NXI.0000000000000259
132. Pawlitzki M, Neumann J, Kaufmann J, Heidel J, Stadler E, Sweeney-Reed C, et al. Loss of corticospinal tract integrity in early MS disease stages. Neurol Neuroimmunol Neuroinflamm. (2017) 4:e399. doi: 10.1212/NXI.0000000000000399
133. Rissanen E, Tuisku J, Vahlberg T, Sucksdorff M, Paavilainen T, Parkkola R, et al. Microglial activation, white matter tract damage, and disability in MS. Neurol Neuroimmunol Neuroinflamm. (2018) 5:e443. doi: 10.1212/NXI.0000000000000443
134. Spanò B, Giulietti G, Pisani V, Morreale M, Tuzzi E, Nocentini U, et al. Disruption of neurite morphology parallels MS progression. Neurol Neuroimmunol Neuroinflamm. (2018) 5:e502. doi: 10.1212/NXI.0000000000000502
135. Moccia M, Prados F, Filippi M, Rocca MA, Valsasina P, Brownlee WJ, et al. Longitudinal spinal cord atrophy in multiple sclerosis using the generalized boundary shift integral. Ann Neurol. (2019) 86:704–13. doi: 10.1002/ana.25571
136. Zimmermann H, Oberwahrenbrock T, Brandt AU, Paul F, Dörr J. Optical coherence tomography for retinal imaging in multiple sclerosis. Degen Neurol Neuromuscular Dis. (2014) 4:153–62. doi: 10.2147/DNND.S73506
137. Sühs K-W, Hein K, Sättler MB, Görlitz A, Ciupka C, Scholz K, et al. A randomized, double-blind, phase 2 study of erythropoietin in optic neuritis. Ann Neurol. (2012) 72:199–210. doi: 10.1002/ana.23573
138. Diem R, Molnar F, Beisse F, Gross N, Drüschler K, Heinrich SP, et al. Treatment of optic neuritis with erythropoietin (TONE): a randomised, double-blind, placebo-controlled trial-study protocol. BMJ Open. (2016) 6:e010956. doi: 10.1136/bmjopen-2015-010956
139. Raftopoulos R, Hickman SJ, Toosy A, Sharrack B, Mallik S, Paling D, et al. Phenytoin for neuroprotection in patients with acute optic neuritis: a randomised, placebo-controlled, phase 2 trial. Lancet Neurol. (2016) 15:259–69. doi: 10.1016/S1474-4422(16)00004-1
140. Oberwahrenbrock T, Traber GL, Lukas S, Gabilondo I, Nolan R, Songster C, et al. Multicenter reliability of semiautomatic retinal layer segmentation using OCT. Neurol Neuroimmunol Neuroinflamm. (2018) 5:e449. doi: 10.1212/NXI.0000000000000449
141. Schippling S, Balk LJ, Costello F, Albrecht P, Balcer L, Calabresi PA, et al. Quality control for retinal OCT in multiple sclerosis: validation of the OSCAR-IB criteria. Mult Scler. (2015) 21:163–70. doi: 10.1177/1352458514538110
142. Cruz-Herranz A, Balk LJ, Oberwahrenbrock T, Saidha S, Martinez-Lapiscina EH, Lagreze WA, et al. The APOSTEL recommendations for reporting quantitative optical coherence tomography studies. Neurology. (2016) 86:2303–9. doi: 10.1212/WNL.0000000000002774
143. Oertel FC, Zimmermann H, Mikolajczak J, Weinhold M, Kadas EM, Oberwahrenbrock T, et al. Contribution of blood vessels to retinal nerve fiber layer thickness in NMOSD. Neurol Neuroimmunol Neuroinflamm. (2017) 4:e338. doi: 10.1212/NXI.0000000000000338
144. Petzold A, Balcer LJ, Calabresi PA, Costello F, Frohman TC, Frohman EM, et al. Retinal layer segmentation in multiple sclerosis: a systematic review and meta-analysis. Lancet Neurol. (2017) 16:797–812. doi: 10.1016/S1474-4422(17)30278-8
145. Oberwahrenbrock T, Schippling S, Ringelstein M, Kaufhold F, Zimmermann H, Keser N, et al. Retinal damage in multiple sclerosis disease subtypes measured by high-resolution optical coherence tomography. Mult Scler Int. (2012) 2012:530305. doi: 10.1155/2012/530305
146. Brandt AU, Specovius S, Oberwahrenbrock T, Zimmermann HG, Paul F, Costello F. Frequent retinal ganglion cell damage after acute optic neuritis. Mult Scler Relat Disord. (2018) 22:141–7. doi: 10.1016/j.msard.2018.04.006
147. Oberwahrenbrock T, Ringelstein M, Jentschke S, Deuschle K, Klumbies K, Bellmann-Strobl J, et al. Retinal ganglion cell and inner plexiform layer thinning in clinically isolated syndrome. Mult Scler. (2013) 19:1887–95. doi: 10.1177/1352458513489757
148. Knier B, Berthele A, Buck D, Schmidt P, Zimmer C, Mühlau M, et al. Optical coherence tomography indicates disease activity prior to clinical onset of central nervous system demyelination. Mult Scler. (2016) 22:893–900. doi: 10.1177/1352458515604496
149. Walter SD, Ishikawa H, Galetta KM, Sakai RE, Feller DJ, Henderson SB, et al. Ganglion cell loss in relation to visual disability in multiple sclerosis. Ophthalmology. (2012) 119:1250–7. doi: 10.1016/j.ophtha.2011.11.032
150. Dörr J, Wernecke KD, Bock M, Gaede G, Wuerfel JT, Pfueller CF, et al. Association of retinal and macular damage with brain atrophy in multiple sclerosis. PLoS ONE. (2011) 6:e18132. doi: 10.1371/journal.pone.0018132
151. Pfueller CF, Brandt AU, Schubert F, Bock M, Walaszek B, Waiczies H, et al. Metabolic changes in the visual cortex are linked to retinal nerve fiber layer thinning in multiple sclerosis. PLoS ONE. (2011) 6:e18019. doi: 10.1371/journal.pone.0018019
152. Zimmermann H, Freing A, Kaufhold F, Gaede G, Bohn E, Bock M, et al. Optic neuritis interferes with optical coherence tomography and magnetic resonance imaging correlations. Mult Scler J. (2013) 19:443–50. doi: 10.1177/1352458512457844
153. Ratchford JN, Saidha S, Sotirchos ES, Oh JA, Seigo MA, Eckstein C, et al. Active MS is associated with accelerated retinal ganglion cell/inner plexiform layer thinning. Neurology. (2013) 80:47–54. doi: 10.1212/WNL.0b013e31827b1a1c
154. Saidha S, Al-Louzi O, Ratchford JN, Bhargava P, Oh J, Newsome SD, et al. Optical coherence tomography reflects brain atrophy in multiple sclerosis: a four-year study. Ann Neurol. (2015) 78:801–13. doi: 10.1002/ana.24487
155. Waldman AT, Liu GT, Lavery AM, Liu G, Gaetz W, Aleman TS, et al. Optical coherence tomography and visual evoked potentials in pediatric MS. Neurol Neuroimmunol Neuroinflamm. (2017) 4:e356. doi: 10.1212/NXI.0000000000000356
156. Ayadi N, Dörr J, Motamedi S, Gawlik K, Bellmann-Strobl J, Mikolajczak J, et al. Temporal visual resolution and disease severity in MS. Neurol Neuroimmunol Neuroinflamm. (2018) 5:e492. doi: 10.1212/NXI.0000000000000492
157. You Y, Graham EC, Shen T, Yiannikas C, Parratt J, Gupta V, et al. Progressive inner nuclear layer dysfunction in non-optic neuritis eyes in MS. Neurol Neuroimmunol Neuroinflamm. (2018) 5:e427. doi: 10.1212/NXI.0000000000000427
158. Cellerino M, Cordano C, Boffa G, Bommarito G, Petracca M, Sbragia E, et al. Relationship between retinal inner nuclear layer, age, and disease activity in progressive MS. Neurol Neuroimmunol Neuroinflamm. (2019). doi: 10.1212/NXI.0000000000000596. [Epub ahead of print].
159. Sinnecker T, Oberwahrenbrock T, Metz I, Zimmermann H, Pfueller CF, Harms L, et al. Optic radiation damage in multiple sclerosis is associated with visual dysfunction and retinal thinning – an ultrahigh-field MR pilot study. Eur Radiol. (2015) 25:122–31. doi: 10.1007/s00330-014-3358-8
160. Brandt AU, Oberwahrenbrock T, Ringelstein M, Young KL, Tiede M, Hartung HP, et al. Primary retinal pathology in multiple sclerosis as detected by optical coherence tomography. Brain. (2011) 134:518–3. doi: 10.1093/brain/awr095
161. Backner Y, Petrou P, Glick-Shames H, Raz N, Zimmermann H, Jost R, et al. Vision and vision-related measures in progressive multiple sclerosis. Front Neurol. (2019) 10:455. doi: 10.3389/fneur.2019.00455
162. Birkeldh U, Manouchehrinia A, Hietala MA, Hillert J, Olsson T, Piehl F, et al. The temporal retinal nerve fiber layer thickness is the most important optical coherence tomography estimate in multiple sclerosis. Front Neurol. (2017) 8:675. doi: 10.3389/fneur.2017.00675
163. Button J, Al-Louzi O, Lang A, Bhargava P, Newsome SD, Frohman T, et al. Disease-modifying therapies modulate retinal atrophy in multiple sclerosis: a retrospective study. Neurology. (2017) 88:525–32. doi: 10.1212/WNL.0000000000003582
164. Pisa M, Guerrieri S, Di Maggio G, Medaglini S, Moiola L, Martinelli V, et al. No evidence of disease activity is associated with reduced rate of axonal retinal atrophy in MS. Neurology. (2017) 89:2469–75. doi: 10.1212/WNL.0000000000004736
165. Martinez-Lapiscina EH, Arnow S, Wilson JA, Saidha S, Preiningerova JL, Oberwahrenbrock T, et al. Retinal thickness measured with optical coherence tomography and risk of disability worsening in multiple sclerosis: a cohort study. Lancet Neurol. (2016) 15:574–84. doi: 10.1016/S1474-4422(16)00068-5
166. Bock M, Brandt AU, Dorr J, Pfueller CF, Ohlraun S, Zipp F, et al. Time domain and spectral domain optical coherence tomography in multiple sclerosis: a comparative cross-sectional study. Mult Scler. (2010) 16:893–6. doi: 10.1177/1352458510365156
167. Cordano C, Nourbakhsh B, Devereux M, Damotte V, Bennett D, Hauser SL, et al. pRNFL as a marker of disability worsening in the medium/long term in patients with MS. Neurol Neuroimmunol Neuroinflamm. (2019) 6:e533. doi: 10.1212/NXI.0000000000000533
168. Zimmermann HG, Knier B, Oberwahrenbrock T, Behrens J, Pfuhl C, Aly L, et al. Association of retinal ganglion cell layer thickness with future disease activity in patients with clinically isolated syndrome. JAMA Neurol. (2018) 75:1071–9. doi: 10.1001/jamaneurol.2018.1011
169. Nolan-Kenney RC, Liu M, Akhand O, Calabresi PA, Paul F, Petzold A, et al. Optimal intereye difference thresholds by optical coherence tomography in multiple sclerosis: an international study. Ann Neurol. (2019) 85:618–29. doi: 10.1002/ana.25462
170. Brownlee WJ, Miszkiel KA, Tur C, Barkhof F, Miller DH, Ciccarelli O. Inclusion of optic nerve involvement in dissemination in space criteria for multiple sclerosis. Neurology. (2018) 91:e1130–4. doi: 10.1212/WNL.0000000000006207
171. Wingerchuk DM, Banwell B, Bennett JL, Cabre P, Carroll W, Chitnis T, et al. International consensus diagnostic criteria for neuromyelitis optica spectrum disorders. Neurology. (2015) 85:177–89. doi: 10.1212/WNL.0000000000001729
172. Hyun J-W, Jeong IH, Joung A, Kim S-H, Kim HJ. Evaluation of the 2015 diagnostic criteria for neuromyelitis optica spectrum disorder. Neurology. (2016) 86:1772–9. doi: 10.1212/WNL.0000000000002655
173. Hamid SH, Elsone L, Mutch K, Solomon T, Jacob A. The impact of 2015 neuromyelitis optica spectrum disorders criteria on diagnostic rates. Mult Scler. (2017) 23:228–33. doi: 10.1177/1352458516663853
174. Wingerchuk DM, Lennon VA, Lucchinetti CF, Pittock SJ, Weinshenker BG. The spectrum of neuromyelitis optica. Lancet Neurol. (2007) 6:805–15. doi: 10.1016/S1474-4422(07)70216-8
175. Pittock SJ, Lennon VA, Krecke K, Wingerchuk DM, Lucchinetti CF, Weinshenker BG. Brain abnormalities in neuromyelitis optica. Arch Neurol. (2006) 63:390–6. doi: 10.1001/archneur.63.3.390
176. Kremer S, Renard F, Achard S, Lana-Peixoto MA, Palace J, Asgari N, et al. Use of advanced magnetic resonance imaging techniques in neuromyelitis optica spectrum disorder. JAMA Neurology. (2015) 72:815–22. doi: 10.1001/jamaneurol.2015.0248
177. Wingerchuk DM, Lennon VA, Pittock SJ, Lucchinetti CF, Weinshenker BG. Revised diagnostic criteria for neuromyelitis optica. Neurology. (2006) 66:1485–9. doi: 10.1212/01.wnl.0000216139.44259.74
178. Ito S, Mori M, Makino T, Hayakawa S, Kuwabara S. “Cloud-like enhancement” is a magnetic resonance imaging abnormality specific to neuromyelitis optica. Ann Neurol. (2009) 66:425–8. doi: 10.1002/ana.21753
179. Kim S-H, Kim W, Li XF, Jung I-J, Kim HJ. Clinical spectrum of CNS aquaporin-4 autoimmunity. Neurology. (2012) 78:1179–85. doi: 10.1212/WNL.0b013e31824f8069
180. Kim W, Kim S-H, Huh S-Y, Kim HJ. Brain abnormalities in neuromyelitis optica spectrum disorder. Mult Scler Int. (2012) 2012:735486. doi: 10.1155/2012/735486
181. Kim W, Park MS, Lee SH, Kim S-H, Jung IJ, Takahashi T, et al. Characteristic brain magnetic resonance imaging abnormalities in central nervous system aquaporin-4 autoimmunity. Mult Scler. (2010) 16:1229–36. doi: 10.1177/1352458510376640
182. Nakamura M, Misu T, Fujihara K, Miyazawa I, Nakashima I, Takahashi T, et al. Occurrence of acute large and edematous callosal lesions in neuromyelitis optica. Mult Scler. (2009) 15:695–700. doi: 10.1177/1352458509103301
183. Banker P, Sonni S, Kister I, Loh JP, Lui YW. Pencil-thin ependymal enhancement in neuromyelitis optica spectrum disorders. Mult Scler. (2012) 18:1050–3. doi: 10.1177/1352458511431730
184. Asgari N, Flanagan EP, Fujihara K, Kim HJ, Skejoe HP, Wuerfel J, et al. Disruption of the leptomeningeal blood barrier in neuromyelitis optica spectrum disorder. Neurol Neuroimmunol Neuroinflamm. (2017) 4:e343. doi: 10.1212/NXI.0000000000000343
185. Kister I, Herbert J, Zhou Y, Ge Y. Ultrahigh-field MR (7 T) imaging of brain lesions in neuromyelitis optica. Mult Scler Int. (2013) 2013:398259. doi: 10.1155/2013/398259
186. Calabrese M, Oh MS, Favaretto A, Rinaldi F, Poretto V, Alessio S, et al. No MRI evidence of cortical lesions in neuromyelitis optica. Neurology. (2012) 79:1671–6. doi: 10.1212/WNL.0b013e31826e9a96
187. Matthews L, Marasco R, Jenkinson M, Küker W, Luppe S, Leite MI, et al. Distinction of seropositive NMO spectrum disorder and MS brain lesion distribution. Neurology. (2013) 80:1330–7. doi: 10.1212/WNL.0b013e3182887957
188. Oertel FC, Kuchling J, Zimmermann H, Chien C, Schmidt F, Knier B, et al. Microstructural visual system changes in AQP4-antibody-seropositive NMOSD. Neurol Neuroimmunol Neuroinflamm. (2017) 4:e334. doi: 10.1212/NXI.0000000000000334
189. Hayashida S, Masaki K, Yonekawa T, Suzuki SO, Hiwatashi A, Matsushita T, et al. Early and extensive spinal white matter involvement in neuromyelitis optica. Brain Pathol. (2017) 27:249–65. doi: 10.1111/bpa.12386
190. Pekcevik Y, Mitchell CH, Mealy MA, Orman G, Lee IH, Newsome SD, et al. Differentiating neuromyelitis optica from other causes of longitudinally extensive transverse myelitis on spinal magnetic resonance imaging. Mult Scler. (2016) 22:302–11. doi: 10.1177/1352458515591069
191. Nakamura M, Miyazawa I, Fujihara K, Nakashima I, Misu T, Watanabe S, et al. Preferential spinal central gray matter involvement in neuromyelitis optica. An MRI study. J Neurol. (2008) 255:163–70. doi: 10.1007/s00415-008-0545-z
192. Asgari N, Skejoe HPB, Lennon VA. Evolution of longitudinally extensive transverse myelitis in an aquaporin-4 IgG-positive patient. Neurology. (2013) 81:95–6. doi: 10.1212/WNL.0b013e318297ef07
193. Flanagan EP, Weinshenker BG, Krecke KN, Lennon VA, Lucchinetti CF, McKeon A, et al. Short myelitis lesions in aquaporin-4-IgG–positive neuromyelitis optica spectrum disorders. JAMA Neurol. (2015) 72:81–7. doi: 10.1001/jamaneurol.2014.2137
194. Huh S-Y, Kim S-H, Hyun J-W, Jeong IH, Park MS, Lee S-H, et al. Short segment myelitis as a first manifestation of neuromyelitis optica spectrum disorders. Mult Scler. (2017) 23:413–9. doi: 10.1177/1352458516687043
195. Hu H, You X, Ye J. Short transverse myelitis in Chinese patients with neuromyelitis optica spectrum disorders. Mult Scler Relat Disord. (2018) 21:78–83. doi: 10.1016/j.msard.2018.02.022
196. Flanagan EP, Kaufmann TJ, Krecke KN, Aksamit AJ, Pittock SJ, Keegan BM, et al. Discriminating long myelitis of neuromyelitis optica from sarcoidosis. Ann Neurol. (2016) 79:437–47. doi: 10.1002/ana.24582
197. Flanagan EP, Krecke KN, Marsh RW, Giannini C, Keegan BM, Weinshenker BG. Specific pattern of gadolinium enhancement in spondylotic myelopathy. Ann Neurol. (2014) 76:54–65. doi: 10.1002/ana.24184
198. Flanagan EP, Hinson SR, Lennon VA, Fang B, Aksamit AJ, Morris PP, et al. Glial fibrillary acidic protein immunoglobulin G as biomarker of autoimmune astrocytopathy: analysis of 102 patients. Ann Neurol. (2017) 81:298–309. doi: 10.1002/ana.24881
199. Trebst C, Raab P, Voss EV, Rommer P, Abu-Mugheisib M, Zettl UK, et al. Longitudinal extensive transverse myelitis–it's not all neuromyelitis optica. Nat Rev Neurol. (2011) 7:688–98. doi: 10.1038/nrneurol.2011.176
200. Kister I, Johnson E, Raz E, Babb J, Loh J, Shepherd TM. Specific MRI findings help distinguish acute transverse myelitis of neuromyelitis optica from spinal cord infarction. Mult Scler Relat Disord. (2016) 9:62–7. doi: 10.1016/j.msard.2016.04.005
201. Kitley JL, Leite MI, George JS, Palace JA. The differential diagnosis of longitudinally extensive transverse myelitis. Mult Scler. (2012) 18:271–85. doi: 10.1177/1352458511406165
202. Yonezu T, Ito S, Mori M, Ogawa Y, Makino T, Uzawa A, et al. “Bright spotty lesions” on spinal magnetic resonance imaging differentiate neuromyelitis optica from multiple sclerosis. Mult Scler. (2014). 20:331–7. doi: 10.1177/1352458513495581
203. Hyun J-W, Kim S-H, Jeong IH, Lee SH, Kim HJ. Bright spotty lesions on the spinal cord: an additional MRI indicator of neuromyelitis optica spectrum disorder? J Neurol Neurosurg Psychiatry. (2015) 86:1280–2. doi: 10.1136/jnnp-2014-309761
204. Cacciaguerra L, Meani A, Mesaros S, Radaelli M, Palace J, Dujmovic-Basuroski I, et al. Brain and cord imaging features in neuromyelitis optica spectrum disorders. Ann Neurol. (2019) 85:371–84. doi: 10.1002/ana.25411
205. Ramanathan S, Prelog K, Barnes EH, Tantsis EM, Reddel SW, Henderson APD, et al. Radiological differentiation of optic neuritis with myelin oligodendrocyte glycoprotein antibodies, aquaporin-4 antibodies, and multiple sclerosis. Mult Scler. (2016) 22:470–82. doi: 10.1177/1352458515593406
206. Akaishi T, Nakashima I, Takeshita T, Mugikura S, Sato DK, Takahashi T, et al. Lesion length of optic neuritis impacts visual prognosis in neuromyelitis optica. J Neuroimmunol. (2016) 293:28–33. doi: 10.1016/j.jneuroim.2016.02.004
207. Mealy MA, Whetstone A, Orman G, Izbudak I, Calabresi PA, Levy M. Longitudinally extensive optic neuritis as an MRI biomarker distinguishes neuromyelitis optica from multiple sclerosis. J Neurol Sci. (2015) 355:59–63. doi: 10.1016/j.jns.2015.05.013
208. Hyun J-W, Park G, Kwak K, Jo H-J, Joung A, Kim J-H, et al. Deep gray matter atrophy in neuromyelitis optica spectrum disorder and multiple sclerosis. Eur J Neurol. (2017) 24:437–45. doi: 10.1111/ene.13224
209. Schneider R, Bellenberg B, Kleiter I, Gold R, Köster O, Weiler F, et al. Cervical cord and ventricle affection in neuromyelitis optica. Acta Neurol Scand. (2017) 135:324–31. doi: 10.1111/ane.12601
210. Matthews L, Kolind S, Brazier A, Leite MI, Brooks J, Traboulsee A, et al. Imaging surrogates of disease activity in neuromyelitis optica allow distinction from multiple sclerosis. PLoS ONE. (2015) 10:e0137715. doi: 10.1371/journal.pone.0137715
211. Warabi Y, Takahashi T, Isozaki E. Progressive cerebral atrophy in neuromyelitis optica. Mult Scler. (2015) 21:1872–5. doi: 10.1177/1352458515600246
212. Wang Q, Zhang N, Qin W, Li Y, Fu Y, Li T, et al. Gray matter volume reduction is associated with cognitive impairment in neuromyelitis optica. AJNR Am J Neuroradiol. (2015) 36:1822–9. doi: 10.3174/ajnr.A4403
213. Streitberger K-J, Fehlner A, Pache F, Lacheta A, Papazoglou S, Bellmann-Strobl J, et al. Multifrequency magnetic resonance elastography of the brain reveals tissue degeneration in neuromyelitis optica spectrum disorder. Eur Radiol. (2017) 27:2206–15. doi: 10.1007/s00330-016-4561-6
214. Chanson J-B, Lamy J, Rousseau F, Blanc F, Collongues N, Fleury M, et al. White matter volume is decreased in the brain of patients with neuromyelitis optica. Eur J Neurol. (2013) 20:361–7. doi: 10.1111/j.1468-1331.2012.03867.x
215. Liu Y, Fu Y, Schoonheim MM, Zhang N, Fan M, Su L, et al. Structural MRI substrates of cognitive impairment in neuromyelitis optica. Neurology. (2015) 85:1491–9. doi: 10.1212/WNL.0000000000002067
216. Liu Y, Duan Y, Huang J, Ren Z, Ye J, Dong H, et al. Multimodal quantitative MR imaging of the thalamus in multiple sclerosis and neuromyelitis optica. Radiology. (2015) 277:784–92. doi: 10.1148/radiol.2015142786
217. Pasquier B, Borisow N, Rasche L, Bellmann-Strobl J, Ruprecht K, Niendorf T, et al. Quantitative 7T MRI does not detect occult brain damage in neuromyelitis optica. Neurol Neuroimmunol Neuroinflamm. (2019) 6:e541. doi: 10.1212/NXI.0000000000000541
218. Finke C, Heine J, Pache F, Lacheta A, Borisow N, Kuchling J, et al. Normal volumes and microstructural integrity of deep gray matter structures in AQP4+ NMOSD. Neurol Neuroimmunol Neuroinflamm. (2016) 3:e229. doi: 10.1212/NXI.0000000000000229
219. Kim S-H, Park EY, Park B, Hyun J-W, Park NY, Joung A, et al. Multimodal magnetic resonance imaging in relation to cognitive impairment in neuromyelitis optica spectrum disorder. Sci Rep. (2017) 7:9180. doi: 10.1038/s41598-017-08889-9
220. Blanc F, Noblet V, Jung B, Rousseau F, Renard F, Bourre B, et al. White matter atrophy and cognitive dysfunctions in neuromyelitis optica. PLoS ONE. (2012) 7:e33878. doi: 10.1371/journal.pone.0033878
221. Oertel FC, Schließeit J, Brandt AU, Paul F. Cognitive impairment in neuromyelitis optica spectrum disorders: a review of clinical and neuroradiological features. Front Neurol. (2019) 10:608. doi: 10.3389/fneur.2019.00608
222. Chavarro VS, Mealy MA, Simpson A, Lacheta A, Pache F, Ruprecht K, et al. Insufficient treatment of severe depression in neuromyelitis optica spectrum disorder. Neurol Neuroimmunol Neuroinflamm. (2016) 3:e286. doi: 10.1212/NXI.0000000000000286
223. Kim S-H, Kwak K, Hyun J-W, Joung A, Lee SH, Choi Y-H, et al. Diffusion tensor imaging of normal-appearing white matter in patients with neuromyelitis optica spectrum disorder and multiple sclerosis. Eur J Neurol. (2017) 24:966–73. doi: 10.1111/ene.13321
224. Chou I-J, Tanasescu R, Mougin OE, Gowland PA, Tench CR, Whitehouse WP, et al. Reduced myelin signal in normal-appearing white matter in neuromyelitis optica measured by 7T magnetic resonance imaging. Sci Rep. (2019) 9:14378. doi: 10.1038/s41598-019-50928-0
225. Pache F, Zimmermann H, Finke C, Lacheta A, Papazoglou S, Kuchling J, et al. Brain parenchymal damage in neuromyelitis optica spectrum disorder - a multimodal MRI study. Eur Radiol. (2016) 26:4413–22. doi: 10.1007/s00330-016-4282-x
226. von Glehn F, Jarius S, Lira RPC, Ferreira MCA, von Glehn FHR, e Castro SMC, et al. Structural brain abnormalities are related to retinal nerve fiber layer thinning and disease duration in neuromyelitis optica spectrum disorders. Mult Scler J. (2014) 20:1189–97. doi: 10.1177/1352458513519838
227. Jeantroux J, Kremer S, Lin XZ, Collongues N, Chanson J-B, Bourre B, et al. Diffusion tensor imaging of normal-appearing white matter in neuromyelitis optica. J Neuroradiol. (2012) 39:295–300. doi: 10.1016/j.neurad.2011.10.003
228. Zhao D-D, Zhou H-Y, Wu Q-Z, Liu J, Chen X-Y, He D, et al. Diffusion tensor imaging characterization of occult brain damage in relapsing neuromyelitis optica using 3.0T magnetic resonance imaging techniques. NeuroImage. (2012) 59:3173–7. doi: 10.1016/j.neuroimage.2011.11.022
229. Cai H, Zhu J, Zhang N, Wang Q, Zhang C, Yang C, et al. Subregional structural and connectivity damage in the visual cortex in neuromyelitis optica. Sci Rep. (2017) 7:41914. doi: 10.1038/srep41914
230. Lopes FCR, Alves-Leon SV, Godoy JM, de Souza Batista Scherpenhuijzen S, Fezer L, Gasparetto EL. Optic neuritis and the visual pathway: evaluation of neuromyelitis optica spectrum by resting-state fMRI and diffusion tensor MRI. J Neuroimaging. (2015) 25:807–12. doi: 10.1111/jon.12191
231. Liu Y, Jiang X, Butzkueven H, Duan Y, Huang J, Ren Z, et al. Multimodal characterization of gray matter alterations in neuromyelitis optica. Mult Scler. (2018) 24:1308–16. doi: 10.1177/1352458517721053
232. Finke C, Zimmermann H, Pache F, Oertel FC, Chavarro VS, Kramarenko Y, et al. Association of visual impairment in neuromyelitis optica spectrum disorder with visual network reorganization. JAMA Neurol. (2018) 75:296–303. doi: 10.1001/jamaneurol.2017.3890
233. Duan Y, Liu Z, Liu Y, Huang J, Ren Z, Sun Z, et al. Metabolic changes in normal-appearing white matter in patients with neuromyelitis optica and multiple sclerosis: a comparative magnetic resonance spectroscopy study. Acta Radiol. (2017) 58:1132–7. doi: 10.1177/0284185116683575
234. Pichiecchio A, Tavazzi E, Poloni G, Ponzio M, Palesi F, Pasin M, et al. Advanced magnetic resonance imaging of neuromyelitis optica: a multiparametric approach. Mult Scler. (2012) 18:817–24. doi: 10.1177/1352458511431072
235. de Seze J, Blanc F, Kremer S, Collongues N, Fleury M, Marcel C, et al. Magnetic resonance spectroscopy evaluation in patients with neuromyelitis optica. J Neurol Neurosurg Psychiatry. (2010) 81:409–11. doi: 10.1136/jnnp.2008.168070
236. Bichuetti DB, Rivero RLM, de Oliveira EML, Oliveira DM, de Souza NA, Nogueira RG, et al. White matter spectroscopy in neuromyelitis optica: a case control study. J Neurol. (2008) 255:1895–9. doi: 10.1007/s00415-009-0940-0
237. Aboul-Enein F, Krssák M, Höftberger R, Prayer D, Kristoferitsch W. Diffuse white matter damage is absent in neuromyelitis optica. AJNR Am J Neuroradiol. (2010) 31:76–9. doi: 10.3174/ajnr.A1791
238. Ciccarelli O, Thomas DL, De Vita E, Wheeler-Kingshott CAM, Kachramanoglou C, Kapoor R, et al. Low myo-inositol indicating astrocytic damage in a case series of neuromyelitis optica. Ann Neurol. (2013) 74:301–5. doi: 10.1002/ana.23909
239. Chien C, Scheel M, Schmitz-Hübsch T, Borisow N, Ruprecht K, Bellmann-Strobl J, et al. Spinal cord lesions and atrophy in NMOSD with AQP4-IgG and MOG-IgG associated autoimmunity. Mult Scler. (2019) 25:1926–36. doi: 10.1177/1352458518815596
240. Liu Y, Duan Y, Huang J, Ren Z, Liu Z, Dong H, et al. Different patterns of longitudinal brain and spinal cord changes and their associations with disability progression in NMO and MS. Eur Radiol. (2018) 28:96–103. doi: 10.1007/s00330-017-4921-x
241. Ventura RE, Kister I, Chung S, Babb JS, Shepherd TM. Cervical spinal cord atrophy in NMOSD without a history of myelitis or MRI-visible lesions. Neurol Neuroimmunol Neuroinflamm. (2016) 3:e224. doi: 10.1212/NXI.0000000000000224
242. Oertel FC, Zimmermann H, Paul F, Brandt AU. Optical coherence tomography in neuromyelitis optica spectrum disorders: potential advantages for individualized monitoring of progression and therapy. EPMA J. (2018) 9:21–33. doi: 10.1007/s13167-017-0123-5
243. Bennett JL, de Seze J, Lana-Peixoto M, Palace J, Waldman A, Schippling S, et al. Neuromyelitis optica and multiple sclerosis: seeing differences through optical coherence tomography. Mult Scler. (2015) 21:678–88. doi: 10.1177/1352458514567216
244. Ratchford JN, Quigg ME, Conger A, Frohman T, Frohman E, Balcer LJ, et al. Optical coherence tomography helps differentiate neuromyelitis optica and MS optic neuropathies. Neurology. (2009) 73:302–8. doi: 10.1212/WNL.0b013e3181af78b8
245. Schneider E, Zimmermann H, Oberwahrenbrock T, Kaufhold F, Kadas EM, Petzold A, et al. Optical coherence tomography reveals distinct patterns of retinal damage in neuromyelitis optica and multiple sclerosis. PLoS ONE. (2013) 8:e66151. doi: 10.1371/journal.pone.0066151
246. Vabanesi M, Pisa M, Guerrieri S, Moiola L, Radaelli M, Medaglini S, et al. In vivo structural and functional assessment of optic nerve damage in neuromyelitis optica spectrum disorders and multiple sclerosis. Sci Rep. (2019) 9:10371. doi: 10.1038/s41598-019-46251-3
247. Schmidt F, Zimmermann H, Mikolajczak J, Oertel FC, Pache F, Weinhold M, et al. Severe structural and functional visual system damage leads to profound loss of vision-related quality of life in patients with neuromyelitis optica spectrum disorders. Mult Scler Relat Dis. (2017) 11:45–50. doi: 10.1016/j.msard.2016.11.008
248. Stiebel-Kalish H, Hellmann MA, Mimouni M, Paul F, Bialer O, Bach M, et al. Does time equal vision in the acute treatment of a cohort of AQP4 and MOG optic neuritis? Neurol Neuroimmunol Neuroinflamm. (2019) 6:e572. doi: 10.1212/NXI.0000000000000572
249. Kleiter I, Gahlen A, Borisow N, Fischer K, Wernecke K-D, Hellwig K, et al. Apheresis therapies for NMOSD attacks: a retrospective study of 207 therapeutic interventions. Neurol Neuroimmunol Neuroinflamm. (2018) 5:e504. doi: 10.1212/NXI.0000000000000504
250. Nakamura M, Nakazawa T, Doi H, Hariya T, Omodaka K, Misu T, et al. Early high-dose intravenous methylprednisolone is effective in preserving retinal nerve fiber layer thickness in patients with neuromyelitis optica. Graefes Arch Clin Exp Ophthalmol. (2010) 248:1777–85. doi: 10.1007/s00417-010-1344-7
251. Gabilondo I, Martínez-Lapiscina EH, Fraga-Pumar E, Ortiz-Perez S, Torres-Torres R, Andorra M, et al. Dynamics of retinal injury after acute optic neuritis. Ann Neurol. (2015) 77:517–28. doi: 10.1002/ana.24351
252. Soelberg K, Specovius S, Zimmermann HG, Grauslund J, Mehlsen JJ, Olesen C, et al. Optical coherence tomography in acute optic neuritis: a population-based study. Acta Neurol Scand. (2018) 138:566–73. doi: 10.1111/ane.13004
253. Sotirchos ES, Saidha S, Byraiah G, Mealy MA, Ibrahim MA, Sepah YJ, et al. In vivo identification of morphologic retinal abnormalities in neuromyelitis optica. Neurology. (2013) 80:1406–14. doi: 10.1212/WNL.0b013e31828c2f7a
254. Kaufhold F, Zimmermann H, Schneider E, Ruprecht K, Paul F, Oberwahrenbrock T, et al. Optic neuritis is associated with inner nuclear layer thickening and microcystic macular edema independently of multiple sclerosis. PLoS ONE. (2013) 8:e71145. doi: 10.1371/journal.pone.0071145
255. Gelfand JM, Cree BA, Nolan R, Arnow S, Green AJ. Microcystic inner nuclear layer abnormalities and neuromyelitis optica. JAMA Neurol. (2013) 70:629–33. doi: 10.1001/jamaneurol.2013.1832
256. Brandt AU, Oberwahrenbrock T, Kadas EM, Lagrèze WA, Paul F. Dynamic formation of macular microcysts independent of vitreous traction changes. Neurology. (2014) 83:73–7. doi: 10.1212/WNL.0000000000000545
257. Balk LJ, Killestein J, Polman CH, Uitdehaag BMJ, Petzold A. Microcystic macular oedema confirmed, but not specific for multiple sclerosis. Brain. (2012) 135:e226. doi: 10.1093/brain/aws216
258. Manogaran P, Traboulsee AL, Lange AP. Longitudinal study of retinal nerve fiber layer thickness and macular volume in patients with neuromyelitis optica spectrum disorder. J Neuroophthalmol. (2016) 36:363–8. doi: 10.1097/WNO.0000000000000404
259. Oertel FC, Havla J, Roca-Fernández A, Lizak N, Zimmermann H, Motamedi S, et al. Retinal ganglion cell loss in neuromyelitis optica: a longitudinal study. J Neurol Neurosurg Psychiatry. (2018) 89:1259–65. doi: 10.1136/jnnp-2018-318382
260. Yamamura T, Nakashima I. Foveal thinning in neuromyelitis optica: a sign of retinal astrocytopathy? Neurol Neuroimmunol Neuroinflamm. (2017) 4:e347. doi: 10.1212/NXI.0000000000000347
261. Jeong IH, Kim HJ, Kim N-H, Jeong KS, Park CY. Subclinical primary retinal pathology in neuromyelitis optica spectrum disorder. J Neurol. (2016) 263:1343–8. doi: 10.1007/s00415-016-8138-8
262. Hokari M, Yokoseki A, Arakawa M, Saji E, Yanagawa K, Yanagimura F, et al. Clinicopathological features in anterior visual pathway in neuromyelitis optica. Ann Neurol. (2016) 79:605–24. doi: 10.1002/ana.24608
263. Felix CM, Levin MH, Verkman AS. Complement-independent retinal pathology produced by intravitreal injection of neuromyelitis optica immunoglobulin G. J Neuroinflammation. (2016) 13:275. doi: 10.1186/s12974-016-0746-9
264. Yadav SK, Motamedi S, Oberwahrenbrock T, Oertel FC, Polthier K, Paul F, et al. CuBe: parametric modeling of 3D foveal shape using cubic Bézier. Biomed Opt Express. (2017) 8:4181–99. doi: 10.1364/BOE.8.004181
265. Ogawa R, Nakashima I, Takahashi T, Kaneko K, Akaishi T, Takai Y, et al. MOG antibody-positive, benign, unilateral, cerebral cortical encephalitis with epilepsy. Neurol Neuroimmunol Neuroinflamm. (2017) 4:e322. doi: 10.1212/NXI.0000000000000322
266. Waters P, Woodhall M, O'Connor KC, Reindl M, Lang B, Sato DK, et al. MOG cell-based assay detects non-MS patients with inflammatory neurologic disease. Neurol Neuroimmunol Neuroinflamm. (2015) 2:e89. doi: 10.1212/NXI.0000000000000089
267. Kim S-M, Woodhall MR, Kim J-S, Kim S-J, Park KS, Vincent A, et al. Antibodies to MOG in adults with inflammatory demyelinating disease of the CNS. Neurol Neuroimmunol Neuroinflamm. (2015) 2:e163. doi: 10.1212/NXI.0000000000000163
268. Vazquez Do Campo R, Stephens A, Marin Collazo IV, Rubin DI. MOG antibodies in combined central and peripheral demyelination syndromes. Neurol Neuroimmunol Neuroinflamm. (2018) 5:e503. doi: 10.1212/NXI.0000000000000503
269. Dale RC, Tantsis EM, Merheb V, Kumaran R-YA, Sinmaz N, Pathmanandavel K, et al. Antibodies to MOG have a demyelination phenotype and affect oligodendrocyte cytoskeleton. Neurol Neuroimmunol Neuroinflamm. (2014) 1:e12. doi: 10.1212/NXI.0000000000000012
270. Chalmoukou K, Alexopoulos H, Akrivou S, Stathopoulos P, Reindl M, Dalakas MC. Anti-MOG antibodies are frequently associated with steroid-sensitive recurrent optic neuritis. Neurol Neuroimmunol Neuroinflamm. (2015) 2:e131. doi: 10.1212/NXI.0000000000000131
271. Sepúlveda M, Armangué T, Sola-Valls N, Arrambide G, Meca-Lallana JE, Oreja-Guevara C, et al. Neuromyelitis optica spectrum disorders: comparison according to the phenotype and serostatus. Neurol Neuroimmunol Neuroinflamm. (2016) 3:e225. doi: 10.1212/NXI.0000000000000225
272. Winklmeier S, Schlüter M, Spadaro M, Thaler FS, Vural A, Gerhards R, et al. Identification of circulating MOG-specific B cells in patients with MOG antibodies. Neurol Neuroimmunol Neuroinflamm. (2019) 6:625. doi: 10.1212/NXI.0000000000000625
273. Matesanz S, Kotch C, Perrone C, Waanders AJ, Hill B, Narula S. Expanding the MOG phenotype: brainstem encephalitis with punctate and curvilinear enhancement. Neurol Neuroimmunol Neuroinflamm. (2019) 6:e619. doi: 10.1212/NXI.0000000000000619
274. Jarius S, Paul F, Aktas O, Asgari N, Dale RC, de Seze J, et al. MOG encephalomyelitis: international recommendations on diagnosis and antibody testing. J Neuroinflammation. (2018) 15:134. doi: 10.1186/s12974-018-1144-2
275. Jarius S, Ruprecht K, Kleiter I, Borisow N, Asgari N, Pitarokoili K, et al. MOG-IgG in NMO and related disorders: a multicenter study of 50 patient. Part 1: frequency, syndrome specificity, influence of disease activity, long-term course, association with AQP4-IgG, and origin. J Neuroinflammation. (2016) 13:279. doi: 10.1186/s12974-016-0717-1
276. Zamvil SS, Slavin AJ. Does MOG Ig-positive AQP4-seronegative opticospinal inflammatory disease justify a diagnosis of NMO spectrum disorder? Neurol Neuroimmunol Neuroinflamm. (2015) 2:e62. doi: 10.1212/NXI.0000000000000062
277. Narayan R, Simpson A, Fritsche K, Salama S, Pardo S, Mealy M, et al. MOG antibody disease: a review of MOG antibody seropositive neuromyelitis optica spectrum disorder. Mult Scler Relat Disord. (2018) 25:66–72. doi: 10.1016/j.msard.2018.07.025
278. Spadaro M, Gerdes LA, Krumbholz M, Ertl-Wagner B, Thaler FS, Schuh E, et al. Autoantibodies to MOG in a distinct subgroup of adult multiple sclerosis. Neurol Neuroimmunol Neuroinflamm. (2016) 3:e257. doi: 10.1212/NXI.0000000000000257
279. Cobo-Calvo A, Sepúlveda M, Rollot F, Armangué T, Ruiz A, Maillart E, et al. Evaluation of treatment response in adults with relapsing MOG-Ab-associated disease. J Neuroinflammation. (2019) 16:134. doi: 10.1186/s12974-019-1525-1
280. Denève M, Biotti D, Patsoura S, Ferrier M, Meluchova Z, Mahieu L, et al. MRI features of demyelinating disease associated with anti-MOG antibodies in adults. J Neuroradiol. (2019) 46:312–8. doi: 10.1016/j.neurad.2019.06.001
281. Salama S, Khan M, Levy M, Izbudak I. Radiological characteristics of myelin oligodendrocyte glycoprotein antibody disease. Mult Scler Relat Disord. (2019) 29:15–22. doi: 10.1016/j.msard.2019.01.021
282. Jarius S, Ruprecht K, Kleiter I, Borisow N, Asgari N, Pitarokoili K, et al. MOG-IgG in NMO and related disorders: a multicenter study of 50 patients. Part 2: epidemiology, clinical presentation, radiological and laboratory features, treatment responses, and long-term outcome. J Neuroinflammation. (2016) 13:280. doi: 10.1186/s12974-016-0718-0
283. Jarius S, Kleiter I, Ruprecht K, Asgari N, Pitarokoili K, Borisow N, et al. MOG-IgG in NMO and related disorders: a multicenter study of 50 patients. Part 3: brainstem involvement - frequency, presentation and outcome. J Neuroinflammation. (2016) 13:281. doi: 10.1186/s12974-016-0719-z
284. van Pelt ED, Wong YYM, Ketelslegers IA, Hamann D, Hintzen RQ. Neuromyelitis optica spectrum disorders: comparison of clinical and magnetic resonance imaging characteristics of AQP4-IgG versus MOG-IgG seropositive cases in the Netherlands. Eur J Neurol. (2016) 23:580–7. doi: 10.1111/ene.12898
285. Sato DK, Callegaro D, Lana-Peixoto MA, Waters PJ, de Haidar Jorge FM, Takahashi T, et al. Distinction between MOG antibody-positive and AQP4 antibody-positive NMO spectrum disorders. Neurology. (2014) 82:474–81. doi: 10.1212/WNL.0000000000000101
286. Jurynczyk M, Tackley G, Kong Y, Geraldes R, Matthews L, Woodhall M, et al. Brain lesion distribution criteria distinguish MS from AQP4-antibody NMOSD and MOG-antibody disease. J Neurol Neurosurg Psychiatry. (2017) 88:132–6. doi: 10.1136/jnnp-2016-314005
287. Cai M-T, Zhang Y-X, Zheng Y, Yang F, Fang W, Shen C-H, et al. Brain lesion distribution criteria distinguish demyelinating diseases in China. Ann Clin Transl Neurol. (2019) 6:2048–53. doi: 10.1002/acn3.50913
288. Hyun J-W, Huh S-Y, Shin H-J, Woodhall M, Kim S-H, Irani SR, et al. Evaluation of brain lesion distribution criteria at disease onset in differentiating MS from NMOSD and MOG-IgG-associated encephalomyelitis. Mult Scler. (2019) 25:585–90. doi: 10.1177/1352458518761186
289. Jurynczyk M, Geraldes R, Probert F, Woodhall MR, Waters P, Tackley G, et al. Distinct brain imaging characteristics of autoantibody-mediated CNS conditions and multiple sclerosis. Brain. (2017) 140:617–27. doi: 10.1093/brain/aww350
290. Akaishi T, Sato DK, Nakashima I, Takeshita T, Takahashi T, Doi H, et al. MRI and retinal abnormalities in isolated optic neuritis with myelin oligodendrocyte glycoprotein and aquaporin-4 antibodies: a comparative study. J Neurol Neurosurg Psychiatry. (2016) 87:446–8. doi: 10.1136/jnnp-2014-310206
291. Akaishi T, Kaneko K, Himori N, Takeshita T, Takahashi T, Nakazawa T, et al. Subclinical retinal atrophy in the unaffected fellow eyes of multiple sclerosis and neuromyelitis optica. J Neuroimmunol. (2017) 313:10–5. doi: 10.1016/j.jneuroim.2017.10.001
292. Pache F, Zimmermann H, Mikolajczak J, Schumacher S, Lacheta A, Oertel FC, et al. MOG-IgG in NMO and related disorders: a multicenter study of 50 patients. Part 4: afferent visual system damage after optic neuritis in MOG-IgG-seropositive versus AQP4-IgG-seropositive patients. J Neuroinflammation. (2016) 13:282. doi: 10.1186/s12974-016-0720-6
293. Biotti D, Bonneville F, Tournaire E, Ayrignac X, Dallière CC, Mahieu L, et al. Optic neuritis in patients with anti-MOG antibodies spectrum disorder: MRI and clinical features from a large multicentric cohort in France. J Neurol. (2017) 264:2173–5. doi: 10.1007/s00415-017-8615-8
294. Pandit L, Mustafa S, Nakashima I, Takahashi T, Kaneko K. MOG-IgG-associated disease has a stereotypical clinical course, asymptomatic visual impairment and good treatment response. Mult Scler J Exp Transl Clin. (2018) 4:2055217318787829. doi: 10.1177/2055217318787829
295. Zhao G, Chen Q, Huang Y, Li Z, Sun X, Lu P, et al. Clinical characteristics of myelin oligodendrocyte glycoprotein seropositive optic neuritis: a cohort study in Shanghai, China. J Neurol. (2018) 265:33–40. doi: 10.1007/s00415-017-8651-4
296. Jelcic I, Hanson JVM, Lukas S, Weber KP, Landau K, Pless M, et al. Unfavorable structural and functional outcomes in myelin oligodendrocyte glycoprotein antibody-associated optic neuritis. J Neuroophthalmol. (2019) 39:3–7. doi: 10.1097/WNO.0000000000000669
297. Sotirchos ES, Filippatou A, Fitzgerald KC, Salama S, Pardo S, Wang J, et al. Aquaporin-4 IgG seropositivity is associated with worse visual outcomes after optic neuritis than MOG-IgG seropositivity and multiple sclerosis, independent of macular ganglion cell layer thinning. Mult Scler. (2019) 1352458519864928. doi: 10.1177/1352458519864928. [Epub ahead of print].
298. Havla J, Kümpfel T, Schinner R, Spadaro M, Schuh E, Meinl E, et al. Myelin-oligodendrocyte-glycoprotein (MOG) autoantibodies as potential markers of severe optic neuritis and subclinical retinal axonal degeneration. J Neurol. (2017) 264:139–51. doi: 10.1007/s00415-016-8333-7
299. Oertel FC, Outteryck O, Knier B, Zimmermann H, Borisow N, Bellmann-Strobl J, et al. Optical coherence tomography in myelin-oligodendrocyte-glycoprotein antibody-seropositive patients: a longitudinal study. J Neuroinflammation. (2019) 16:154. doi: 10.1186/s12974-019-1521-5
300. Chawla S, Ge Y, Wuerfel J, Asadollahi S, Mohan S, Paul F, et al. Longitudinal ultra-high field MRI of brain lesions in neuromyelitis optica spectrum disorders. Mult Scler Relat Disord. (2020) 42:102066. doi: 10.1016/j.msard.2020.102066
301. Eijlers AJC, Wink AM, Meijer KA, Douw L, Geurts JJG, Schoonheim MM. Functional network dynamics on functional MRI: a primer on an emerging frontier in neuroscience. Radiology. (2019) 292:460–3. doi: 10.1148/radiol.2019194009
302. Schoonheim MM, Meijer KA, Geurts JJG. Network collapse and cognitive impairment in multiple sclerosis. Front Neurol. (2015) 6:82. doi: 10.3389/fneur.2015.00082
303. Backner Y, Ben-Shalom I, Kuchling J, Siebert N, Scheel M, Ruprecht K, et al. Cortical topological network changes following optic neuritis. Neurol Neuroimmunol Neuroinflamm. (2020) 7e687. doi: 10.1212/NXI.0000000000000687
304. Shu N, Duan Y, Xia M, Schoonheim MM, Huang J, Ren Z, et al. Disrupted topological organization of structural and functional brain connectomes in clinically isolated syndrome and multiple sclerosis. Sci Rep. (2016) 6:29383. doi: 10.1038/srep29383
305. Chien C, Oertel FC, Siebert N, Zimmermann H, Asseyer S, Kuchling J, et al. Imaging markers of disability in aquaporin-4 immunoglobulin G seropositive neuromyelitis optica: a graph theory study. Brain Commun. (2019) 1:fcz026. doi: 10.1093/braincomms/fcz026
306. Yadav SK, Kadas EM, Motamedi S, Polthier K, Haußer F, Gawlik K, et al. Optic nerve head three-dimensional shape analysis. J Biomed Opt. (2018) 23:1–13. doi: 10.1117/1.JBO.23.10.106004
Keywords: multiple sclerosis, neuromyelitis optica spectrum disorders (NMOSD), magnetic resonance imaging, optical coherence tomography, neuroimaging
Citation: Kuchling J and Paul F (2020) Visualizing the Central Nervous System: Imaging Tools for Multiple Sclerosis and Neuromyelitis Optica Spectrum Disorders. Front. Neurol. 11:450. doi: 10.3389/fneur.2020.00450
Received: 06 November 2019; Accepted: 28 April 2020;
Published: 17 June 2020.
Edited by:
Fabienne Brilot, University of Sydney, AustraliaReviewed by:
Izumi Kawachi, Niigata University, JapanCopyright © 2020 Kuchling and Paul. This is an open-access article distributed under the terms of the Creative Commons Attribution License (CC BY). The use, distribution or reproduction in other forums is permitted, provided the original author(s) and the copyright owner(s) are credited and that the original publication in this journal is cited, in accordance with accepted academic practice. No use, distribution or reproduction is permitted which does not comply with these terms.
*Correspondence: Friedemann Paul, ZnJpZWRlbWFubi5wYXVsQGNoYXJpdGUuZGU=
Disclaimer: All claims expressed in this article are solely those of the authors and do not necessarily represent those of their affiliated organizations, or those of the publisher, the editors and the reviewers. Any product that may be evaluated in this article or claim that may be made by its manufacturer is not guaranteed or endorsed by the publisher.
Research integrity at Frontiers
Learn more about the work of our research integrity team to safeguard the quality of each article we publish.