 Maurizio Bergamino
 Elizabeth G. Keeling1,2
 Ashley M. Stokes
- 1Division of Neuroimaging Research, Barrow Neurological Institute, Phoenix, AZ, United States
- 2School of Life Sciences, Arizona State University, Tempe, AZ, United States
- 3Imaging Research, Cleveland Clinic Lou Ruvo Center for Brain Health, Las Vegas, NV, United States
- 4Muhammad Ali Parkinson Center, Barrow Neurological Institute, Phoenix, AZ, United States
Structural brain white matter (WM) changes such as axonal caliber, density, myelination, and orientation, along with WM-dependent structural connectivity, may be impacted early in Parkinson disease (PD). Diffusion magnetic resonance imaging (dMRI) has been used extensively to understand such pathological WM changes, and the focus of this systematic review is to understand both the methods utilized and their corresponding results in the context of early-stage PD. Diffusion tensor imaging (DTI) is the most commonly utilized method to probe WM pathological changes. Previous studies have suggested that DTI metrics are sensitive in capturing early disease-associated WM changes in preclinical symptomatic regions such as olfactory regions and the substantia nigra, which is considered to be a hallmark of PD pathology and progression. Postprocessing analytic approaches include region of interest–based analysis, voxel-based analysis, skeletonized approaches, and connectome analysis, each with unique advantages and challenges. While DTI has been used extensively to study WM disorganization in early-stage PD, it has several limitations, including an inability to resolve multiple fiber orientations within each voxel and sensitivity to partial volume effects. Given the subtle changes associated with early-stage PD, these limitations result in inaccuracies that severely impact the reliability of DTI-based metrics as potential biomarkers. To overcome these limitations, advanced dMRI acquisition and analysis methods have been employed, including diffusion kurtosis imaging and q-space diffeomorphic reconstruction. The combination of improved acquisition and analysis in DTI may yield novel and accurate information related to WM-associated changes in early-stage PD. In the current article, we present a systematic and critical review of dMRI studies in early-stage PD, with a focus on recent advances in DTI methodology. Yielding novel metrics, these advanced methods have been shown to detect diffuse WM changes in early-stage PD. These findings support the notion of early axonal damage in PD and suggest that WM pathology may go unrecognized until symptoms appear. Finally, the advantages and disadvantages of different dMRI techniques, analysis methods, and software employed are discussed in the context of PD-related pathology.
Introduction
Parkinson disease (PD) is a chronic progressive neurodegenerative disease that affects more than 10 million people worldwide (1–3). Parkinson disease pathology is characterized by Lewy body aggregates and neurites (4, 5), which play a causative role in degeneration of dopaminergic neurons in the substantia nigra (SN); motor symptoms associated with PD have been primarily attributed to this process (6). By the time PD becomes symptomatic, an estimated 60% of dopaminergic neurons have degenerated, representing a moderate to severe state of disease (7). Biomarkers, including fluid and imaging based, may play a critical role in understanding the natural history of progression of PD and enable appropriate therapeutic intervention, thereby optimizing preservation of neural health (8). However, to date, no definitive biomarker exists for this purpose, despite the clear need for one.
Imaging-based biomarkers for PD can yield insight into atrophy, microstructural changes, neuronal activity, and vascular hemodynamics. Magnetic resonance imaging (MRI) biomarkers, both structural and functional, are increasingly used in PD for more comprehensive evaluation of neuropathology. Subtle brain atrophy has been demonstrated in PD using voxel-based morphometry (VBM), which is an automated analysis approach to characterize volumetric brain changes from three-dimensional structural imaging (9–11). Altered patterns of neuronal activation, measured via functional MRI (fMRI), have been observed in multiple regions of the cortex in PD using a range of motoric tasks (12–14). Resting-state fMRI is measured in the absence of tasks and can identify abnormalities in spontaneous neuronal activity (15). In particular, this approach has revealed changes in the corticosubcortical functional connectivity in PD compared with healthy controls (HCs) (16).
Diffusion MRI (dMRI) comprises a set of complementary techniques to non-invasively probe microstructural characteristics via diffusivity of water molecules in the brain. As water predominantly diffuses along axons, dMRI can be used to probe white matter (WM) changes such as axonal caliber, density, myelination, and orientation. Diffusion tensor imaging (DTI), the most common dMRI model, can provide measures such as fractional anisotropy (FA), mean diffusivity (MD), axial diffusivity (AxD), and radial diffusivity (RD) (17) that are sensitive to subtle WM microstructural organization. Since the inception of DTI in the mid-1990s (18), significant improvements have been made in both acquisition and analysis methods. These advances include the implementation of multishell and high-angular-resolution dMRI data, such as those with more diffusion-encoding gradient directions, resulting in the development of advanced algorithms to improve dMRI postprocessing and overcome some of the known limitations of DTI. The availability of standard software has further enabled quantitative analysis of DTI and DTI-related metrics including advanced dMRI models. At present, DTI represents one of the most widely used neuroimaging methods, in both preclinical animal and human studies, for its versatility and specificity to WM microstructure (19). We encourage interested readers to refer to References (9, 20–23) for a more in-depth understanding of DTI.
White matter changes in PD vs. controls (healthy subjects; HCs) have previously been evaluated by DTI using various metrics, acquisitions, analyses, and software tools (24). More specifically, a recent meta-analysis encompassing wide disease duration DTI studies in PD found that both FA and MD were able to distinguish between PD and HC, with regional DTI changes observed in the SN, corpus callosum, cingulate, and temporal cortices. Considering the growing interest in defining the early phases of PD through the use of neuroimaging biomarkers, the focus of this systematic review is the current state of dMRI-based biomarkers for understanding early-stage PD, with an emphasis on the technical methodologies employed for dMRI. More specifically, the basic theoretical background for standard DTI will be provided, along with three more advanced methods that go beyond standard DTI methods [diffusion kurtosis imaging (DKI), neurite orientation dispersion and density imaging (NODDI), and Q-space diffeomorphic reconstruction (QSDR)]. The relevant results in early-stage PD will be discussed for each of these methods. Additionally, the advantages and disadvantages of different dMRI acquisition techniques, analysis methods, and software employed will be discussed in the context of early-stage PD-related pathology. The commonalities and incongruences in findings in early-stage PD will be contextualized between the various dMRI methods. Finally, given the current state of understanding of early-stage PD and known capabilities of dMRI approaches, the outlook for future opportunities in dMRI to improve pathophysiological characterization of early-stage PD will be discussed.
Methods
Following Preferred Reporting Items for Systematic Reviews and Meta-Analyses (PRISMA) guidelines (25), we searched three databases (Figure 1) for works that included at least one group of early PD [defined as subjects with Hoehn & Yahr (H&Y) stage ≤2 and/or disease duration <5 years] and where one or more dMRI methods were used (see PRISMA diagram in Figure 1). To identify the articles for this systematic review, we searched for publications on PubMed, Cochrane Library, and Scopus databases by using the keywords “early Parkinson,” “MRI diffusion,” and “DTI” without any temporal restriction. In total, we found 349 records. After excluding duplicates (n = 254), screening and eligibility further reduced the number to 62 articles retained for this review.
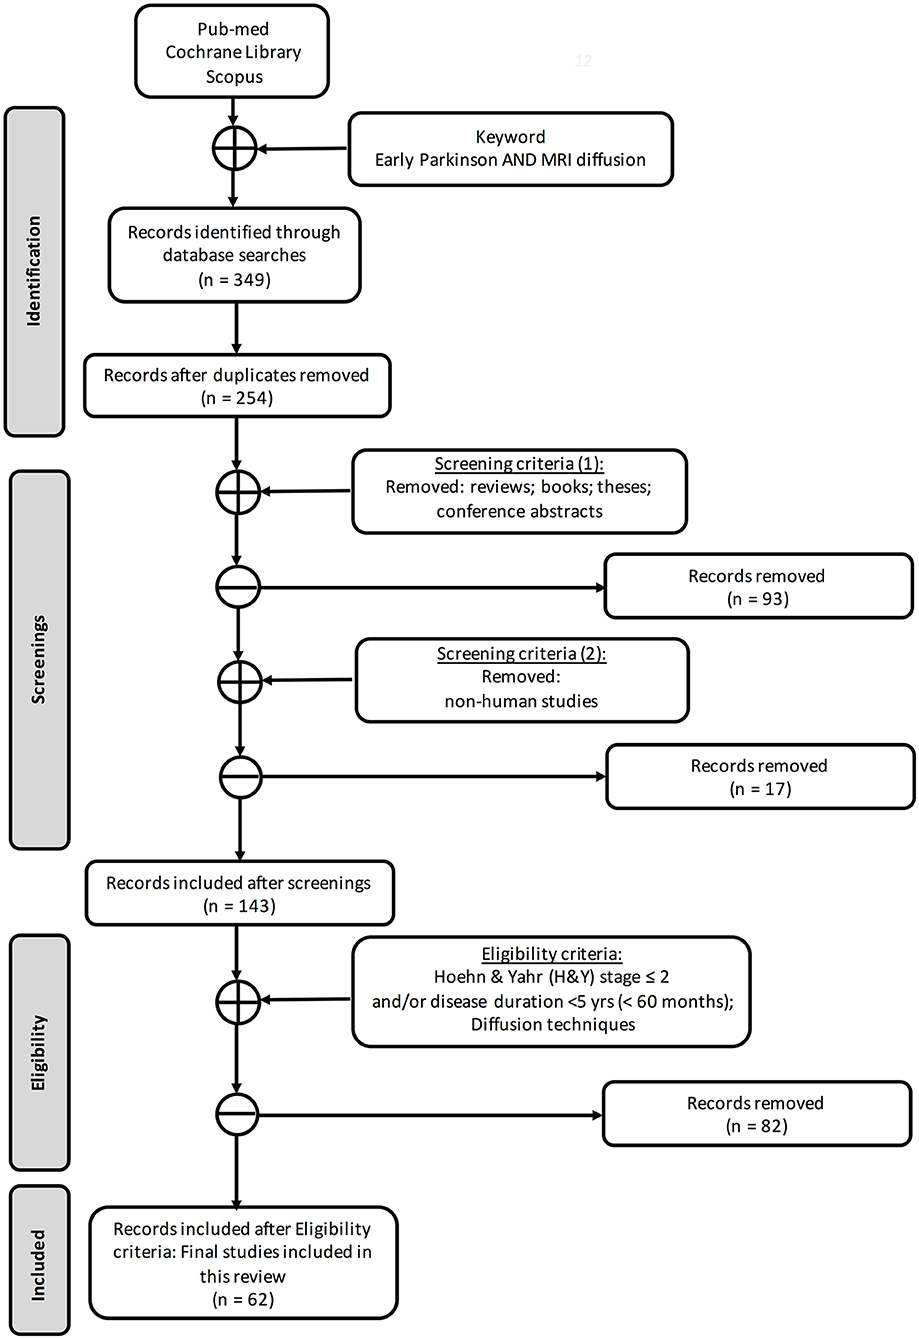
Figure 1. Search strategy based on PRISMA flow diagram.
While most studies used site-specific data, several studies leveraged the open-access availability of data from the Parkinson's Progression Markers Initiative (PPMI) (http://www.ppmi-info.org). Parkinson's Progression Markers Initiative is a multicenter international database of de novo individuals with early idiopathic PD that includes clinical, imaging, and biological data. Studies using PPMI and other shared datasets will be denoted in the text. Histograms are shown in Figure 2 for the publication years and dMRI techniques used in each article included in this review. The complete list of the PD studies that are included in this review is reported in Table 1.
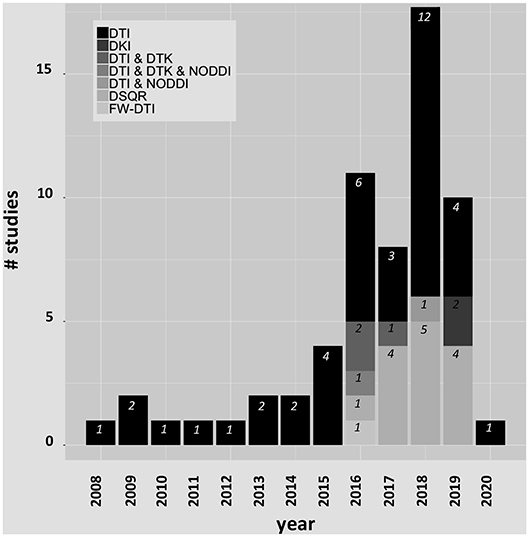
Figure 2. Histograms for the publication years and dMRI techniques included in this review.
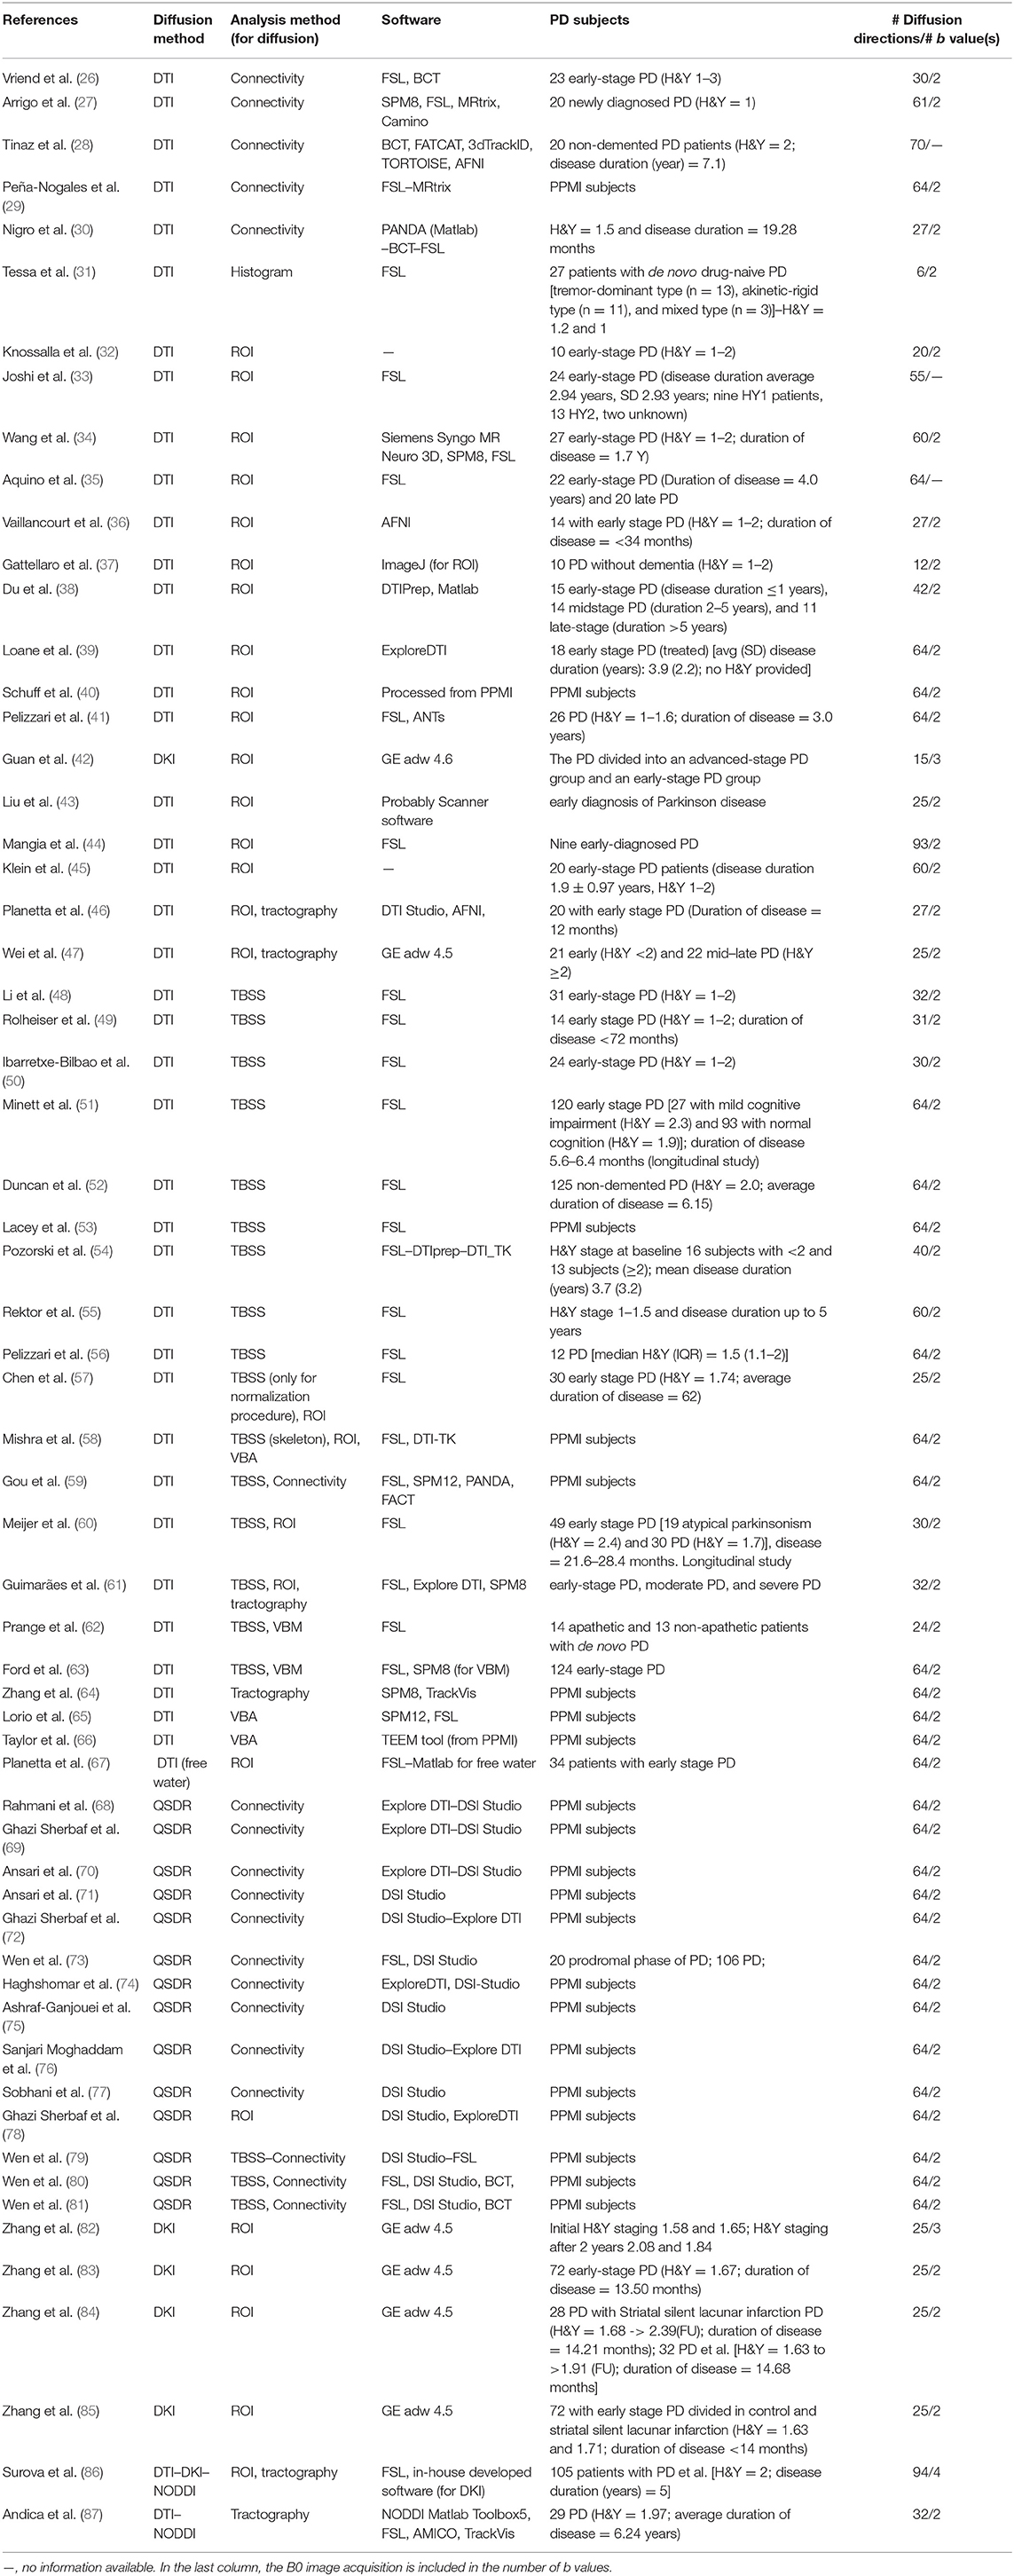
Table 1. Summary of diffusion studies in early-stage PD.
Theory and Results
Diffusion Tensor Imaging: Theory, Acquisition, and Analysis
Diffusion tensor imaging relies on motion-sensitizing gradients to probe the displacement of water molecules, which is often simplified using a Gaussian distribution model. The diffusion-weighted signal intensity for this distribution can be described by the following equation:
where S0 is the signal intensity without the diffusion gradient, D is the diffusion coefficient, and b is the diffusion-weighting factor, where the b factor is largely dependent on the gradient waveform. The diffusion can thus be represented by the following equation:
where is a three-element column vector representing a gradient direction, is the transpose of , and is the apparent diffusion tensor (3 × 3 symmetric matrix).
Diffusion tensor imaging provides a direct relationship between the chosen experimental parameters, such as b and , the MR measurements (S and S0), and the parameters of the diffusion tensor model .
Eigendecomposition of the diffusion matrix yields a symmetric diffusion tensor:
where λ1, λ2, and λ3 are the eigenvalues (with λ1 ≥ λ2 ≥ λ3) and ϵ1, ϵ2, and ϵ3 are the eigenvectors of . The diffusion tensor is completely characterized by these eigenvalues, which describe the length of the three axes of the diffusion ellipsoid, and their corresponding eigenvectors, which describe the orientation of these axes in space. As the eigenvectors provide information about the direction of water diffusion within a voxel, they form the basis of brain fiber tracking (88, 89). The geometric shape associated with the diffusion tensor is assumed to be a three-dimensional ellipsoid with the length of the three orthogonal principal axes proportional to the ordered tensor eigenvalues.
The first eigenvalue (λ1) represents water diffusivity along the principal axis and is termed axial (or longitudinal or parallel) diffusivity (λ∥ or AxD). The radial (or transverse or perpendicular) diffusivity (λ⊥ or RD) represents water diffusion perpendicular to the principal direction and is given by the average of the remaining eigenvalues ((λ2 + λ3)/2). Axial diffusivity has been associated with axonal damage, whereas RD may be associated with myelin integrity, axonal diameter and density, and fiber coherence (90, 91). Mean diffusivity is a rotationally invariant metric, obtained from a simple average of the diffusion eigenvectors ((λ1 + λ2 + λ3)/3), which describes the overall size of the tensor.
Fractional anisotropy quantifies the degree of anisotropy of the diffusion tensor and is the most common DTI-related index. Fractional anisotropy ranges from 0 to 1, where 0 represents isotropic diffusion and 1 represents completely anisotropic diffusion. Fractional anisotropy can be calculated in each voxel using the following equation:
While this index has often been interpreted as a quantitative biomarker of WM disorganization, equating FA with WM disorganization is not strictly accurate, given that FA cannot disentangle the individual microscopic contributions, such as different WM fiber populations and/or cerebrospinal fluid (CSF) contamination (92, 93). Fractional anisotropy has also been equated as a marker of demyelination (94), which is also not accurate because the regional anisotropy may also reflect altered axonal diameter, packing density, or membrane permeability (95). Despite these limitations, DTI-based FA has often been utilized as a neuroimaging biomarker because of its robustness to noise (96, 97). Example maps for FA (gray-scale and colorized), MD, AxD, and RD are shown in Figure 3 in an HC.
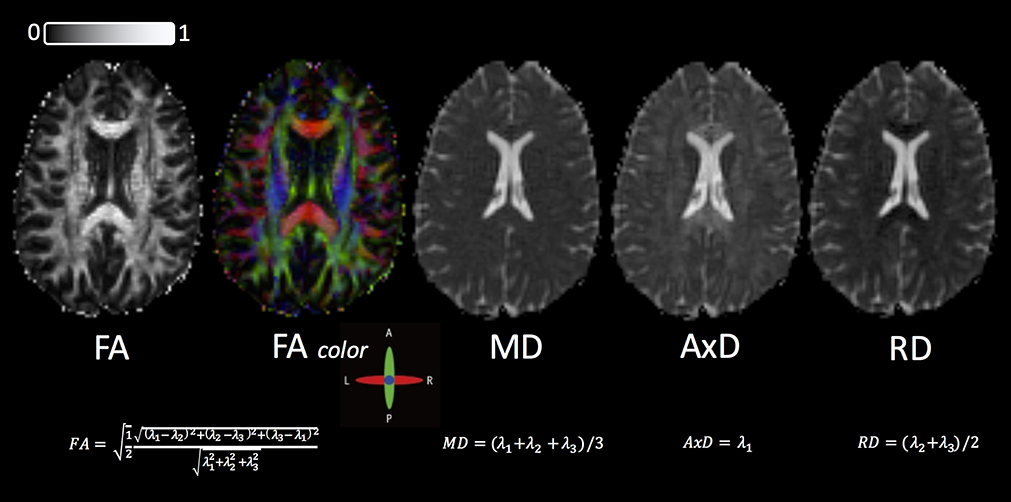
Figure 3. Standard DTI maps, from a healthy volunteer, created by DSI Studio with a DTI diffusion scheme with a total of 67 diffusion sampling directions. The b value was 1,000 s/mm2. The in-plane resolution was 2 mm, and the slice thickness was 2 mm. FA, fractional anisotropy; MD, mean diffusivity; AxD, axial diffusivity; RD, radial diffusivity. The range of FA in between 0 (isotropic diffusion) and 1 (anisotropic diffusion).
Tractography goes beyond the conventional quantitative voxel-wise metrics to generate a three-dimensional representation of WM fiber bundles. Figure 4 shows an example tractography (B), with FA shown in (A), in an HC. Tractography consists of a multistep procedure to reconstruct WM fiber bundles inside the brain, namely, seeding, propagation, and termination. Many options, and best practices, for each of these steps can be found in the literature (23, 98), and software exists to perform these functions at varying levels. Some of the known limitations of tractography are related to acquisition (minimum number of DTI directions) and WM architecture (crossing, kissing, and diverging fibers). Other limitations include possible inaccuracies of tractography due to the presence of neuropathological changes (99).
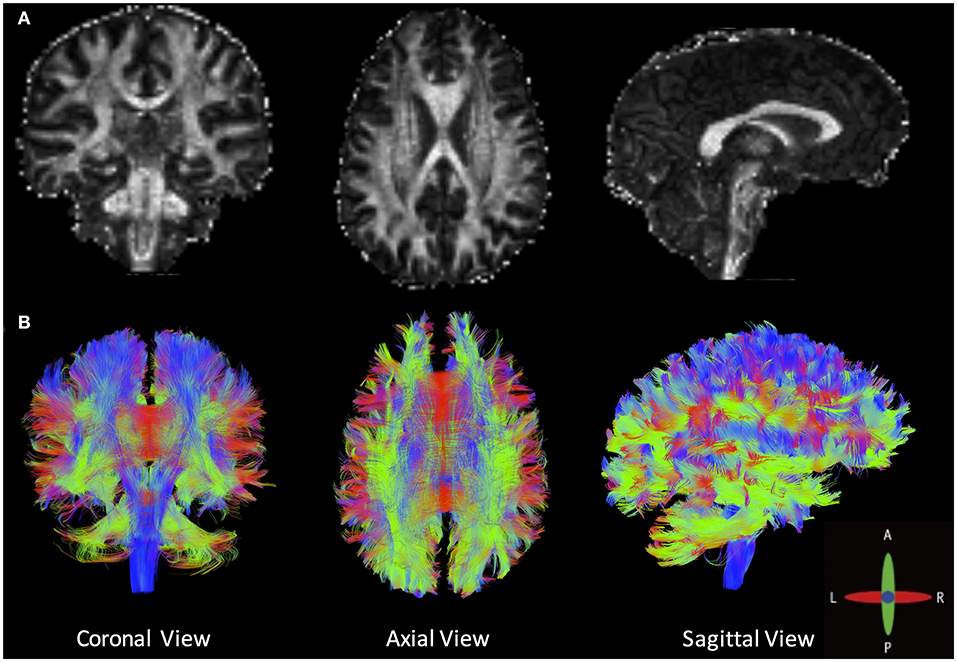
Figure 4. (A) Fractional anisotropy maps and (B) an example of whole-brain deterministic tractography created by DSI Studio in a healthy volunteer (angular threshold: 60 degrees; step size: 1 mm; anisotropy threshold: 0.20. Tracks with length shorter than 50 or longer than 300 mm were discarded. A total of 500,000 seeds were placed inside the whole brain).
Upon generation of DTI-based metrics, subsequent quantitative analyses can be performed using histogram analysis, region of interest (ROI) analysis, voxel-based analysis (VBA), or skeletonized analysis [also called tract-based spatial statistics (TBSS)]. Additionally, DTI enables measurement of the macroscopic orientation of WM tissue and analysis of structural connectivity through tractography algorithms. These different analysis methods are demonstrated in Figure 5 and are discussed in greater detail below.
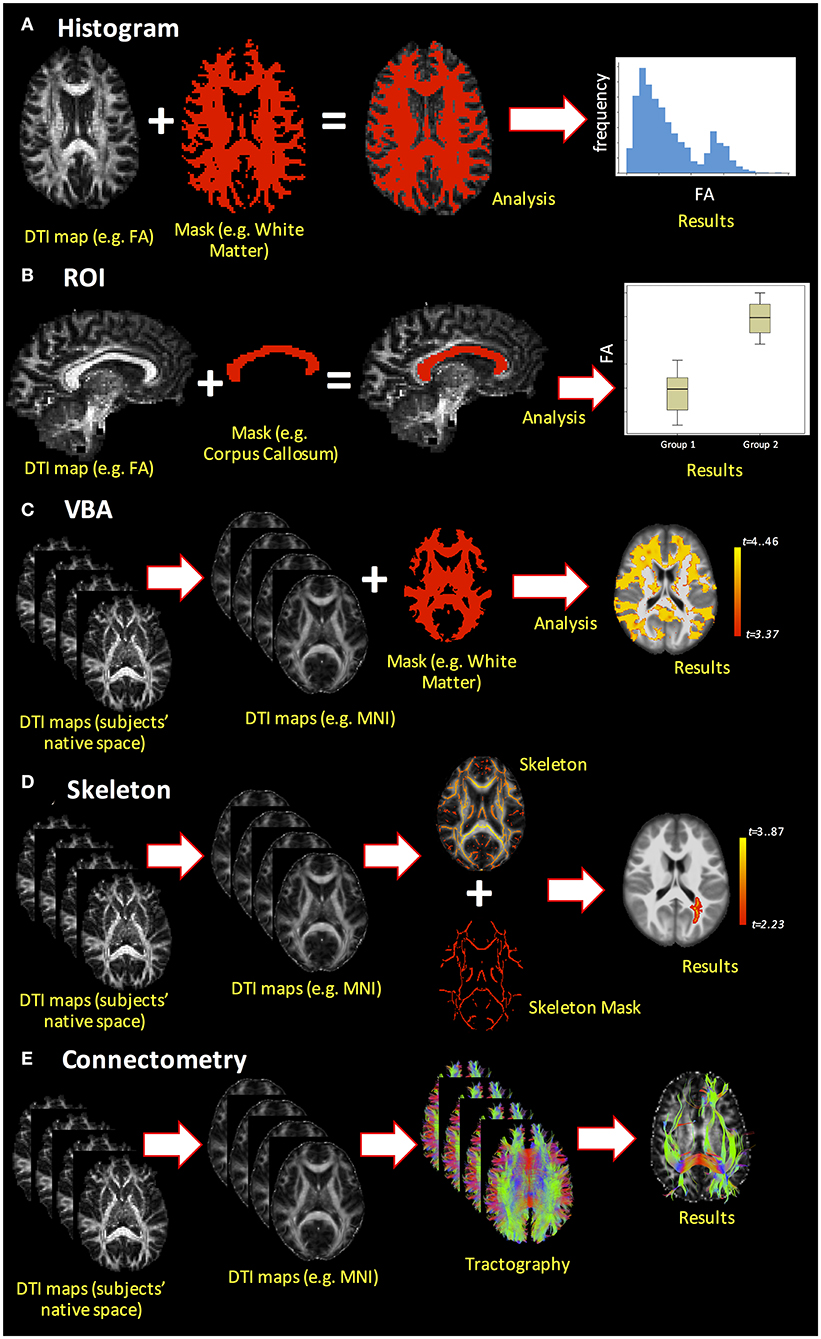
Figure 5. Example of the different dMRI analysis methods. (A) Histogram analysis; (B) ROI analysis; (C) voxel-based analysis (VBA); (D) skeletonized analysis (e.g., TBSS pipeline); (E) connectome analysis.
One of the simplest analyses is whole-brain histogram analysis (Figure 5A). Beyond mean and median, histograms permit extraction of parameters such as histogram peak height and location that can be compared across subjects or correlated with other variables. A major advantage of whole-brain histogram analysis is that no a priori choice of region is required; however, one ensuing drawback is that the results may be affected by CSF contamination (92). Region-of-interest analysis (Figure 5B) is a commonly used method to analyze DTI-derived indices, where ROIs can be obtained from automated segmentation (e.g., FreeSurfer; https://surfer.nmr.mgh.harvard.edu/) or by manual delineation. Although ROIs can be drawn directly on the DTI-derived indices, their placement may be difficult due to low-resolution images and the intensity of DTI-derived maps (e.g., FA) may spuriously influence the ROI boundaries, thereby introducing bias into the analysis. Alternatively, ROIs may be drawn on anatomical T1- or T2-weighted images, which necessitates reliable co-registration with dMRI data. One drawback to ROI analysis is that it requires either an a priori hypothesis regarding where WM differences are expected to be present in a pathology or normal development as the inclusion of many ROIs increases the number of statistical tests and requires correction for multiple comparisons.
Moving beyond ROI analysis, VBA is a fully automated approach that allows for the investigation of microstructural organization in each voxel inside the whole brain (Figure 5C). It involves the spatial normalization of high- and low-resolution images from the subjects' native space to stereotactic space, and thus, reliable co-registration is crucial. Additionally, smoothing of the data during analysis can increase the impact of partial volume effects (PVE), as the voxels may combine both WM and gray matter (GM) in such a way that the results are less robust and less specific to a specific component. As statistical analysis is performed in each voxel, there is also an increased risk of false-positive findings, such that multiple comparison corrections are compulsory. Finally, pathologies and lesions can strongly affect VBA results. Alternatively, TBSS (or skeletonized analysis, Figure 5D) can alleviate the alignment and smoothing challenges associated with VBA (100). Tract-based spatial statistics is a popular pipeline used to coregister sets of DTI maps for performing voxel-wise comparisons on skeletonized WM tracts. As a result, it precludes the study of whole-brain WM tracts, focusing instead on the components of WM tracts common across all subjects (hence the name skeletonized). In recent years, several studies have questioned the reliability and interpretability of TBSS (101), and improvements over the original TBSS pipeline have been suggested (102).
The final analysis method covered to this review is the connectome analysis (Figure 5E), which pertains to whether there are global changes in structural connectivity patterns at the end of WM pathways (103). Advantages of this method include that it is automated and identifies the global shift in WM connectivity pattern between the groups. Network-based measures derived through this connectome analysis can then be utilized to not only understand whether there is a global shift in WM-derived structural connectivity due to pathology but also to understand its correlations with clinical and pathological presentations.
DTI in Early-Stage PD
Given the known spatiotemporal progression of changes associated with PD, ROI analysis has been used widely in early-stage PD. Moreover, given the recognized involvement of the SN early in pathophysiological progression of PD, many DTI studies have focused on ROI analysis of the SN. For example, reduced FA of SN in subjects with early-stage PD compared with controls was observed by Vaillancourt et al. (36), whereas Liu et al. (43) similarly found that FAs in the rostral, middle, and caudal areas of the SN were decreased significantly in subjects with early-stage PD compared with controls. Mangia et al. (44) explored the SN and other brain locations from a multimodal MRI approach and reported neuronal degeneration of the SN in the early-PD group. However, not all studies have reported similar results. For instance, Pellizari et al. (41) observed no differences in FA in the SN between early-stage PD and HC, although differences in AxD were reported. Similarly, Joshi et al. (33) compared all DTI-derived metrics in 24 early-stage PD subjects and found increased MD in the SN. Finally, in a longitudinal study over almost 2 years, Loane et al. (39) found no significant differences in DTI metrics at baseline, but significant differences in nigral FA (decrease in PD) and MD (increase in PD) metrics were observed at the follow-up time point. As a result, the authors hypothesized that diffusion metrics in the SN may be sensitive measures of disease progression.
Parkinson disease is often associated with olfactory dysfunction, and impaired sense of smell is one of the earliest clinical symptoms of PD, preceding even the classic motor signs (104). Using ROI analysis, significant group differences in FA and MD have been observed in the anterior olfactory structures (33). These results were confirmed by Rolheiser et al. (49), who leveraged TBSS to reveal significant group differences between PD and controls in the anterior olfactory region, as well as the SN. Furthermore, reduced FA in WM associated with the central olfactory system was observed using TBSS in early-stage PD patients and was associated with a reduced ability to smell (50).
Parkinson disease–associated pathological changes are not isolated to the SN and olfactory regions. In fact, alterations have been observed in other WM areas, including the genu of the corpus callosum, superior longitudinal fasciculus, putamen, external capsule, midbrain, superior cerebellum, and superior cerebellar peduncles (37, 60). Using both ROI and tractography methods, Planetta et al. (46) found that FA values were significantly reduced in PD in fibers projecting from the anterior nucleus, ventral anterior nucleus, and dorsomedial nucleus. In addition, reduced FA values approached significance in the ventral lateral nucleus of patients with PD. Similarly, regions that have shown reduced FA using TBSS include the bilateral anterior corona radiata, upper corona radiata, posterior thalamic radiation, optic radiation, fornix, and corpus callosum, among others (48, 56). In a study of 125 early-stage PD and 50 HC individuals, increased MD in PD subjects was observed in several WM locations, suggesting early axonal damage (52). On the other hand, some studies have reported no significant differences between early-stage PD and controls (35, 39), whereas higher FA values in several WM locations have also been reported (57).
Given the evidence of widespread WM changes, whole-brain metrics may be of interest. Tessa et al. (31) previously used whole-brain histogram analysis to compare FA metrics between controls and de novo drug-naive PD (n = 27), the latter of which was divided in tremor-dominant, akinetic-rigid, and mixed types. Increased FA was observed in patients with PD, which was more pronounced in patients with the akinetic-rigid subtype. Considering the use of whole-brain analysis, these results support the hypothesis that widespread neuropathology exists at the time of clinical onset, possibly driven by the inclusion of GM in whole-brain analysis. Connectome analysis has also shown significant differences in the WM-derived structural connectome associated with PD (29, 30, 105). More specifically, lower global efficiency and global clustering coefficient have been observed in PD compared with HCs (26). Arrigo et al. (27) found significant alterations in optic radiation connectivity distribution, a significant increase in optic radiation MD, and a significant reduction in WM concentration in early-stage PD. Finally, Tinaz et al. (28) investigated the structural and functional organization in PD subjects, finding reduced WM connectivity in frontoparietal–striatal nodes compared to controls, but no change in modular organization of the WM tracts. A recent study by Mishra et al. (105) reported that there is an early-stage PD-specific WM-derived connectome comprising pathophysiologically relevant regions and that the overall connectivity in early-stage PD in these regions is significantly higher than that compared to HC. Additionally, PD groups have shown reduction in functional local network metrics in many nodes distributed across the connectome (28).
Several studies have sought to correlate DTI findings with clinical metrics, including functional and cognitive measures, both cross-sectionally and longitudinally. The cross-sectional results have been mixed with both ROI analysis and TBSS, with some studies showing no correlations between DTI-derived metrics and clinical measures (38, 48) and other studies reporting significant correlations, particularly in the caudate nucleus (34, 41). Minett et al. (51) found that at baseline patients with early-stage PD had significantly higher MD relative to HC, and in patients with PD and mild cognitive impairment, higher MD was significantly correlated with lower attention and executive function scores. In this longitudinal study, DTI-derived WM microstructural changes were assessed as potential prognostic biomarkers of worsening motor features or cognitive decline in patients with PD. At follow-up, frontal MD increased significantly when comparing patients with PD and mild cognitive impairment with HC. In another longitudinal study over 18 months, patients with early-stage PD with unilateral disease were shown to have higher rates of microstructural changes compared to patients with later-stage PD with bilateral disease, suggesting that substantial microstructural changes occur during the early stages of disease (54). Gray matter changes have also been implicated in PD-associated cognitive impairment, where reduced cortical microstructural integrity was associated with reduced cognitive performance in early-stage PD patients (45).
While many of the aforementioned studies have used subject sample sizes on the order of 20 to 30, several studies have leveraged the PPMI database that features larger patient enrollment and longitudinal data, along with clinical metrics. Using ROI analysis, Schuff et al. (40) analyzed WM abnormalities in 153 early-stage drug-naive de novo PD and compared these measures with 67 HC from the PPMI database, finding a marginally non-significant interaction between nigral FA and disease status. However, significant interactions between WM regions and disease status have been found in several other non-PPMI studies (32, 38, 106). Analyzing longitudinal PPMI data using VBA, Taylor et al. (66) found significantly increased FA in brainstem, cerebellar, anterior corpus callosal, inferior frontal, and inferior fronto-occipital WM and increased MD in primary sensorimotor and supplementary motor regions. After 1 year, PD patients showed a significantly stronger decline in FA compared to HC in the optic radiation and corpus callosum, as well as parietal, occipital, posterior temporal, posterior thalamic, and vermis GM. The authors postulate that these findings are in line with spatiotemporal patterns of α-synuclein, in both WM and cortical GM. Diffusion tensor imaging–derived metrics of the nigrostriatal tract were shown to have a systematic abnormalities in 50 PD patients from PPMI using tractography; in addition, variations in FA and RD of the nigrostriatal tract were associated with the degree of motor deficits in PD patients (64).
Given the numerous permutations of DTI analysis methods, Mishra et al. (58) performed a systematic comparison of various postprocessing approaches used for identifying WM differences using DTI data from PPMI database. Region-of-interest–based analysis, VBA with varying spatial smoothing, and two widely used skeletonized approaches (TBSS and tensor-based registration with DTI-TK) were compared in a group of 81 early-stage PD and 44 HCs from PPMI. Both skeletonized approaches revealed significant negative correlations for FA with disease duration, although DTI-TK was found to be more accurate for assessing disease progression. However, no analytic techniques showed any group difference in any region between early-stage PD and HC. These types of comparisons provide context for studies that have shown conflicting findings with different analysis pipelines and highlight the importance of standardization of DTI analysis.
To provide a more comprehensive view of early-stage PD-related neuropathological changes, several studies have combined imaging metrics with different underlying pathophysiological correlates. Wei et al. (47) and Pelizzari et al. (41) combined microstructural DTI-derived metrics with perfusion using arterial spin labeling to increase diagnostic accuracy for early-stage PD. In those studies, both FA and cerebral blood flow in the hippocampus, prefrontal cortex, and parietal WM regions were decreased in early-stage PD and mid-late PD compared with HC. In addition, FA was decreased in the SN, while hypoperfusion was observed in the frontal/occipital WM regions. Several authors have also used DTI together with VBM, which can detect subtle brain volumetric changes using structural images, to investigate the relationship between WM tracts, GM volume and PD. These studies found reduced WM microstructural integrity and reduction of GM volume in PD subjects in several regions, such as cingulum, superior longitudinal fasciculus, inferior longitudinal fasciculus, inferior fronto-occipital fasciculus, striatum, and the frontal, temporal, limbic, and paralimbic areas (27, 45, 52, 55, 62, 65, 107).
Sleep disorders, such as rapid eye movement sleep behavior disorder, may coincide with early-stage PD, and the combination of sleep disorders and early-stage PD has been associated with more advanced disease status, despite similar clinical characteristics and cognitive performance (63). Parkinson disease patients with sleep disorders have shown regions of reduced cortical GM volume, as assessed by VBM, and WM changes, most notably reduced FA using TBSS, compared with those who did not have sleep disorders, though not significant when adjusted for multiple comparisons. In a separate study, cortical and subcortical alterations in de novo PD patients were observed using VBA-DTI (65); notably, many of these changes occurred in the brainstem, specifically the pontine tegmentum, which has been implicated in the regulation of sleep cycles (108).
Mood disorders, including depression, apathy, and anxiety, have been associated with more advanced PD stages and may be related to dopaminergic depletion (109); however, these neuropsychiatric conditions have also been implicated in early-stage disease and may have a different underlying etiology (62). Gou et al. found no significant WM microstructural differences between depressed and non-depressed PD groups using TBSS (59), a finding that was replicated by Lacey et al. using data from PPMI (53). However, connectivity analysis revealed significant network changes associated with PD patients with depression (59). Parkinson disease with apathy has also been associated with bilateral microstructural alterations in the medial corticostriatal limbic system; more specifically, decreased FA and increased MD were observed in the anterior striatum and pregenual anterior cingulate cortex, along with concomitant serotonergic dysfunction (62).
While most studies have sought to differentiate between PD and HC groups, some studies have assessed the potential of DTI biomarkers to differentiate PD subgroups. In one study, decreased FA was observed in the SN using ROI analysis in early and mid–late PD patients compared with healthy subjects, but there were no significant differences in the same metrics between early-stage PD and mid–late PD groups (47). These results suggest that SN changes occur early in the pathology of PD and rapidly reach a plateau, such that longer disease duration is not indicative of increased nigral microstructural changes. Comparing early-stage PD and neurodegenerative atypical parkinsonism (AP), higher MD in the centrum semiovale, body of the corpus callosum, putamen, external capsule, midbrain, superior cerebellum, and superior cerebellar peduncles has been observed in AP (60). Another study using ROI analysis across PD subgroups found that widespread microstructural changes were present only in late-stage PD groups and not in early and moderate PD groups (61). The authors further suggest that standard DTI methods may not be sensitive to early PD pathology, which may indicate a role for more advanced methods.
Free-Water Algorithms for DTI Correction
The complex organization of brain tissue, in combination with the relatively large voxel size in dMRI acquisition, results in PVE in diffusion tensor measurements. Consequently, DTI-derived metrics are influenced by the combined contributions of different brain tissue compartments, including CSF and/or extracellular free water (110). Free-water is defined as water molecules that neither experience flow nor are restricted by their surroundings. In the human brain, free water is found in CSF within the ventricles and around the brain parenchyma. For instance, CSF has a relatively large diffusion coefficient compared with that of the brain parenchyma, such that PVE in the periventricular regions and the sulci may overestimate the ADC values by 15–30% (111). Several methods can be employed to remove free-water contributions, such as fluid-attenuated inversion recovery diffusion-weighted imaging (FLAIR-DWI) (112) or the free-water correction algorithm developed by Pasternak et al. (113) for single-shell acquisitions and later extended to multishell acquisitions (114). Planetta et al. (67) used a free-water DTI algorithm in the context of early-stage PD patients taking rasagiline, a monoamine oxidase inhibitor used to treat PD, and found that the +rasagiline group had less free water in the posterior SN and better performance on a coordination task than the –rasagiline group. However, interpretation of changes in free-water measures from single-shell dMRI acquisitions must be interpreted cautiously, as the measures are biased at crossing-fiber regions (115), which make up approximately 90% of WM voxels (116).
Beyond DTI: Diffusion Kurtosis Imaging
Although DTI is widely used to study WM organization, its inherent assumption of a Gaussian distribution results in an inability to resolve tracts in voxels with complex fiber arrangements (99). To overcome this issue, other techniques such as DKI have been developed. Kurtosis is a statistical measure of the deviation from a Gaussian distribution (which is the assumed distribution for DTI), and thus, DKI-based methods can quantify non-Gaussian diffusion (117). This technique is largely based on the same type of pulse sequences employed for DTI, but DKI requires multishell dMRI at higher b values than those conventionally utilized for DTI analysis.
For DKI, the natural logarithm of the diffusion-weighted signal can be approximated by an expansion in terms of the b values:
where S(b) is the signal intensity, Dapp is the apparent diffusion coefficient, and Kapp is the apparent diffusional kurtosis, and the term O(b3) is the Taylor expansion for power of b > 2. In the case of Gaussian diffusion, Kapp is zero, and Equation (5) reduces to the standard DTI equation. Analogous to DTI, this equation is solvable to yield the diffusion kurtosis tensor .
Diffusion kurtosis imaging processing is only slightly more complex than DTI processing, although DKI provides a significantly more complete characterization of water diffusion and tissue structure.
Diffusion kurtosis imaging provides the same set of diffusion parameters as DTI (DKI-FA, DKI-RD, DKI-AD, and DKI-MD), in addition to mean kurtosis (MK), radial kurtosis (RK), and axial kurtosis (AK), which are the most commonly used kurtosis metrics. Similar to DTI, AK is the primary eigenvalue of the apparent kurtosis tensor along the main diffusion direction, whereas RK is the average of the kurtosis coefficients on the equatorial plane. Kurtosis anisotropy is the DKI analog to FA (118).
Even though DKI is more complete than DTI and is able to quantify non-Gaussian diffusion in the brain, DKI-derived diffusion parameters (e.g., DKI-FA) are limited in their sensitivity to detect abnormalities in WM regions with complex fiber arrangements (119). Therefore, the kurtosis indices, such as MK, may be more accurate metrics for WM structural analysis using DKI.
DKI in Early-Stage PD
Diffusion kurtosis imaging has been used in several studies to assess the early stages of PD. Zhang et al. (82–85) published several studies with DKI in early-stage PD with both cross-sectional and longitudinal designs. In these studies, MK in the SN was significantly increased in PD compared with HCs. Additionally, MK in the SN was positively correlated with the H&Y score staging and part III of the Unified Parkinson's Disease Rating Scale (UPDRS-III). In another study, Surova et al. (86) used DKI to study 105 patients with early-stage PD. They found differences in DTI and DKI metrics between PD subjects and HC in the putamen, thalamus, and superior longitudinal fasciculus, which were also associated with increased disease severity. Guan et al. (42) used ROI analysis of DKI metrics to study advanced and early-stage PD, and MK was found to be significantly lower in bilateral SN in patients with both early-stage and advanced PD than in controls. In addition, MK in the left SN was significantly lower in patients with advanced PD than in those with early-stage PD. However, no differences in FA or MD values were observed between the PD and control groups in that study, and no significant correlations between MK, FA, or MD values and the UPDRS scores were observed.
Beyond DTI: Neurite Orientation Dispersion and Density Imaging
Neurite orientation dispersion and density imaging is a practical dMRI technique for estimating the microstructural complexity of dendrites and axons in vivo (120). Neurite orientation dispersion and density imaging distinguishes between three microstructural environments: intracellular, extracellular, and CSF compartments. Each compartment affects water diffusion in a unique way (121) and gives rise to a separate normalized MR signal. The full normalized signal, S(A), which includes all environments, is written as follows:
where Aic and vic are the normalized signal and volume fraction of the intracellular compartment, respectively; Aec is the normalized signal of the extracellular compartment; and Aiso and vec are the normalized signal and volume fraction of the CSF compartment, respectively (120). By fitting Equation (6), it is possible to obtain vic, viso, and the concentration parameter of the Watson distribution (k), which is a parameter related to Aic. Using k, the orientation dispersion (OD) index can be defined as follows:
Neurite orientation dispersion and density imaging–derived indices have been suggested as imaging biomarkers in early-stage PD, as discussed below. Moreover, NODDI-derived metrics are less sensitive to partial volume effects than DTI (122), which are known to reduce the accuracy of DTI-derived metrics.
NODDI in Early-Stage PD
Neurite orientation dispersion and density imaging has been used in only two studies in early-stage PD. Andica et al. (87) used both NODDI and tractography to compare vic, OD, and viso between groups of PD and HCs. They found that the contralateral distal vic of the nigrostriatal pathway was significantly lower in PD patients than in HCs. However, no correlations were detected between different NODDI indices and disease duration or motor symptom severity. Surova et al. (86) used NODDI, in addition to DKI as discussed above, and ROI analysis in 105 patients with PD, finding increased viso in the superior longitudinal fasciculus and decreased viso in the corticospinal tract.
Beyond DTI: Q-Space Diffeomorphic Reconstruction
In addition to limitations of DTI related to non-Gaussian diffusion, other known limitations such as its inability to independently resolve crossing fibers (123) and sensitivity to PVE, result in DTI-derived metrics that reflect a weighted average of multiple diffusion components within a voxel. These limitations reduce the accuracy of DTI-derived metrics and also of WM tractography. For instance, in voxels with multiple tract orientations, a decrease in FA for one of these fiber populations may result in a contradictory increase in the overall FA (124). To partially overcome this issue, dMRI techniques such as QSDR have been developed.
The orientation distribution function (ODF) can be used to characterize the diffusion distribution of fiber populations, thus overcoming crossing fiber limitations. To calculate the ODF, diffusion data can be acquired using a single-shell diffusion sampling scheme, also known as high angular resolution diffusion imaging (HARDI) (123), or a grid sampling scheme, which is known as diffusion spectrum imaging (DSI) acquisition (125). However, studies using ODF to characterize the diffusion distribution may also suffer from partial volume effects. To overcome these effects, the spin distribution function (SDF) can be obtained from generalized Q-sampling imaging (GQI) (126), where SDF represents the proportion of spins undergoing diffusion in different orientations. Q-space diffeomorphic reconstruction is an advanced method to calculate transformed SDFs in any given deformation field that satisfies diffeomorphism (127). Therefore, QSDR can resolve crossing fibers with substantially smaller impact of partial volume effects.
The quantitative anisotropy (QA), which is defined as the proportion of spins that undergo diffusion along a given fiber orientation, can characterize the diffusion behavior of a fiber population. Quantitative anisotropy is calculated from the peak orientations on an SDF. Each peak orientation defines a QA value:
where ψQ is the SDF, Z0 is the SDF scaling constant, â is the orientation of the fiber defined by the local maximum of the SDF, and I(ψQ) is the background isotropic component, which can
be approximated by the minimum value of the SDF. With QSDR and the QA index, it is possible to run subsequent analysis, such as VBA (through the normalized QA; nQA = QA/[max QA value]), tractography, and connectome analyses (Figure 6).
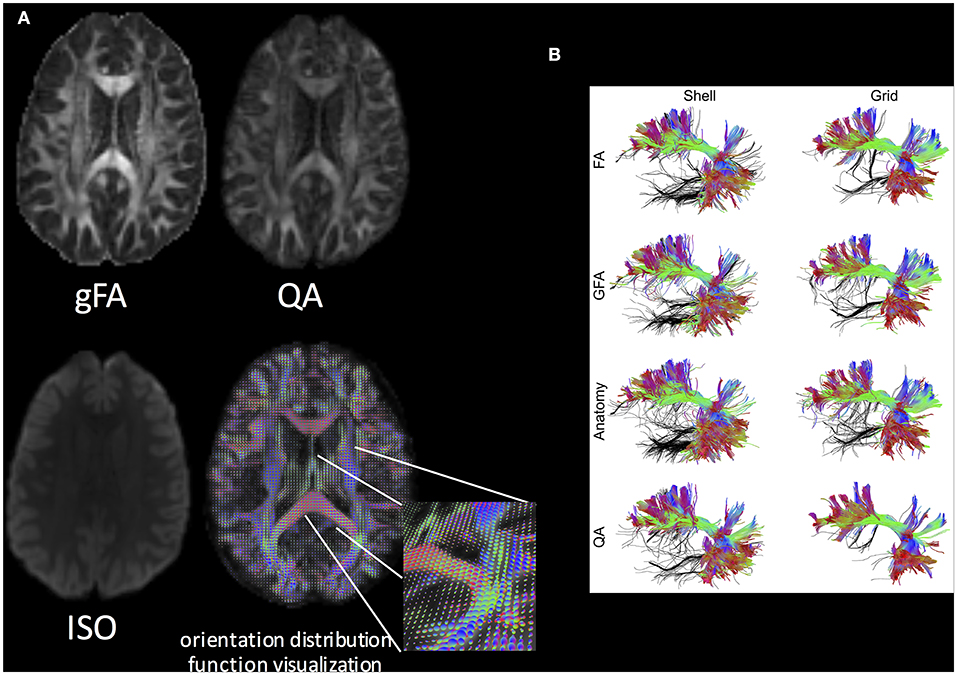
Figure 6. (A) Q-space diffeomorphic reconstruction using DSI Studio. gFA, QA, ISO (represents background isotropic diffusion contributed from CSF), and the ODF visualization are shown. (B) The performance of the FA-aided, GFA-aided, anatomy-aided, and QA-aided tractographies showing arcuate fasciculus using shell and grid sampling data. The false tracks are colored in black, whereas accurate trajectories are coded by directional color. The tractographies using FA, GFA, and anatomical information show substantially more false tracks than do those using QA. The best performance can be observed in the tractography using QA and the grid dataset. Reproduced with permission from Yeh et al. (128).
QSDR in Early-Stage PD
All QSDR studies in early-stage PD used patients from the PPMI database. Ghazi Sherbaf et al. (69) published several studies by using this technique utilizing PPMI database. They studied PD subjects with depression and sleep behavior disorder (70–72). Additionally, they found that PD patients exhibited negative correlations between QA and insulinlike growth factor 1 level in several WM locations, including the middle cerebellar peduncle, left and right cingulum, and genu and splenium of the corpus callosum (72); additionally, they demonstrated that the blood marker apolipoprotein A-1 can predict microstructural changes in WM regions in early-stage PD patients with undisturbed cognition and mild motor disability (68). Utilizing QA in a connectome analyses, Haghshomar et al. (74) previously studied the structural correlation of various WM tracts in 81 early-stage PD patients with the whole-blood neutrophil-to-lymphocyte ratio and identified that the QA index correlated with this ratio in the bilateral cingulum, body and left crus of fornix, bilateral corticospinal tract, body and splenium of corpus callosum, and superior cerebellar peduncle. In another study of 85 subjects with PD, connectome analysis of QA revealed a positive association with WM density in bilateral corticospinal tract in the H&Y stage 1 patients, whereas a negative association was observed in the genu of the corpus callosum and bilateral cingulum in H&Y stages 1 and 2 groups (75). In addition, associations between autonomic functional scores and structural brain connectivity in PD were found. Wen et al. (80) used TBSS with graph-theoretical and network-based analyses with QSDR reconstruction to compare WM regional and network features between early-stage PD [tremor-dominant and postural instability and gait difficulty (PIGD) subtypes] and HC groups. Using TBSS and QSDR, tremor-dominant patients showed increased FA and decreased RD and AxD in several areas. Additionally, motor severity had mild to moderate correlations with FA and RD in the genu of the corpus callosum in tremor-dominant subjects, whereas motor severity had strong correlations with FA and RD of multiple association tracts in PIGD subjects. On the other hand, network-based statistical analysis did not reveal any subnetworks with connectivity differences between groups.
Structural network alterations have also been investigated from healthy aging to the prodromal phase of PD to early-stage PD (73). Compared with HCs and de novo PD patients, prodromal PD patients showed significantly increased small-world-ness, higher clustering coefficient, and greater local connectivity between regions relating to motor, olfactory, and sleep functions. Parkinson disease patients without hyposmia have shown a significant decrease in global efficiency compared to controls using TBSS with graph-theoretical methods and network-based statistics (81). Additionally, PD patients with hyposmia were shown to exhibit significantly reduced global and local efficiency, as well as a disrupted connection between the right medial orbitofrontal cortex and left rectus, with poorer frontal-related cognitive functioning. Utilizing connectome analysis in 18 early-stage PD and 17 prodromal PD patients, Sanjari Moghaddam et al. (76) investigated the microstructural association of olfaction in prodromal PD as compared to early-stage drug-naive PD patients. Their studies suggested that individuals with prodromal PD have a significantly higher QA as compared to PD patients in bilateral middle cerebellar peduncles and right arcuate fasciculus.
Wen et al. (79) analyzed two different groups of early-stage PD (H&Y stages 1 and 2) using TBSS and QSDR connectome analysis. They found that the earlier stage PD (H&Y stage 1) was associated with higher FA and lower MD and RD in callosal, projection, and association fibers than both HCs and higher-stage PD (H&Y stage 2). The timeline of these alterations between HC and H&Y stage 2 PD was hypothesized to be indicative of compensatory mechanisms arising from early dopaminergic dysfunction in the SN, although further studies are needed to confirm the presence of these neural compensation mechanisms. In addition, motor severity was inversely correlated with FA and positively correlated with MD and RD in PD patients. Moreover, connectome analysis also revealed increased WM density in the aforementioned tracts in PD patients, compared with HCs.
Finally, olfactory dysfunction has been investigated in relation to QSDR findings. Multiple regression analysis in prodromal PD demonstrated positive association between the University of Pennsylvania Smell Identification Test (UPSIT) score and connectivity in left and right subgenual cingulum, right inferior fronto-occipital fasciculus, left corticospinal tract, left parietopontine, left corticothalamic tract, and the body and the splenium of corpus callosum. Sobhani et al. (77) studied olfactory dysfunction in PD, confirming a discriminative role for UPSIT score in identifying WM microstructure changes in early-PD subjects.
Software for DTI Analysis
Different software packages have been used for diffusion analysis in early-stage PD (Table 2). Most of the available software provides both preprocessing and processing steps within the same pipeline. A standalone preprocessing method, DTIprep, may also be used, which performs an automatic study-specific protocol for DWI/DTI quality control and preparation. After preprocessing, multiple software packages are available to generate DTI-derived metrics. FSL is one of the most widely used software packages for DTI analysis. FDT-FSL employs both linear least squares (LLS) and weighted linear least squares (WLLS) fitting procedures. CAMINO is another open-source software toolkit for dMRI processing. It employs LLS, WLLS, unconstrained non-linear optimization, and the robust estimation of tensors involving the outlier rejection (RESTORE) fitting algorithms. Robust fitting methods (RESTORE and iRESTORE), together with LLS fitting, can also be found in the tolerably obsessive registration and tensor optimization indolent software ensemble (TORTOISE) software. Analysis of Functional NeuroImages (AFNI) is frequently used for fMRI analysis, but it can also be employed for DTI fitting (LLS and non-LLS). Diffusion spectrum imaging Studio is a tractography software tool that maps brain connections and correlates findings with neuropsychological disorders. It works with several dMRI methods, including DTI, GQI, QSDR, dMRI connectome analysis, and generalized deterministic fiber tracking. DTI Studio and Explore DTI are other reliable software packages for DTI fitting and dMRI analysis. FSL's probtrackx (within FDT) and the TRActs Constrained by UnderLying Anatomy (Tracula, within FreeSurfer) are both used for probabilistic tractography; DSI Studio and TrackVis are appropriate for deterministic tractography, whereas MRtrix contains both probabilistic and deterministic algorithms. Matlab toolboxes include the Brain Connectivity Toolbox (BCT) for dMRI-derived structural connectivity analysis, DTI and Fiber Tracking toolbox for DTI fitting and tractography, and NODDI toolbox for NODDI analysis. In several studies, authors used in-house software or MRI workstation software for DTI and DKI analysis.
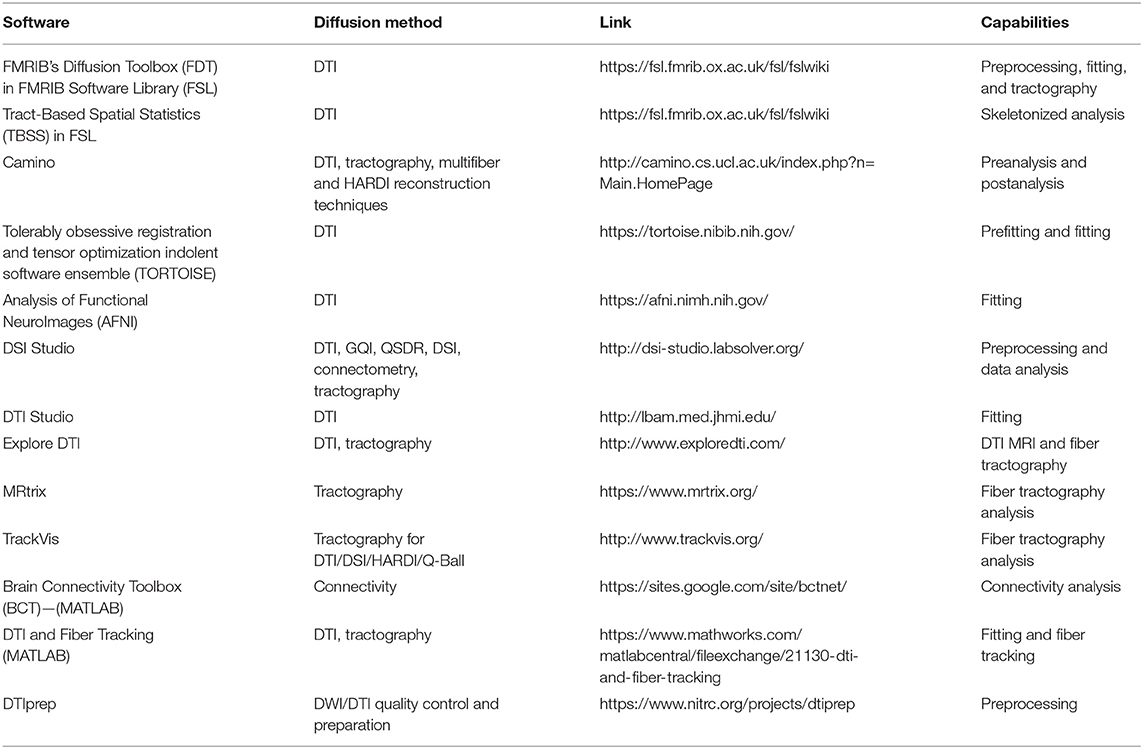
Table 2. List of the main software for dMRI data processing and analysis available.
Discussion
Current State of dMRI in Early-Stage PD
Overall, dMRI has been widely used in research settings to investigate WM changes in early-stage PD. In general, DTI acquisition (and similarly DKI) is fairly standardized across vendors and sites, leading to high consistency for data acquisition. The vast majority (56 of 62) of studies included in this systematic review used two b values (typically b = 1,000 s/mm2 and b = 0), although three studies used more b values (up to four b values), and three did not provide this information. More variability is observed in terms of the number of diffusion directions across studies, although the majority used more than 60 directions (37 of 62 studies). Several studies used 30 to 39 directions (seven studies) or 20 to 29 directions (12 studies). Only three studies used fewer than 20 directions. As stated above, more advanced methods require high angular resolution dMRI data, whereas even standard DTI may benefit from improved data acquisition. In general, more than 30 directions can be recommended, and multiple shells may enable improved quantification of dMRI metrics. Despite the similarity in acquisitions, analysis methods can vary widely across studies and are less standardized.
Additionally, the various preprocessing steps for diffusion data can lead to different findings. Echo-planar imaging (EPI) acquisitions suffer from geometric and intensity distortions caused by static magnetic field inhomogeneity, which is worse at higher field strengths; additionally, DTI images are susceptible to the distortions caused by eddy currents induced by large diffusion gradients. There are several methods to correct these issues as part of the preprocessing pipeline. For example, the FSL toolbox includes several tools, including eddy and top-up, which can be used alone or in concert to correct dMRI images. Moreover, the effects of the signal-to-noise ratio can have effect on the accuracy and reproducibility of DTI-derived metrics (129), highlighting the importance of both acquisition and preprocessing steps.
Another important point to consider in light of the dMRI findings in early-stage PD is the effects of the different statistical methods used. Correction of p-values can be achieved in multiple ways and may vary across studies. For instance, the threshold-free cluster enhancement is a method for finding significant clusters without having to define binary clusters, whereas cluster-based thresholding methods are used to correct data for multiple comparisons. Often, the data are reported as family-wise error (FWE)-corrected, which means that the family-wise error rate is controlled. It is important to note that correction for multiple comparisons (e.g., Bonferroni or false discovery rate) is compulsory when analysis includes more than two groups (e.g., analysis of variance post hoc analysis) and/or when using multiple ROI analysis.
Despite the lack of standardized methods, dMRI methods are increasingly used to understand whether dMRI-derived metrics suggesting WM disorganization are related to clinical presentation. Early-stage PD patients with non-motor symptoms, such as those with olfactory dysfunction or those with substantial SN dopaminergic neuron loss, have been analyzed with various dMRI techniques. Conventional single-tensor DTI models, as well as more sophisticated dMRI models such as DKI and NODDI, have independently suggested diffuse WM changes in early-stage PD, supporting the notion of early axonal damage in PD while simultaneously suggesting that PD pathology may go unrecognized until symptoms appear. Moreover, conventional DTI metrics such as FA and MD have displayed sensitivity to potentially identify earlier symptomatic regions, such as olfactory structures, using correlations with clinical presentations in predetermined ROI analysis. In addition, several studies have considered dMRI changes in GM (10, 45, 65, 66, 86, 107, 122), which may also be implicated in PD pathology. However, as GM lacks the microstructural organization of WM, interpretation of GM-DTI must be approached with caution. In contrast, NODDI has previously been shown to reflect the neurobiology of cortical microstructures (122), suggesting that more advanced dMRI models may enable robust GM characterization in early-stage PD.
However, studies have often displayed heterogeneous results, which may be at least partially attributable to the varying preprocessing and postprocessing steps and statistical approaches utilized. Early-stage PD patients are also heterogeneous in their clinical presentations, and this may further contribute to such varied findings. Although the combination of different dMRI acquisitions and analyses may yield new and more accurate information related to dMRI-derived WM structural disorganization and global connectivity changes in early-stage PD, dMRI has the capability to be developed as a useful neuroimaging tool for diagnosis and prognosis of early-stage PD by rigorously developing and enforcing a set of standardized acquisition and postprocessing tools. This will ultimately provide more reliable dMRI-derived neuroimaging biomarkers that are not only significantly different when compared to HC in early-stage PD, but also attempt to explain their correlations with clinical presentation. Altogether, these will in turn help to understand the neuropathological underpinnings of the progression of PD. Utilizing advanced dMRI methods that overcome some of the known limitations of DTI is also imperative, as measures derived through these advanced dMRI methods may help to understand tract-specific deterioration of WM organization in the progression of PD. Ultimately, ensuring standardization of patient recruitment, data acquisition, postprocessing analytical tools, and statistical approaches could move dMRI toward clinical implementation for identifying dMRI-derived neuroimaging biomarkers.
Challenges of dMRI in Early-Stage PD
As previously mentioned, conflicting results are often reported in dMRI studies on PD subjects. The small sample size of participants, heterogeneous clinical presentation, and sex imbalance may be responsible for such non-reproducible results reported in the literature. Moreover, the heterogeneity of findings may also be related to the dMRI data acquisition. It is important to emphasize that dMRI acquisitions with fewer than 30 directions may not correctly estimate DTI metrics. For robust estimation of anisotropy, at least 20 unique sampling orientations are necessary, whereas at least 30 unique sampling orientations are required for robust estimation of both tensor orientation and MD. Diffusion schemes with a lower number of sampling orientations may introduce bias and spurious correlations between tensor orientation and apparent diffusion characteristics (130). Hence, acquiring data with at least 45 to 60 diffusion-encoding directions might help to better resolve crossing fibers, may aid in connectome analyses, and can be generally recommended for dMRI data acquisition.
The trend to acquire multishell dMRI data with multiple b values is increasing and is also widely recommended. With the advent of simultaneous multislice techniques, it is now clinically feasible to acquire high angular resolution data with multiple shells in clinically acceptable time of approximately 20 min. Acquiring such high angular resolution data with multiple shells permits estimation of advanced dMRI-derived metrics, such as free-water corrected DTI metrics, DKI-derived metrics, and NODDI-metrics. In the future, the sensitivity and specificity of each of these measures should be compared with disease progression to identify the most reproducible, sensitive, and specific dMRI-derived neuroimaging biomarkers for understanding neuropathological underpinnings of PD.
Another possible source of different results lies in the different postprocessing software and statistical approaches used. The algorithms used for tensor fitting of diffusion-weighted data can have substantial effects on the results, not only for PD, but also for other diseases (131, 132). For instance, although LLS fitting model is fast, it incorrectly assumes that data outliers are homogeneously distributed, and therefore it fails to appropriately deweight their contributions. On the other hand, WLLS is slower than the LLS but assigns a weight according to how much the original noise variation is affected by logarithmic transform of the data. While more robust fitting algorithms are available, such as RESTORE and iRESTORE, these are not frequently used because of more complicated pipelines. Identifying the most reproducible statistical approach and the best preprocessing and postprocessing tools are important unmet needs in analysis of dMRI data.
New Avenues for dMRI in Early-Stage PD
We previously discussed that DTI has several limitations related to an assumption of Gaussian diffusion, presence of crossing fibers, and partial volume effects. Each of the methods presented above that move beyond standard DTI has some aspect that overcomes these limitations, such as DKI to characterize deviations from Gaussian diffusion, NODDI to characterize and minimize partial volume effects, and QSDR to characterize both intravoxel fiber orientation heterogeneity and partial volume effects. Network-based approaches that do not assume the caliber or density of axons in WM, but rather only the orientation of axons, have seen a surge in recent years since PD has been postulated as a network disorder. In several early-stage PD studies, these advanced approaches have been used to overcome DTI-related limitations, although other options are available and have not been investigated. For example, DSI (133) is a technique that can resolve the fiber crossing limitation; however, DSI requires both more time for acquisition than standard DTI and larger pulsed field gradients.
While each of these methods may overcome a fundamental limitation for DTI, these methods may have different limitations themselves (113). For instance, DKI and NODDI suffer from their inherent mathematical assumptions that require data collection methods and analysis that may not be practical or feasible. Interpreting the free-water contribution as applied to DTI is also challenging. Studying network topology through WM-derived structural connectivity may be limited because there is no consensus on the choice of tracking algorithm or edge weights. However, high angular resolution dMRI data acquisition at multiple shells in a clinically acceptable time lends hope in applying and standardizing these advanced dMRI techniques, while simultaneously permitting the incorporation of metrics from these advanced dMRI techniques into network-based analysis.
Outlook for Future of dMRI in Early-Stage PD
The clinical management of PD faces a significant challenge because moderate to severe neurodegeneration has been shown to be present before the diagnosis is rendered. In addition, the classic presentation of motor disability in PD is shown to co-occur with non-motor symptoms such as changes in mood and behavior, cognitive impairment, sleep disorders, and olfactory dysfunction. The need for neuroimaging biomarkers to detect initial neuropathological changes is crucial to optimize patient care via correct diagnosis and treatment.
Diffusion tensor imaging–based metrics have shown significant but subtle changes in early-stage PD in many areas, such as the motor, premotor, and supplementary motor cortices, corpus callosum, and SN (37, 134, 135). Moreover, non-motor features common to PD, including olfactory dysfunction, REM sleep behavior disorder, cognitive impairment, excessive daytime sleepiness, and depression, can appear in the early stages of PD, providing rationale for screening for PD-like pathology (136). While all of these symptoms have been studied with DTI, the results have been limited or heterogeneous (137, 138). Although hallmark regions such as the SN have been extensively studied using DTI, other regions, along with corresponding hallmarks of PD pathology, should be examined more extensively via advanced dMRI techniques. Additionally, further studies and the inclusion of advanced dMRI methods may aid in establishing more coherent knowledge of WM changes in PD-associated non-motoric symptoms, possibly providing neuroimaging-based biomarkers and thus creating an avenue for advancement of patient care and treatment.
Data Availability Statement
All datasets generated for this study are included in the article/supplementary material.
Author Contributions
RW conceived of the presented idea. MB and EK performed the literature search and method review. MB created all figures and tables. MB, EK, VM, and AS wrote the manuscript. All authors edited and approved the manuscript. AS and RW share senior authorship.
Funding
This work was supported by the Barrow Neurological Foundation, Sam & Peggy Grossman Family Foundation, and Samuel P. Mandell Foundation.
Conflict of Interest
The authors declare that the research was conducted in the absence of any commercial or financial relationships that could be construed as a potential conflict of interest.
Abbreviations
dMRI, Diffusion MRI; PD, Parkinson disease; SN, substantia nigra; MRI, Magnetic resonance imaging; VBM, voxel-based morphometry; fMRI, functional MRI; rs-fMRI, Resting-state-fMRI; HC, healthy controls; DTI, Diffusion tensor imaging; WM, white matter; FA, fractional anisotropy; MD, mean diffusivity; AxD, axial diffusivity; RD, radial diffusivity; DKI, diffusion kurtosis imaging; H&Y, Hoehn & Yahr; PPMI, Parkinson's Progression Markers Initiative; NODDI, neurite orientation dispersion and density imaging; QSDR, Q-space diffeomorphic reconstruction; ROI, region of interest; VBA, voxel-based analysis; TBSS, Tract-Based Spatial Statistics; CSF, cerebrospinal fluid; ASL, arterial spin labeling; CBF, cerebral blood flow; GM, gray matter; AP, atypical parkinsonism; MK, mean kurtosis; RK, radial kurtosis; AK, axial kurtosis; UPDRS-III, Unified Parkinson's Disease Rating Scale; ODF, orientation distribution function; HARDI, high angular resolution diffusion imaging; DSI, diffusion spectrum imaging; SDF, spin distribution function; GQI, generalized Q-sampling imaging; QA, quantitative anisotropy; PIGD, postural instability and gait difficulty; NBS, network-based statistics; LLS, linear least squares; WLLS, weighted linear least squares; RESTORE, robust estimation of tensors involving the outlier rejection; TORTOISE, tolerably obsessive registration and tensor optimization indolent software ensemble; AFNI, Analysis of Functional NeuroImages; Tracula, TRActs Constrained by UnderLying Anatomy; BCT, Brain Connectivity Toolbox.
References
1. Marras C, Beck JC, Bower JH, Roberts E, Ritz B, Ross GW, et al. Prevalence of Parkinson's disease across North America. NPJ Parkinsons Dis. (2018) 4:21. doi: 10.1038/s41531-018-0058-0
2. Parashos SA, Maraganore DM, O'Brien PC, Rocca WA. Medical services utilization and prognosis in Parkinson disease: a population-based study. Mayo Clin Proc. (2002) 77:918–25. doi: 10.4065/77.9.918
3. Suchowersky O, Reich S, Perlmutter J, Zesiewicz T, Gronseth G, Weiner WJ, et al. Practice parameter: diagnosis and prognosis of new onset Parkinson disease (an evidence-based review): report of the quality standards subcommittee of the American academy of neurology. Neurology. (2006) 66:968–75. doi: 10.1212/01.wnl.0000215437.80053.d0
4. Braak H, Del Tredici K, Rub U, de Vos RA, Jansen Steur EN, Braak E. Staging of brain pathology related to sporadic Parkinson's disease. Neurobiol Aging. (2003) 24:197–211. doi: 10.1016/S0197-4580(02)00065-9
5. Seeley WW, Crawford RK, Zhou J, Miller BL, Greicius MD. Neurodegenerative diseases target large-scale human brain networks. Neuron. (2009) 62:42–52. doi: 10.1016/j.neuron.2009.03.024
6. Forno LS. Neuropathology of Parkinson's disease. J Neuropathol Exp Neurol. (1996) 55:259–72. doi: 10.1097/00005072-199603000-00001
7. Kordower JH, Olanow CW, Dodiya HB, Chu Y, Beach TG, Adler CH, et al. Disease duration and the integrity of the nigrostriatal system in Parkinson's disease. Brain. (2013) 136(Pt 8):2419–31. doi: 10.1093/brain/awt192
8. Le W, Dong J, Li S, Korczyn AD. Can biomarkers help the early diagnosis of Parkinson's disease? Neurosci Bull. (2017) 33:535–42. doi: 10.1007/s12264-017-0174-6
9. Ashburner J, Friston KJ. Voxel-based morphometry–the methods. Neuroimage. (2000) 11(6 Pt 1):805–21. doi: 10.1006/nimg.2000.0582
10. Shao N, Yang J, Shang H. Voxelwise meta-analysis of gray matter anomalies in Parkinson variant of multiple system atrophy and Parkinson's disease using anatomic likelihood estimation. Neurosci Lett. (2015) 587:79–86. doi: 10.1016/j.neulet.2014.12.007
11. Vriend C, Boedhoe PS, Rutten S, Berendse HW, van der Werf YD, van den Heuvel OA. A smaller amygdala is associated with anxiety in Parkinson's disease: a combined freeSurfer-VBM study. J Neurol Neurosurg Psychiatry. (2016) 87:493–500. doi: 10.1136/jnnp-2015-310383
12. Buhmann C, Glauche V, Sturenburg HJ, Oechsner M, Weiller C, Buchel C. Pharmacologically modulated fMRI–cortical responsiveness to levodopa in drug-naive hemiparkinsonian patients. Brain. (2003) 126(Pt 2):451–61. doi: 10.1093/brain/awg033
13. Mohl B, Berman BD, Shelton E, Tanabe J. Levodopa response differs in Parkinson's motor subtypes: a task-based effective connectivity study. J Comp Neurol. (2017) 525:2192–201. doi: 10.1002/cne.24197
14. Spraker MB, Prodoehl J, Corcos DM, Comella CL, Vaillancourt DE. Basal ganglia hypoactivity during grip force in drug naive Parkinson's disease. Hum Brain Mapp. (2010) 31:1928–41. doi: 10.1002/hbm.20987
15. Biswal B, Yetkin FZ, Haughton VM, Hyde JS. Functional connectivity in the motor cortex of resting human brain using echo-planar MRI. Magn Reson Med. (1995) 34:537–41. doi: 10.1002/mrm.1910340409
16. Helmich RC, Derikx LC, Bakker M, Scheeringa R, Bloem BR, Toni I. Spatial remapping of cortico-striatal connectivity in Parkinson's disease. Cereb Cortex. (2010) 20:1175–86. doi: 10.1093/cercor/bhp178
17. Le Bihan D, Mangin JF, Poupon C, Clark CA, Pappata S, Molko N, et al. Diffusion tensor imaging: concepts and applications. J Magn Reson Imaging. (2001) 13:534–46. doi: 10.1002/jmri.1076
18. Basser PJ, Mattiello J, LeBihan D. MR diffusion tensor spectroscopy and imaging. Biophys J. (1994) 66:259–67. doi: 10.1016/S0006-3495(94)80775-1
19. Mori S, Zhang J. Principles of diffusion tensor imaging and its applications to basic neuroscience research. Neuron. (2006) 51:527–39. doi: 10.1016/j.neuron.2006.08.012
20. Hagmann P, Jonasson L, Maeder P, Thiran JP, Wedeen VJ, Meuli R. Understanding diffusion MR imaging techniques: from scalar diffusion-weighted imaging to diffusion tensor imaging and beyond. Radiographics. (2006) 26(Suppl. 1):S205–23. doi: 10.1148/rg.26si065510
21. Jellison BJ, Field AS, Medow J, Lazar M, Salamat MS, Alexander AL. Diffusion tensor imaging of cerebral white matter: a pictorial review of physics, fiber tract anatomy, and tumor imaging patterns. AJNR Am J Neuroradiol. (2004) 25:356–69.
22. Le Bihan D, Iima M. Diffusion magnetic resonance imaging: what water tells us about biological tissues. PLoS Biol. (2015) 13:e1002203. doi: 10.1371/journal.pbio.1002203
23. Soares JM, Marques P, Alves V, Sousa N. A hitchhiker's guide to diffusion tensor imaging. Front Neurosci. (2013) 7:31. doi: 10.3389/fnins.2013.00031
24. Atkinson-Clement C, Pinto S, Eusebio A, Coulon O. Diffusion tensor imaging in Parkinson's disease: review and meta-analysis. Neuroimage Clin. (2017) 16:98–110. doi: 10.1016/j.nicl.2017.07.011
25. Liberati A, Altman DG, Tetzlaff J, Mulrow C, Gotzsche PC, Ioannidis JP, et al. The PRISMA statement for reporting systematic reviews and meta-analyses of studies that evaluate health care interventions: explanation and elaboration. J Clin Epidemiol. (2009) 62:e1–34. doi: 10.1016/j.jclinepi.2009.06.006
26. Vriend C, van den Heuvel OA, Berendse HW, van der Werf YD, Douw L. Global and subnetwork changes of the structural connectome in de novo Parkinson's disease. Neuroscience. (2018) 386:295–308. doi: 10.1016/j.neuroscience.2018.06.050
27. Arrigo A, Calamuneri A, Milardi D, Mormina E, Rania L, Postorino E, et al. Visual system involvement in patients with newly diagnosed Parkinson disease. Radiology. (2017) 285:885–95. doi: 10.1148/radiol.2017161732
28. Tinaz S, Lauro PM, Ghosh P, Lungu C, Horovitz SG. Changes in functional organization and white matter integrity in the connectome in Parkinson's disease. Neuroimage Clin. (2017) 13:395–404. doi: 10.1016/j.nicl.2016.12.019
29. Pena-Nogales O, Ellmore TM, de Luis-Garcia R, Suescun J, Schiess MC, Giancardo L. Longitudinal connectomes as a candidate progression marker for prodromal Parkinson's disease. Front Neurosci. (2018) 12:967. doi: 10.3389/fnins.2018.00967
30. Nigro S, Riccelli R, Passamonti L, Arabia G, Morelli M, Nistico R, et al. Characterizing structural neural networks in de novo Parkinson disease patients using diffusion tensor imaging. Hum Brain Mapp. (2016) 37:4500–10. doi: 10.1002/hbm.23324
31. Tessa C, Giannelli M, Della Nave R, Lucetti C, Berti C, Ginestroni A, et al. A whole-brain analysis in de novo Parkinson disease. AJNR Am J Neuroradiol. (2008) 29:674–80. doi: 10.3174/ajnr.A0900
32. Knossalla F, Kohl Z, Winkler J, Schwab S, Schenk T, Engelhorn T, et al. High-resolution diffusion tensor-imaging indicates asymmetric microstructural disorganization within substantia nigra in early Parkinson's disease. J Clin Neurosci. (2018) 50:199–202. doi: 10.1016/j.jocn.2018.01.023
33. Joshi N, Rolheiser TM, Fisk JD, McKelvey JR, Schoffer K, Phillips G, et al. Lateralized microstructural changes in early-stage Parkinson's disease in anterior olfactory structures, but not in substantia nigra. J Neurol. (2017) 264:1497–505. doi: 10.1007/s00415-017-8555-3
34. Wang J, Yang QX, Sun X, Vesek J, Mosher Z, Vasavada M, et al. MRI evaluation of asymmetry of nigrostriatal damage in the early stage of early-onset Parkinson's disease. Parkinsonism Relat Disord. (2015) 21:590–6. doi: 10.1016/j.parkreldis.2015.03.012
35. Aquino D, Contarino V, Albanese A, Minati L, Farina L, Grisoli M, et al. Substantia nigra in Parkinson's disease: a multimodal MRI comparison between early and advanced stages of the disease. Neurol Sci. (2014) 35:753–8. doi: 10.1007/s10072-013-1595-2
36. Vaillancourt DE, Spraker MB, Prodoehl J, Abraham I, Corcos DM, Zhou XJ, et al. High-resolution diffusion tensor imaging in the substantia nigra of de novo Parkinson disease. Neurology. (2009) 72:1378–84. doi: 10.1212/01.wnl.0000340982.01727.6e
37. Gattellaro G, Minati L, Grisoli M, Mariani C, Carella F, Osio M, et al. White matter involvement in idiopathic Parkinson disease: a diffusion tensor imaging study. AJNR Am J Neuroradiol. (2009) 30:1222–6. doi: 10.3174/ajnr.A1556
38. Du G, Lewis MM, Sen S, Wang J, Shaffer ML, Styner M, et al. Imaging nigral pathology and clinical progression in Parkinson's disease. Mov Disord. (2012) 27:1636–43. doi: 10.1002/mds.25182
39. Loane C, Politis M, Kefalopoulou Z, Valle-Guzman N, Paul G, Widner H, et al. Aberrant nigral diffusion in Parkinson's disease: a longitudinal diffusion tensor imaging study. Mov Disord. (2016) 31:1020–6. doi: 10.1002/mds.26606
40. Schuff N, Wu IW, Buckley S, Foster ED, Coffey CS, Gitelman DR, et al. Diffusion imaging of nigral alterations in early Parkinson's disease with dopaminergic deficits. Mov Disord. (2015) 30:1885–92. doi: 10.1002/mds.26325
41. Pelizzari L, Lagana MM, Di Tella S, Rossetto F, Bergsland N, Nemni R, et al. Combined assessment of diffusion parameters and cerebral blood flow within basal ganglia in early Parkinson's disease. Front Aging Neurosci. (2019) 11:134. doi: 10.3389/fnagi.2019.00134
42. Guan J, Ma X, Geng Y, Qi D, Shen Y, Shen Z, et al. Diffusion kurtosis imaging for detection of early brain changes in Parkinson's disease. Front Neurol. (2019) 10:1285. doi: 10.3389/fneur.2019.01285
43. Liu L, Chen Y, Fang Y, He Q, Yang Y, Du D, et al. DTI and ESWAN sequences are effective for the early diagnosis of Parkinson's disease. Int J Clin Exp Med. (2016) 9:19815–820. Available online at: https://www.ijcem.com/ISSN:1940-5901/IJCEM0030923
44. Mangia S, Svatkova A, Mascali D, Nissi MJ, Burton PC, Bednarik P, et al. Multi-modal brain MRI in subjects with PD and iRBD. Front Neurosci. (2017) 11:709. doi: 10.3389/fnins.2017.00709
45. Klein JC, Rolinski M, Griffanti L, Szewczyk-Krolikowski K, Baig F, Ruffmann C, et al. Cortical structural involvement and cognitive dysfunction in early Parkinson's disease. NMR Biomed. (2018) 31:e3900. doi: 10.1002/nbm.3900
46. Planetta PJ, Schulze ET, Geary EK, Corcos DM, Goldman JG, Little DM, et al. Thalamic projection fiber integrity in de novo Parkinson disease. AJNR Am J Neuroradiol. (2013) 34:74–9. doi: 10.3174/ajnr.A3178
47. Wei X, Yan R, Chen Z, Weng R, Liu X, Gao H, et al. Combined diffusion tensor imaging and arterial spin labeling as markers of early Parkinson's disease. Sci Rep. (2016) 6:33762. doi: 10.1038/srep33762
48. Li XR, Ren YD, Cao B, Huang XL. Analysis of white matter characteristics with tract-based spatial statistics according to diffusion tensor imaging in early Parkinson's disease. Neurosci Lett. (2018) 675:127–32. doi: 10.1016/j.neulet.2017.11.064
49. Rolheiser TM, Fulton HG, Good KP, Fisk JD, McKelvey JR, Scherfler C, et al. Diffusion tensor imaging and olfactory identification testing in early-stage Parkinson's disease. J Neurol. (2011) 258:1254–60. doi: 10.1007/s00415-011-5915-2
50. Ibarretxe-Bilbao N, Junque C, Marti MJ, Valldeoriola F, Vendrell P, Bargallo N, et al. Olfactory impairment in Parkinson's disease and white matter abnormalities in central olfactory areas: a voxel-based diffusion tensor imaging study. Mov Disord. (2010) 25:1888–94. doi: 10.1002/mds.23208
51. Minett T, Su L, Mak E, Williams G, Firbank M, Lawson RA, et al. Longitudinal diffusion tensor imaging changes in early Parkinson's disease: ICICLE-PD study. J Neurol. (2018) 265:1528–39. doi: 10.1007/s00415-018-8873-0
52. Duncan GW, Firbank MJ, Yarnall AJ, Khoo TK, Brooks DJ, Barker RA, et al. Gray and white matter imaging: A biomarker for cognitive impairment in early Parkinson's disease? Mov Disord. (2016) 31:103–10. doi: 10.1002/mds.26312
53. Lacey C, Ohlhauser L, Gawryluk JR. Microstructural white matter characteristics in Parkinson's disease with depression: a diffusion tensor imaging replication study. Front Neurol. (2019) 10:884. doi: 10.3389/fneur.2019.00884
54. Pozorski V, Oh JM, Adluru N, Merluzzi AP, Theisen F, Okonkwo O, et al. Longitudinal white matter microstructural change in Parkinson's disease. Hum Brain Mapp. (2018) 39:4150–61. doi: 10.1002/hbm.24239
55. Rektor I, Svatkova A, Vojtisek L, Zikmundova I, Vanicek J, Kiraly A, et al. White matter alterations in Parkinson's disease with normal cognition precede grey matter atrophy. PLoS ONE. (2018) 13:e0187939. doi: 10.1371/journal.pone.0187939
56. Pelizzari L, Di Tella S, Lagana MM, Bergsland N, Rossetto F, Nemni R, et al. White matter alterations in early Parkinson's disease: role of motor symptom lateralization. Neurol Sci. (2020) 41:357–64. doi: 10.1007/s10072-019-04084-y
57. Chen NK, Chou YH, Sundman M, Hickey P, Kasoff WS, Bernstein A, et al. Alteration of diffusion-tensor magnetic resonance imaging measures in brain regions involved in early stages of Parkinson's disease. Brain Connect. (2018) 8:343–49. doi: 10.1089/brain.2017.0558
58. Mishra VR, Sreenivasan KR, Zhuang X, Yang Z, Cordes D, Walsh RR. Influence of analytic techniques on comparing DTI-derived measurements in early stage Parkinson's disease. Heliyon. (2019) 5:e01481. doi: 10.1016/j.heliyon.2019.e01481
59. Gou L, Zhang W, Li C, Shi X, Zhou Z, Zhong W, et al. Structural brain network alteration and its correlation with structural impairments in patients with depression in de novo and drug-naive Parkinson's disease. Front Neurol. (2018) 9:608. doi: 10.3389/fneur.2018.00608
60. Meijer FJ, van Rumund A, Tuladhar AM, Aerts MB, Titulaer I, Esselink RA, et al. Conventional 3T brain MRI and diffusion tensor imaging in the diagnostic workup of early stage parkinsonism. Neuroradiology. (2015) 57:655–69. doi: 10.1007/s00234-015-1515-7
61. Guimaraes RP, Campos BM, de Rezende TJ, Piovesana L, Azevedo PC, Amato-Filho AC, et al. Is diffusion tensor imaging a good biomarker for early Parkinson's disease? Front Neurol. (2018) 9:626. doi: 10.3389/fneur.2018.00626
62. Prange S, Metereau E, Maillet A, Lhommee E, Klinger H, Pelissier P, et al. Early limbic microstructural alterations in apathy and depression in de novo Parkinson's disease. Mov Disord. (2019) 34:1644–54. doi: 10.1002/mds.27793
63. Ford AH, Duncan GW, Firbank MJ, Yarnall AJ, Khoo TK, Burn DJ, et al. Rapid eye movement sleep behavior disorder in Parkinson's disease: magnetic resonance imaging study. Mov Disord. (2013) 28:832–6. doi: 10.1002/mds.25367
64. Zhang Y, Wu IW, Buckley S, Coffey CS, Foster E, Mendick S, et al. Diffusion tensor imaging of the nigrostriatal fibers in Parkinson's disease. Mov Disord. (2015) 30:1229–36. doi: 10.1002/mds.26251
65. Lorio S, Sambataro F, Bertolino A, Draganski B, Dukart J. The combination of DAT-SPECT, structural and diffusion MRI predicts clinical progression in Parkinson's disease. Front Aging Neurosci. (2019) 11:57. doi: 10.3389/fnagi.2019.00057
66. Taylor KI, Sambataro F, Boess F, Bertolino A, Dukart J. Progressive decline in gray and white matter integrity in de novo Parkinson's disease: an analysis of longitudinal Parkinson progression markers initiative diffusion tensor imaging data. Front Aging Neurosci. (2018) 10:318. doi: 10.3389/fnagi.2018.00318
67. Planetta PJ, Ofori E, Pasternak O, Burciu RG, Shukla P, DeSimone JC, et al. Free-water imaging in Parkinson's disease and atypical parkinsonism. Brain. (2016) 139(Pt 2):495–508. doi: 10.1093/brain/awv361
68. Rahmani F, Aarabi MH. Does apolipoprotein A1 predict microstructural changes in subgenual cingulum in early Parkinson? J Neurol. (2017) 264:684–93. doi: 10.1007/s00415-017-8403-5
69. Ghazi Sherbaf F, Rahmani F, Jooyandeh SM, Aarabi MH. Microstructural changes in patients with Parkinson disease and REM sleep behavior disorder: depressive symptoms versus non-depressed. Acta Neurol Belg. (2018) 118:415–21. doi: 10.1007/s13760-018-0896-x
70. Ansari M, Adib Moradi S, Ghazi Sherbaf F, Hedayatnia A, Aarabi MH. Comparison of structural connectivity in Parkinson's disease with depressive symptoms versus non-depressed: a diffusion MRI connectometry study. Int Psychogeriatr. (2019) 31:5–12. doi: 10.1017/S1041610218000170
71. Ansari M, Rahmani F, Dolatshahi M, Pooyan A, Aarabi MH. Brain pathway differences between Parkinson's disease patients with and without REM sleep behavior disorder. Sleep Breath. (2017) 21:155–61. doi: 10.1007/s11325-016-1435-8
72. Ghazi Sherbaf F, Rostam Abadi Y, Mojtahed Zadeh M, Ashraf-Ganjouei A, Sanjari Moghaddam H, Aarabi MH. Microstructural changes in patients with Parkinson's disease comorbid with REM sleep behaviour disorder and depressive symptoms. Front Neurol. (2018) 9:441. doi: 10.3389/fneur.2018.00441
73. Wen MC, Heng HSE, Hsu JL, Xu Z, Liew GM, Au WL, et al. Structural connectome alterations in prodromal and de novo Parkinson's disease patients. Parkinsonism Relat Disord. (2017) 45:21–7. doi: 10.1016/j.parkreldis.2017.09.019
74. Haghshomar M, Rahmani F, Hadi Aarabi M, Shahjouei S, Sobhani S, Rahmani M. White matter changes correlates of peripheral neuroinflammation in patients with Parkinson's disease. Neuroscience. (2019) 403:70–8. doi: 10.1016/j.neuroscience.2017.10.050
75. Ashraf-Ganjouei A, Majd A, Javinani A, Aarabi MH. Autonomic dysfunction and white matter microstructural changes in drug-naive patients with Parkinson's disease. PeerJ. (2018) 6:e5539. doi: 10.7717/peerj.5539
76. Sanjari Moghaddam H, Dolatshahi M, Salardini E, Aarabi MH. Association of olfaction dysfunction with brain microstructure in prodromal Parkinson disease. Neurol Sci. (2019) 40:283–91. doi: 10.1007/s10072-018-3629-2
77. Sobhani S, Rahmani F, Aarabi MH, Sadr AV. Exploring white matter microstructure and olfaction dysfunction in early parkinson disease: diffusion MRI reveals new insight. Brain Imaging Behav. (2019) 13:210–9. doi: 10.1007/s11682-017-9781-0
78. Ghazi Sherbaf F, Mohajer B, Ashraf-Ganjouei A, Mojtahed Zadeh M, Javinani A, Sanjari Moghaddam H, et al. Serum insulin-like growth factor-1 in Parkinson's disease; study of cerebrospinal fluid biomarkers and white matter microstructure. Front Endocrinol (Lausanne). (2018) 9:608. doi: 10.3389/fendo.2018.00608
79. Wen MC, Heng HS, Ng SY, Tan LC, Chan LL, Tan EK. White matter microstructural characteristics in newly diagnosed Parkinson's disease: an unbiased whole-brain study. Sci Rep. (2016) 6:35601. doi: 10.1038/srep35601
80. Wen MC, Heng HSE, Lu Z, Xu Z, Chan LL, Tan EK, et al. Differential white matter regional alterations in motor subtypes of early drug-naive Parkinson's disease patients. Neurorehabil Neural Repair. (2018) 32:129–41. doi: 10.1177/1545968317753075
81. Wen MC, Xu Z, Lu Z, Chan LL, Tan EK, Tan LCS. Microstructural network alterations of olfactory dysfunction in newly diagnosed Parkinson's disease. Sci Rep. (2017) 7:12559. doi: 10.1038/s41598-017-12947-7
82. Zhang G, Zhang C, Wang Y, Wang L, Zhang Y, Xie H, et al. Is hyperhomocysteinemia associated with the structural changes of the substantia nigra in Parkinson's disease? A two-year follow-up study. Parkinsonism Relat Disord. (2019) 60:46–50. doi: 10.1016/j.parkreldis.2018.10.008
83. Zhang G, Zhang Y, Zhang C, Wang Y, Ma G, Nie K, et al. Diffusion kurtosis imaging of substantia nigra is a sensitive method for early diagnosis and disease evaluation in Parkinson's disease. Parkinsons Dis. (2015) 2015:207624. doi: 10.1155/2015/207624
84. Zhang G, Zhang C, Zhang Y, Wang Y, Nie K, Zhang B, et al. The effects of striatal silent lacunar infarction on the substantia nigra and movement disorders in Parkinson's disease: a follow-up study. Parkinsonism Relat Disord. (2017) 43:33–7. doi: 10.1016/j.parkreldis.2017.06.020
85. Zhang G, Zhang Y, Zhang C, Wang Y, Ma G, Nie K, et al. Striatal silent lacunar infarction is associated with changes to the substantia nigra in patients with early-stage Parkinson's disease: a diffusion kurtosis imaging study. J Clin Neurosci. (2016) 33:138–141. doi: 10.1016/j.jocn.2016.03.032
86. Surova Y, Lampinen B, Nilsson M, Latt J, Hall S, Widner H, et al. Alterations of diffusion kurtosis and neurite density measures in deep grey matter and white matter in Parkinson's disease. PLoS ONE. (2016) 11:e0157755. doi: 10.1371/journal.pone.0157755
87. Andica C, Kamagata K, Hatano T, Okuzumi A, Saito A, Nakazawa M, et al. Neurite orientation dispersion and density imaging of the nigrostriatal pathway in Parkinson's disease: retrograde degeneration observed by tract-profile analysis. Parkinsonism Relat Disord. (2018) 51:55–60. doi: 10.1016/j.parkreldis.2018.02.046
88. Basser PJ, Pajevic S, Pierpaoli C, Duda J, Aldroubi A. In vivo fiber tractography using DT-MRI data. Magn Reson Med. (2000) 44:625–32. doi: 10.1002/1522-2594(200010)44:4<625::aid-mrm17>3.0.co;2-o
89. Mori S, Crain BJ, Chacko VP, van Zijl PC. Three-dimensional tracking of axonal projections in the brain by magnetic resonance imaging. Ann Neurol. (1999) 45:265–9. doi: 10.1002/1531-8249(199902)45:2<265::aid-ana21>3.0.co;2-3
90. Concha L. A macroscopic view of microstructure: using diffusion-weighted images to infer damage, repair, and plasticity of white matter. Neuroscience. (2014) 276:14–28. doi: 10.1016/j.neuroscience.2013.09.004
91. Song SK, Sun SW, Ramsbottom MJ, Chang C, Russell J, Cross AH. Dysmyelination revealed through MRI as increased radial (but unchanged axial) diffusion of water. Neuroimage. (2002) 17:1429–36. doi: 10.1006/nimg.2002.1267
92. Jones DK, Cercignani M. Twenty-five pitfalls in the analysis of diffusion MRI data. NMR Biomed. (2010) 23:803–20. doi: 10.1002/nbm.1543
93. Vos SB, Jones DK, Jeurissen B, Viergever MA, Leemans A. The influence of complex white matter architecture on the mean diffusivity in diffusion tensor MRI of the human brain. Neuroimage. (2012) 59:2208–16. doi: 10.1016/j.neuroimage.2011.09.086
94. Beaulieu C. What makes diffusion anisotropic in the nervous system? In: Diffusion MRI: Theory, Methods, Applications, ed D. K. Jones. New York, NY: Oxford University Press (2010). p. 92–109. doi: 10.1093/med/9780195369779.003.0007
95. Takahashi M, Hackney DB, Zhang G, Wehrli SL, Wright AC, O'Brien WT, et al. Magnetic resonance microimaging of intraaxonal water diffusion in live excised lamprey spinal cord. Proc Natl Acad Sci USA. (2002) 99:16192–6. doi: 10.1073/pnas.252249999
96. Alexander AL, Hasan K, Kindlmann G, Parker DL, Tsuruda JS. A geometric analysis of diffusion tensor measurements of the human brain. Magn Reson Med. (2000) 44:283–91. doi: 10.1002/1522-2594(200008)44:2<283::aid-mrm16>3.0.co;2-v
97. Armitage PA, Bastin ME. Selecting an appropriate anisotropy index for displaying diffusion tensor imaging data with improved contrast and sensitivity. Magn Reson Med. (2000) 44:117–21. doi: 10.1002/1522-2594(200007)44:1<117::aid-mrm17>3.0.co;2-d
98. Bammer R, Acar B, Moseley ME. In vivo MR tractography using diffusion imaging. Eur J Radiol. (2003) 45:223–34. doi: 10.1016/S0720-048X(02)00311-X
99. Jones DK. Diffusion MRI: Theory, Methods, Applications. (2010). New York, NY: Oxford University Press.
100. Smith SM, Jenkinson M, Johansen-Berg H, Rueckert D, Nichols TE, Mackay CE, et al. Tract-based spatial statistics: voxelwise analysis of multi-subject diffusion data. Neuroimage. (2006) 31:1487–505. doi: 10.1016/j.neuroimage.2006.02.024
101. Zalesky A. Moderating registration misalignment in voxelwise comparisons of DTI data: a performance evaluation of skeleton projection. Magn Reson Imaging. (2011). 29:111–25. doi: 10.1016/j.mri.2010.06.027
102. Schwarz CG, Reid RI, Gunter JL, Senjem ML, Przybelski SA, Zuk SM, et al. Improved DTI registration allows voxel-based analysis that outperforms tract-based spatial statistics. Neuroimage. (2014) 94:65–78. doi: 10.1016/j.neuroimage.2014.03.026
103. Yeh FC, Badre D, Verstynen T. Connectometry: a statistical approach harnessing the analytical potential of the local connectome. Neuroimage. (2016) 125:162–71. doi: 10.1016/j.neuroimage.2015.10.053
104. Doty RL. Olfactory dysfunction in Parkinson disease. Nat Rev Neurol. (2012). 8:329–39. doi: 10.1038/nrneurol.2012.80
105. Mishra VR, Sreenivasan KR, Yang Z, Zhuang X, Cordes D, Mari Z, et al. Unique white matter structural connectivity in early-stage drug-naive Parkinson disease. Neurology. (2020) 94:e774–84. doi: 10.1212/WNL.0000000000008867
106. Skorpil M, Soderlund V, Sundin A, Svenningsson P. MRI diffusion in Parkinson's disease: using the technique's inherent directional information to study the olfactory bulb and substantia nigra. J Parkinsons Dis. (2012) 2:171–80. doi: 10.3233/JPD-2012-12091
107. Kamagata K, Zalesky A, Hatano T, Ueda R, Di Biase MA, Okuzumi A, et al. Gray matter abnormalities in idiopathic Parkinson's disease: evaluation by diffusional kurtosis imaging and neurite orientation dispersion and density imaging. Hum Brain Mapp. (2017) 38:3704–22. doi: 10.1002/hbm.23628
108. Fuller PM, Saper CB, Lu J. The pontine REM switch: past and present. J Physiol. (2007) 584(Pt 3):735–41. doi: 10.1113/jphysiol.2007.140160
109. Wen MC, Chan LL, Tan LC, Tan EK. Depression, anxiety, and apathy in Parkinson's disease: insights from neuroimaging studies. Eur J Neurol. (2016) 23:1001–19. doi: 10.1111/ene.13002
110. Pierpaoli C, Jezzard P, Basser PJ, Barnett A, Di Chiro G. Diffusion tensor MR imaging of the human brain. Radiology. (1996) 201:637–48. doi: 10.1148/radiology.201.3.8939209
111. Latour LL, Warach S. Cerebral spinal fluid contamination of the measurement of the apparent diffusion coefficient of water in acute stroke. Magn Reson Med. (2002) 48:478–86. doi: 10.1002/mrm.10238
112. Chou MC, Lin YR, Huang TY, Wang CY, Chung HW, Juan CJ, et al. FLAIR diffusion-tensor MR tractography: comparison of fiber tracking with conventional imaging. AJNR Am J Neuroradiol. (2005) 26:591–7.
113. Pasternak O, Sochen N, Gur Y, Intrator N, Assaf Y. Free water elimination and mapping from diffusion MRI. Magn Reson Med. (2009) 62:717–30. doi: 10.1002/mrm.22055
114. Hoy AR, Koay CG, Kecskemeti SR, Alexander AL. Optimization of a free water elimination two-compartment model for diffusion tensor imaging. Neuroimage. (2014) 103:323–33. doi: 10.1016/j.neuroimage.2014.09.053
115. Mishra V, Guo X, Delgado MR, Huang H. Toward tract-specific fractional anisotropy (TSFA) at crossing-fiber regions with clinical diffusion MRI. Magn Reson Med. (2015) 74:1768–79. doi: 10.1002/mrm.25548
116. Jeurissen B, Leemans A, Tournier JD, Jones DK, Sijbers J. Investigating the prevalence of complex fiber configurations in white matter tissue with diffusion magnetic resonance imaging. Hum Brain Mapp. (2013) 34:2747–66. doi: 10.1002/hbm.22099
117. Jensen JH, Helpern JA, Ramani A, Lu H, Kaczynski K. Diffusional kurtosis imaging: the quantification of non-gaussian water diffusion by means of magnetic resonance imaging. Magn Reson Med. (2005) 53:1432–40. doi: 10.1002/mrm.20508
118. Poot DH, den Dekker AJ, Achten E, Verhoye M, Sijbers J. Optimal experimental design for diffusion kurtosis imaging. IEEE Trans Med Imaging. (2010) 29:819–29. doi: 10.1109/TMI.2009.2037915
119. Zhu J, Zhuo C, Qin W, Wang D, Ma X, Zhou Y, et al. Performances of diffusion kurtosis imaging and diffusion tensor imaging in detecting white matter abnormality in schizophrenia. Neuroimage Clin. (2015) 7:170–6. doi: 10.1016/j.nicl.2014.12.008
120. Zhang H, Schneider T, Wheeler-Kingshott CA, Alexander DC. NODDI: practical in vivo neurite orientation dispersion and density imaging of the human brain. Neuroimage. (2012) 61:1000–16. doi: 10.1016/j.neuroimage.2012.03.072
121. Le Bihan D. Diffusion and Perfusion Magnetic Resonance Imaging: Applications to Functional MRI. New York, NY: Raven Press (1995). doi: 10.1097/00004728-199509000-00032
122. Fukutomi H, Glasser MF, Murata K, Akasaka T, Fujimoto K, Yamamoto T, et al. Diffusion tensor model links to neurite orientation dispersion and density imaging at high b-value in cerebral cortical gray matter. Sci Rep. (2019) 9:12246. doi: 10.1038/s41598-019-48671-7
123. Tuch DS, Reese TG, Wiegell MR, Makris N, Belliveau JW, Wedeen VJ. High angular resolution diffusion imaging reveals intravoxel white matter fiber heterogeneity. Magn Reson Med. (2002) 48:577–82. doi: 10.1002/mrm.10268
124. Wiegell MR, Larsson HB, Wedeen VJ. Fiber crossing in human brain depicted with diffusion tensor MR imaging. Radiology. (2000) 217:897–903. doi: 10.1148/radiology.217.3.r00nv43897
125. Wedeen VJ, Hagmann P, Tseng WY, Reese TG, Weisskoff RM. Mapping complex tissue architecture with diffusion spectrum magnetic resonance imaging. Magn Reson Med. (2005) 54:1377–86. doi: 10.1002/mrm.20642
126. Yeh FC, Wedeen VJ, Tseng WY. Generalized q-sampling imaging. IEEE Trans Med Imaging. (2010) 29:1626–35. doi: 10.1109/TMI.2010.2045126
127. Yeh FC, Tseng WY. NTU-90: a high angular resolution brain atlas constructed by q-space diffeomorphic reconstruction. Neuroimage. (2011) 58:91–9. doi: 10.1016/j.neuroimage.2011.06.021
128. Yeh FC, Verstynen TD, Wang Y, Fernandez-Miranda JC, Tseng WY. Deterministic diffusion fiber tracking improved by quantitative anisotropy. PLoS ONE. (2013) 8:e80713. doi: 10.1371/journal.pone.0080713
129. Farrell JA, Landman BA, Jones CK, Smith SA, Prince JL, van Zijl PC, et al. Effects of signal-to-noise ratio on the accuracy and reproducibility of diffusion tensor imaging-derived fractional anisotropy, mean diffusivity, and principal eigenvector measurements at 1.5 T. J Magn Reson Imaging. (2007) 26:756–67. doi: 10.1002/jmri.21053
130. Jones DK. The effect of gradient sampling schemes on measures derived from diffusion tensor MRI: a monte carlo study. Magn Reson Med. (2004) 51:807–15. doi: 10.1002/mrm.20033
131. Bergamino M, Farmer M, Yeh HW, Paul E, Hamilton JP. Statistical differences in the white matter tracts in subjects with depression by using different skeletonized voxel-wise analysis approaches and DTI fitting procedures. Brain Res. (2017) 1669:131–40. doi: 10.1016/j.brainres.2017.06.013
132. Maximov II, Thonnessen H, Konrad K, Amort L, Neuner I, Shah NJ, et al. Statistical instability of TBSS analysis based on DTI fitting algorithm. J Neuroimaging. (2015) 25:883–91. doi: 10.1111/jon.12215
133. King MD, Houseman J, Roussel SA, van Bruggen N, Williams SR, Gadian DG. q-Space imaging of the brain. Magn Reson Med. (1994) 32:707–13. doi: 10.1002/mrm.1910320605
134. Yoshikawa K, Nakata Y, Yamada K, Nakagawa M. Early pathological changes in the parkinsonian brain demonstrated by diffusion tensor MRI. J Neurol Neurosurg Psychiatry. (2004) 75:481–4. doi: 10.1136/jnnp.2003.021873
135. Zhan W, Kang GA, Glass GA, Zhang Y, Shirley C, Millin R, et al. Regional alterations of brain microstructure in Parkinson's disease using diffusion tensor imaging. Mov Disord. (2012) 27:90–7. doi: 10.1002/mds.23917
136. Postuma RB, Aarsland D, Barone P, Burn DJ, Hawkes CH, Oertel W, et al. Identifying prodromal Parkinson's disease: pre-motor disorders in Parkinson's disease. Mov Disord. (2012) 27:617–26. doi: 10.1002/mds.24996
137. Chondrogiorgi M, Tzarouchi LC, Zikou AK, Astrakas LG, Kosta P, Argyropoulou MI, et al. Multimodal imaging evaluation of excessive daytime sleepiness in Parkinson's disease. Int J Neurosci. (2016) 126:422–8. doi: 10.3109/00207454.2015.1023437
Keywords: MRI diffusion, early-stage Parkinson disease, diffusion tensor imaging, diffusion kurtosis imaging, q-space diffeomorphic reconstruction, fractional anisotropy, substantia nigra
Citation: Bergamino M, Keeling EG, Mishra VR, Stokes AM and Walsh RR (2020) Assessing White Matter Pathology in Early-Stage Parkinson Disease Using Diffusion MRI: A Systematic Review. Front. Neurol. 11:314. doi: 10.3389/fneur.2020.00314
Received: 23 December 2019; Accepted: 31 March 2020;
Published: 14 May 2020.
Edited by:
Yu Zhang, VA Palo Alto Health Care System, United StatesReviewed by:
Guangwei Du, Penn State Milton S. Hershey Medical Center, United StatesNiklas Lenfeldt, Umeå University, Sweden
Masaaki Hori, Toho University, Japan
Maria Eugenia Caligiuri, University of Magna Graecia, Italy
Copyright © 2020 Bergamino, Keeling, Mishra, Stokes and Walsh. This is an open-access article distributed under the terms of the Creative Commons Attribution License (CC BY). The use, distribution or reproduction in other forums is permitted, provided the original author(s) and the copyright owner(s) are credited and that the original publication in this journal is cited, in accordance with accepted academic practice. No use, distribution or reproduction is permitted which does not comply with these terms.
*Correspondence: Maurizio Bergamino, bWF1cml6aW8uYmVyZ2FtaW5vJiN4MDAwNDA7YmFycm93bmV1cm8ub3Jn