 Graham Cooper1,2,3
 Carsten Finke2,4
 Claudia Chien1,3
 Alexander U. Brandt1,3,5Susanna Asseyer1,3
 Klemens Ruprecht6Judith Bellmann-Strobl1,3
 Friedemann Paul1,2,3,6*†
 Michael Scheel1,3,7†
- 1NeuroCure Clinical Research Center, Charité – Universitätsmedizin Berlin, Corporate Member of Freie Universität Berlin, Humboldt-Universität zu Berlin and Berlin Institute of Health, Berlin, Germany
- 2Einstein Center for Neurosciences, Berlin, Germany
- 3Experimental and Clinical Research Center, Max Delbrueck Center for Molecular Medicine and Charité – Universitätsmedizin Berlin, Corporate Member of Freie Universität Berlin, Humboldt-Universität zu Berlin and Berlin Institute of Health, Berlin, Germany
- 4Berlin School of Mind and Brain, Humboldt-Universität zu Berlin, Berlin, Germany
- 5Department of Neurology, University of California, Irvine, Irvine, CA, United States
- 6Department of Neurology, Charité – Universitätsmedizin Berlin, Corporate Member of Freie Universität Berlin, Humboldt-Universität zu Berlin and Berlin Institute of Health, Berlin, Germany
- 7Department of Neuroradiology, Charité – Universitätsmedizin Berlin, Corporate Member of Freie Universität Berlin, Humboldt-Universität zu Berlin and Berlin Institute of Health, Berlin, Germany
Normal appearing white matter (NAWM) damage develops early in multiple sclerosis (MS) and continues in the absence of new lesions. The ratio of T1w and T2w (T1w/T2w ratio), a measure of white matter integrity, has previously shown reduced intensity values in MS NAWM. We evaluate the validity of a standardized T1w/T2w ratio (sT1w/T2w ratio) in MS and whether this method is sensitive in detecting MS-related differences in NAWM. T1w and T2w scans were acquired at 3 Tesla in 47 patients with relapsing-remitting MS and 47 matched controls (HC). T1w/T2w and sT1w/T2w ratios were then calculated. We compared between-group variability between T1w/T2w and sT1w/T2w ratio in HC and MS and assessed for group differences. We also evaluated the relationship between the T1w/T2w and sT1w/T2w ratios and clinically relevant variables. Compared to the classic T1w/T2w ratio, the between-subject variability in sT1w/T2w ratio showed a significant reduction in MS patients (p < 0.001) and HC (p < 0.001). However, only sT1w/T2w ratio values were reduced in patients compared to HC (p < 0.001). The sT1w/T2w ratio intensity values were significantly influenced by age, T2 lesion volume and group status (MS vs. HC) (adjusted R2 = 0.30, p < 0.001). We demonstrate the validity of the sT1w/T2w ratio in MS and that it is more sensitive to MS-related differences in NAWM compared to T1w/T2w ratio. The sT1w/T2w ratio shows promise as an easily-implemented measure of NAWM in MS using readily available scans and simple post-processing methods.
Introduction
Multiple sclerosis (MS) is an inflammatory and neurodegenerative CNS disease characterized by focal lesions with demyelination, axonal loss, and reactive gliosis in white matter (WM) and gray matter (GM) (1–5). MRI plays a critical role in the diagnosis and monitoring of MS patients through detection of lesions in WM and GM (6). Although tissue damage in the WM beyond lesions is frequently found in neuropathological examinations of MS, it is not detectable in routine clinical MRI scans. This has led to the term normal-appearing WM (NAWM) for WM that appears normal on routine MRI but may contain neuropathologically detectable tissue damage. NAWM damage can be demonstrated using advanced MRI techniques such as diffusion tensor imaging (7–9) or other quantitative approaches (10). Using these approaches, it has been shown that NAWM alone can discriminate MS patients from healthy subjects (10), indicating the high prevalence and sensitivity of NAWM in MS. A clear draw-back of such techniques is the need for time-intensive additional scans and expertise in image post-processing. Glasser and Van Essen proposed that the ratio of T1w and T2w images (T1w/T2w ratio) in the GM can be used to create an estimate of cortical myelin content in the healthy population (11–13). The T1w/T2w ratio has also been applied to the whole brain and WM (14, 15). Although the sensitivity of the T1w/T2w ratio to myelin has been contested, there is growing consensus that the T1w/T2w ratio is a marker of general WM microstructure (15–17). Recently, reduced T1w/T2w ratio intensity values have been found in the cortex and NAWM of MS patients compared to HC (15, 17).
However, the T1w/T2w ratio has technical limitations. It is long established that qualitative T1w and T2w intensity values are variable and depend on numerous technical and methodological factors, such as field strength and scanner manufacturer, leading to problems in comparing these values (and quantitative parameters derived from these, such as volume) between different scanners and time-points (18–21). This may limit a reliable and valid comparison of T1w/T2w ratio intensity values across subjects. Recently, Misaki et al. showed that standardizing the T1w/T2w ratio can lead to enhanced delineation of tissue classes (22). They standardize the T1w/T2w based on the median GM intensity in the T1w and T2w images and produce intensity values in the range of−1 to 1, where WM intensity values are positive, cerebrospinal fluid (CSF) intensity values are negative and GM intensity values are between −0.01 and 0.01. This standardized T1w/T2w ratio (sT1w/T2w ratio) reduces the between-subject variability of intensity values and may overcome the described limitation of the T1w/T2w ratio therefore allow a more valid comparison of intensity values in NAWM.
The current study aimed to evaluate the validity of the standardization of the T1w/T2w ratio in MS patients. We hypothesized that (1) the sT1w/T2w ratio would significantly reduce the between subject variability in NAWM in MS patients compared to the T1w/T2w ratio, and (2) that NAWM group differences between healthy controls (HC) and MS patients would be more pronounced using the sT1w/T2w ratio. In addition, we evaluated clinically relevant covariates of sT1w/T2w.
Materials and Methods
Patients and Controls
Patient and HC data were taken from an observational study, approved by the institutional review board (EA1/163/12, EA1/189/13). HC matching patients for sex and age (+/−6 months) were identified using in-house python scripts using Python 3. Overall, 47 patients and 47 HC were included in the study (Table 1).
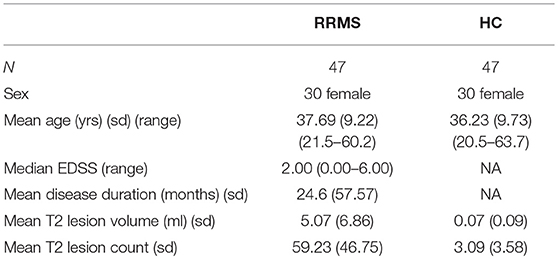
Table 1. Demographic and clinical characteristics.
All patients and HC provided written informed consent. MS patients had a diagnosis of relapsing remitting MS (RRMS) according to 2010 McDonald criteria (23). Clinical assessment was performed by experienced neurologists and included the Expanded Disability Status Scale (EDSS) (24).
MRI Acquisition
MRI acquisition was performed on a 3 Tesla MRI (Tim Trio, Siemens Medical Systems, Erlangen, Germany). The MRI protocol included a 3D MPRAGE (T1w, TR = 1,900 ms, TE = 2.55 ms, TI = 900 ms, 1 mm isotropic resolution), a 3D T2SPACE (T2w, TR = 5,000 ms, TE = 502 ms, 1 mm isotropic resolution) sequence and a 3D FLAIR (TR = 6,000 ms, TE = 388 ms, TI = 2,100 ms, 1 mm isotropic resolution).
MRI Analysis
Before calculation of the T1w/T2w and sT1w/T2w ratio, the T1w, T2w and FLAIR images were preprocessed as follows: All images were bias field corrected using non-parametric non-uniform intensity normalization (25), changed to a robust field of view and oriented to MNI space using FSL tools. The T2w and FLAIR images were then co-registered to the corrected T1w image and these three images were then registered to standard MNI space. Co-registration and registration to standard space was performed using a spline interpolation with FSL FLIRT (26, 27). Lesion segmentation was done semi-automatically on FLAIR using the lesion prediction algorithm [LPA (28)] as implemented in the Lesion Segmentation Toolbox version 2.0.15 (www.statistical-modelling.de/lst.html). Lesion masks were subsequently manually corrected using ITK-SNAP (29) (www.itksnap.org). Generation of a brain mask and tissue segmentation into GM, WM, and cerebrospinal fluid (CSF) was achieved using the Computational Anatomy Toolbox version 11.09 (30) implemented in SPM12 version 7219. Each lesion mask was subtracted from the WM and GM masks, to create a normal-appearing GM (NAGM) and NAWM mask, respectively. Median intensity values in the T1w and T2w were extracted in NAGM, NAWM, and CSF for each subject.
T1w/T2w Ratio and sT1w/T2w Ratio Calculation
The T1w/T2w ratio was calculated using the FSL stats tool (31) by dividing the processed 3D T1w image by the spatially registered 3D T2w image.
In order to calculate the sT1w/T2w ratio, a scaling factor was found by dividing the median NAGM intensity value in the T1w image by the median NAGM intensity value in the T2w image. The T2w image was then multiplied by the scaling factor to create a scaled T2w image (sT2). The sT1w/T2w ratio was then calculated using the equation from Misaki et al. (22):
Finally, median T1w/T2w and sT1w/T2w values were extracted from the NAGM, NAWM, and CSF for each subject.
Statistical Analysis
Statistical analysis was conducted in R (32). t-tests and χ2 tests were used to assess group differences in age and sex, respectively. All figures shown were created using the tidy verse and ggpubr (33, 34).
First, the between-subject variation in NAWM in T1w/T2w and sT1w/T2w was measured using the coefficient of variation (CoV) and compared using the Feltz & Miller test with the cvequality package (35). We then compared group differences of each measure (T1w, T2w, T1w/T2w, sT1w/T2w) between MS patients and HC in NAGM and NAWM intensity using t-tests. The relationship between T1w/T2w and sT1w/T2w ratio intensity values was also investigated using Pearson's correlation.
In order to evaluate relevant covariates of each measure in NAWM, we analyzed the median intensity values of T1w, T2w, T1w/T2w, and sT1w/T2w using linear models with a backwards, stepwise method: A model was built for each tissue intensity, with group, age, and sex included as predictors. This model was then reduced, removing one non-significant predictor at a time until the model contained only significant predictors. Model fit was assessed using the Akaike Information Criteria (36), where lower values signify better fit, and the best-fitting model was selected. Following the recommendations of Rippon et al. (37), sex was not included on its own, but rather as an interaction term with head size [V-scaling factor from SIENAX (38)].
Finally, we investigated the clinically relevant covariates of measures in NAWM of patients using the same method to build linear models. Age, the interaction between sex and head size, T2 lesion volume and count, EDSS, and disease duration were included as predictors in the initial model. The interaction between disease duration and age was also included. The stepwise linear regression for both analyses was conducted using the Modern Applied Statistics with S package (39).
Each linear regression was also tested for effects of extreme values by assessing Cook's difference. Cook's difference of >1 would indicate that an extreme value was overly influencing the regression model. The significance threshold for all analyses was set at p < 0.004, using Bonferroni correction for multiple comparisons.
Results
Demographics
MS patients and HC were well-matched in regard to sex (χ2 = 0.00 [1.00] p = 1.000) and age (t = −0.75, [91.74] p = 0.456), shown in Table 1.
Intensity Value Distribution
Figure 1 shows the distribution of NAGM, NAWM and CSF intensity values in each of the four image types (T1w, T2w, T1w/T2w, and sT1w/T2w). An example T1w/T2w and sT1w/T2w ratio intensity map for two patients and two healthy controls is shown in Figures 2, 3. The CoV of NAWM intensity values was significantly reduced in sT1w/T2w compared to T1w/T2w in both patients and controls (Table 2). As expected, T1w/T2w and sT1w/T2w ratio intensity values were found to significantly correlate (adjusted R2 = 0.23).
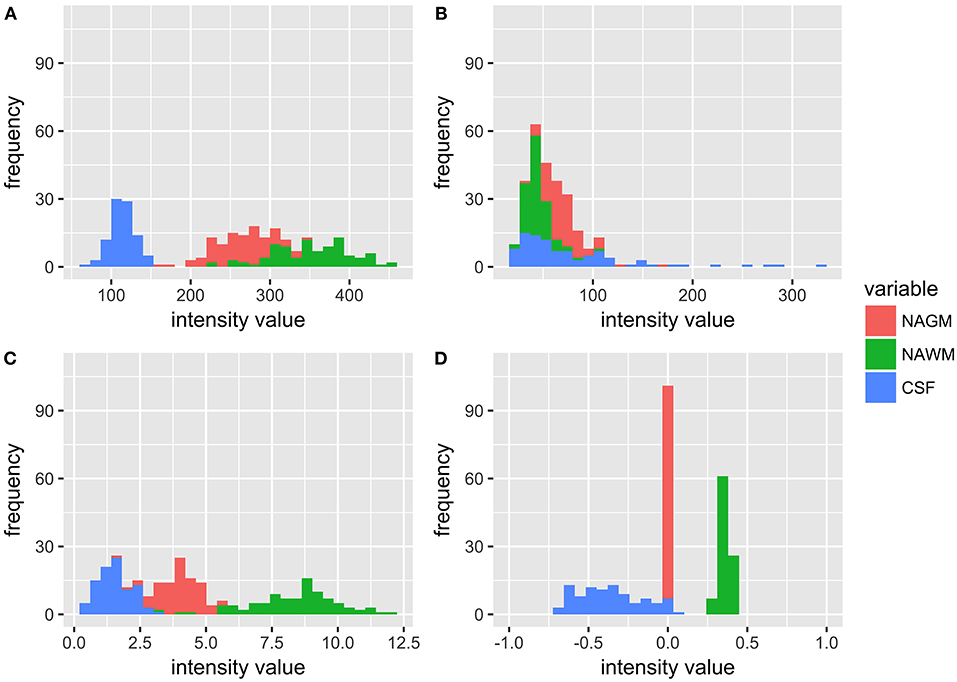
Figure 1. Histograms showing the distribution of intensity values for all patients and healthy controls in NAGM, NAWM, and CSF in (A) T1w, (B) T2w, (C) T1w/T2w, and (D) sT1w/T2w images. It can be seen that the T1w/T2w ratio reduces overlap in tissue intensity values but not to the same extent as sT1w/T2w, where all NAGM values are around 0, all NAWM values range from 0 to 1, and all CSF values range from −1 to 0.
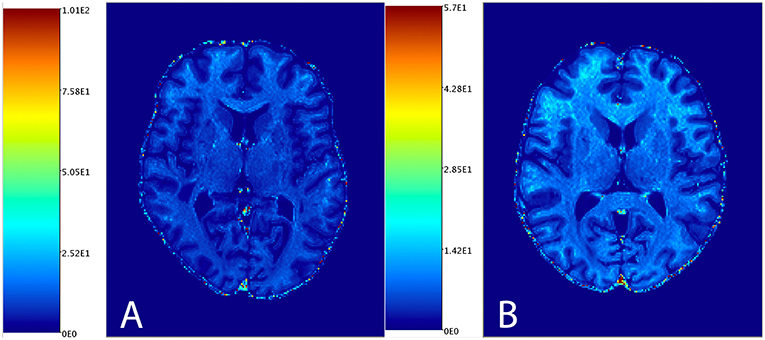
Figure 2. An example T1w/T2w image from one patient (A) and one healthy subject (B).
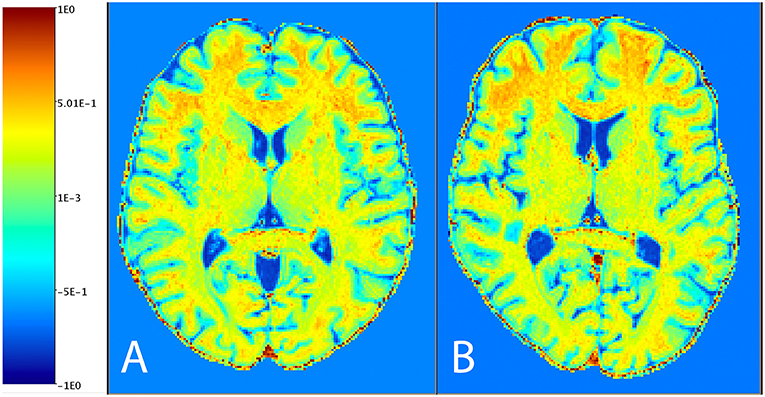
Figure 3. An example sT1w/T2w image from one patient (A) and one healthy subject (B).
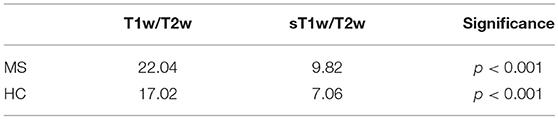
Table 2. Comparison of NAWM intensity value CoV in T1w/T2w and sT1w/T2w.
Group Analysis
Figure 4 shows the results of the group comparisons of each tissue type in each of the T1w, T2w, T1w/T2w, and sT1w/T2w images. Differences between MS patients and HC were only found in sT1w/T2w ratio intensity values of the NAWM. Table 3 shows the results of the original and (where applicable) best-fitting regression models for NAWM intensity values in T1w, T2w, T1w/T2w, and sT1w/T2w images. Variation in neither T1w, T2w nor T1w/T2w NAWM intensity values showed significant associations to age, sex, or group (MS/HC) surviving multiple comparison correction. MS diagnosis and age explained variation in sT1w/T2w ratio NAWM intensity values (adjusted R2 = 0.23). No model contained extreme values according to the Cook's distance criteria.
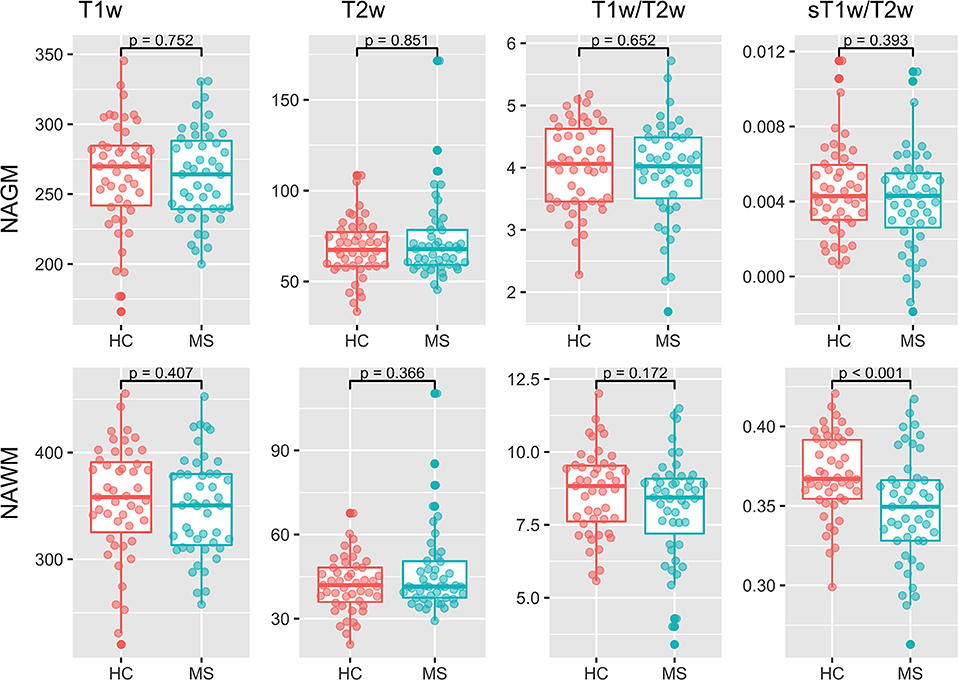
Figure 4. Group comparisons for the median NAGM and NAWM intensity values in T1w, T2w, T1w/T2w, and sT1w/T2w images. No significant differences were found between MS and HC in any image except sT1w/T2w using a t-test.
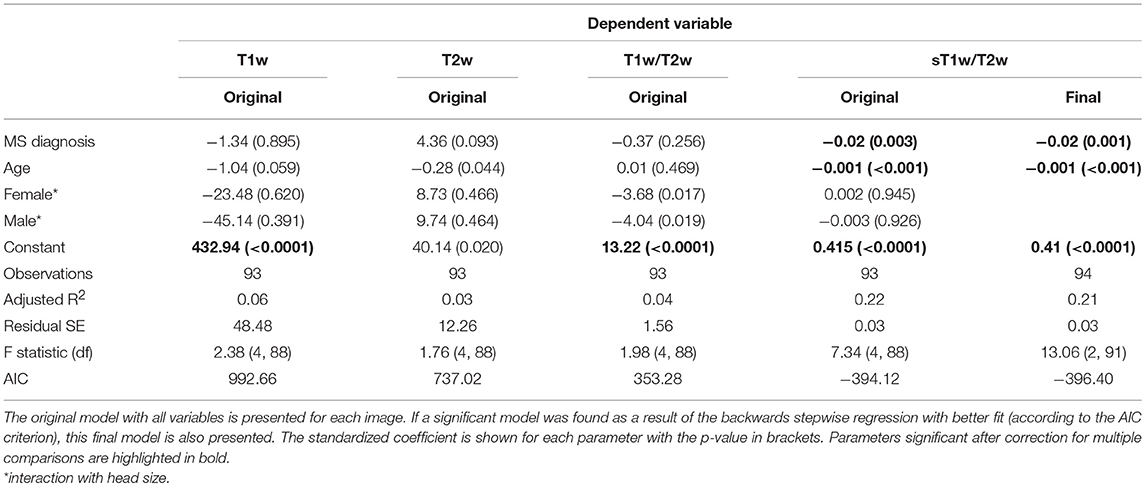
Table 3. Regression equation results for the NAWM intensity in each image (T1w, T2w, T1w/T2w ratio, and sT1w/T2w ratio).
Clinically Relevant Covariates of NAWM
Table 4 shows the results of the original and (where applicable) best-fitting regression models for NAWM intensity values in T1w, T2w, T1w/T2w, and sT1w/T2w images. Patients' sT1w/T2w ratio NAWM intensity values were explained by T2 lesion count (adjusted R2 = 0.47). No variation in the patient NAWM T1w, T2w, or T1w/T2w ratio was significantly accounted for by any parameters after correcting for multiple comparisons. No model contained extreme values according to the Cook's distance criteria.
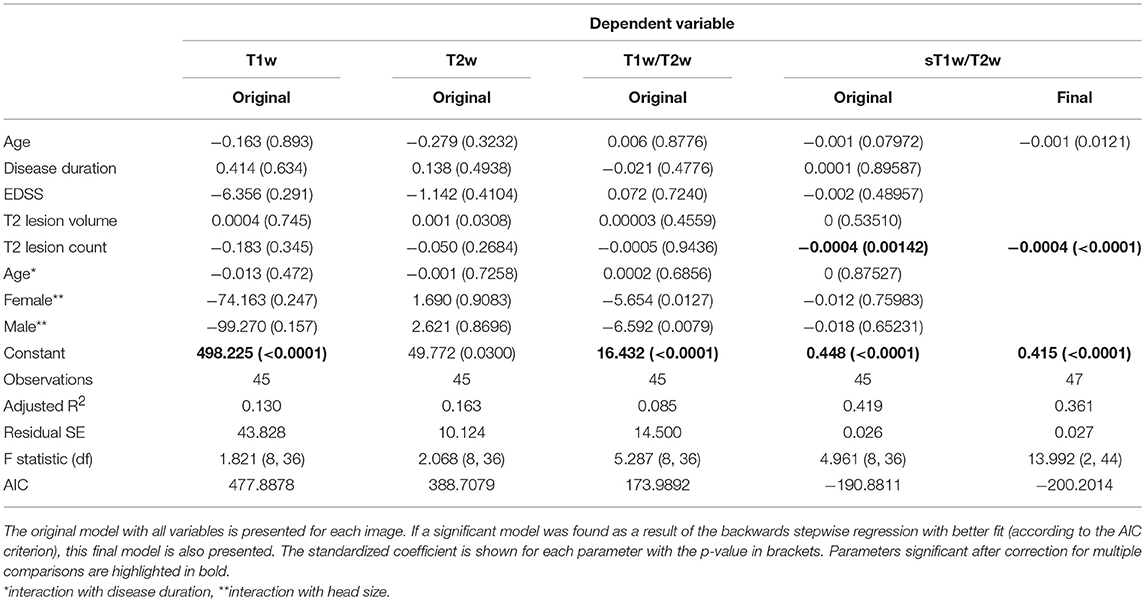
Table 4. Regression equation results for patients' NAWM intensity in each image (T1w, T2w, T1w/T2w ratio, and sT1w/T2w ratio).
Discussion
Our study evaluated the validity of the standardization of the T1w/T2w ratio in MS. We showed that (1) CoV of NAWM was reduced in the sT1w/T2w ratio compared to the T1w/T2w ratio, and (2) that NAWM group differences were more pronounced between HC and MS using the sT1w/T2w ratio. We also show the clinically relevant covariates of NAWM T1w/T2w and sT1w/T2w ratio intensity values. Group (MS vs. HC), age and T2 lesion volume explained variation in the sT1w/T2w ratio intensity values, whereas the T1w/T2w ratio was only sensitive to sex.
Benefits of the sT1w/T2w Ratio
The sT1w/T2w ratio method proposed by Misaki et al. (22) uses a scaling factor derived from median GM intensity values in T1w and T2w images to standardize the T1w/T2w ratio. This method improves the T1w/T2w ratio by creating scaled intensity values: GM intensity values are scaled to 0, WM values are scaled between 0 and 1, and CSF values are scaled between 0 and −1. We propose that this scaling results in values that can be more meaningfully compared between subjects, scanners and time-points. As discussed above, the T1w/T2 ratio produces variable intensity values that may be affected by a number of technical and methodological parameters, such as field strength and scanner manufacturer. Scaling the T1w/T2w ratio intensity values according to a non-varying value should overcome these limitations, increasing the reliability of the method and presenting a more informative bio-marker.
In the context of MS, where lesions or subtle changes within the GM could alter T1w and T2w intensity values and could influence the scaling, it is necessary to control for these factors. Therefore, median values were extracted from GM not affected by lesions, i.e., NAGM. In addition, we found that T1w and T2w NAGM values do not significantly differ between MS patients and HC. The standardization method was also shown to significantly reduce the CoV in NAWM in both HC and MS patients. As such, the sT1w/T2w ratio is a promising measure of NAWM in MS patients, which can be meaningfully compared between MS patients and HC. It is important to note that the standardization of the T1w/T2w ratio also acts as a bias field correction, reducing the heterogeneity of mean intensity values (22). To allow a fair comparison of the T1w/T2w-ratios against the T1w and T2w images, a bias field correction of the T1w and T2w images is included in our preprocessing.
Normal Appearing White Matter in MS
NAWM is a relevant and important aspect of pathology that has been demonstrated to influence cognitive impairment in MS (40, 41). Although the T1w/T2w ratio has been criticized for a lack of specificity to myelin, it should be emphasized that NAWM pathology is not limited to myelin damage. Similar to lesional WM, NAWM is subject to axonal injury, demyelination, inflammation, and gliosis (42–44). Damage in NAWM is widespread and ongoing microstructural changes were shown even in RRMS patients who showed no evidence of disease activity (no new lesions and no increased EDSS score) at follow-up (45). Myelin water loss of up to 8%, indicating reduced myelin in NAWM, has been demonstrated in a 5-years longitudinal study of RRMS patients (46). Reflecting the non-myelin-specific nature of NAWM damage, axonal injury in NAWM has also been demonstrated in RRMS patients using kurtosis imaging (47). It is currently unclear whether NAWM damage is a direct result of lesions, a general neurodegenerative process in the WM, or both (44, 46). NAWM damage has been detected from the onset of disease and prior to lesions (48), which would indicate a general degenerative process. On the other hand, NAWM damage has been shown to correlate with lesions in T2w images (49). Here, we show that NAWM damage, as measured by the sT1w/T2w ratio, is correlated with lesions in T2w images.
In relation to NAWM evaluation in MS, the major finding of the current study is that the sT1w/T2w, and not T1w/T2w ratio intensity values, are significantly reduced in the NAWM of MS patients compared to HC. Previous work has shown significant reduction in NAWM T1w/T2w ratio intensity values (15). There are a number of differences between the study by Beer et al. and the current study. One explanation for the difference in findings may be or the decision to use median values in the current study [in comparison to mean values, which are more susceptible to effects of outliers (50)]. Beer et al. had a larger sample size (244 MS patients and 78 healthy subjects), suggesting they may have had more power to find an effect. An alternative explanation for the disparity in findings relates to the discussed variability in T1w and T2w ratio intensity values. We propose that, in addition to the demonstrated enhanced sensitivity of the sT1w/T2w ratio, the standardization of intensity values also increases the reliability of comparisons between groups, overcoming the variability of raw intensity values. This should be investigated in future work using different scanners or longitudinal data.
While the finding of differences in NAWM in MS patients is not new, the majority of previous studies reporting this have used advanced MRI techniques, such as myelin water imaging approaches (e.g., multi-echo T2 mapping) and diffusion-based imaging approaches (diffusion tensor imaging (DTI) and diffusion kurtosis imaging) (51, 52). DTI measures microstructural integrity and has been used to demonstrate abnormalities in NAWM tracts in MS (45, 53). Similarly, the myelin water fraction has been shown to be decreased in MS patients compared to HC (46, 54). The myelin fraction is proposed to be the most sensitive MRI measure of myelin to date (55). A clear drawback of the myelin water fraction and DTI is that they are not commonly acquired as part of the standard clinical MRI protocol and they require expertise in image post-processing. We show similar results using the sT1w/T2w ratio, which requires only T1w and T2w scans and a very simple post-processing procedure. As such, this technique can be readily incorporated into the clinical routine and extends the amount of clinically-relevant information that can be obtained from these scans.
Limitations of the sT1w/T2w Ratio
The standardization approach normalizes intensity values using NAGM intensity values as a reference (scaling factor). This reduces NAGM values to 0, which results in poor applicability of the sT1w/T2w ratio in the NAGM. However, as discussed above, the use of NAGM as a scaling factor also ensures that sT1w/T2w ratios are comparable between patients and HC, as previous work has shown detectable cortical pathology in GM (17).
One important limitation of the T1w/T2w ratio that also limits the sT1w/T2w ratio is the non-specificity of this marker and the lack of a clear biological/pathological substrate for changes in values. T1w and T2w intensity values (and, by extension, T1w/T2w and sT1w/T2w ratio values) are affected by a range of microstructural components such as paramagnetic hemoglobin, iron accumulation and tissue calcification (56), not simply myelin and axonal content. As such, the underlying theory of the T1w/T2w ratio proposed by Glasser and van Essen (12), may be too simple and does not necessarily reflect myelin specifically. Evidence for the non-specificity of the T1w/T2w ratio to myelin also comes from imaging studies; the myelin water fraction, which has been validated as a specific marker of myelin (46, 57), has been shown to have no correlation with T1w/T2w ratio intensity values in WM of healthy subjects (54). Further, pathological investigations of T1w/T2w ratio intensity values show mixed results and have focused on cortical myelination. Glasser and van Essen demonstrated that the T1w/T2w ratio is visually comparable to myeloarchitectonic maps of the cortex, suggesting a relationship with myelin (11). In support of Glasser and van Essen, Nakamura et al. compared myelinated and non-myelinated tissue of MS patients and found a significant reduction of T1w/T2w values in non-myelinated tissue (58).
However, as discussed above, myelinated and non-myelinated tissue in MS are not exclusively based on myelin levels and hence, it cannot be directly interpreted as a marker of myelination. Rather, it has been posited that the T1w/T2w ratio is a general measure of WM microstructure (16, 54, 59), which may be more affected by axonal diameter than myelin density(60). Supporting this, Righart et al. investigated cortical T1w/T2w ratio values in secondary progressive MS brains and found that T1w/T2w intensity values were correlated with dendrite density, not myelin (17). As described above, NAWM pathology in MS is not limited to demyelinating processes and axonal loss has been emphasized as an important process in NAWM (44). Hence, we advise against interpreting sT1w/T2w intensity values as a marker of myelin and rather suggest that the sT1w/T2w ratio intensity values are a measure of general NAWM microstructural integrity.
Conclusion
We have demonstrated the validity of standardizing the T1w/T2w ratio in an MS cohort. The sT1w/T2w ratio reduces CoV in NAWM of both MS patients and HC and was the only investigated measure to detect differences in NAWM in MS compared to HC. We propose that the sT1w/T2w ratio is a reliable and sensitive measure that can be used to investigate NAWM changes in MS.
Author Contributions
GC, MS, CF, and FP contributed to the conception and design of the study. MS, JB-S, KR, and SA were involved in the acquisition and organization of clinical and/or MRI data. GC performed the statistical analysis and wrote the first draft of the manuscript. MS, AB, and CC verified the analytical methods. MS, FP, CF, and AB supervised the finalization of the manuscript. All authors contributed to manuscript revision and read and approved the submitted version.
Funding
This work was supported by Deutsche Forschungsgemeinschaft (DFG Exc 257 to FP). The Sponsors were not involved in study design, data collection, analysis, decision to publish, or preparation of the manuscript.
Conflict of Interest Statement
KR was supported by the German Ministry of Education and Research (BMBF/KKNMS, Competence Network Multiple Sclerosis) and has received research support from Novartis and Merck Serono as well as speaking fees and travel grants from Guthy Jackson Charitable Foundation, Bayer Healthcare, Biogen Idec, Merck Serono, sanofi-aventis/Genzyme, Teva Pharmaceuticals, Roche and Novartis. AB is cofounder and shareholder of technology start-ups Motognosis and Nocturne. He is named as inventor on several patent applications describing MS serum biomarkers, perceptive visual computing for motor function assessment and retinalimage analysis. JB-S has received travel grants and speaking fees from Bayer Healthcare, Biogen Idec, Merck Serono, sanofi-aventis/Genzyme, Teva Pharmaceuticals, and Novartis. FP declares that he has received research grants and speaker's honoraria from Bayer Healthcare, Teva Pharmaceuticals, Genzyme, Merck & Co., Novartis and MedImmune. He is also a member of the steering committee for the OCTIMS study (run by Novartis).
The remaining authors declare that the research was conducted in the absence of any commercial or financial relationships that could be construed as a potential conflict of interest.
Acknowledgments
The authors would like to thank all study participants, as well as Cynthia Kraut and Susan Pikol for excellent technical assistance in acquiring and organizing the MRI data.
References
1. Baecher-Allan C, Kaskow BJ, Weiner HL. Multiple sclerosis: mechanisms and immunotherapy. Neuron. (2018) 97:742–68. doi: 10.1016/J.NEURON.2018.01.021
2. Lassmann H. Multiple sclerosis pathology. Cold Spring Harb Perspect Med. (2018) 8:a028936. doi: 10.1101/cshperspect.a028936
3. Pawlitzki M, Neumann J, Kaufmann J, Heidel J, Stadler E, Sweeney-Reed C, et al. Loss of corticospinal tract integrity in early MS disease stages. Neurol Neuroimmunol NeuroInflammation. (2017) 4:e399. doi: 10.1212/NXI.0000000000000399
4. Spanò B, Giulietti G, Pisani V, Morreale M, Tuzzi E, Nocentini U, et al. Disruption of neurite morphology parallels MS progression. (2018) 5:502. doi: 10.1212/NXI.0000000000000502
5. Zeydan B, Gu X, Atkinson EJ, Keegan BM, Weinshenker BG, Tillema JM, et al. Cervical spinal cord atrophy: An earlymarker of progressiveMSonset. Neurol Neuroimmunol NeuroInflammation. (2018) 5:e435. doi: 10.1212/NXI.0000000000000435
6. Thompson AJ, Banwell BL, Barkhof F, Carroll WM, Coetzee T, Comi G, et al. Diagnosis of multiple sclerosis: 2017 revisions of the McDonald criteria. Lancet Neurol. (2018) 17:162–73. doi: 10.1016/S1474-4422(17)30470-2
7. Kuchling J, Backner Y, Oertel FC, Raz N, Bellmann-Strobl J, Ruprecht K, et al. Comparison of probabilistic tractography and tract-based spatial statistics for assessing optic radiation damage in patients with autoimmune inflammatory disorders of the central nervous system. Neuroimage Clin. (2018) 19:538–50. doi: 10.1016/j.nicl.2018.05.004
8. Kuchling J, Brandt AU, Paul F, Scheel M. Diffusion tensor imaging for multilevel assessment of the visual pathway: possibilities for personalized outcome prediction in autoimmune disorders of the central nervous system. EPMA J. (2017) 8:279–94. doi: 10.1007/s13167-017-0102-x
9. Moll NM, Rietsch AM, Thomas S, Ransohoff AJ, Lee JC, Fox R, et al. Multiple sclerosis normal-appearing white matter: pathology-imaging correlations. Ann Neurol. (2011) 70:764–73. doi: 10.1002/ana.22521
10. Reitz SC, Hof SM, Fleischer V, Brodski A, Gröger A, Gracien RM, et al. Multi-parametric quantitative MRI of normal appearing white matter in multiple sclerosis, and the effect of disease activity on T2. Brain Imaging Behav. (2017) 11:744–53. doi: 10.1007/s11682-016-9550-5
11. Glasser MF, Goyal MS, Preuss TM, Raichle ME, Van Essen DC. Trends and properties of human cerebral cortex: correlations with cortical myelin content. Neuroimage. (2014) 93(Pt 2):165–75. doi: 10.1016/j.neuroimage.2013.03.060
12. Glasser MF, Van Essen DC. Mapping human cortical areas in vivo based on myelin content as revealed by T1- and T2-weighted MRI. J Neurosci. (2011) 31:11597–616. doi: 10.1523/JNEUROSCI.2180-11.2011
13. Glasser MF, Preuss TM, Snyder LH, Nair G, Rilling JK, Zhang X, et al. Comparative mapping of cortical myelin content in humans, chimpanzees, and macaques using T1-weighted and T2-weighted MRI. In: Society for Neuroscience. Washington, DC (2011).
14. Ganzetti M, Wenderoth N, Mantini D. Mapping pathological changes in brain structure by combining T1- and T2-weighted MR imaging data. Neuroradiology. (2015) 57:917–28. doi: 10.1007/s00234-015-1550-4
15. Beer A, Biberacher V, Schmidt P, Righart R, Buck D, Berthele A, et al. Tissue damage within normal appearing white matter in early multiple sclerosis: assessment by the ratio of T1- and T2-weighted MR image intensity. J Neurol. (2016) 263:1495–502. doi: 10.1007/s00415-016-8156-6
16. Arshad M, Stanley JA, Raz N. Test–retest reliability and concurrent validity of in vivo myelin content indices: Myelin water fraction and calibrated T1w/T2w image ratio. Hum Brain Mapp. (2017) 38:1780–90. doi: 10.1002/hbm.23481
17. Righart R, Biberacher V, Jonkman LE, Klaver R, Schmidt P, Buck D, et al. Cortical pathology in multiple sclerosis detected by the T1/T2-weighted ratio from routine magnetic resonance imaging. Ann Neurol. (2017) 82:519–29. doi: 10.1002/ana.25020
18. Kruggel F, Turner J, Muftuler LT. Impact of scanner hardware and imaging protocol on image quality and compartment volume precision in the ADNI cohort. Neuroimage. (2010) 49:2123–33. doi: 10.1016/J.NEUROIMAGE.2009.11.006
19. Filippi M, van Waesberghe JH, Horsfield MA, Bressi S, Gasperini C, Yousry TA, et al. Interscanner variation in brain MRI lesion load measurements in MS: implications for clinical trials. Neurology. (1997) 49:371–7. doi: 10.1212/WNL.49.2.371
20. Jovicich J, Czanner S, Han X, Salat D, van der Kouwe A, Quinn B, et al. MRI-derived measurements of human subcortical, ventricular and intracranial brain volumes: Reliability effects of scan sessions, acquisition sequences, data analyses, scanner upgrade, scanner vendors and field strengths. Neuroimage. (2009) 46:177–92. doi: 10.1016/J.NEUROIMAGE.2009.02.010
21. Han X, Jovicich J, Salat D, van der Kouwe A, Quinn B, Czanner S, et al. Reliability of MRI-derived measurements of human cerebral cortical thickness: the effects of field strength, scanner upgrade and manufacturer. Neuroimage. (2006) 32:180–94. doi: 10.1016/J.NEUROIMAGE.2006.02.051
22. Misaki M, Savitz J, Zotev V, Phillips R, Yuan H, Young KD, et al. Contrast enhancement by combining T1- and T2-weighted structural brain MR Images. Magn Reson Med. (2015) 74:1609–20. doi: 10.1002/mrm.25560
23. Polman CH, Reingold SC, Banwell B, Clanet M, Cohen JA, Filippi M, et al. Diagnostic criteria for multiple sclerosis: 2010 revisions to the McDonald criteria. Ann Neurol. (2011) 69:292–302. doi: 10.1002/ana.22366
24. Kurtzke JF. Rating neurologic impairment in multiple sclerosis: an expanded disability status scale (EDSS). Neurology. (1983) 33:1444–52. doi: 10.1212/WNL.33.11.1444
25. Tustison NJ, Avants BB, Cook PA, Zheng Y, Egan A, Yushkevich PA, et al. N4ITK: improved N3 bias correction. IEEE Trans Med Imaging. (2010) 29:1310–20. doi: 10.1109/TMI.2010.2046908
26. Jenkinson M, Bannister P, Brady M, Smith S. Improved optimization for the robust and accurate linear registration and motion correction of brain images. Neuroimage. (2002) 17:825–41. doi: 10.1006/nimg.2002.1132
27. Jenkinson M, Smith S. A global optimisation method for robust affine registration of brain images. Med Image Anal. (2001) 5:143–56. doi: 10.1016/S1361-8415(01)00036-6
28. Schmidt P. Bayesian Inference for Structured Additive Regression Models for Large-Scale Problems With Applications to Medical Imaging. (2017). Available online at: https://edoc.ub.uni-muenchen.de/20373/ (accessed May 10, 2018).
29. Yushkevich PA, Piven J, Hazlett HC, Smith RG, Ho S, Gee JC, et al. User-guided 3D active contour segmentation of anatomical structures: significantly improved efficiency and reliability. Neuroimage. (2006) 31:1116–28. doi: 10.1016/j.neuroimage.2006.01.015
30. Gaser C, Dahnke R. CAT - A Computational Anatomy Toolbox for the Analysis of Structural MRI Data. Available online at: http://www.neuro.uni-jena.de/hbm2016/GaserHBM2016.pdf. Published 2016
31. Smith SM, Jenkinson M, Woolrich MW, Beckmann CF, Behrens TE, Johansen-Berg H, et al. Advances in functional and structural MR image analysis and implementation as FSL. Neuroimage. (2004) 23:S208–19. doi: 10.1016/j.neuroimage.2004.07.051
32. R Core Team. R: A Language and Environment for Statistical Computing. (2017). Available online at: https://www.r-project.org/
33. Wickham H. Tidyverse: Easily Install and Load the “Tidyverse”. (2017). Available online at: https://cran.r-project.org/package=tidyverse
34. Kassambara A. ggpubr: “ggplot2” Based Publication Ready Plots. (2018). Available online at: https://cran.r-project.org/package=ggpubr
35. Marwick B, Krishnamoorthy K. Cvequality: Tests for the Equality of Coefficients of Variation from Multiple Groups. (2018). Available online at: https://cran.r-project.org/package=cvequality
36. Akaike H. Akaike's information criterion. In: Miodrag L, editor. International Encyclopedia of Statistical Science. Berlin; Heidelberg: Springer (2011) p. 25 doi: 10.1007/978-3-642-04898-2_110
37. Rippon G, Jordan-Young R, Kaiser A, Fine C. Recommendations for sex/gender neuroimaging research: key principles and implications for research design, analysis, and interpretation. Front Hum Neurosci. (2014) 8:50. doi: 10.3389/fnhum.2014.00650
38. Smith SM, Zhang Y, Jenkinson M, Chen J, Matthews PM, Federico A, et al. Accurate, robust, and automated longitudinal and cross-sectional brain change analysis. Neuroimage. (2002) 17:479–89. doi: 10.1006/NIMG.2002.1040
39. Venables WN, Springer BDR. Modern Applied Statistics with S. 4th ed. New York, NY: Springer (2002).
40. Paul F. Pathology and MRI: exploring cognitive impairment in MS. Acta Neurol Scand. (2016) 134 (Suppl. 200):24–33. doi: 10.1111/ane.12649
41. Preziosa P, Rocca MA, Pagani E, Stromillo ML, Enzinger C, Gallo A, et al. Structural MRI correlates of cognitive impairment in patients with multiple sclerosis. Hum Brain Mapp. (2016) 37:1627–44. doi: 10.1002/hbm.23125
42. Bester M, Forkert ND, Stellmann JP, Stürner K, Aly L, Drabik A, et al. Increased perfusion in normal appearing white matter in high inflammatory multiple sclerosis patients. PLoS ONE. (2015) 10:e0119356. doi: 10.1371/journal.pone.0119356
43. Evangelou N, Konz D, Esiri MM, Smith S, Palace J, Matthews PM. Regional axonal loss in the corpus callosum correlates with cerebral white matter lesion volume and distribution in multiple sclerosis. Brain. (2000) 123:1845–9. doi: 10.1093/brain/123.9.1845
44. Stys PK, Zamponi GW, van Minnen J, Geurts JJG. Will the real multiple sclerosis please stand up? Nat Rev Neurosci. (2012) 13:507–14. www.nature.com/reviews/neuro.
45. Harel A, Sperling D, Petracca M, Ntranos A, Katz-Sand I, Krieger S, et al. Brain microstructural injury occurs in patients with RRMS despite no evidence of disease activity. J Neurol Neurosurg Psychiatry. (2018) 89:977–82. doi: 10.1136/jnnp-2017-317606
46. Vavasour IM, Huijskens SC, Li DK, Traboulsee AL, Mädler B, Kolind SH, et al. Global loss of myelin water over 5 years in multiple sclerosis normal-appearing white matter. Mult Scler. (2017) 24:1557–68. doi: 10.1177/1352458517723717
47. de Kouchkovsky I, Fieremans E, Fleysher L, Herbert J, Grossman RI, Inglese M. Quantification of normal-appearing white matter tract integrity in multiple sclerosis: a diffusion kurtosis imaging study. J Neurol. (2016) 263:1146–55. doi: 10.1007/s00415-016-8118-z
48. Varga AW, Johnson G, Babb JS, Herbert J, Grossman RI, Inglese M. White matter hemodynamic abnormalities precede sub-cortical gray matter changes in multiple sclerosis. J Neurol Sci. (2009) 282:28–33. doi: 10.1016/j.jns.2008.12.036
49. Droby A, Fleischer V, Carnini M, Zimmermann H, Siffrin V, Gawehn J, et al. The impact of isolated lesions on white-matter fiber tracts in multiple sclerosis patients. Neuroimage. (2015) 8:110. doi: 10.1016/J.NICL.2015.03.003
50. Motulsky HJ. Common misconceptions about data analysis and statistics. Br J Pharmacol. (2015) 172:2126–32. doi: 10.1111/bph.12884
51. Heath F, Hurley SA, Johansen-Berg H, Sampaio-Baptista C. Advances in noninvasive myelin imaging. Dev Neurobiol. (2018) 78:136–51. doi: 10.1002/dneu.22552
52. Steven AJ, Zhuo J, Melhem ER, Aj S, Zhuo J. Diffusion kurtosis imaging: an emerging technique for evaluating the microstructural environment of the brain. AJR Am J Roentgenol. (2014) 202:26–33. doi: 10.2214/AJR.13.11365
53. Huang J, Liu Y, Zhao T, Shu N, Duan Y, Ren Z, et al. White matter microstructural alterations in clinically isolated syndrome and multiple sclerosis. J Clin Neurosci. (2018) 53:27–33. doi: 10.1016/j.jocn.2018.01.007t
54. Uddin MN, Figley TD, Marrie RA, Figley CR. Can T1w/T2w ratio be used as a myelin-specific measure in subcortical structures? Comparisons between FSE-based T1w/T2w ratios, GRASE-based T1w/T2w ratios and multi-echo GRASE-based myelin water fractions. NMR Biomed. (2018) 31: e3868. doi: 10.1002/nbm.3868
55. Laule C, Moore GRW. Myelin water imaging to detect demyelination and remyelination and its validation in pathology. Brain Pathol. (2018) 28:750–64. doi: 10.1111/bpa.12645
56. Brück W, Bitsch A, Kolenda H, Brück Y, Stiefel M, Lassmann H. Inflammatory central nervous system demyelination: correlation of magnetic resonance imaging findings with lesion pathology. Ann Neurol. (1997) 42:783–93. doi: 10.1002/ana.410420515
57. Laule C, Leung E, Lis DK, Traboulsee AL, Paty DW, MacKay AL, et al. Myelin water imaging in multiple sclerosis: quantitative correlations with histopathology. Mult Scler J. (2006) 12:747–53. doi: 10.1177/1352458506070928
58. Nakamura K, Chen JT, Ontaneda D, Fox RJ, Trapp BD. T1-/T2-weighted ratio differs in demyelinated cortex in multiple sclerosis. Ann Neurol. 82:635–9. doi: 10.1002/ana.25019
59. Haller S, Kövari E, Herrmann FR, Cuvinciuc V, Tomm AM, Zulian GB, et al. Do brain T2/FLAIR white matter hyperintensities correspond to myelin loss in normal aging? A radiologic-neuropathologic correlation study. Acta Neuropathol Commun. (2013) 1:14. doi: 10.1186/2051-5960-1-14
Keywords: magnetic resonance imaging techniques, multiple sclerosis, normal appearing white matter, T1w/T2w ratio, relapsing-remitting
Citation: Cooper G, Finke C, Chien C, Brandt AU, Asseyer S, Ruprecht K, Bellmann-Strobl J, Paul F and Scheel M (2019) Standardization of T1w/T2w Ratio Improves Detection of Tissue Damage in Multiple Sclerosis. Front. Neurol. 10:334. doi: 10.3389/fneur.2019.00334
Received: 25 January 2019; Accepted: 19 March 2019;
Published: 09 April 2019.
Edited by:
Christian Gaser, Friedrich-Schiller-Universität Jena, GermanyReviewed by:
Hakon Grydeland, University of Oslo, NorwayViola Pongratz, Technische Universität München, Germany
Copyright © 2019 Cooper, Finke, Chien, Brandt, Asseyer, Ruprecht, Bellmann-Strobl, Paul and Scheel. This is an open-access article distributed under the terms of the Creative Commons Attribution License (CC BY). The use, distribution or reproduction in other forums is permitted, provided the original author(s) and the copyright owner(s) are credited and that the original publication in this journal is cited, in accordance with accepted academic practice. No use, distribution or reproduction is permitted which does not comply with these terms.
*Correspondence: Friedemann Paul, friedemann.paul@charite.de
†These authors have contributed equally to this work and share senior authorship