- 1Department of Diagnostic and Interventional Radiology, Osaka City University Graduate School of Medicine, Osaka, Japan
- 2Department of Medical Physics in Advanced Biomedical Sciences, Faculty of Life Sciences, Kumamoto University, Kumamoto, Japan
- 3Department of Neurosurgery, Osaka City University Graduate School of Medicine, Osaka, Japan
- 4Department of Radiological Technology, Osaka City University Hospital, Osaka, Japan
- 5Philips Japan, Tokyo, Japan
Background and objective: Phase difference enhanced imaging (PADRE), a new phase-related MRI technique, can enhance both paramagnetic and diamagnetic substances, and select which phases to be enhanced. Utilizing these characteristics, we developed color map of PADRE (Color PADRE), which enables simultaneous visualization of myelin-rich structures and veins. Our aim was to determine whether Color PADRE is sufficient to delineate the characteristics of non-gadolinium-enhancing T2-hyperintense regions related with metastatic tumors (MTs), diffuse astrocytomas (DAs) and glioblastomas (GBs), and whether it can contribute to the differentiation of MTs from GBs.
Methods: Color PADRE images of 11 patients with MTs, nine with DAs and 17 with GBs were created by combining tissue-enhanced, vessel-enhanced and magnitude images of PADRE, and then retrospectively reviewed. First, predominant visibility of superficial white matter and deep medullary veins within non-gadolinium-enhancing T2-hyperintense regions were compared among the three groups. Then, the discriminatory power to differentiate MTs from GBs was assessed using receiver operating characteristic analysis.
Results: The degree of visibility of superficial white matter was significantly better in MTs than in GBs (p = 0.017), better in GBs than in DAs (p = 0.014), and better in MTs than in DAs (p = 0.0021). On the contrary, the difference in the visibility of deep medullary veins was not significant (p = 0.065). The area under the receiver operating characteristic curve to discriminate MTs from GBs was 0.76 with a sensitivity of 80% and specificity of 64%.
Conclusion: Visibility of superficial white matter on Color PADRE reflects inferred differences in the proportion of vasogenic edema and tumoral infiltration within non-gadolinium-enhancing T2-hyperintense regions of MTs, DAs and GBs. Evaluation of peritumoral areas on Color PADRE can help to distinguish MTs from GBs.
Introduction
Cerebral metastases and gliomas are major types of brain tumors that are sometimes difficult to discern from one another preoperatively. An important difference between them is the histopathology of non-gadolinium (Gd)-enhancing T2-hyperintense regions. Diffuse astrocytomas (DAs) usually appear as non-enhancing T2-hyperintense lesions (1). On the other hand, metastatic tumors (MTs) and glioblastomas (GBs) are both usually present as ring-enhancing lesions accompanied by non-Gd-enhancing T2-hyperintense peritumoral areas with different microscopic aspects, as pure vasogenic edema is observed with MTs, and both tumoral infiltration and vasogenic edema are observed with GBs (2–4). In fact, several studies have focused on peritumoral areas using advanced MRI techniques, such as diffusion tensor imaging (DTI), perfusion-weighted imaging, magnetic resonance spectroscopy and amide proton transfer imaging (5–8).
The contrast of phase images, which reflects the magnetic permeability of various substances, differs from that of conventional magnitude images (9–12). At present, susceptibility-weighted imaging (SWI) is the most widely used phase-related imaging technique because of its clinical benefits of clear visualization of veins and hemorrhages utilizing the paramagnetic effects derived from deoxyhemoglobin, hemosiderin and non-hem iron (9).
A new phase-related imaging technique called “phase difference enhanced imaging (PADRE)” was recently developed (13–15). PADRE has two strengths over SWI: (i) enhancement of both paramagnetic and diamagnetic substances and (ii) phase selection. For example, vessel-enhanced images (VEI) of PADRE clearly demonstrate veins, hemorrhages and iron-deposits based on paramagnetic susceptibilities, as with SWI. On the other hand, tissue-enhanced images (TEI) of PADRE clearly visualize multiple myelin-rich structures based on diamagnetic susceptibilities, which is not implemented in SWI (13, 16–19). These various enhanced images are post-processed from identical source images, and therefore are free from misregistration. Based on these concepts, we developed a color-map display of PADRE, in which enhanced structures of TEI and VEI are overlaid with different colors to assess multiple structures simultaneously and distinctly.
Previous studies using SWI reported the usefulness of intratumoral susceptibility signals to differentiate MTs from GBs (20–22). However, phase-related imaging techniques have not yet been used to investigate peritumoral areas. Compared with SWI, the color map of PADRE (Color PADRE) contains abundant information regarding normal structures. Therefore, by visualizing internal vessels and myelin-rich structures, Color PADRE may also have the potential to delineate histopathological alterations within non-Gd-enhancing T2-hyperintense regions related to brain tumors, thereby contributing to preoperative diagnosis.
Our goal was twofold. The first was to determine whether preoperative Color PADRE can reflect the histopathology of non-Gd-enhancing T2-hyperintense regions expected from pathological diagnosis of MTs, DAs or GBs. The second was to evaluate the diagnostic potential of Color PADRE to differentiate MTs from GBs, two major brain tumors presenting as ring-enhancing masses accompanied by peritumoral areas.
Materials and Methods
Subjects
From August 2010 to April 2014, preoperative MR examinations for suspected brain tumors, including the PADRE sequence, were obtained using a 3-T MRI scanner unless there were contraindications for MR examination. The ethics committee of Osaka City University Graduate School of Medicine approved this study. In accordance with the Declaration of Helsinki, written informed consent was obtained from all patients or their legal guardians for the use of clinical data, including MR images, for research purposes. Among the consecutive data mentioned above, patients with pathologically proven MTs, DAs and GBs were retrospectively identified. All pathological diagnoses were confirmed by surgery or biopsy after MRI, according to the 2007 World Health Organization Classification of Tumors of the Central Nervous System (23), the latest criteria available at the time of diagnoses in this study.
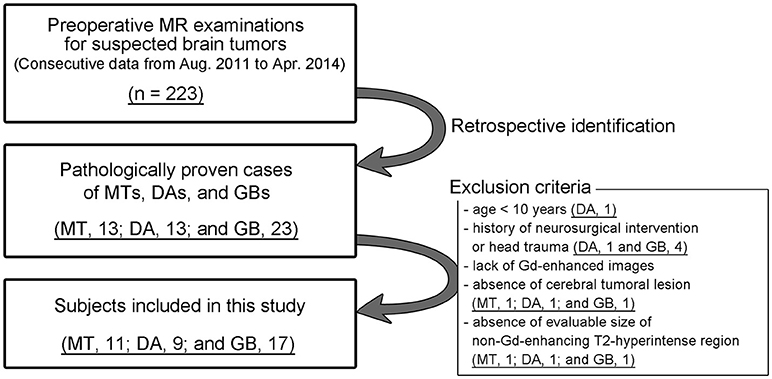
Exclusion criteria included the followings: (i) age <10 years; (ii) history of neurosurgical intervention or head trauma; (iii) lack of Gd-enhanced images due to contraindications for Gd-based contrast materials; (iv) absence of cerebral tumoral lesion; and (v) absence of evaluable size (defined as > 5 mm) of non-Gd-enhancing T2-hyperintense regions. The inclusion procedure for the study is shown in Figure 1.
Imaging Protocol
All MR examinations were performed with a 3-T scanner (Achieva; Philips Healthcare, Best, the Netherlands) using an 8-channel head coil. Axial PADRE source images were acquired with three-dimensional principles of echo shifting with a train of observation (3D PRESTO) sequence with the following parameters: repetition time/echo time, 28.1/39.1 ms; field of view, 22 cm; matrix, 512 × 490; flip angle, 10°; slice thickness, 2 mm; slice gap, 1 mm; and image acquisition time, 6 min 50 s. In addition, axial T2-weighted turbo spin echo images (repetition time/echo time, 3,800/80 ms; field of view, 22 cm; matrix, 448 × 326; slice thickness, 5 mm; slice gap, 6.5 mm; image acquisition time, 1 min 46 s) and axial, coronal and sagittal Gd-enhanced fat-suppressed T1-weighted gradient echo images (repetition time/echo time, 5.8/2.6 ms; field of view, 22 cm; matrix, 244 × 244; flip angle, 12°; slice thickness, 3 mm; slice gap, 3 mm; image acquisition time, 5 min 38 s) were obtained as parts of routine examinations.
Processing of PADRE
The detailed concepts of PADRE processing are reported elsewhere (13–15). Source images of PADRE, acquired with the 3D PRESTO sequence, consisted of pairs of magnitude and phase images. Initially, phase images were unwrapped using a high-pass filter with the homodyne method to remove the effects of static magnetic field. Next, phase (φ, in radian) masks were calculated using the exponential function below with parameters (a, b, and c) adjusted for what to be enhanced. Finally, paired magnitude images and phase masks were multiplied, which resulted in reconstructed enhanced images.
Diamagnetic substances such as myelin show positive phase values whereas paramagnetic substances such as deoxyhemoglobin and hemosiderin show negative phase values in the right-handed system adopted in PADRE. The PADRE technique can produce various types of enhanced images from the same source images by focusing different phases. In the present study, two kinds of enhanced images, TEI and VEI, were reconstructed by substituting a, b, and c with 2, 0, and 1, respectively. PADRE processing was performed off-line with in-house software.
Creation of Color PADRE
A customized in-house script written in Matlab (version 2016a; Mathworks, Natick, MA, USA) was used for creation of color maps. Structures enhanced with TEI were visualized in blue and those enhanced with VEI in red, and these colors were overlaid on magnitude images containing high-resolution anatomical information (Figure 2). Because TEI, VEI and magnitude images of PADRE were constructed from identical source images, the resultant color maps were free from misregistration, which enabled simultaneous evaluation of myelin-rich structures and veins. In addition, 4 mm-thick minimum intensity projection (MinIP) images of the color maps were generated with DICOM viewer OsiriX MD (version 8.0.2 64-bit; Pixmeo SARL, Bernex, Switzerland) to increase visibility. A distribution version of the software for creating Color PADRE and DICOM files for testing are provided in Supplementary Material.
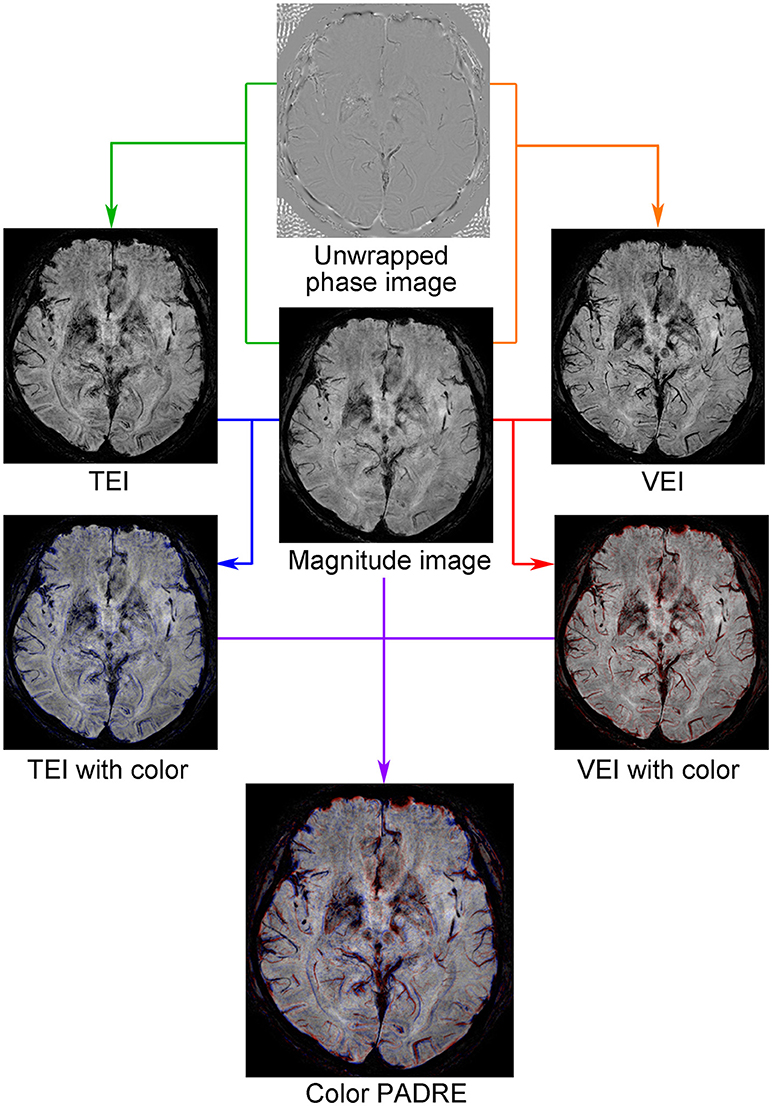
Figure 2. Concept of Color PADRE. TEI, in which myelin-rich structures are enhanced, were post-processed from pairs of magnitude and phase images by focusing positive phases (green line). Similarly, VEI, in which veins, hemorrhages and iron-deposits are enhanced, were post-processed by focusing negative phases (orange line). Structures enhanced on TEI compared with magnitude images were then visualized in blue (blue line) and those enhanced on VEI in red (red line). By combining these and corresponding magnitude images, color maps were created (purple line).
Image Evaluation
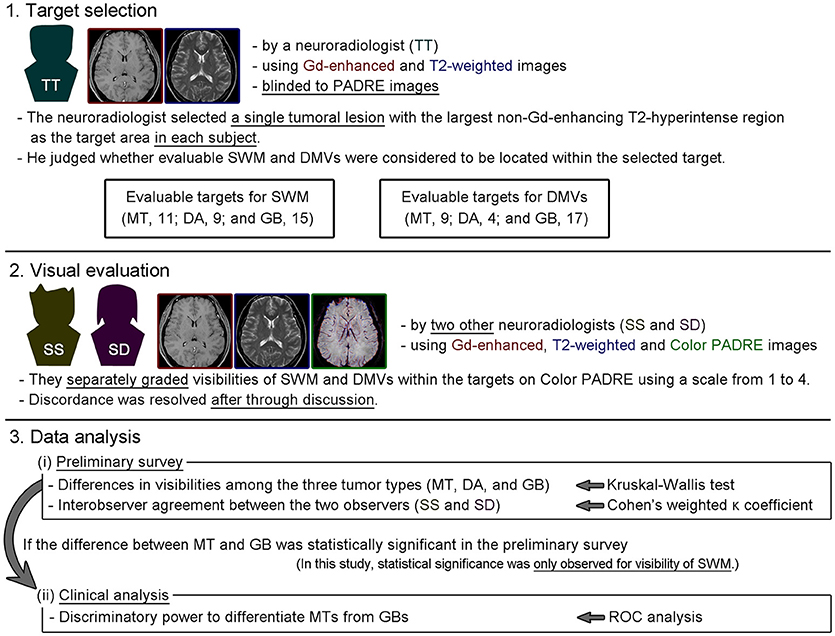
Our strategy for image evaluation and data analysis is presented in Figure 3.
In the present study, superficial white matter (SWM) and deep medullary veins (DMVs) were evaluated because they are prevalent myelin-rich structures or veins in the brain and are relatively easily recognized on PADRE images. A single tumoral lesion with the largest non-Gd-enhancing T2-hyperintense region was selected as the target in each subject by a neuroradiologist with 7 years of experience, who also judged whether evaluable SWM and DMVs were thought to be located within the target area using Gd-enhanced and T2-weighted images. These procedures were performed with the neuroradiologist blinded to Color PADRE images for minimizing any influence on consequent evaluation.
Then, two neuroradiologists with 11 and 8 years of experience, who were blinded to the pathological diagnoses, separately graded the visibilities of SWM and DMVs within the targets on Color PADRE using Gd-enhanced, T2-weighted and Color PADRE MinIP images. Because there was no dedicated training dataset for this study, the two neuroradiologists briefly viewed the Color PADRE images from all subjects without knowing the pathological diagnoses before commencing evaluation. Cystic or necrotic components were excluded from evaluation. Correction for tumoral location was not performed because there is no established method for correcting locations on PADRE images thus far. The predominant visibilities of SWM and DMVs were scored on an ordinal scale from 1 to 4 (1, poor [<25%]; 2, fair [26–50%]; 3, moderate [51–75%]; and 4, good [>75%]). SWM and DVMs in normal-appearing areas (particularly contralateral corresponding areas) of identical subjects were used as references for grading. The above-mentioned values in percentage were indicated as a guide for scoring. Any discordance in the scores between the two observers was resolved by consensus after through discussion. DICOM viewer OsiriX MD was used for image evaluation.
Two kinds of analyses were performed: (i) a preliminary survey of whether preoperative Color PADRE reflected difference of white matter histology expected from pathological diagnoses of MTs, DAs, or GBs, by comparing the visibilities of SWM and DMVs within the targets among the three groups, and (ii) clinical analysis of the discriminatory power of Color PADRE to differentiate MTs from GBs, if statistical significance between the two tumor types was shown in the preliminary survey.
Statistical Analysis
The two-sided one-way analysis of variance and the chi-squared test were used to compare age and gender distributions. Visibilities of SWM and DMVs among the three groups were assessed using the two-sided Kruskal-Wallis test followed by pairwise comparisons using the Mann-Whitney U-test. The Bonferroni-Holm method was adopted for multiple comparisons. Results were considered statistically significant at p < 0.05.
Interobserver agreement between the two neuroradiologists was assessed by calculating Cohen's weighted kappa (κ) coefficients. The strength of agreement was judged as follows: κ values of 0.00–0.20, slight; 0.21–0.40, fair; 0.41–0.60, moderate; 0.61–0.80, substantial; and 0.81–1.00, almost perfect (24).
The discriminatory power to differentiate MTs from GBs was assessed by receiver operating characteristic (ROC) analysis, and the Youden index was used to determine the optimal cut-off value.
R (version 3.4.1; R Foundation for Statistical Computing, Vienna, Austria) was used for all statistical analysis.
Results
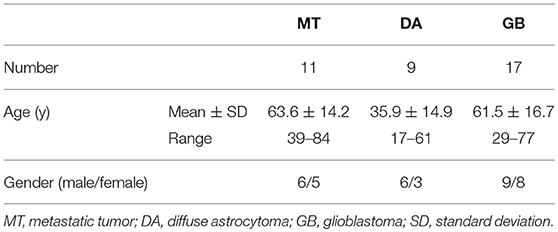
Altogether, 13 patients with MTs, 13 with DAs and 23 with GBs underwent preoperative MR examinations, including PADRE. Among them, two patients with MTs (without cerebral lesion, 1; without evaluable size of target, 1), four with DAs (<10 years old, 1; post brain surgery, 1; without cerebral lesion, 1; without evaluable size of target, 1) and six with GBs (post brain surgery or biopsy, 4; without cerebral lesion, 1; without evaluable size of target, 1) were excluded from analysis. Hence, 11 patients with MTs, nine with DAs and 17 with GBs were included in this study. Patient characteristics are shown in Table 1. Patients with DAs were significantly younger than those with other the two tumor types (DA vs. MT, p = 0.0010; DA vs. GB, p = 0.0010). There was no difference in gender distribution among the three groups (p = 0.79). Details of the included MTs were as follows: adenocarcinoma from the lung, 3; clear cell carcinoma from the kidney, 2; small cell carcinoma from the lung, 1; squamous cell carcinoma from the esophagus, 1; adenocarcinoma from the esophagus, 1; adenocarcinoma from the rectum, 1; adenocarcinoma from the breast, 1; and intimal sarcoma from the pulmonary artery, 1.
Figure 4 displays examples of scores 1–3 for SWM and Figure 5 displays those of scores 1–4 for DMVs. No target area received a score of 4 regarding SWM.
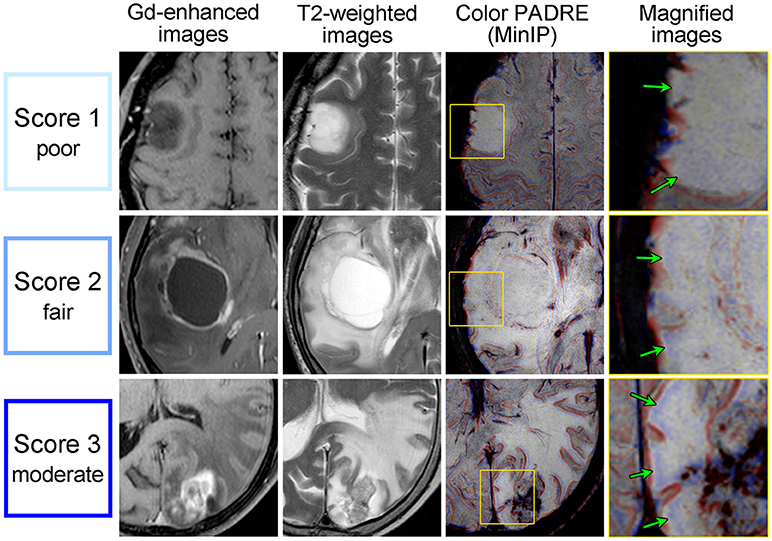
Figure 4. Gd-enhanced images (column 1), T2-weighted images (column 2) and Color PADRE (columns 3 and 4) of the representative cases with scores of 1–3 for SWM. The fourth column shows magnified images of the parts surrounded by yellow squares in the corresponding images in the third column. The first row shows score-1 images of a 43-year-old female with a DA; the second row shows score-2 images of a 67-year-old male with a GB; and the third row shows score-3 images of a 74-year-old female with a MT. No target area received a score of 4 regarding SWM. On Color PADRE, SWM is displayed as blue beneath the cortex. Green arrows in the fourth column indicate the SWM in non-Gd-enhancing T2-hyperintense regions.
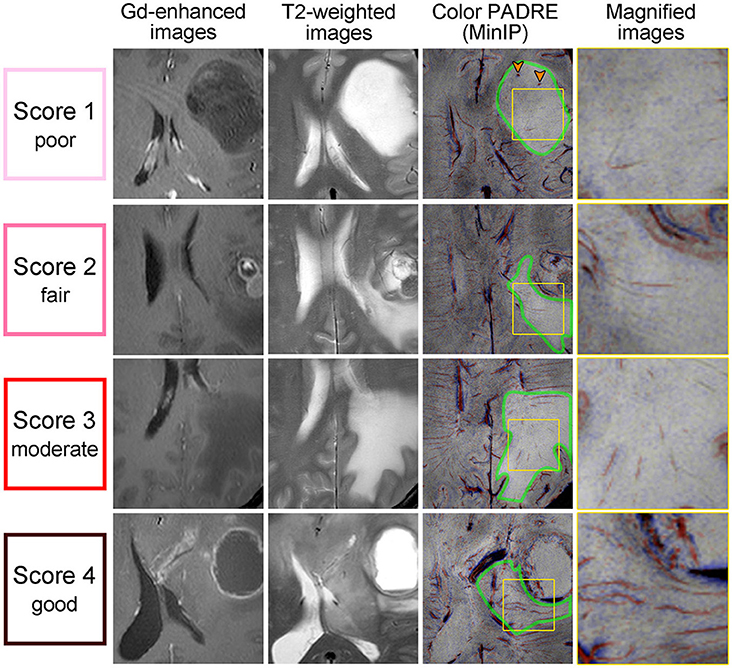
Figure 5. Gd-enhanced images (column 1), T2-weighted images (column 2) and Color PADRE (columns 3 and 4) of the representative cases with DMVs that received scores of 1–4. The fourth column shows magnified images of the parts surrounded by yellow squares in the corresponding images in the third column. The first row shows score-1 images of a 28-year-old female with a DA; the second row shows score-2 images of a 39-year-old male with a MT; the third row shows score-3 images of a 46-year-old male with a MT; and the forth row shows score-4 images of a 31-year-old male with a GB. On Color PADRE, DMVs are displayed as red lines toward the ventricles. Green borders in the third column indicate non-Gd-enhancing T2-hyperintense regions containing DMVs. Orange arrowheads in the third column indicate microhemorrhages.
A total of 35 targets (MT, 11; DA, 9; GB, 15) and 30 targets (MT, 9; DA, 4; GB, 17) were judged to be evaluable and graded for SWM and DMVs, respectively. The Kruskal-Wallis test indicated that the degree of visibility of SWM was significantly different across the three groups (p < 0.001); the score of MT cases was significantly higher than that of GB cases (p = 0.017), the score of GB cases was significantly higher than that of DA cases (p = 0.014), and the score of MT cases was significantly higher than that of DA cases (p = 0.0021) (Figure 6A). Some example Color PADRE images with scores for SWM are presented in Figure 7. On the other hand, differences in visibility were not statistically significant regarding DMVs (p = 0.065), although depiction in GBs tended to be better than in the other two tumor types (Figure 6B). Interobserver agreements on the grading of SWM and DMVs were both substantial (κ = 0.65 and 0.75, respectively).
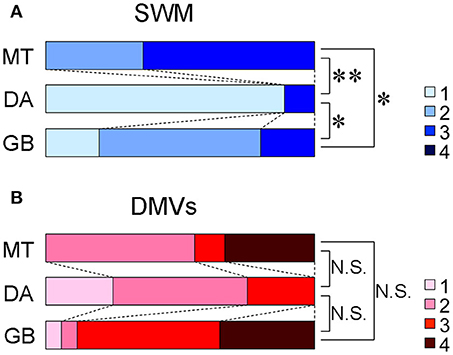
Figure 6. Distribution of the visibilities of SWM (A) and DMVs (B) on Color PADRE. *p < 0.05, **p < 0.005, N.S. = not significant.
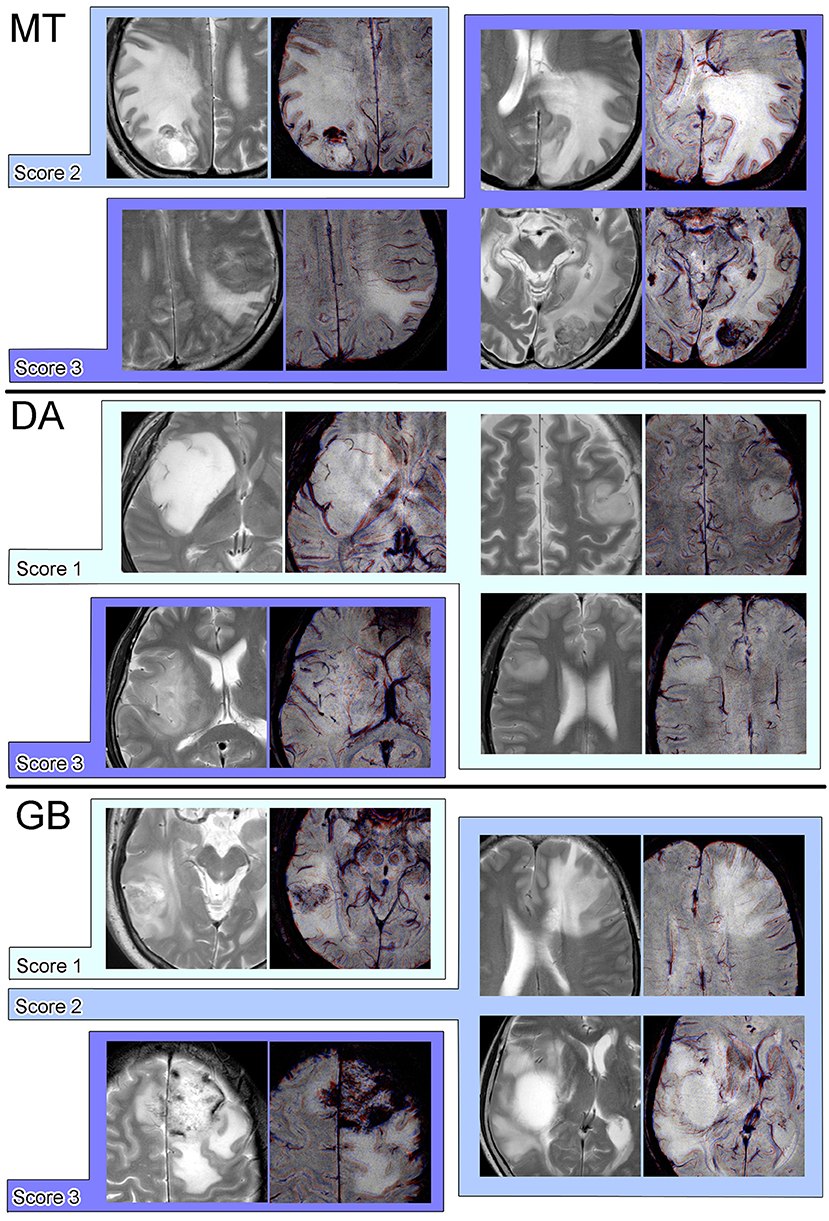
Figure 7. Examples of pairs of T2-weighted and Color PADRE images with scores for SWM on Color PADRE for each tumor type.
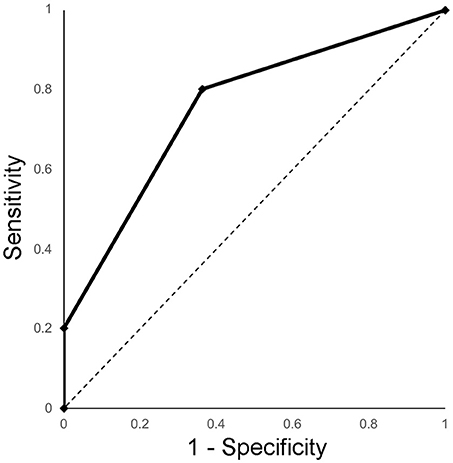
Because statistical significance between MTs and GBs was shown in the preliminary survey regarding SWM, the discriminatory power of visibility of SWM to discern MTs from GBs was subsequently evaluated. The area under the ROC curve was 0.76 (95% confidence interval, 0.59–0.92) (Figure 8). When the threshold was set between 2 and 3 (GB, ≤ 50% of visibility; MT, >50% of visibility), the diagnostic accuracy, sensitivity and specificity were 71, 80, and 64%, respectively.
Discussion
Cerebral metastases and gliomas are commonly encountered brain tumors in adults. Distinguishing these tumors, particularly MTs from GBs, is quite important because of the differences in management (25, 26). However, preoperative discrimination is often difficult by conventional MRI, especially if there is no history of known primary malignancy. To date, several studies have focused on peritumoral areas to differentiate cerebral metastases from malignant gliomas. The usefulness of advanced MRI techniques such as DTI (6, 27–33), perfusion-weighted imaging (5, 28, 32, 34–43), magnetic resonance spectroscopy (5, 7, 28, 36, 44–46), amide proton transfer imaging (8) and combinations thereof (47, 48) have been reported.
PADRE is a new phase-related imaging technique that can utilize any phase derived from both paramagnetic and diamagnetic substances. Previous studies of PADRE reported clear demonstration of normal structures, such as small fiber tracts of the brain stem (13), layers of the optic radiation, the stria of Gennari (16, 17), gray-to-white matter interface or SWM (17–19) and the internal structures of the thalamus (14) with TEI. In addition, the relevance of PADRE findings to aging (49) and various pathological conditions including multiple system atrophy of the cerebellar type (13), Parkinson's disease (50, 51), amyotrophic lateral sclerosis (15), multiple sclerosis (52) and Alzheimer's disease (53) has also been reported.
To the best of our knowledge, this is the first published scientific study to investigate whether PADRE offers diagnostic information in clinical cases of brain tumors. We found that the visibility of the SWM in non-Gd-enhancing T2-hyperintense regions was significantly different among MTs, DAs and GBs on Color PADRE. In addition, our results suggested that Color PADRE can discriminate between MTs and GBs by evaluation of SWM in the peritumoral areas.
The peritumoral areas of MTs consist of pure vasogenic edema (2, 54). In contrast, glioma cells invade along existing white matter tracts and T2-hyperintense regions exhibit not only vasogenic edema but also demyelination and other degenerative changes microscopically (4, 55). Even among different types of gliomas, GBs are inferred to have a high proportion of vasogenic edema, as compared to DAs, because of disruption of the blood brain barrier and angiogenesis (4, 56). Tumoral infiltration is considered to induce more severe damage to myelin-rich structures than vasogenic edema. We suppose that the difference in the proportion of vasogenic edema and tumoral infiltration may be reflected in the visibility of SWM on Color PADRE.
On the other hand, the visibility of DMVs was not statistically significant among the three groups. This result suggests that VEI (namely, SWI-like images) alone did not provide diagnostic findings as to non-Gd-enhancing T2-hyperintense regions. However, the visibility of DMVs tended to be greater in GBs than in other two tumor types. GBs are known to be accompanied by angiogenesis (56), which may account for this tendency.
In the present study, interobserver agreements for the visibilities of both SWM and DMVs were not almost perfect, but rather substantial, which can be partly attributed to the non-uniformity of the visibilities of SWM and DMVs within each target area, probably reflecting the heterogeneity of the degrees of edema and tumoral infiltration in addition to the uneven distribution of SWM and DMVs themselves. The low uniformity within non-Gd-enhancing T2-hyperintense regions may be a weakness of evaluation with PADRE.
On PADRE, myelin-rich structures are visualized based on diamagnetic susceptibilities, which are not utilized by other advanced MRI techniques, including DTI (13–15). The usefulness of Color PADRE shown in this study cannot be achieved with other imaging techniques, thus Color PADRE has the potential to yield additional information for preoperative differentiation of MTs from GBs in clinical situations.
There were some limitations to this study. First was the retrospective design and the relatively small sample size. Second was the exclusion of anaplastic astrocytomas from the preliminary analysis due to their histological continuity with DAs and GBs (23). Third was the lack of direct histological correlations of the non-Gd-enhancing T2-hyperintense regions because surgical resection of these areas from all subjects, particularly those with MTs, was ethically difficult. In spite of these limitations, we trust that this study will provide a basis for future prospective and more detailed studies of brain tumors with PADRE.
Conclusion
Our preliminary data suggest that Color PADRE reflects the suspected histopathology of non-Gd-enhancing T2-hyperintense regions of MTs, DAs and GBs, by yielding novel information based on diamagnetic susceptibilities of myelin-rich structures. Evaluation of peritumoral areas on Color PADRE may contribute to the differentiation of MTs from GBs in clinical situations.
Data Availability Statement
The datasets for this manuscript are not publicly available because they contain information that could compromise the privacy of the subjects. Requests to access the datasets should be directed to Satoshi Doishita, c2RAbWVkLm9zYWthLWN1LmFjLmpw.
Author Contributions
SD: design of the work; analysis and interpretation of data for the work; and drafting the work; SS: conception and design of the work; acquisition, analysis and interpretation of data for the work; and revising the work critically; TY: design of the work; analysis and interpretation of data for the work; and revising the work critically; TU: design of the work; acquisition and interpretation of data for the work; and revising the work critically; TT: acquisition and analysis of data for the work; and revising the work critically; EY: design of the work; acquisition of data for the work; and revising the work critically; MY: analysis and interpretation of data for the work; and revising the work critically; DK and YK: acquisition of data for the work; and revising the work critically; HT and TS: interpretation of data for the work; and revising the work critically; KO and YM: design of the work; and revising the work critically; All authors: final approval for publication of the content; and agreement to be accountable for all aspects of the work in ensuring that questions related to the accuracy or integrity of any part of the work are appropriately investigated and resolved.
Funding
This work was supported by JSPS KAKENHI Grant Number JP25461843.
Conflict of Interest Statement
MY is an employee of Philips Japan.
The remaining authors declare that the research was conducted in the absence of any commercial or financial relationships that could be construed as a potential conflict of interest.
Supplementary Material
The Supplementary Material for this article can be found online at: https://www.frontiersin.org/articles/10.3389/fneur.2018.00788/full#supplementary-material
Abbreviations
PADRE, phase difference enhanced imaging; Color PADRE, color map of phase difference enhanced imaging; MT, metastatic tumor; DA, diffuse astrocytoma; GB, glioblastoma; Gd, gadolinium; DTI, diffusion tensor imaging; SWI, susceptibility-weighted imaging; VEI, vessel-enhanced images; TEI, tissue-enhanced images; 3D PRESTO, three-dimensional principles of echo shifting with a train of observation; MinIP, minimum intensity projection; SWM, superficial white matter; DMV, deep medullary vein.
References
1. Osborn AG, Hedlund G, Salzman KL. Osborn's Brain, 2nd edn. Philadelphia, PA: Elsevier Ltd. (2017).
2. Long DM. Capillary ultrastructure in human metastatic brain tumors. J Neurosurg. (1979) 51:53–8. doi: 10.3171/jns.1979.51.1.0053
3. Kelly PJ, Daumas-Duport C, Kispert DB, Kall BA, Scheithauer BW, Illig JJ. Imaging-based stereotaxic serial biopsies in untreated intracranial glial neoplasms. J Neurosurg. (1987) 66:865–74. doi: 10.3171/jns.1987.66.6.0865
4. Watanabe M, Tanaka R, Takeda N. Magnetic resonance imaging and histopathology of cerebral gliomas. Neuroradiology (1992) 34:463–9. doi: 10.1007/BF00598951
5. Law M, Cha S, Knopp EA, Johnson G, Arnett J, Litt AW. High-grade gliomas and solitary metastases: differentiation by using perfusion and proton spectroscopic MR imaging. Radiology (2002) 222:715–21. doi: 10.1148/radiol.2223010558
6. Lu S, Ahn D, Johnson G, Cha S. Peritumoral diffusion tensor imaging of high-grade gliomas and metastatic brain tumors. Am J Neuroradiol. (2003) 24:937–41.
7. Fan G, Sun B, Wu Z, Guo Q, Guo Y. In vivo single-voxel proton MR spectroscopy in the differentiation of high-grade gliomas and solitary metastases. Clin Radiol. (2004) 59:77–85. doi: 10.1016/j.crad.2003.08.006
8. Yu H, Lou H, Zou T, Wang X, Jiang S, Huang Z, et al. Applying protein-based amide proton transfer MR imaging to distinguish solitary brain metastases from glioblastoma. Eur Radiol. (2017) 27:4516–24. doi: 10.1007/s00330-017-4867-z
9. Haacke EM, Xu Y, Cheng Y-CN, Reichenbach JR. Susceptibility weighted imaging (SWI). Magn Reson Med. (2004) 52:612–8. doi: 10.1002/mrm.20198
10. Sehgal V, Delproposto Z, Haacke EM, Tong KA, Wycliffe N, Kido DK, et al. Clinical applications of neuroimaging with susceptibility-weighted imaging. J Magn Reson Imaging (2005) 22:439–50. doi: 10.1002/jmri.20404
11. Mittal S, Wu Z, Neelavalli J, Haacke EM. Susceptibility-weighted imaging: technical aspects and clinical applications, part 2. Am J Neuroradiol. (2009) 30:232–52. doi: 10.3174/ajnr.A1461
12. Mori N, Miki Y, Kasahara S, Maeda C, Kanagaki M, Urayama SI, et al. Susceptibility-weighted imaging at 3 tesla delineates the optic radiation. Invest Radiol. (2009) 44:140–5. doi: 10.1097/RLI.0b013e318193ff25
13. Kakeda S, Korogi Y, Yoneda T, Nishimura J, Sato T, Hiai Y, et al. A novel tract imaging technique of the brainstem using phase difference enhanced imaging: normal anatomy and initial experience in multiple system atrophy. Eur Radiol. (2011) 21:2202–10. doi: 10.1007/s00330-011-2158-7
14. Kitajima M, Hirai T, Yoneda T, Iryo Y, Azuma M, Tateishi M, et al. Visualization of the medial and lateral geniculate nucleus on phase difference enhanced imaging. Am J Neuroradiol. (2015) 36:1669–74. doi: 10.3174/ajnr.A4356
15. Kakeda S, Yoneda T, Ide S, Miyata M, Hashimoto T. Zebra sign of precentral gyri in amyotrophic lateral sclerosis : a novel finding using phase difference enhanced (PADRE) imaging-initial results. Eur Radiol. (2016) 26:4173–83. doi: 10.1007/s00330-016-4219-4
16. Ide S, Kakeda S, Korogi Y, Yoneda T, Nishimura J, Sato T, et al. Delineation of optic radiation and stria of Gennari on high-resolution phase difference enhanced imaging. Acad Radiol. (2012) 19:1283–9. doi: 10.1016/j.acra.2012.05.018
17. Yang L, Wang S, Yao B, Li L, Xu X, Guo L, et al. Characterizing the contrast of white matter and grey matter in high-resolution phase difference enhanced imaging of human brain at 3.0 T. Eur Radiol. (2015) 25:1068–76. doi: 10.1007/s00330-014-3480-7
18. Kakeda S, Yoneda T, Ide S, Watanabe K, Hiai Y, Korogi Y. Signal intensity of superficial white matter on phase difference enhanced imaging as a landmark of the perirolandic cortex. Acta Radiol. (2016) 57:1380–6. doi: 10.1177/0284185115585162
19. Ide S, Kakeda S, Yoneda T, Watanabe K, Futatsuya K, Murakami Y, et al. Identification of Heschl's gyrus on phase difference enhanced imaging. Acta Radiol. (2017) 58:861–6. doi: 10.1177/0284185116669872
20. Kim HS, Jahng GH, Ryu CW, Kim SY. Added value and diagnostic performance of intratumoral susceptibility signals in the differential diagnosis of solitary enhancing brain lesions: preliminary study. Am J Neuroradiol. (2009) 30:1574–9. doi: 10.3174/ajnr.A1635
21. Park SM, Kim HS, Jahng GH, Ryu CW, Kim SY. Combination of high-resolution susceptibility-weighted imaging and the apparent diffusion coefficient: added value to brain tumour imaging and clinical feasibility of non-contrast MRI at 3 T. Br J Radiol. (2010) 83:466–75. doi: 10.1259/bjr/34304111
22. Fu JH, Chuang TC, Chung HW, Chang HC, Lin HS, Hsu SS, et al. Discriminating pyogenic brain abscesses, necrotic glioblastomas, and necrotic metastatic brain tumors by means of susceptibility-weighted imaging. Eur Radiol. (2015) 25:1413–20. doi: 10.1007/s00330-014-3518-x
23. Louis DN, Ohgaki H, Wiestler OD, Cavenee WK, Burger PC, Jouvet A, et al. The 2007 WHO classification of tumours of the central nervous system. Acta Neuropathol. (2007) 114:97–109. doi: 10.1007/s00401-007-0243-4
24. Landis JR, Koch GG. The measurement of observer agreement for categorical data. Biometrics (1977) 33:159–74.
25. Giese A, Westphal M. Treatment of malignant glioma: a problem beyond the margins of resection. J Cancer Res Clin Oncol. (2001) 127:217–25. doi: 10.1007/s004320000188
26. Soffietti R, Ruda R, Mutani R. Management of brain metastases. J Neurol. (2002) 249:1357–69. doi: 10.1007/s00415-002-0870-6
27. Lu S, Ahn D, Johnson G, Law M, Zagzag D, Grossman RI. Diffusion-tensor MR imaging of intracranial neoplasia and associated peritumoral edema: introduction of the tumor infiltration index. Radiology (2004) 232:221–8. doi: 10.1148/radiol.2321030653
28. Chiang IC, Kuo Y-T, Lu C-Y, Yeung K-W, Lin W-C, Sheu F-O, et al. Distinction between high-grade gliomas and solitary metastases using peritumoral 3-T magnetic resonance spectroscopy, diffusion, and perfusion imagings. Neuroradiology (2004) 46:619–27. doi: 10.1007/s00234-004-1246-7
29. Morita K, Matsuzawa H, Fujii Y, Tanaka R, Kwee IL, Nakada T. Diffusion tensor analysis of peritumoral edema using lambda chart analysis indicative of the heterogeneity of the microstructure within edema. J Neurosurg. (2005) 102:336–41. doi: 10.3171/jns.2005.102.2.0336
30. Wang W, Steward CE, Desmond PM. Diffusion tensor imaging in glioblastoma multiforme and brain metastases: the role of p, q, L, and fractional anisotropy. Am J Neuroradiol. (2009) 30:203–8. doi: 10.3174/ajnr.A1303
31. Wang S, Kim S, Chawla S, Wolf RL, Zhang W-G, O'Rourke DM, et al. Differentiation between glioblastomas and solitary brain metastases using diffusion tensor imaging. Neuroimage (2009) 44:653–60. doi: 10.1016/j.neuroimage.2008.09.027
32. Wang S, Kim S, Chawla S, Wolf RL, Knipp DE, Vossough A, et al. Differentiation between glioblastomas, solitary brain metastases, and primary cerebral lymphomas using diffusion tensor and dynamic susceptibility contrast-enhanced MR imaging. Am J Neuroradiol. (2011) 32:507–14. doi: 10.3174/ajnr.A2333
33. Byrnes TJD, Barrick TR, Bell BA, Clark CA. Diffusion tensor imaging discriminates between glioblastoma and cerebral metastases in vivo. NMR Biomed. (2011) 24:54–60. doi: 10.1002/nbm.1555
34. Server A, Orheim TED, Graff BA, Josefsen R, Kumar T, Nakstad PH. Diagnostic examination performance by using microvascular leakage, cerebral blood volume, and blood flow derived from 3-T dynamic susceptibility-weighted contrast-enhanced perfusion MR imaging in the differentiation of glioblastoma multiforme and brain metastasis. Neuroradiology (2011) 53:319–30. doi: 10.1007/s00234-010-0740-3
35. Lehmann P, Saliou G, De Marco G, Monet P, Souraya SE, Bruniau A, et al. Cerebral peritumoral oedema study: does a single dynamic MR sequence assessing perfusion and permeability can help to differentiate glioblastoma from metastasis? Eur J Radiol. (2012) 81:522–7. doi: 10.1016/j.ejrad.2011.01.076
36. Tsougos I, Svolos P, Kousi E, Fountas K, Theodorou K, Fezoulidis I, et al. Differentiation of glioblastoma multiforme from metastatic brain tumor using proton magnetic resonance spectroscopy, diffusion and perfusion metrics at 3 T. Cancer Imaging (2012) 12:423–36. doi: 10.1102/1470-7330.2012.0038
37. Bulakbasi N, Kocaoglu M, Farzaliyev A, Tayfun C, Ucoz T, Somuncu I. Assessment of diagnostic accuracy of perfusion MR imaging in primary and metastatic solitary malignant brain tumors. AJNR Am J Neuroradiol. (2005) 26:2187–99.
38. Weber MA, Zoubaa S, Schlieter M, Jüttler E, Huttner HB, Geletneky K, et al. Diagnostic performance of spectroscopic and perfusion MRI for distinction of brain tumors. Neurology (2006) 66:1899–906. doi: 10.1212/01.wnl.0000219767.49705.9c
39. Cha S, Lupo JM, Chen MH, Lamborn KR, McDermott MW, Berger MS, et al. Differentiation of glioblastoma multiforme and single brain metastasis by peak height and percentage of signal intensity recovery derived from dynamic susceptibility-weighted contrast-enhanced perfusion MR imaging. Am J Neuroradiol. (2007) 28:1078–84. doi: 10.3174/ajnr.A0484
40. Sentürk S, Oǧuz KK, Cila A. Dynamic contrast-enhanced susceptibility-weighted perfusion imaging of intracranial tumors: a study using a 3T MR scanner. Diagnostic Interv Radiol. (2009) 15:3–12.
41. Hakyemez B, Erdogan C, Gokalp G, Dusak A, Parlak M. Solitary metastases and high-grade gliomas: radiological differentiation by morphometric analysis and perfusion-weighted MRI. Clin Radiol. (2010) 65:15–20. doi: 10.1016/j.crad.2009.09.005
42. Ma JH, Kim HS, Rim NJ, Kim SH, Cho KG. Differentiation among glioblastoma multiforme, solitary metastatic tumor, and lymphoma using whole-tumor histogram analysis of the normalized cerebral blood volume in enhancing and perienhancing lesions. Am J Neuroradiol. (2010) 31:1699–706. doi: 10.3174/ajnr.A2161
43. Blasel S, Jurcoane A, Franz K, Morawe G, Pellikan S, Hattingen E. Elevated peritumoural rCBV values as a mean to differentiate metastases from high-grade gliomas. Acta Neurochir. (2010) 152:1893–99. doi: 10.1007/s00701-010-0774-7
44. Ricci R, Bacci A, Tugnoli V, Battaglia S, Maffei M, Agati R, et al. Metabolic findings on 3T1H-MR spectroscopy in peritumoral brain edema. Am J Neuroradiol. (2007) 28:1287–91. doi: 10.3174/ajnr.A0564
45. Chawla S, Zhang Y, Wang S, Chaudhary S, Chou C, O'Rourke DM, et al. Proton magnetic resonance spectroscopy in differentiating glioblastomas from primary cerebral lymphomas and brain metastases. J Comput Assist Tomogr. (2010) 34:836–41. doi: 10.1097/RCT.0b013e3181ec554e
46. Server A, Josefsen R, Kulle B, Mæhlen J, Schellhorn T, Gadmar Ø, et al. Proton magnetic resonance spectroscopy in the distinction of high-grade cerebral gliomas from single metastatic brain tumors. Acta Radiol. (2010) 51:316–25. doi: 10.3109/02841850903482901
47. Svolos P, Tsolaki E, Kapsalaki E, Theodorou K, Fountas K, Fezoulidis I, et al. Investigating brain tumor differentiation with diffusion and perfusion metrics at 3T MRI using pattern recognition techniques. Magn Reson Imaging (2013) 31:1567–77. doi: 10.1016/j.mri.2013.06.010
48. Bauer AH, Erly W, Moser FG, Maya M, Nael K. Differentiation of solitary brain metastasis from glioblastoma multiforme: a predictive multiparametric approach using combined MR diffusion and perfusion. Neuroradiology (2015) 57:697–703. doi: 10.1007/s00234-015-1524-6
49. Tatewaki Y, Mutoh T, Thyreau B, Omodaka K, Murata T, Sekiguchi A, et al. Phase difference-enhanced magnetic resonance (MR) imaging (PADRE) technique for the detection of age-related microstructural changes in optic radiation: comparison with diffusion tensor imaging (DTI). Med Sci Monit. (2017) 23:5495–503. doi: 10.12659/MSM.905571
50. Ide S, Kakeda S, Yoneda T, Moriya J, Watanabe K, Ogasawara A, et al. Internal structures of the globus pallidus in patients with Parkinson's disease: evaluation with phase difference-enhanced imaging. Magn Reson Med Sci. (2017) 16:304–10. doi: 10.2463/mrms.mp.2015-0091
51. Kakeda S, Korogi Y, Yoneda T, Watanabe K, Moriya J, Murakami Y, et al. Parkinson's disease: diagnostic potential of high-resolution phase difference enhanced MR imaging at 3 T. Eur Radiol. (2013) 23:1102–11. doi: 10.1007/s00330-012-2680-2
52. Futatsuya K, Kakeda S, Yoneda T, Ueda I, Watanabe K, Moriya J, et al. Juxtacortical lesions in multiple sclerosis: assessment of gray matter involvement using phase difference-enhanced imaging (PADRE). Magn Reson Med Sci. (2016) 15:349–54. doi: 10.2463/mrms.mp.2015-0099
53. Tateishi M, Kitajima M, Hirai T, Yoneda T, Hashimoto M, Kurehana N, et al. Differentiating between Alzheimer disease patients and controls with phase-difference-enhanced imaging at 3T: a feasibility study. Magn Reson Med Sci. (2018) doi: 10.2463/mrms.mp.2017-0134
54. Zhang M, Olsson Y. Hematogenous metastases of the human brain - characteristics of peritumoral brain changes: a review. J Neurooncol. (1997) 35:81–9. doi: 10.1023/A:1005799805335
55. Cayre M, Canoll P, Goldman JE. Cell migration in the normal and pathological postnatal mammalian brain. Prog Neurobiol. (2009) 88:41–63. doi: 10.1016/j.pneurobio.2009.02.001
Keywords: MRI, PADRE, neuroradiology, neurooncology, astrocytoma, glioma, glioblastoma, metastasis
Citation: Doishita S, Sakamoto S, Yoneda T, Uda T, Tsukamoto T, Yamada E, Yoneyama M, Kimura D, Katayama Y, Tatekawa H, Shimono T, Ohata K and Miki Y (2018) Differentiation of Brain Metastases and Gliomas Based on Color Map of Phase Difference Enhanced Imaging. Front. Neurol. 9:788. doi: 10.3389/fneur.2018.00788
Received: 15 May 2018; Accepted: 31 August 2018;
Published: 21 September 2018.
Edited by:
Freimut Dankwart Juengling, St. Claraspital Basel, SwitzerlandReviewed by:
Andrea Bink, UniversitätsSpital Zürich, SwitzerlandKonstantinos Kalafatakis, University of Bristol, United Kingdom
Copyright © 2018 Doishita, Sakamoto, Yoneda, Uda, Tsukamoto, Yamada, Yoneyama, Kimura, Katayama, Tatekawa, Shimono, Ohata and Miki. This is an open-access article distributed under the terms of the Creative Commons Attribution License (CC BY). The use, distribution or reproduction in other forums is permitted, provided the original author(s) and the copyright owner(s) are credited and that the original publication in this journal is cited, in accordance with accepted academic practice. No use, distribution or reproduction is permitted which does not comply with these terms.
*Correspondence: Satoshi Doishita, c2RAbWVkLm9zYWthLWN1LmFjLmpw
Shinichi Sakamoto, cy1zYWthbW90b0BtZWQub3Nha2EtY3UuYWMuanA=
 Satoshi Doishita
 Shinichi Sakamoto
 Tetsuya Yoneda2
 Takehiro Uda