
95% of researchers rate our articles as excellent or good
Learn more about the work of our research integrity team to safeguard the quality of each article we publish.
Find out more
ORIGINAL RESEARCH article
Front. Neurol. , 22 May 2018
Sec. Neuropharmacology
Volume 9 - 2018 | https://doi.org/10.3389/fneur.2018.00342
This article is part of the Research Topic Biomarker Exploration in Neuropsychiatry: Understanding of the Pathophysiology and Therapeutic Implications View all 17 articles
 Xuetong Wang1,2†
 Yang Yu3,4†
 Weina Zhao3,4,5†
 Qiongling Li1,2
 Xinwei Li1,2
 Shuyu Li1,2*
 Changhao Yin5*
 Ying Han3,4*
The hippocampus plays important roles in memory processing. However, the hippocampus is not a homogeneous structure, which consists of several subfields. The hippocampal subfields are differently affected by many neurodegenerative diseases, especially mild cognitive impairment (MCI). Amnestic mild cognitive impairment (aMCI) and subcortical vascular mild cognitive impairment (svMCI) are the two subtypes of MCI. aMCI is characterized by episodic memory loss, and svMCI is characterized by extensive white matter hyperintensities and multiple lacunar infarctions on magnetic resonance imaging. The primary cognitive impairment in svMCI is executive function, attention, and semantic memory. Some variations or disconnections within specific large-scale brain networks have been observed in aMCI and svMCI patients. The aim of this study was to investigate abnormalities in structural covariance networks (SCNs) between hippocampal subfields and the whole cerebral cortex in aMCI and svMCI patients, and whether these abnormalities are different between the two groups. Automated segmentation of hippocampal subfields was performed with FreeSurfer 5.3, and we selected five hippocampal subfields as the seeds of SCN analysis: CA1, CA2/3, CA4/dentate gyrus (DG), subiculum, and presubiculum. SCNs were constructed based on these hippocampal subfield seeds for each group. Significant correlations between hippocampal subfields, fusiform gyrus (FFG), and entorhinal cortex (ERC) in gray matter volume were found in each group. We also compared the differences in the strength of structural covariance between any two groups. In the aMCI group, compared to the normal controls (NC) group, we observed an increased association between the left CA1/CA4/DG/subiculum and the left temporal pole. Additionally, the hippocampal subfields (bilateral CA1, left CA2/3) significantly covaried with the orbitofrontal cortex in the svMCI group compared to the NC group. In the aMCI group compared to the svMCI group, we observed decreased association between hippocampal subfields and the right FFG, while we also observed an increased association between the bilateral subiculum/presubiculum and bilateral ERC. These findings provide new evidence that there is altered whole-brain structural covariance of the hippocampal subfields in svMCI and aMCI patients and provide insights to the pathological mechanisms of different MCI subtypes.
The hippocampus is part of the limbic system. It plays important roles in memory processing, especially spatial memory (1). Studies have shown that the hippocampus can be affected by a variety of neurological diseases such as epilepsy and schizophrenia (2, 3). Importantly, hippocampal disruption is an early sign of Alzheimer’s disease (AD) and other forms of dementia (4).
However, the hippocampus is not a homogeneous structure, which consists of several subfields, specifically the cornu ammonis (CA) areas 1–4, the dentate gyrus (DG), the subiculum, and the presubiculum (5). The hippocampus subfields have distinct anatomy and functions (6). Notably, evidence supports the distinct connectivity between hippocampal subfields and other brain regions. The major input to the hippocampus is the performant path, coming from the entorhinal cortex (ERC) that connects with the DG and CA3 pyramidal neurons. In addition, the efferent fibers, which may originate from CA or subiculum, terminate in many brain regions (e.g., entorhinal area, posterior cingulate, medial frontal cortex, and gyrus rectus) (7). Previous studies reported that the hippocampal subfields were differently affected by many neurodegenerative diseases, especially mild cognitive impairment (MCI) (8, 9).
Mild cognitive impairment is a diagnosis given to older adults who have cognitive impairments but that does not interfere significantly with their daily activities (10). It is regarded as the transitional stage between normal aging and dementia. Amnestic mild cognitive impairment (aMCI) and subcortical vascular mild cognitive impairment (svMCI) are two subtypes of MCI, both associated with deficits in multiple cognitive domains, with the same chief complaints in memory deficits, but the pathogenesis of aMCI and svMCI are different (11, 12). The aMCI is characterized by episodic memory loss (13) and represents the prodromal stage of AD (14, 15). The svMCI is regarded as a prodromal stage of subcortical vascular dementia, showing extensive white matter hyperintensities and multiple lacunar infarctions on magnetic resonance imaging (16). The cognitive impairment of svMCI is mainly manifested in executive function, attention, and semantic memory (17–19). Importantly, some variations or disconnections within specific large-scale brain networks were observed in aMCI and svMCI patients (20–24). For example, patients with aMCI showed a pattern of brain disconnection between the posterior cingulate cortex (PCC), the medial prefrontal cortex (PFC), and the rest of the brain (21). A few studies have reported that aMCI patients were characterized by aberrance in resting-state functional connectivity of specific hippocampal subregions (such as DG and subiculum) (25, 26). Additionally, svMCI patients presented extensive decreased functional connectivity density and functional amplitude of spontaneous low-frequency oscillations in the medial PFC (22). However, it is unknown whether aMCI and svMCI patients have abnormalities in structural connections between hippocampal subfields and the cerebral cortex and whether these abnormalities are different between aMCI and svMCI.
Structural covariance networks (SCNs), based on voxel-based morphometry (VBM), generate a map of correlation between the gray matter (GM) volume of a region of interest and the other regions (27, 28). SCNs are regarded as the potential tool to reflect developmental coordination or synchronized maturation between regions of the brain (29). In addition, SCN analysis has been successfully applied to obtain the abnormality in brain connectivity in some neuropsychiatric disorders (30–32). In this study, SCNs were employed to characterize the structural connections between hippocampal subfields and the cerebral cortex. We selected five hippocampal subfields using an automated segmentation method as seeds to build the SCNs in aMCI patients, svMCI patients, and normal controls (NC). Finally, we compared the differences in strength of structural covariance between groups.
Patients with svMCI and aMCI were recruited through the memory clinic of the neurology department of Xuanwu Hospital, Capital Medical University, Beijing, China. Two experienced neurologists diagnosed all patients using the Petersen criteria (33). Healthy controls were recruited from the local community through advertisements. Subjects were excluded if they had the following clinical characteristics: (i) depressive symptoms with a Hamilton Depression Rating Scale score > 24; (ii) non-MCI disease that cause cognitive impairments, such as psychiatric disease, systemic disease, or alcohol or drug abuse; (iii) factors that would make neuropsychological testing infeasible, such as visual abnormalities, severe aphasia, or motor disorders. Written informed consent was obtained from all participants. According to the diagnostic criteria and exclusion criteria, there were 29 svMCI patients, 33 aMCI patients, and 36 NC subjects included in this study. All participants received a standardized clinical evaluation protocol including a global cognitive functioning test [i.e., Mini Mental Status Examination (MMSE)] and other cognitive assessments (i.e., AVLT). Table 1 shows the detailed demographic characteristics of the participants. This study was approved by the medical research ethics committee and the institutional review board of Xuanwu Hospital, Capital Medical University, Beijing, China.
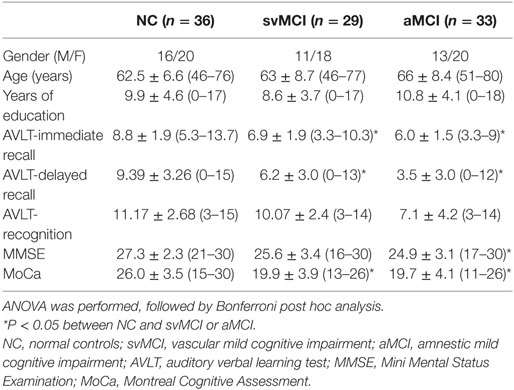
Table 1. Demographics of participants [mean ± SD (range)].
Structural MR images were acquired using sagittal magnetization-prepared rapid gradient echo (MP-RAGE) three-dimensional T1-weighted imaging sequence on a 3.0 T Siemens scanner at Xuanwu Hospital, Capital Medical University. The image parameters included repetition time (TR) = 1,900 ms; echo time (TE) = 2.2 ms; inversion time = 900 ms; flip angle = 9°; field of view = 224 mm × 256 mm; matrix size = 448 × 512; 176 slices; and slice thickness = 1.0 mm.
Automated segmentation of the hippocampal subfields was performed with the hippo-subfields module in FreeSurfer version 5.3,1 which uses the Bayesian statistical model built from manual segmentation of the right hippocampus in 0.38 mm × 0.38 mm × 0.8 mm in vivo MRI scans in 10 subjects (34). The results consisted of a collection of images that indicated each voxel’s posterior probability of belonging to different subregions in native space. By maximizing the posterior probability of the different subregions, the hippocampus of each subject was segmented to seven subfields: CA1, CA2/3, CA4/DG, presubiculum, subiculum, fimbria, and the hippocampal fissure. Previous research has reported that the fimbria and the hippocampal fissure showed relatively lower segmentation accuracies than other subfields (35, 36). Importantly, because the fimbria (white matter) and hippocampal fissure (cerebrospinal fluid) did not belong to GM, they were discarded in the subsequent SCN analysis. There is an illustration for the right hippocampal subfield segmentations for one NC subject in Figure 1.
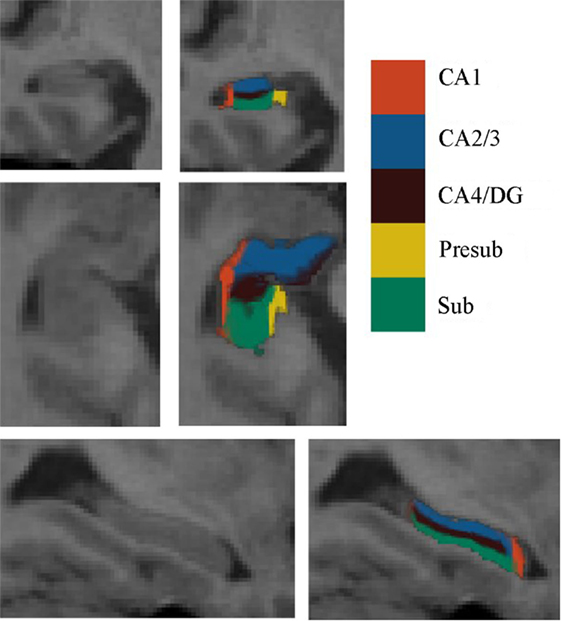
Figure 1. Right hippocampal subfield segmentation for one normal control subject. From left to right: cross-sectional slice of an MRI scan and corresponding automated segmentation of five subfields. Abbreviations: CA, cornu ammonis; DG, dentate gyrus; Presub, presubiculum; Sub, subiculum.
First, non-uniformity intensity correction of the structural magnetic resonance imaging data was performed with FreeSurfer. Then, the results after NU intensity correction were analyzed using Statistical Parametric Mapping software package in MATLAB (SPM122). Following the inspection of image quality, we used VBM (VBM8 toolbox3) to extract the GM volume map of each subject (37). Additionally, we employed a spatially adaptive non-local denoising filter (38) and a hidden Markov random field model (39) to reduce the impact of noise in the GM volume map. Then, the images were transformed into the DARTEL template (40) from the Montreal Neurological Institute (MNI) space through the high-dimensional diffeomorphic anatomical registration using the exponentiated lie algebra (DARTEL) approach, which is a non-linear spatial normalization method. Subsequently, the voxel values were modulated to preserve regional volume information using the Jacobian determinants (41). Finally, we smoothed the modulated images using Gaussian Kernel specified in 12 mm full width at half maximum.
For each subject, the deformation field derived from the NU intensity corrected image to normalized image was applied to the hippocampal subfields’ label image in native space. To reduce the possible impact of segmentation inaccuracy on subsequent analysis, the transformed hippocampal subfield labels were combined for all subjects and the 100% overlapped regions were selected. Then, these regions on each side were masked using the hippocampal label from the Harvard-Oxford subcortical structural atlas. Additionally, if there existed overlap for any two hippocampal subfields, the overlapped regions were removed. After that, the seed region for each hippocampal subfield was defined in MNI space. All the seed regions (in black color) were overlaid to the probabilistic atlas (in Heat color) of hippocampal subfields (34), as shown in Figure 2. The seeds almost located within the atlas.
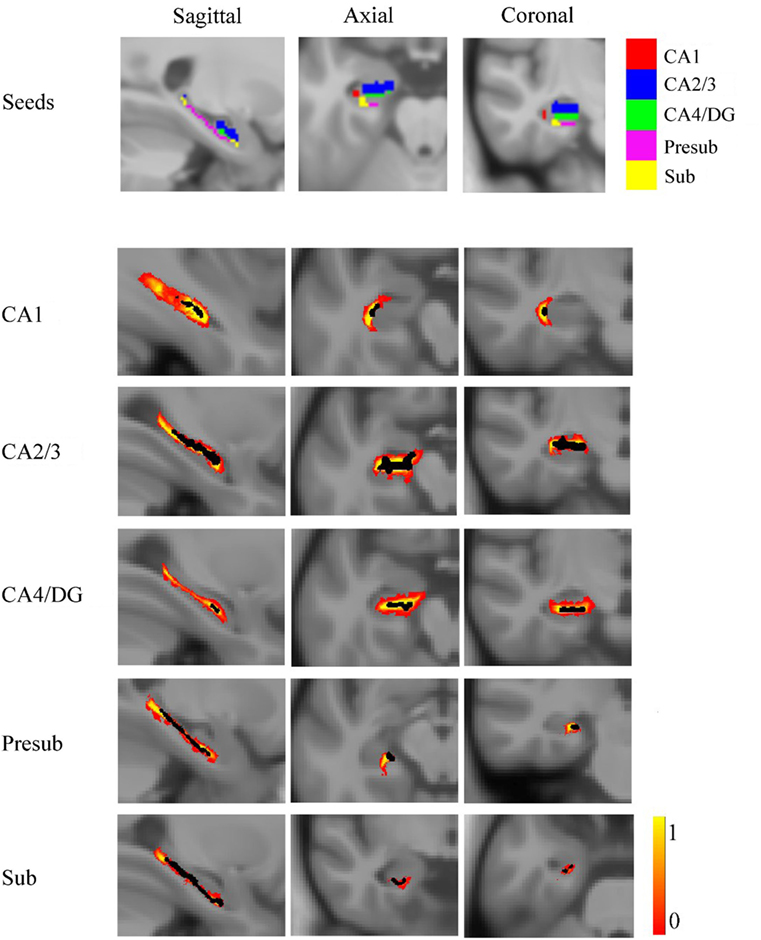
Figure 2. The seed regions compared to probabilistic atlases. At the top of the figure, the seeds are shown in Montreal Neurological Institute space. In the lower part of the figure, the probabilistic atlases are viewed in heat color maps, and the volumes of seeds are overlaid with black color. Abbreviations: CA, cornu ammonis; DG, dentate gyrus; Presub, presubiculum; Sub, subiculum.
For each group, the strength of structural covariance between each subfield seed and all other regions across the whole brain were obtained by applying multiple regression models in SPM12 to perform a voxel-based statistical analysis on the smoothed and modulated GM image. We imported the extracted mean GM volume from each seed as a covariate. As the age and gender would influence the GM volumes, we removed the effects of gender and age on the structural covariance networks by entering them as confounding covariates. The resulting covariance patterns were employed with thresholds at P < 0.05 with the false discovery rate (FDR) correction and reserved positive covariance. Finally, the results were displayed on the MNI template in the BrainNet Viewer software4 (42).
Many studies have indicated that the different slopes for any pair of voxels may represent the difference in their structural association (43, 44). To evaluate the difference in strength of structural covariance between groups, we performed a between-group analysis of slopes. The analysis used a multiple classic interaction linear model:
G was used as a grouping variable, and two groups were put into the same model, where G = 1 for the one group, and G = 0 for another group. The gender and age may affect the association of two voxels, so they were considered as independent variables in a linear model, where X represented the averaged GM volume in each seed, and y represented the GM volumes of each voxel in whole brain. Then, the linear regression model between y and X was adjusted by adding a gender term Gender, an age term Age, a group term G, and an interaction term G × X. Specific t-value contrasts were established to map the significant different voxels in slopes between any two groups. The significant differences between groups were obtained based on the two-tailed Gaussian random field (GRF) correction, with a voxel level of P < 0.01 and a cluster level of P < 0.05.
Table 1 shows demographics of the healthy controls, svMCI patients, and aMCI patients. There were no significant differences in sex, age, and years of education between groups. However, significant differences between groups were found in the AVLT-immediate recall (F = 12.059, P < 0.001), AVLT-delayed recall (F = 11.501, P < 0.001), AVLT-recognition recall (F = 2.804, P = 0.066), MMSE (F = 3.3765, P = 0.27), and Montreal Cognitive Assessment (F = 27.276, P < 0.001) through one-way analysis of variance. The following post hoc test revealed that AVLT-immediate recall, AVLT-delayed recall, and MoCa in patients of aMCI and svMCI were significantly lower than scores in controls. In addition, the score of MMSE was significantly lower in the aMCI group than in the control group, but there was no significant difference in score of MMSE between the svMCI and NC groups.
The SCN patterns of the left and right hippocampal subfields in the three groups are shown in Figures 3 and 4, respectively. Each of the hippocampal subfield seed regions covaried with the ERC and fusiform gyrus (FFG) among the three groups. The regions showing significant correlations with hippocampal subfields were relatively larger in the aMCI group than the svMCI group and NC group.
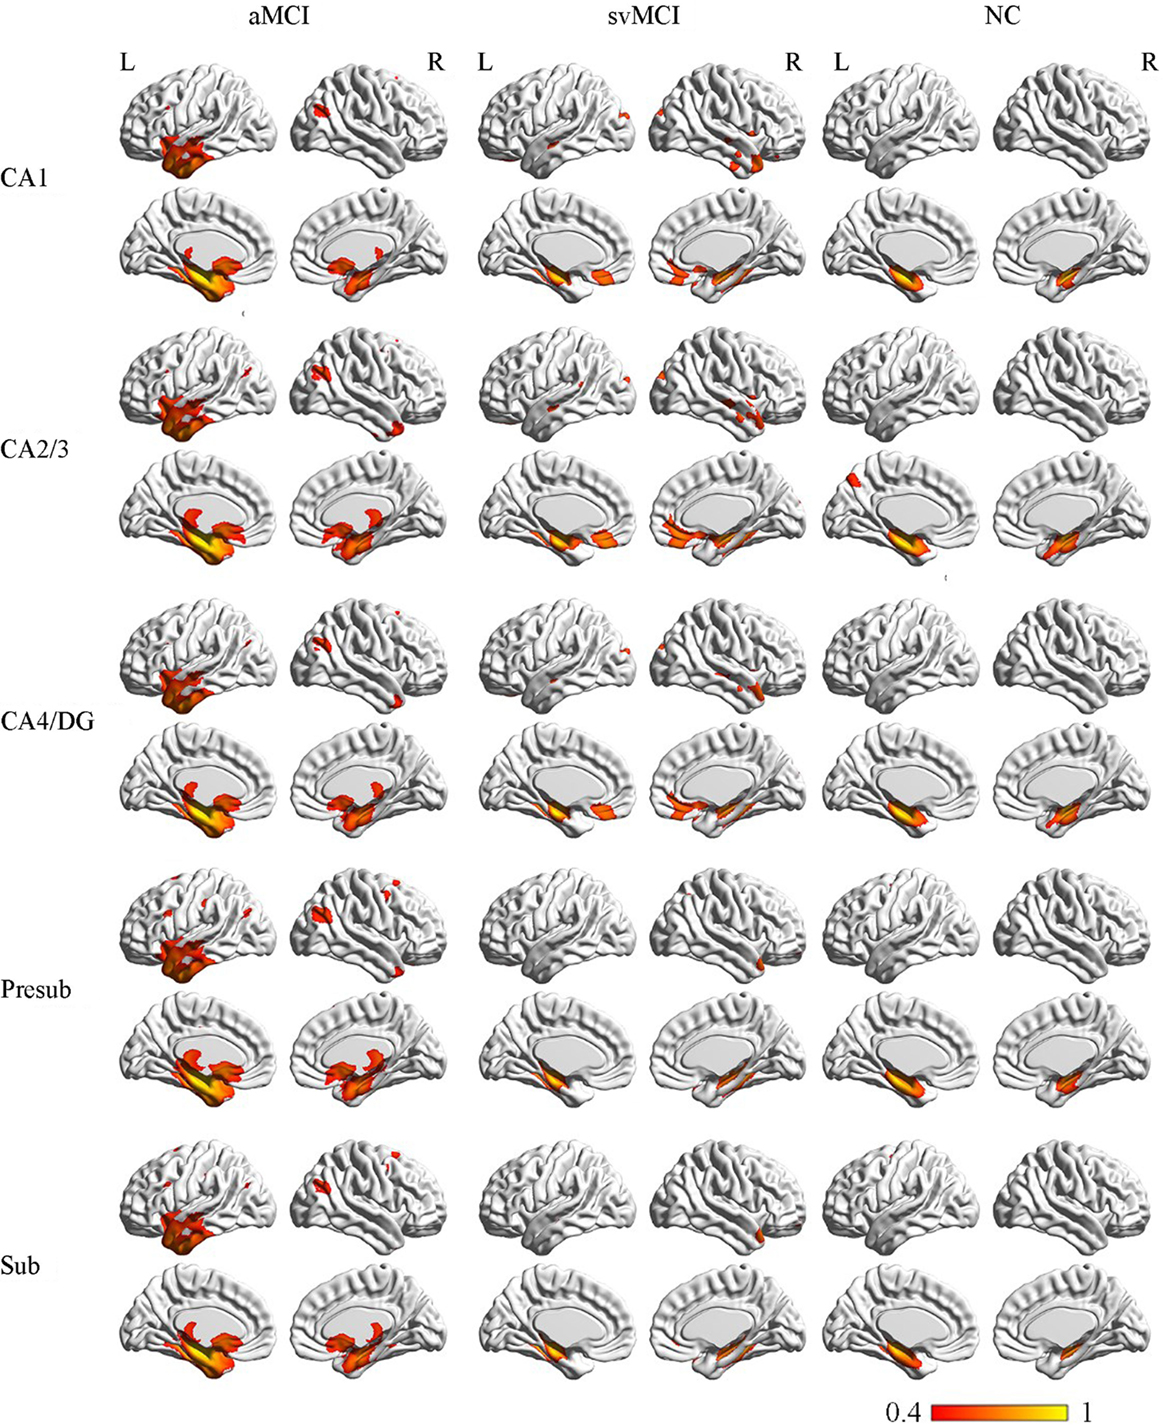
Figure 3. Structural covariance networks of left hippocampal subfields in the three groups. Statistical maps of regions significantly correlated with the seed region in each group. The results are presented as CC values (P < 0.05, false discovery rate corrected). Abbreviations: L, left; R, right; CC, correlation coefficient; NC, normal controls; svMCI, vascular mild cognitive impairment; aMCI, amnestic mild cognitive impairment; CA, cornu ammonis; DG, dentate gyrus; Presub, presubiculum; Sub, subiculum.
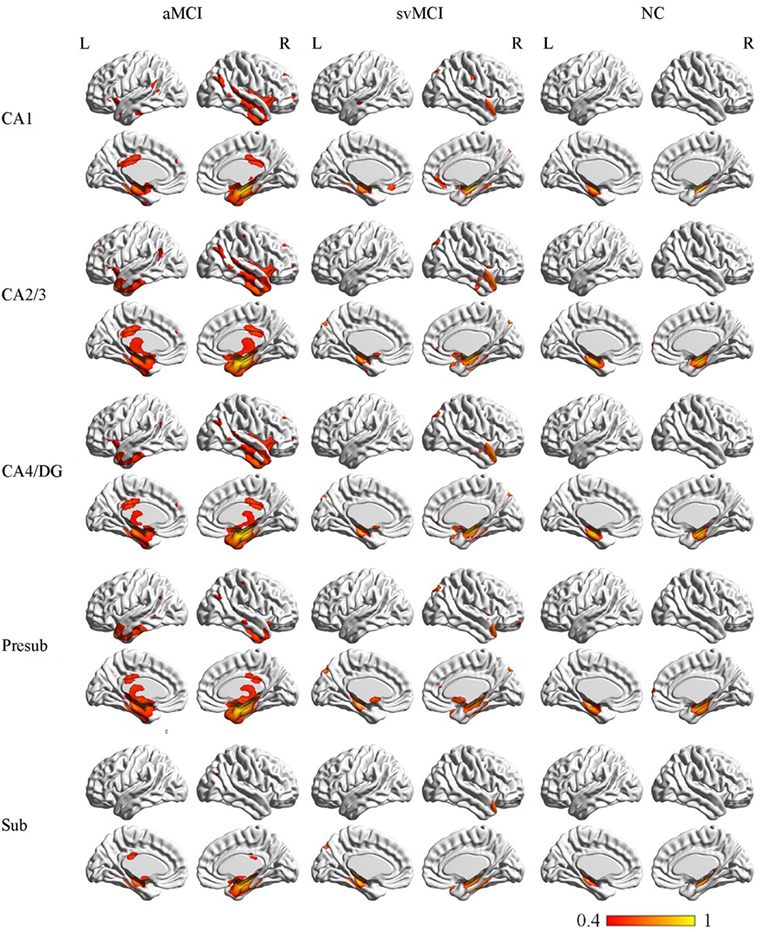
Figure 4. Structural covariance networks of right hippocampal subfields in the three groups. Statistical maps of regions significantly correlated with the seed region in each group. The results are presented as CC values (P < 0.05, false discovery rate corrected). Abbreviations: L, left; R, right; CC, correlation coefficient; NC, normal controls; svMCI, subcortical vascular mild cognitive impairment; aMCI, amnestic mild cognitive impairment; CA, cornu ammonis; DG, dentate gyrus; Presub, presubiculum; Sub, subiculum.
Left
In the aMCI group, in addition to the ERC and FFG, the left CA1 covaried with the left temporal pole (TP), right angular gyrus, subcallosal cortex, and thalamus. For the left CA2/3 network, the structural maps involved the ERC and FFG, subcallosal cortex, thalamus, and angular gyrus. The left CA4/DG correlated regions were similar to the regions in the left CA2/3 network in the aMCI group, but it additionally included the right superior frontal gyrus. For the aMCI group, the left subiculum and left presubiculum covariance maps involved the left TP, subcallosal cortex, thalamus, superior and middle frontal gyrus, right middle occipital gyrus, and bilateral angular gyrus.
Right
In the aMCI group, the right CA1 covaried with the ERC and FFG, right TP, PCC, and angular gyrus. CA2/3 showed significant correlation with entorhinal areas, thalamus, bilateral TP, middle frontal gyrus, PCC, and angular gyrus. The CA4/DG correlated regions were similar to the regions covaried with the right CA2/3 subfield in the aMCI group. For the right presubiculum networks, the covariance maps of the right presubiculum involved entorhinal areas, thalamus, bilateral TP, PCC, and angular gyrus. The subiculum showed significant covariance with the ERC, FFG, and right angular gyrus.
Left
The left CA1 showed significant correlations with the ERC, FFG, superior occipital gyrus, orbitofrontal cortex (OFC), and right TP in the svMCI group. The covariance maps of the left CA2/3 involved the FFG, right TP, OFC, occipital pole, and entorhinal areas in the svMCI group. The left CA4/DG covariance maps were similar to the covariance maps of the left CA2/3 in the svMCI group. In the svMCI group, the maps of the left presubiculum and left subiculum were virtually identical, and the covaried regions included the FFG, ERC, fusiform, and right TP.
Right
The right CA1 covaried with the ERC, FFG, superior occipital gyrus, right TP, and OFC in the svMCI group. The right CA2/3 covaried with entorhinal areas, right TP, and superior occipital gyrus. The right CA4/DG covaried with entorhinal areas, fusiform, right TP, superior occipital gyrus, and subcallosal cortex. The regions covaried with the right presubiculum were similar to those regions connected with the right CA4/DG subfield in the svMCI group. In addition, the covariance maps of the right subiculum hippocampal subfields involved entorhinal areas, fusiform, right TP, and superior occipital gyrus.
Left
The left CA1 covaried with the bilateral ERC and FFG in the NC group. In addition to the ERC and FFG, the covariance regions with the left CA2/3 also included the left precuneus cortex. The left CA4/DG covariance maps were extremely similar to the maps of the left CA1 subfield in the NC group. For the left subiculum and left presubiculum networks, both covariance maps involved the left precentral gyrus, FFG, and ERC in NC subjects.
Right
The right CA1 covaried with the ERC and FFG in the NC group. In addition to the ERC and FFG, the covariance regions with the right CA2/3 also involved the right OFC. The right CA4/DG correlated regions included the ERC and FFG in the NC group. The right presubiculum showed significant correlations with the right OFC, FFG, and ERC in NC subjects. The right subiculum covaried with the ERC and FFG.
There were some significant differences observed between the aMCI group and NC group when the strength of the structural correlations was considered (Table 2; Figure 5). There was a significant increased association between the hippocampal subfields and other brain regions that was found in the aMCI group compared to the NC group. The left CA1, left CA4/DG, left presubiculum, and left subiculum showed increased covariance with the left pole in the aMCI group compared to NC. In addition, increased significant covariance was found between the left CA1/left subiculum and left postcentral gyrus (POG), right CA2/3 and right middle/inferior temporal gyrus (ITG), and right CA1 and left angular gyrus in the aMCI group compared to the NC group.
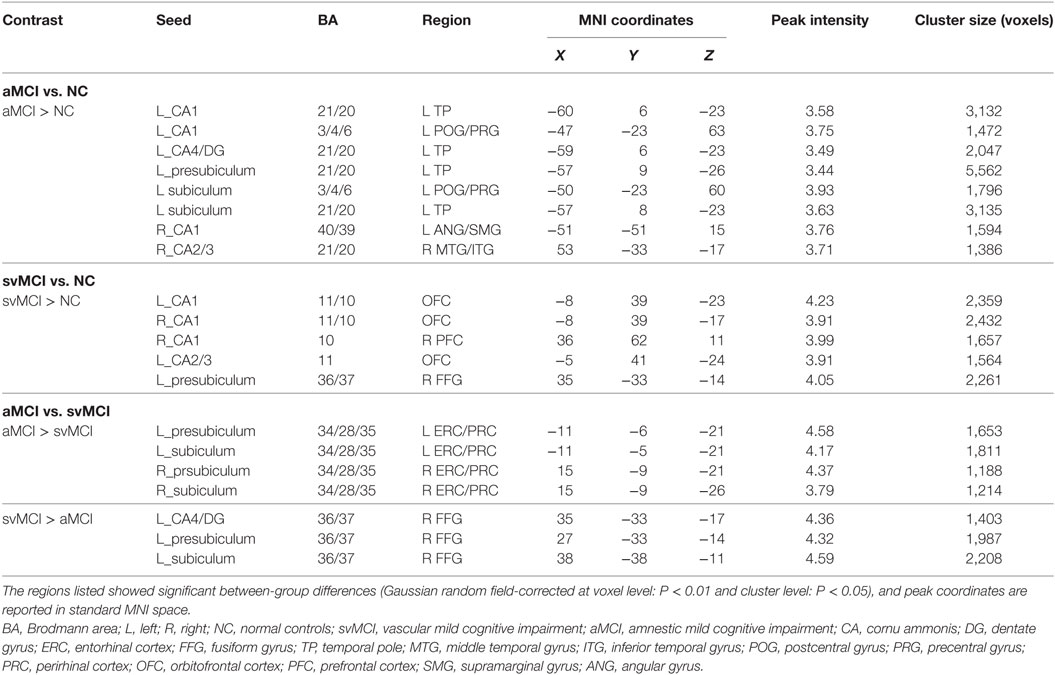
Table 2. Significant between-group differences in structural association between selected regions of interest and other cortical areas.
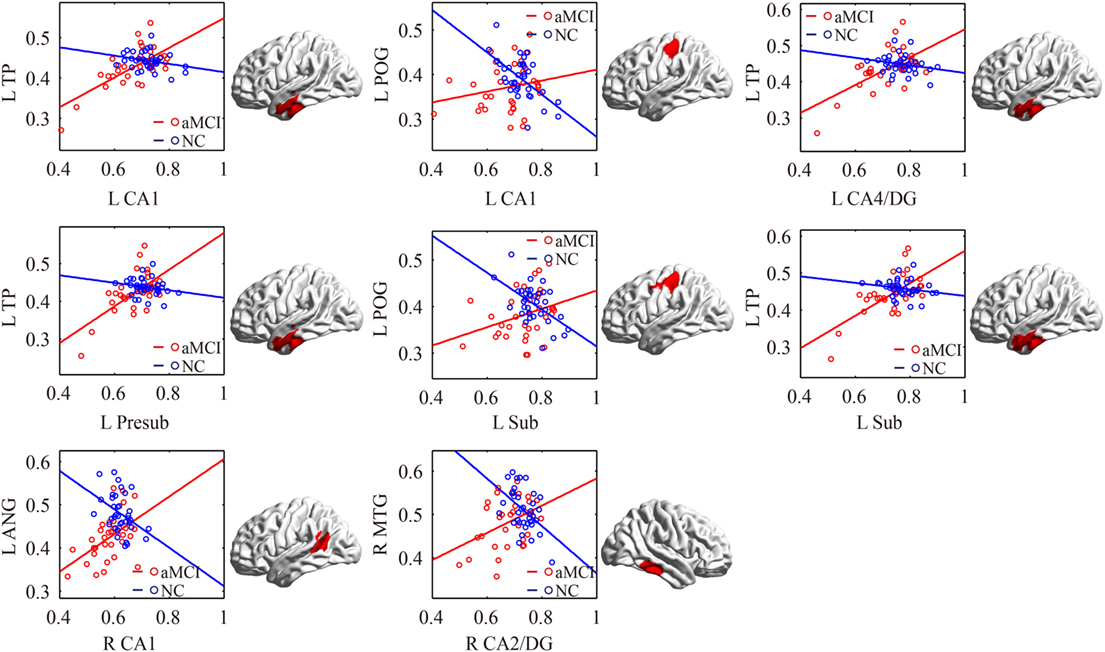
Figure 5. Significant between-group differences in structural association for aMCI and NC. A cluster showing significant structural difference (Gaussian random field-corrected at voxel level: P < 0.01 and cluster level: P < 0.05) between aMCI and NC is presented on the right, and a plot of slope differences between the seed region and cluster region is presented on the left. Abbreviations: L, left; R, right; NC, normal controls; aMCI, amnestic mild cognitive impairment; CA, cornu ammonis; DG, dentate gyrus; Presub, presubiculum; Sub, subiculum; TP, temporal pole; POG, postcentral gyrus; ANG, angular gyrus.
The significant differences of the association slope between the svMCI group and the NC group are shown in Table 2 and Figure 6. There were significant increased associations between the bilateral CA1/left CA2/3 and OFC in the svMCI group compared to the NC group. Then, the left presubiculum showed increased covariance with the right FFG in the aMCI group relative to the svMCI group. The right CA1 showed increased covariance with the right prefrontal gyrus in the svMCI group compared to the NC group.
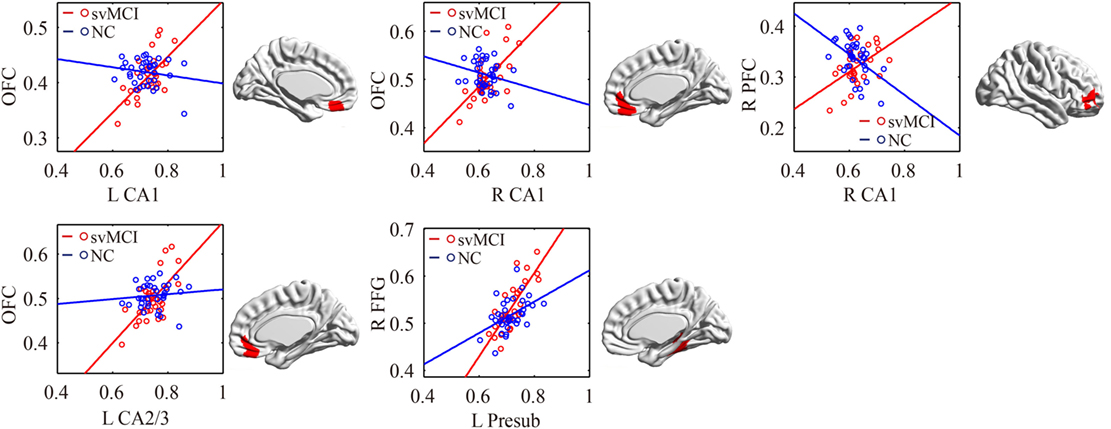
Figure 6. Significant between-group differences in structural association for svMCI and NC. A cluster showing significant structural difference (Gaussian random field-corrected at voxel level: P < 0.01 and cluster level: P < 0.05) between svMCI and NC is presented on the right, and a plot of slope differences between the seed region and cluster region is presented on the left. Abbreviations: L, left; R, right; NC, normal controls; svMCI, subcortical vascular mild cognitive impairment; CA, cornu ammonis; DG, dentate gyrus; Presub, presubiculum; Sub, subiculum; OFC, orbitofrontal cortex; PFC, prefrontal cortex; FFG, fusiform gyrus.
As shown in Table 2 and Figure 7, there were significant increased associations between several hippocampal subfields (bilateral presubiculum, bilateral subiculum) and the bilateral ERC in the aMCI group compared to the svMCI group. Then, left hippocampal subfields mostly showed decreased covariance with the right FFG in the aMCI group relative to the svMCI group.
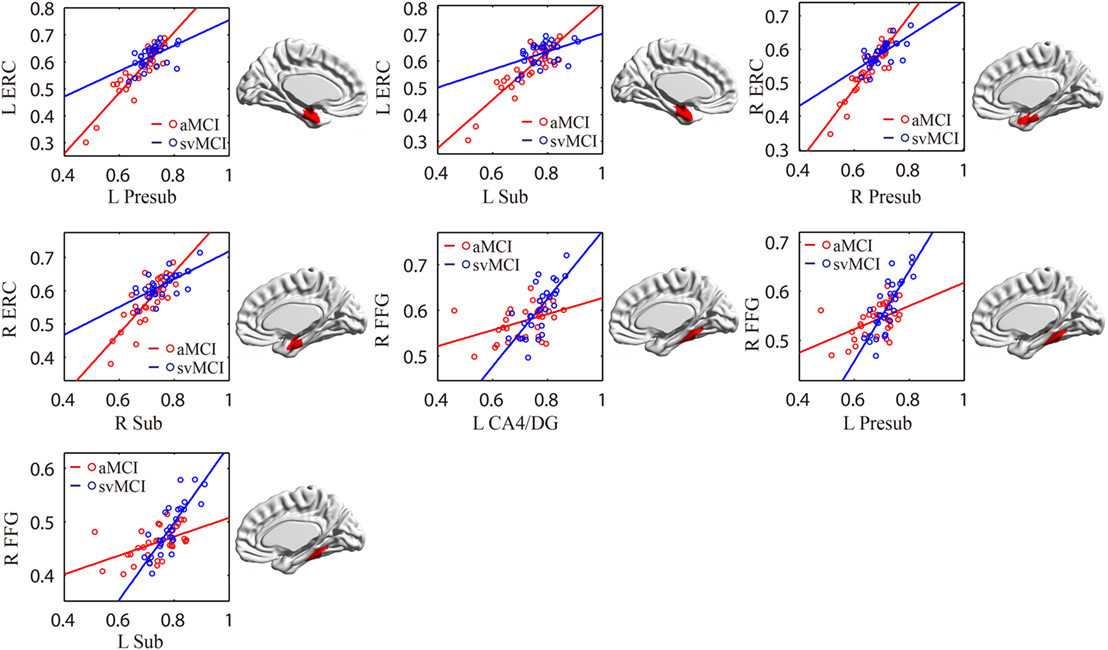
Figure 7. Significant between-group differences in structural association for aMCI and svMCI. A cluster showing significant structural difference (Gaussian random field-corrected at voxel level: P < 0.01 and cluster level: P < 0.05) is presented on the right, and a plot of slope differences between the seed region and cluster region is presented on the left. Abbreviations: L, left; R, right; aMCI, amnestic mild cognitive impairment; svMCI, subcortical vascular mild cognitive impairment; CA, cornu ammonis; DG, dentate gyrus; Presub, presubiculum; Sub, subiculum; ERC, entorhinal cortex; FFG, fusiform gyrus.
In this study, we selected hippocampal subfields as seeds to build SCNs among three groups. Specifically, hippocampal subfields correlated with the TP, thalamus, subcallosal cortex, and posterior cingula cortex in the aMCI group, while hippocampal subfields significantly covaried with the OFC in the svMCI group. Finally, we compared the differences in strength of structural covariance between groups. The results demonstrated that there were abnormal structural associations between hippocampal subfields and the cerebral cortex in aMCI and svMCI patients, and these abnormalities were different between them.
In our study, positive correlations between hippocampal subfields and FFG, and ERC in GM volume were found in each group. To some extent, these positive correlations suggested synchronous GM changes in these regions (29, 32). The ERC and FFG are anatomically adjacent to the hippocampus. Importantly, there were many intrinsic connections between the hippocampus, ERC, and FFG (7).
All the hippocampal subfields showed significantly positive structural covariance with the thalamus in the aMCI group. A previous study reported atrophy of the thalamus in aMCI patients (45). The positive structural covariance could be explained by the synchronous atrophy between the thalamus and hippocampus in the aMCI group. The subiculum and entorhinal cortices were found to project to the thalamus (1). There were many disruptions in the thalamus functional connectivity in aMCI including thalamo-hippocampus, thalamo-temporal, thalamo-visual, and thalamo-default network (46). Some cognitive impairments in aMCI, such as visual–spatial perception syndrome and visual hallucinations, may be due to thalamus atrophy and abnormalities in thalamus-related networks.
We also observed positive structural associations between the left hippocampal subfields and subcallosal cortex in the aMCI group. This suggested right subcallosal cortex atrophy in aMCI patients (47). In addition, significant correlations between cognitive scores on the episodic memory task and increased functional connectivity between the subcallosal cortex and hippocampus were found in aMCI patients (48). This indicated that the abnormal structural correlations in the subcallosal cortex could be related to the observed memory deficits in aMCI patients.
We found significantly positive structural associations between the right hippocampal subfields and PCC in the aMCI group. Many histopathological (49), structural (50), and functional imaging (51, 52) studies consistently reported that the PCC was an important structure in the pathophysiology of AD and aMCI. Importantly, the functional disconnection of hippocampal subregions and PCC may be a main factor of impaired episodic memory in aMCI (20). Because the developmental trajectory of the structural network may associate with its functional specialization (53), the abnormality between PCC and hippocampal subfields may underpin the episodic memory deficits observed in aMCI.
We observed that the increased connections between the right FFG and left presubiculum were stronger in svMCI than in the aMCI and NC groups. Previous studies have shown FFG atrophy in svMCI patients (24, 54). The FFG is related to semantic processing (55). Thus, the abnormal structural correlations between hippocampal subfields and the FFG could have an effect on the reduced capacity for semantic memory. Our results indicated that abnormality between the hippocampal subfields and FFG was distinct in svMCI, which was characterized by the main deficit of semantic memory compared to aMCI.
In the aMCI group, compared to the svMCI group, we observed an increased association between the bilateral presubiculum/subiculum and the ERC. The pathway from CA1 to the subiculum and projections to the ERC form the principal output from the hippocampus. The connections between CA1, subiculum, and ERC were associated with episodic memory processing (26). Therefore, the synchronous atrophy in the ERC and hippocampal subregions may suggest the disruption of episodic memory distinctly in aMCI patients.
The left CA1/CA4/DG/subiculum showed significantly increased structural association with the left TP in aMCI patients compared to NC. The stronger structural covariance potentially indicates synchronous GM changes in these regions affected by the disease (29). Thus, we speculate that the increased structural covariance between hippocampal subfields and the temporal gyrus suggests synchronous atrophy in the aMCI group. Several studies have shown atrophy in the temporal gyrus, especially in the medial and ITG, which supports our results (8, 56). The TP is associated with both social and emotional processes, which mainly involves face recognition and theory of mind (57). Chen et al. also indicated decreased connectivity between the middle hippocampus and middle temporal gyrus (MTG) in functional connectivity (26). We assumed that the synchronous atrophy between the hippocampus and MTG could explain the disrupted functional connectivity between them.
We also observed increased structural associations between the left CA1/subiculum and left POG in aMCI compared to NC. Left POG atrophy was reported in aMCI patients (58). Additionally, NC subjects had greater activations than aMCI patients during “Binds,” which probe object memory in the left POG, and our findings on the abnormal structural correlation with the left POG could be related to early signs of object memory deficits in aMCI patients (53).
In addition, bilateral CA1 and left CA2/3 showed significantly positive associations with the OFC in the svMCI group compared to the NC group. In addition, we found increased covariance between the right CA1 and right PFC in svMCI compared to NC. For PET imaging, the patients with svMCI showed hypometabolism in the inferior and medial frontal cortices adjacent to the cingulate gyrus (59). Importantly, the prefrontal gyrus is associated with executive function, which has a deficit in svMCI patients (60). Additionally, frontal-subcortical circuits, including hippocampus and OFC, mediate many aspects of human behavior, especially executive function (61). We assume that abnormal structural covariance between hippocampal subfields and the OFC indicates deficit of executive function in svMCI patients.
This study still has several limitations. First, we did not study the structural connectivity based on diffusion-weighted imaging (DWI) of the white matter pathway between hippocampal subfields and the whole brain cortex. There was a lack of systematic comparisons of structural covariance networks and DWI-based networks. Our findings of SCNs among the three groups should be cautiously extended to other structural networks. Second, in this study, due to the limited segmentation accuracies of hippocampal subfields in regular T1 images, we focused on the SCN analysis of each subfield instead of volumetric analysis of subfields. In the future, the volumetric analysis of hippocampal subfields would be helpful to understand the hippocampal abnormalities in the two MCI subtypes with the improvement of segmentation accuracies of hippocampal subfields in regular T1 images.
This study was approved by the medical research ethics committee and the institutional review board of Xuanwu Hospital, Capital Medical University, Beijing, China.
Conceived and designed the experiments: SL and XL. Analyzed the data: XW. Contributed reagents/materials/analysis tools: YY, YH, CY, and WZ. Wrote the paper: XW, SL, XL, QL, and YY.
The authors declare that the research was conducted in the absence of any commercial or financial relationships that could be construed as a potential conflict of interest.
This work was supported by National Natural Science Foundation of China (Grant No. 81622025, 81471731, 31371007, 81430037, 81771795 and 61633018), the Fundamental Research Funds for the Central Universities (No. YWF-17-BJ-J-11), and National Key Research and Development Program of China (No. 2016YFC1306300).
1. Amaral D, Lavenex P. Hippocampal neuroanatomy. In: Andersen P, Morris R, Amaral D, Bliss T, O’Keefe J, editors. The Hippocampus Book. New York: Oxford University Press (2007). p. 37–144.
2. Harrison PJ. The hippocampus in schizophrenia: a review of the neuropathological evidence and its pathophysiological implications. Psychopharmacology (2004) 174(1):151–62. doi:10.1007/s00213-003-1761-y
3. Kuruba R, Hattiangady B, Shetty AK. Hippocampal neurogenesis and neural stem cells in temporal lobe epilepsy. Epilepsy Behav (2009) 14(1):65–73. doi:10.1016/j.yebeh.2008.08.020
4. Hampel H, Bürger K, Teipel SJ, Bokde AL, Zetterberg H, Blennow K. Core candidate neurochemical and imaging biomarkers of Alzheimer’s disease. Alzheimer Dement (2008) 4(1):38–48. doi:10.1016/j.jalz.2007.08.006
5. Duvernoy HM. The Human Hippocampus: Functional Anatomy, Vascularization and Serial Sections with MRI. Springer Science & Business Media (2005).
6. Fanselow MS, Dong H-W. Are the dorsal and ventral hippocampus functionally distinct structures? Neuron (2010) 65(1):7–19. doi:10.1016/j.neuron.2009.11.031
7. Rajmohan V, Mohandas E. The limbic system. Indian J Psychiatry (2007) 49(2):132. doi:10.4103/0019-5545.33264
8. Whitwell JL, Shiung MM, Przybelski S, Weigand SD, Knopman DS, Boeve BF, et al. MRI patterns of atrophy associated with progression to AD in amnestic mild cognitive impairment. Neurology (2008) 70(7):512–20. doi:10.1212/01.wnl.0000280575.77437.a2
9. Li X, Li D, Li Q, Li Y, Li K, Li S, et al. Hippocampal subfield volumetry in patients with subcortical vascular mild cognitive impairment. Sci Rep (2016) 6. doi:10.1038/srep20873
10. Petersen RC, Smith GE, Waring SC, Ivnik RJ, Tangalos EG, Kokmen E. Mild cognitive impairment: clinical characterization and outcome. Arch Neurol (1999) 56(3):303–8. doi:10.1001/archneur.56.3.303
11. Petersen RC, Aisen P, Boeve BF, Geda YE, Ivnik RJ, Knopman DS, et al. Mild cognitive impairment due to Alzheimer disease in the community. Ann Neurol (2013) 74(2):199–208. doi:10.1002/ana.23931
12. Sachdev P, Kalaria R, O’Brien J, Skoog I, Alladi S, Black SE, et al. Diagnostic criteria for vascular cognitive disorders: a VASCOG statement. Alzheimer Dis Assoc Disord (2014) 28(3):206. doi:10.1097/WAD.0000000000000034
13. Murphy KJ, Troyer AK, Levine B, Moscovitch M. Episodic, but not semantic, autobiographical memory is reduced in amnestic mild cognitive impairment. Neuropsychologia (2008) 46(13):3116–23. doi:10.1016/j.neuropsychologia.2008.07.004
14. Petersen RC. Mild cognitive impairment clinical trials. Nat Rev Drug Discov (2003) 2(8):646. doi:10.1038/nrd1155
15. Visser PJ, Kester A, Jolles J, Verhey F. Ten-year risk of dementia in subjects with mild cognitive impairment. Neurology (2006) 67(7):1201–7. doi:10.1212/01.wnl.0000238517.59286.c5
16. Mendonca A, Ribeiro F, Guerreiro M, Palma T, Garcia C. Clinical significance of subcortical vascular disease in patients with mild cognitive impairment. Eur J Neurol (2005) 12(2):125–30. doi:10.1111/j.1468-1331.2004.00892.x
17. Erkinjuntti T. Subcortical ischemic vascular disease and dementia. Int Psychogeriatr (2003) 15(S1):23–6. doi:10.1017/S1041610203008925
18. Kim SH, Kang HS, Kim HJ, Moon Y, Ryu HJ, Kim MY, et al. The effect of ischemic cholinergic damage on cognition in patients with subcortical vascular cognitive impairment. J Geriatr Psychiatry Neurol (2012) 25(2):122–7. doi:10.1177/0891988712445089
19. Kwon OD. Cognitive features of vascular dementia. In: Heinbockel T, editor. Neuroscience. Rijeka, Croatia: InTech (2012). p 127–38.
20. Bai F, Liao W, Watson DR, Shi Y, Wang Y, Yue C, et al. Abnormal whole-brain functional connection in amnestic mild cognitive impairment patients. Behav Brain Res (2011) 216(2):666–72. doi:10.1016/j.bbr.2010.09.010
21. Gili T, Cercignani M, Serra L, Perri R, Giove F, Maraviglia B, et al. Regional brain atrophy and functional disconnection across Alzheimer’s disease evolution. J Neurol Neurosurg Psychiatry (2011) 82(1):58–66. doi:10.1136/jnnp.2009.199935
22. Yi L, Wang J, Jia L, Zhao Z, Lu J, Li K, et al. Structural and functional changes in subcortical vascular mild cognitive impairment: a combined voxel-based morphometry and resting-state fMRI study. PLoS One (2012) 7(9):e44758. doi:10.1371/journal.pone.0044758
23. Nowrangi MA, Lyketsos CG, Leoutsakos J-MS, Oishi K, Albert M, Mori S, et al. Longitudinal, region-specific course of diffusion tensor imaging measures in mild cognitive impairment and Alzheimer’s disease. Alzheimer Dement (2013) 9(5):519–28. doi:10.1016/j.jalz.2012.05.2186
24. Zhou X, Hu X, Zhang C, Wang H, Zhu X, Xu L, et al. Aberrant functional connectivity and structural atrophy in subcortical vascular cognitive impairment: relationship with cognitive impairments. Front Aging Neurosci (2016) 8:14. doi:10.3389/fnagi.2016.00014
25. Bai F, Xie C, Watson DR, Shi Y, Yuan Y, Wang Y, et al. Aberrant hippocampal subregion networks associated with the classifications of aMCI subjects: a longitudinal resting-state study. PLoS One (2011) 6(12):e29288. doi:10.1371/journal.pone.0029288
26. Chen J, Duan X, Shu H, Wang Z, Long Z, Liu D, et al. Differential contributions of subregions of medial temporal lobe to memory system in amnestic mild cognitive impairment: insights from fMRI study. Sci Rep (2016) 6:sre26148. doi:10.1038/srep26148
27. Mechelli A, Friston KJ, Frackowiak RS, Price CJ. Structural covariance in the human cortex. J Neurosci (2005) 25(36):8303–10. doi:10.1523/JNEUROSCI.0357-05.2005
28. Zielinski BA, Gennatas ED, Zhou J, Seeley WW. Network-level structural covariance in the developing brain. Proc Natl Acad Sci U S A (2010) 107(42):18191–6. doi:10.1073/pnas.1003109107
29. Alexanderbloch A, Giedd JN, Bullmore E. Imaging structural co-variance between human brain regions. Nat Rev Neurosci (2013) 14(5):322–36. doi:10.1038/nrn3465
30. McAlonan GM, Cheung V, Cheung C, Suckling J, Lam GY, Tai K, et al. Mapping the brain in autism. A voxel-based MRI study of volumetric differences and intercorrelations in autism. Brain (2004) 128(2):268–76. doi:10.1093/brain/awh332
31. Cardoner N, Soriano-Mas C, Pujol J, Alonso P, Harrison BJ, Deus J, et al. Brain structural correlates of depressive comorbidity in obsessive–compulsive disorder. Neuroimage (2007) 38(3):413–21. doi:10.1016/j.neuroimage.2007.07.039
32. Li X, Cao Q, Pu F, Li D, Fan Y, An L, et al. Abnormalities of structural covariance networks in drug-naïve boys with attention deficit hyperactivity disorder. Psychiatry Res (2015) 231(3):273–8. doi:10.1016/j.pscychresns.2015.01.006
33. Petersen RC. Mild cognitive impairment as a diagnostic entity. J Intern Med (2004) 256(3):183–94. doi:10.1111/j.1365-2796.2004.01388.x
34. Van Leemput K, Bakkour A, Benner T, Wiggins G, Wald LL, Augustinack J, et al. Automated segmentation of hippocampal subfields from ultra-high resolution in vivo MRI. Hippocampus (2009) 19(6):549–57. doi:10.1002/hipo.20615
35. Kühn S, Musso F, Mobascher A, Warbrick T, Winterer G, Gallinat J. Hippocampal subfields predict positive symptoms in schizophrenia: first evidence from brain morphometry. Transl Psychiatry (2012) 2(6):e127. doi:10.1038/tp.2012.51
36. Koch K, Reess TJ, Rus OG, Zimmer C. Extensive learning is associated with gray matter changes in the right hippocampus. Neuroimage (2016) 125:627–32. doi:10.1016/j.neuroimage.2015.10.056
37. Tohka J, Zijdenbos A, Evans A. Fast and robust parameter estimation for statistical partial volume models in brain MRI. Neuroimage (2004) 23(1):84–97. doi:10.1016/j.neuroimage.2004.05.007
38. Manjón JV, Coupé P, Martí-Bonmatí L, Collins DL, Robles M. Adaptive non-local means denoising of MR images with spatially varying noise levels. J Magn Reson Imaging (2010) 31(1):192–203. doi:10.1002/jmri.22003
39. Rajapakse JC, Giedd JN, Rapoport JL. Statistical approach to segmentation of single-channel cerebral MR images. IEEE Trans Med Imaging (1997) 16(2):176–86. doi:10.1109/42.563663
40. Ashburner J. A fast diffeomorphic image registration algorithm. Neuroimage (2007) 38(1):95–113. doi:10.1016/j.neuroimage.2007.07.007
41. Good CD, Johnsrude IS, Ashburner J, Henson RNA, Friston KJ, Frackowiak RSJ. A voxel-based morphometric study of ageing in 465 normal adult human brains. Neuroimage (2001) 14(1):21–36. doi:10.1006/nimg.2001.0786
42. Xia M, Wang J, He Y. BrainNet Viewer: a network visualization tool for human brain connectomics. PLoS One (2013) 8(7):e68910. doi:10.1371/journal.pone.0068910
43. Lerch JP, Worsley K, Shaw WP, Greenstein DK, Lenroot RK, Giedd J, et al. Mapping anatomical correlations across cerebral cortex (MACACC) using cortical thickness from MRI. Neuroimage (2006) 31(3):993–1003. doi:10.1016/j.neuroimage.2006.01.042
44. Li X, Pu F, Fan Y, Niu H, Li S, Li D. Age-related changes in brain structural covariance networks. Front Hum Neurosci (2013) 7(1):265–9. doi:10.3389/fnhum.2013.00098
45. Balthazar M, Yasuda C, Pereira F, Pedro T, Damasceno B, Cendes F. Differences in grey and white matter atrophy in amnestic mild cognitive impairment and mild Alzheimer’s disease. Eur J Neurol (2009) 16(4):468–74. doi:10.1111/j.1468-1331.2008.02408.x
46. Cai S, Huang L, Zou J, Jing L, Zhai B, Ji G, et al. Changes in thalamic connectivity in the early and late stages of amnestic mild cognitive impairment: a resting-state functional magnetic resonance study from ADNI. PLoS One (2015) 10(2):e0115573. doi:10.1371/journal.pone.0115573
47. Shiino A, Watanabe T, Maeda K, Kotani E, Akiguchi I, Matsuda M. Four subgroups of Alzheimer’s disease based on patterns of atrophy using VBM and a unique pattern for early onset disease. Neuroimage (2006) 33(1):17–26. doi:10.1016/j.neuroimage.2006.06.010
48. Bai F, Zhang Z, Watson DR, Yu H, Shi Y, Yuan Y, et al. Abnormal functional connectivity of hippocampus during episodic memory retrieval processing network in amnestic mild cognitive impairment. Biol Psychiatry (2009) 65(11):951–8. doi:10.1016/j.biopsych.2008.10.017
49. Rowe CC, Ng S, Ackermann U, Gong SJ, Pike K, Savage G, et al. Imaging-amyloid burden in aging and dementia. Neurology (2007) 68(20):1718. doi:10.1212/01.wnl.0000261919.22630.ea
50. Pengas G, Hodges JR, Watson P, Nestor PJ. Focal posterior cingulate atrophy in incipient Alzheimer’s disease. Neurobiol Aging (2010) 31(1):25. doi:10.1016/j.neurobiolaging.2008.03.014
51. Liang WS, Reiman EM, Valla J, Dunckley T, Beach TG, Grover A, et al. Alzheimer’s disease is associated with reduced expression of energy metabolism genes in posterior cingulate neurons. Proc Natl Acad Sci U S A (2008) 105(11):4441. doi:10.1073/pnas.0709259105
52. Sole AD, Clerici F, Chiti A, Lecchi M, Mariani C, Maggiore L, et al. Individual cerebral metabolic deficits in Alzheimer’s disease and amnestic mild cognitive impairment: an FDG PET study. Eur J Nucl Med Mol Imaging (2008) 35(7):1357–66. doi:10.1007/s00259-008-0773-6
53. Chiang HS, Mudar R, Rackley A, Venza E, Pudhiyidath A, Van JJ, et al. An early fMRI marker of semantic memory deficits in people with amnestic mild cognitive impairment. Alzheimers Dement (2013) 9(4):580–580. doi:10.1016/j.jalz.2013.05.1151
54. Li M, Meng Y, Wang M, Yang S, Wu H, Zhao B, et al. Cerebral gray matter volume reduction in subcortical vascular mild cognitive impairment patients and subcortical vascular dementia patients, and its relation with cognitive deficits. Brain Behav (2017) 7(8):e00745. doi:10.1002/brb3.745
55. Wagner AD, Schacter DL, Rotte M, Koutstaal W, Maril A, Dale AM, et al. Building memories: remembering and forgetting of verbal experiences as predicted by brain activity. Science (1998) 281(5380):1188–91. doi:10.1126/science.281.5380.1188
56. Duara R, Loewenstein D, Potter E, Appel J, Greig M, Urs R, et al. Medial temporal lobe atrophy on MRI scans and the diagnosis of Alzheimer disease. Neurology (2008) 71(24):1986–92. doi:10.1212/01.wnl.0000336925.79704.9f
57. Olson IR, Plotzker A, Ezzyat Y. The enigmatic temporal pole: a review of findings on social and emotional processing. Brain (2007) 130(7):1718–31. doi:10.1093/brain/awm052
58. Zhang H, Sachdev PS, Wen W, Kochan NA, Crawford JD, Brodaty H, et al. Gray matter atrophy patterns of mild cognitive impairment subtypes. J Neurol Sci (2012) 315(1–2):26–32. doi:10.1016/j.jns.2011.12.011
59. Seo SW, Cho SS, Park A, Chin J, Na DL. Subcortical vascular versus amnestic mild cognitive impairment: comparison of cerebral glucose metabolism. J Neuroimaging (2009) 19(3):213–9. doi:10.1111/j.1552-6569.2008.00292.x
60. Koechlin E, Summerfield C. An information theoretical approach to prefrontal executive function. Trends Cogn Sci (2007) 11(6):229–35. doi:10.1016/j.tics.2007.04.005
Keywords: hippocampal subfields, amnestic mild cognitive impairment, subcortical vascular mild cognitive impairment, structural covariance networks, MRI
Citation: Wang X, Yu Y, Zhao W, Li Q, Li X, Li S, Yin C and Han Y (2018) Altered Whole-Brain Structural Covariance of the Hippocampal Subfields in Subcortical Vascular Mild Cognitive Impairment and Amnestic Mild Cognitive Impairment Patients. Front. Neurol. 9:342. doi: 10.3389/fneur.2018.00342
Received: 11 December 2017; Accepted: 30 April 2018;
Published: 22 May 2018
Edited by:
HuaLin Cai, Central South University, ChinaReviewed by:
Ricardo Insausti, Universidad de Castilla-La Mancha, SpainCopyright: © 2018 Wang, Yu, Zhao, Li, Li, Li, Yin and Han. This is an open-access article distributed under the terms of the Creative Commons Attribution License (CC BY). The use, distribution or reproduction in other forums is permitted, provided the original author(s) and the copyright owner are credited and that the original publication in this journal is cited, in accordance with accepted academic practice. No use, distribution or reproduction is permitted which does not comply with these terms.
*Correspondence: Shuyu Li, c2h1eXVsaUBidWFhLmVkdS5jbg==;
Changhao Yin, eWluY2hhbmdoYW83OTE2QHNpbmEuY29t;
Ying Han, aGFueWluZ0B4d2guY2NtdS5lZHUuY24=
†These authors have contributed equally to this work.
Disclaimer: All claims expressed in this article are solely those of the authors and do not necessarily represent those of their affiliated organizations, or those of the publisher, the editors and the reviewers. Any product that may be evaluated in this article or claim that may be made by its manufacturer is not guaranteed or endorsed by the publisher.
Research integrity at Frontiers
Learn more about the work of our research integrity team to safeguard the quality of each article we publish.