- 1Southwest Eye Hospital, Southwest Hospital, Third Military Medical University (Army Medical University), Chongqing, China
- 2Key Laboratory of Visual Damage, Regeneration and Restoration of Chongqing, Chongqing, China
The inflammatory microenvironment in the retina plays a vital role in the pathogenesis and progression of retinitis pigmentosa (RP). Microglial inflammatory cytokines production leads to gliosis and apoptosis of retinal neurons, and ultimately, visual loss. Cell-based therapies using grafted olfactory ensheathing cells (OECs) have demonstrated modulation of degenerative microenvironments in the central nervous system (CNS), in a number of animal models. However, mechanisms by which grafted OECs can reduce degeneration in the retina are not well understood. In the present study, we set up an in vitro OEC/BV2 microglia co-culture system, and an in vivo royal college of surgeons (RCS) rat model, used cell transplantation, immunohistochemistry, RT-PCR, western blot to explore the mechanisms by which OECs affect expression of pro- or anti-inflammatory cytokines and polarization of M(IL-6) and M(Arg1) type microglial activation in the retina. We found that compared with the LPS (Lipopolysaccharide) and olfactory nerve fibroblast (ONF), the OEC and BV2 co-culture group modulate microglial cytokines releasing toward the anti-inflammation, and away from the pro-inflammation, which was followed by higher IL-4 and IL-10 and lower TNF-a and IL-6 in their expression levels. In vivo, the transplantation group significantly reduced activated resident microglia/infiltrated macrophage, and expression of pro-inflammatory cytokines in RCS rats retina, increased anti-inflammatory cytokines in transplantation area. Additionally, we found that OECs expressed SOCS3 and down-regulated the JAK2/STAT3 (Janus Kinase 2/Signal Transducer and Activator of Transcription 3) pathway. Thirdly, OEC transplantation reduced Caspase-3 expression, protected inner retinal neurons and photoreceptors and therefore, delayed the visual function degeneration. In conclusion, our data suggest that OECs delay retinal degeneration in RP, at least in part through immunomodulation of microglia via the JAK/STAT pathway.
Introduction
Retinitis pigmentosa (RP) is a heterogeneous group of inherited retinal degenerative diseases, which lead to photoreceptor cell apoptosis and severe vision loss. Photoreceptor degeneration starts from microglial activation, macrophage infiltration, and accumulation of immunoglobulins and complement, which result in sustained inflammation, macroglia proliferation and progressive apoptosis of retinal neurons (Athanasiou et al., 2018; Ben et al., 2019). Therefore, modulation of microglia activation and inflammatory reaction might be a potential intervention for RP.
In royal college of surgeons (RCS) rats with Mertk gene mutation of retinal pigmented epithelium (RPE), microglia become activated, and infiltrate into the outer nuclear layer (ONL), to assist with phagocytosis of photoreceptor debris (Zou et al., 2019). As retinal degeneration continues, blood-retinal barrier (BRB) disruption results in the recruitment of blood-borne macrophages. This is an important step in activating the immune cells and releasing pro-inflammatory cytokines, which amplify the disease process, and leading to photoreceptor apoptosis (Kyger et al., 2013). Studies have already shown that blood-derived immune cells are an important component of the disease-associated microenvironment, and they are considered to be critical mediators of neurodegenerative disease progression, not only in CNS but also in retina (Xu et al., 2009; Sevenich, 2018).
Microglia, resident immune population of the retina, are react to injury as specialized scavengers by promote, and resolve inflammation (Ramirez et al., 2017). In the central nervous system (CNS), resident (microglia) and invading innate immune cells (macrophage) coordinated complex responses to injury, and aiming to restore tissue integrity but can also promote destructive neuroinflammation (Wohleb, 2016; Subramaniam and Federoff, 2017). There are two main microglial/macrophage phenotypes (characterized by morphology, cytokine/chemokine expression, and function). The classically activated phenotype, promotes inflammation by releasing numerous pro-inflammatory cytokines (e.g., IL-6, TNF-α, and MCP), as means of M(IL-6). The alternatively activated phenotype promotes tissue repair and regeneration, by releasing protective/trophic factors (e.g., Arg1, IL-4, and IL-10), and clearing cellular waste debris through phagocytosis, as means of M(Arg1) (Ransohoff, 2016; Edholm et al., 2017). This M(IL-6)/M(Arg1) paradigm has been used to describe the in vitro perturbation of macrophages, yet there is evidence that microglia can adopt similar phenotypes, and functions in vivo (Hu et al., 2015). Due to these opposing effects of different immune cell phenotypes, recent treatment for neuroinflammation are shifting from complete immune cell suppression to find a balance between M(IL-6)/M(Arg1) phenotypes and searching regulatory molecules that control the two phenotypes polarization switching (Neves et al., 2016).
Several studies in animal models of neurodegenerative disease, including Alzheimer’s disease (Biscaro et al., 2012), Parkinson’s disease (Garrido-Mesa et al., 2013) and RP (Peng et al., 2014), have shown that anti-inflammatory therapies, such as minocycline, have neuroprotective properties. However, the duration of action of minocycline is only 5–10 days, and there is therefore considerable interest in developing a cell-based therapy, which can provide sustained modulation of the inflammatory microenvironment in the degenerative retina (Neves et al., 2016; Zhu et al., 2017).
Olfactory ensheathing cells (OECs) are a unique type of glial cell, which share some features and functions with Schwann cells and astrocytes (Li et al., 1997). OECs have been demonstrated to facilitate glial scar rearrangement, blood vessel formation, axon remyelination, and phagocytosis of cellular debris and pathogens (Chuah et al., 2011; Huo et al., 2012). Microarray analysis of the OEC transcriptome indicates that they express higher levels of a number of innate immune factors, compared to astrocytes and Schwann cells, suggesting an enhanced role in modulating immune cells and neuroinflammation (Vincent et al., 2005). Khankan et al. (2016) suggest that grafted OECs reduce macrophage infiltration, maintain serotonergic (5-HT) axons, and reduce inhibitory chondroitin sulfate proteoglycans (CSPGs) in injured rodent spinal cord, leading to the restoration of motor function. Zhang et al. (2017) have shown that OEC transplantation reduces inflammatory cell infiltration in spinal cord injury, and promotes a shift in the macrophage phenotype from M(INF-γ) to M(IL-4). Although microglial phenotype switching is not fully understood, there is thought to be an important role for the JAK/STAT (janus kinase/signal transducer and activator of transcription) pathway and some binding proteins, which may accelerate the pace of immune cell suppression, and toward rebalance M(IL-6)/M(Arg1) activity (Hu et al., 2015). In retina, some studies have reported a dynamic shift in microglia changing profile of recognized M(IL-6)- to M(Arg1)- following acute light damage (Jiao et al., 2015). In rd1 mice, the microglia orchestrate a continuous spectrum which is activated and polarized to a M(IL-6) phenotype during acute retinal degeneration (Zhou et al., 2017). Recent work has shown that the JAK/STAT pathway is central to the determination of M(IL-6) vs. M(Arg1) microglial subtypes (Sica and Bronte, 2007). Upon binding to JAK, members of the IL-6 family of cytokines activate the JAK/STAT signaling pathway (Tam and Ma, 2014; Hu et al., 2015; Qin et al., 2016). It has also been demonstrated that transplanted OECs promote neurological functional recovery in traumatic brain-injured rats via the JAK/STAT3 pathway (Fu et al., 2015).
Our previous research has found that there is microglial activation in the degenerative period of RCS rat retina (Liu et al., 2013; Li et al., 2016). However, as BRB breakdown and macrophages infiltrate into the retina during retinal degeneration (Shen et al., 2010; de Hoz et al., 2016), neither the polarization of resident microglia, and its effect in RCS rat, nor the ways to regulate this polarization, has ever been investigated.
In this study, we investigated the effect of OECs on activated microglia in an in vitro co-culture system. Co-culture of OECs with BV2 cells (an immortalized microglial cell line) reduced lipopolysaccharide (LPS)-induced microglial activation and produced microglial polarization toward the M(Arg1) phenotype. Immunofluorescent staining showed OECs were SOCS3 positive. These microglial modulation effects of OECs may mediated by downregulation of the JAK2/STAT3 signaling pathway. We also used a rodent model of inherited retinal inflammation and degeneration (RCS rat) to study the in vivo effect of OEC implantation into the retina, during the chronic stages of the disease process. Immunohistochemical data, and gene and protein quantification, demonstrated that OEC transplantation delayed the degeneration of retinal neurons and photoreceptors via an anti-apoptotic mechanism, inhibited microglial/macrophage activation, and reduced pro-inflammation cytokines, by down-regulating the JAK2/STAT3 pathway. These results further confirm that microglial activation and a pro-inflammatory environment play a pivotal role in the retinal degeneration of RCS rats, and that OEC transplantation can preserve visual function partly through regulating the microglia-mediated inflammatory environment.
Materials and Methods
Animal Models and Ethical Approval
We used black-eyed RCS rats as a model of retinal dystrophy, and “rdy” rats as non-retinal dystrophic controls; both supplied by the Animal Centre of the Third Military Medical University (TMMU). Rats were maintained in the animal facility of the Southwest Eye Hospital, the TMMU. Housing rooms had regular day and night light-cycles (12:12 h). All rats were sacrificed using a carbon dioxide inhalation chamber. All surgical procedures and post-operative care were conducted in accordance with protocols approved by the TMMU Institutional Animal Care and Use Committee.
Chemicals and Reagents
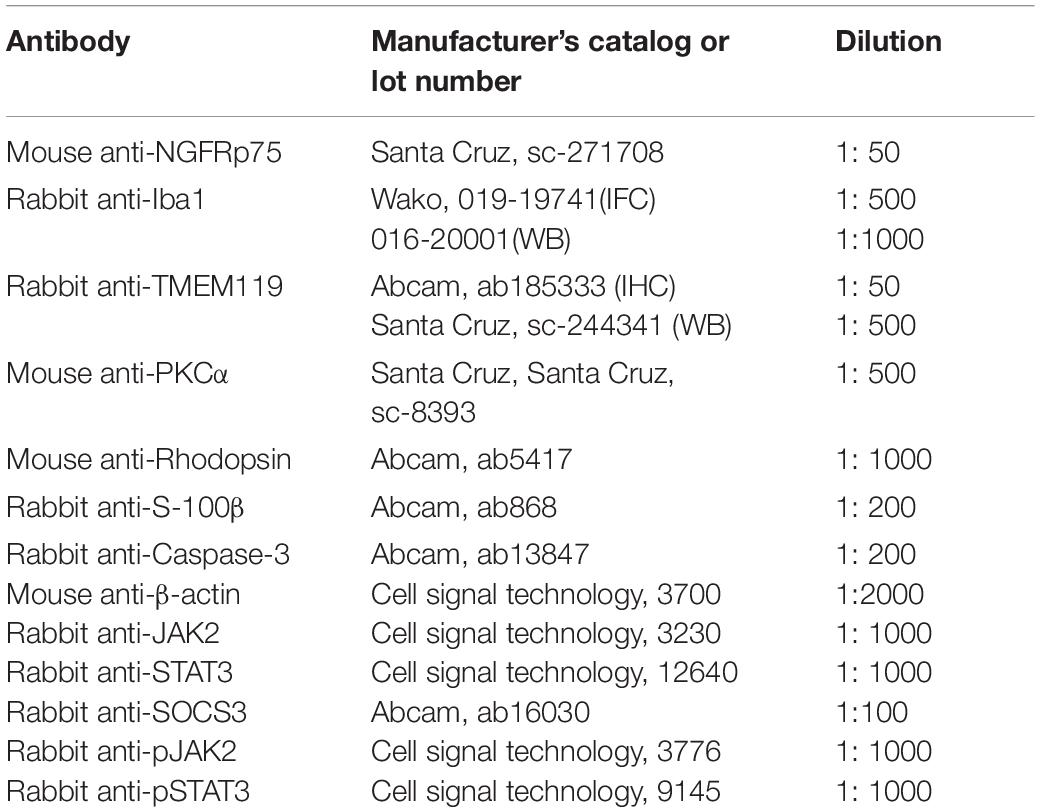
Fetal bovine serum (FBS), Dulbecco’s modified Eagle’s medium/Ham’s Nutrient Mixture (DMEM/F12 plus GlutaMAX), Hank’s balanced salt solution (HBSS), phosphate buffer (PBS), and other cell culture reagents were obtained from Thermo-Fisher Corporation (Beijing, China). Trypsin and penicillin/streptomycin solutions were obtained from Hyclone (Bejing, China). Lipopolysaccharide (LPS), 2-cyano-3 (3,4-dihydroxyphenyl)N-(benzyl)2-propenamide (Tyrphostin AG490), poly-L-lysine (PLL), and pentobarbital sodium were purchased from Sigma-Aldrich (Shanghai, China). Glyceraldehyde-3-phosphate dehydrogenase (GAPDH) and primers were purchased from Thermo Fisher Scientific. The primary and secondary antibodies used for immunohistochemistry and WB are listed in Table 1.
Primary OEC and ONF Culture and Purification
The olfactory bulbs of adult control rats were used to harvest OECs and olfactory nerve fibroblasts (ONFs, for use as a negative control), and we used differential cell adhesiveness to purify OECs and ONFs (Huo et al., 2011; Dai et al., 2012; Xie et al., 2017). Briefly, olfactory bulbs were removed and put into a 10 mm dish. After carefully isolated of the pia mater and vascular membrane, the olfactory glomerular layers and nerve layer were separated. The nerve layer was cut into 0.5 mm3 pieces, placed in 0.125% trypsin to digest for 15 min at 37°C. The cells were cultured with DMEM/F-12 containing 10% FBS and 1% penicillin/streptomycin and inoculated into a six-well plate coated with PLL. Culture medium were first changed for the 5th day, and then changed every 3 days until 2 weeks. After several cycles of differential cell adhesiveness, OECs, and ONFs were easily separated. OECs or ONFs were dissociated into suspension and then labeled with lentiviruses carrying the enhanced green fluorescent protein (LV-EGFP) prior to subretinal transplantation. The production, purification and infection of LV-EGFP was according to previous reports (Xie et al., 2017).
Culture of BV2 Microglia
BV2 murine microglial cell line was given by Dr. Guo from the Neurological Surgery Department of Southwest Hospital. Cells were seeded into six-well plates at a concentration of 105 cells/well in DMEM containing 10% FBS and 1% penicillin/streptomycin, as previously described (Li et al., 2016).
Co-culture of OEC or ONF Cells With BV2 Microglia Cells
The co-culture experimental design is shown in Figure 1. We maintained the BV2 mouse microglia cell line in six-well plates (10,000 cells each). To induce BV2 cell reactivity we used 1 μg/ml of LPS diluted in basal medium for 4 h. OECs or ONFs were seeded into Transwell plate inserts (Millipore) (10,000 cells each). BV2 cultures were co-cultured with the OECs for 24 h (or ONFs as a negative control) to explore their role in immune modulation. To study the role of the JAK/STAT signaling pathway in OECs, the JAK2 antagonist Tyrphostin AG490 (50 μm) (Ito et al., 2010; Hou et al., 2017) was added to the OEC culture 1 h before co-culture with BV2 cells, in relevant experiments.
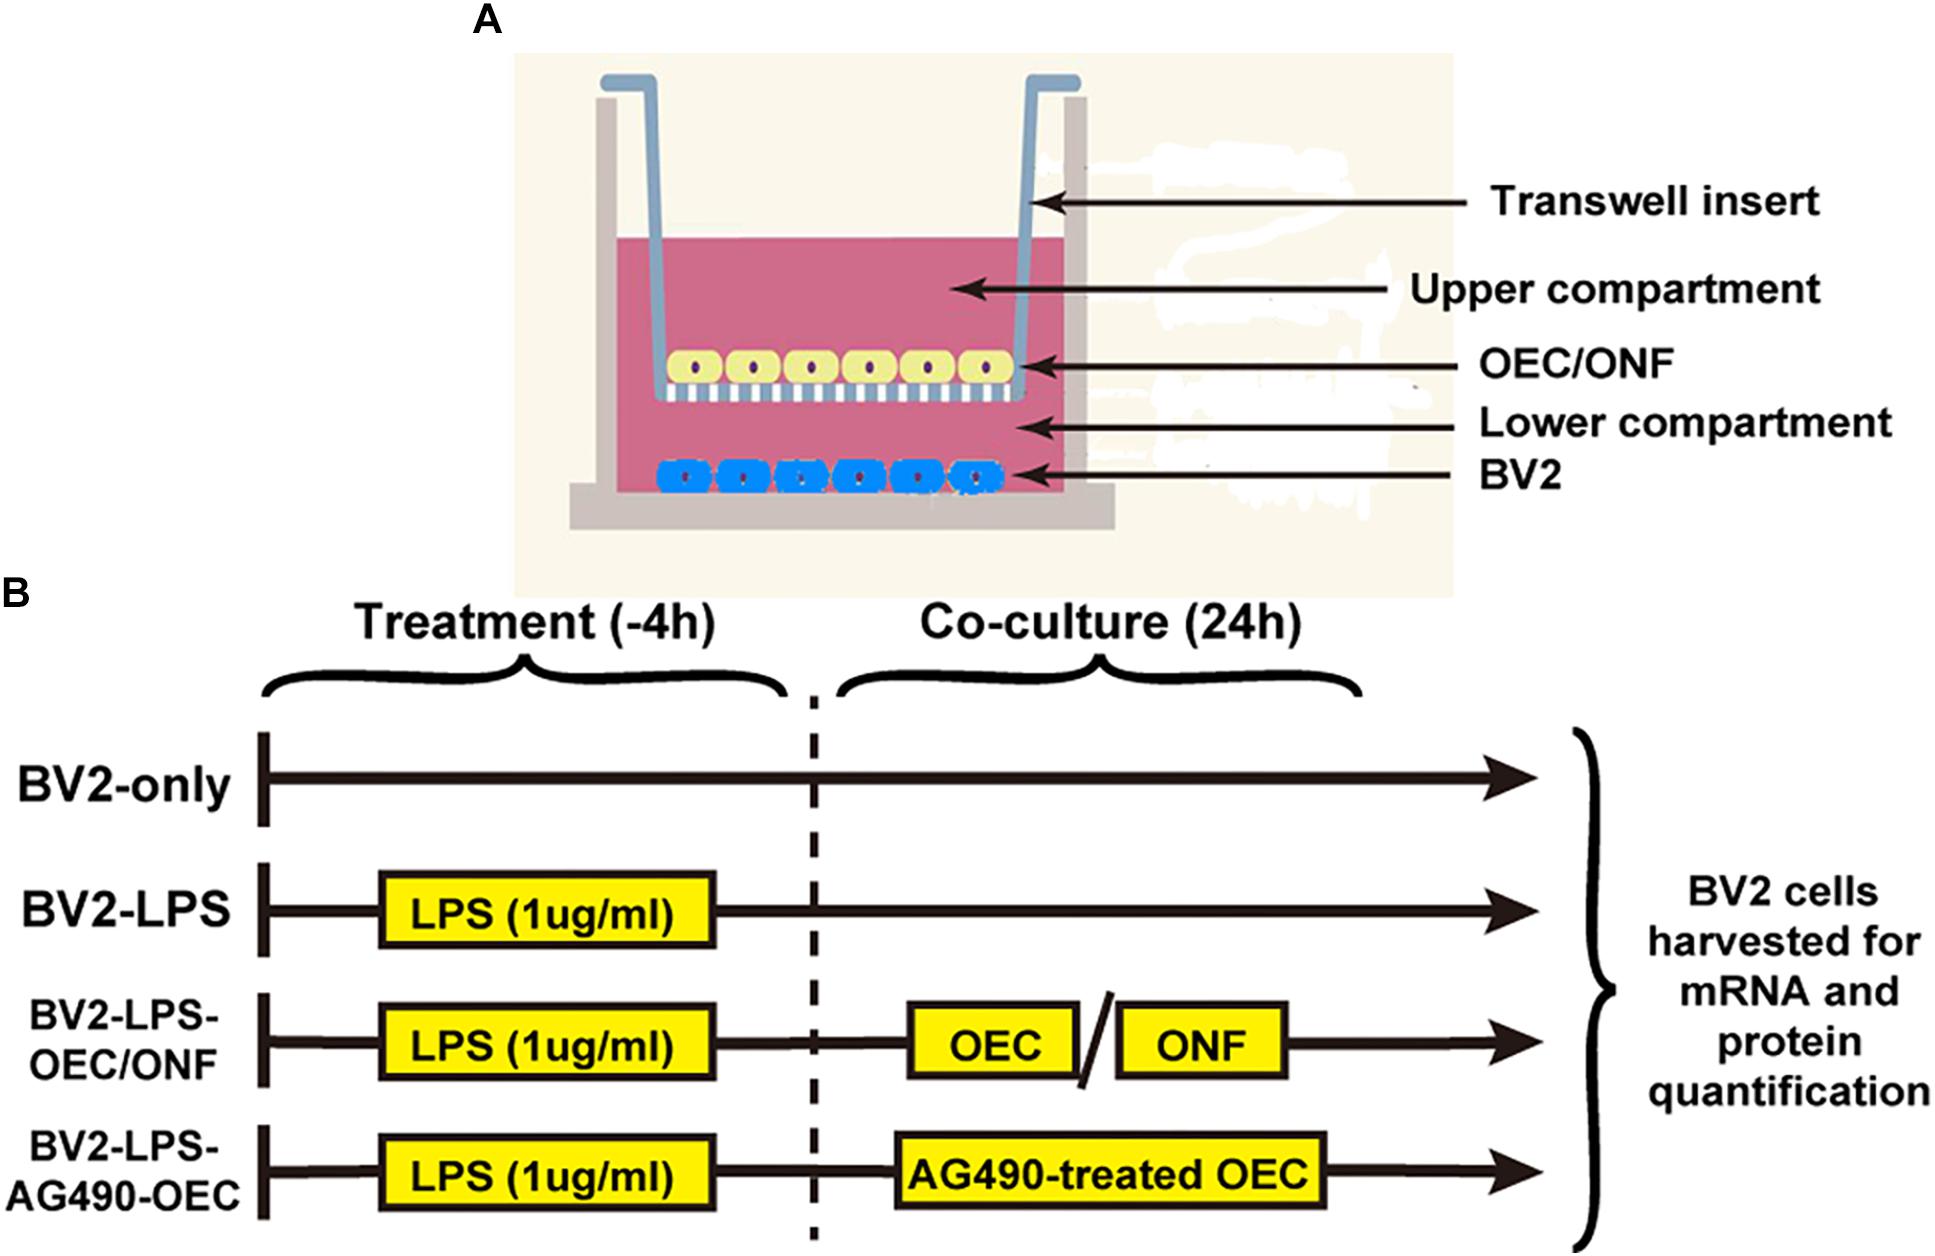
Figure 1. Design of the in vitro co-culture experiment. (A) Schematic illustrating the co-culture system, with a Transwell insert hanging in each well of a six-well plate. (B) Experimental schedule. AG490-OECs are OECs that have been pre-treated for 1 h with AG490 (a JAK2 antagonist) prior to co-culture.
Subretinal Injection
After purification, OECs or ONFs were separately detached and implanted into the subretinal space of P30d RCS rats, as previously described (Xie et al., 2017). Briefly, we exposed the temporal part of the sclera, and a 30G needle was used to reach the subretinal space by incision of the sclera, choroid, and retinal pigment epithelium. A Hamilton syringe with a 33G needle was attached to the choroid layer and slowly injected 105 cells (in 3 μl PBS) into the subretinal space of the right eye. The contralateral eye was injected 3 μl PBS with the same surgical procedures. When the fundus was observed, we could see a white flat detachment of the retina at the transplantation site.
Electroretinogram (ERG)
Electroretinogram recordings were performed as previously described (Dai et al., 2017; Xie et al., 2017). We dark-adapted rats for 12 h, and prepared under dim red light. Compound tropicamide eye drops were used to dilate pupils. Before recording, artificial tears was applied to allow the platinum recording electrode contact with the cornea and also prevent dehydration. The needle electrode was fixed under the skin of both sides of the rat’s nasal side as a reference electrode, while the ground electrode was placed under the tail. The signal amplifier bandwidth was 0.1–300 Hz, without notch filtering. “RETI-port” software was used to acquire and control stimulus delivery data, running on Roland Electrophysiological Systems hardware (Brandenburg, Germany). The amplitude of the a-wave of ERG was calculated from the baseline to the first trough, and the amplitude of the b-wave was from the trough of the a-wave to the first peak. To improve the signal-to-noise ratio, the inter-stimuli-intervals were longer than 30 s.
Tissue Sample Preparation
For immunofluorescence staining, we firstly intramuscular injection of pentobarbital sodium (10 mg/kg), and then used normal saline and 4% paraformaldehyde (PFA) to transcardially perfused rats. After taking out the eyeball, the cornea, iris, lens were removed, and the eyecups were put in 4% PFA at 4°C for 0.5 h, then dehydrated in a 30% sucrose solution at 4°C overnight. Sections (10 μm thick) were cut using a freezing microtome (Leica, Germany) at −20°C, then air-dried overnight at 25°C, and stored at −20°C for further immunofluorescence staining. For WB and PCR analysis, rats were transcardially perfused with normal saline and retinas were rapidly removed, immediately frozen in liquid nitrogen, and stored at −80°C for further study.
Immunofluorescence Staining
Olfactory ensheathing cells and BV2 cells were plated on PLL-treated cover slips. Following each treatment, cells were fixed in 4% PFA for 10 min and rinsed with PBS for three times. Cover slips and sections were permeabilized with 0.03% Triton X-100 for 10 min, and then blocked with 1% goat serum for 0.5 h at 37°C. Cover slips and sections were incubated in primary antibodies at 4°C overnight (Table 1 showed primary antibody dilutions). After washing off the primary antibody with PBS, secondary antibodies (1:1000; Invitrogen, United States) were applied at 37°C in the dark for 0.5 h. 4′,6-diamidino-2-phenylindole (DAPI) (Beyotime, China) was used to counterstain nuclei for 10 min in the dark at room temperature. Sections were washed in PBS for three times, and mounted using anti-fade mounting medium (Beyotime, China). Leica SP5 microscope was used to take confocal micrograps at the Central Laboratory in TMMU (Leica Microsystems, Wetzlar, Germany).
RNA Extraction and Real-Time PCR
Real-time polymerase chain reaction (RT-PCR) was implemented as previously described (Fu et al., 2017; He et al., 2017). Briefly, Trizol reagent (Sigma-Aldrich) was used to extract total RNA according to the manufacturer’s instructions, and then reverse transcribed with an oligo (dT) primer. Sybr Primix EX TaqTM II and a Takara Thermal Cycler DiceTM Real Time System (Takara Bio Inc. Kusatsu, Shiga, Japan) was used to perform Real-time PCR amplification, according to the manufacturer’s protocols. The selected primers are listed in Tables 2, 3. All the data were normalized to GAPDH expression. The experimental groups were then normalized to control groups expression.
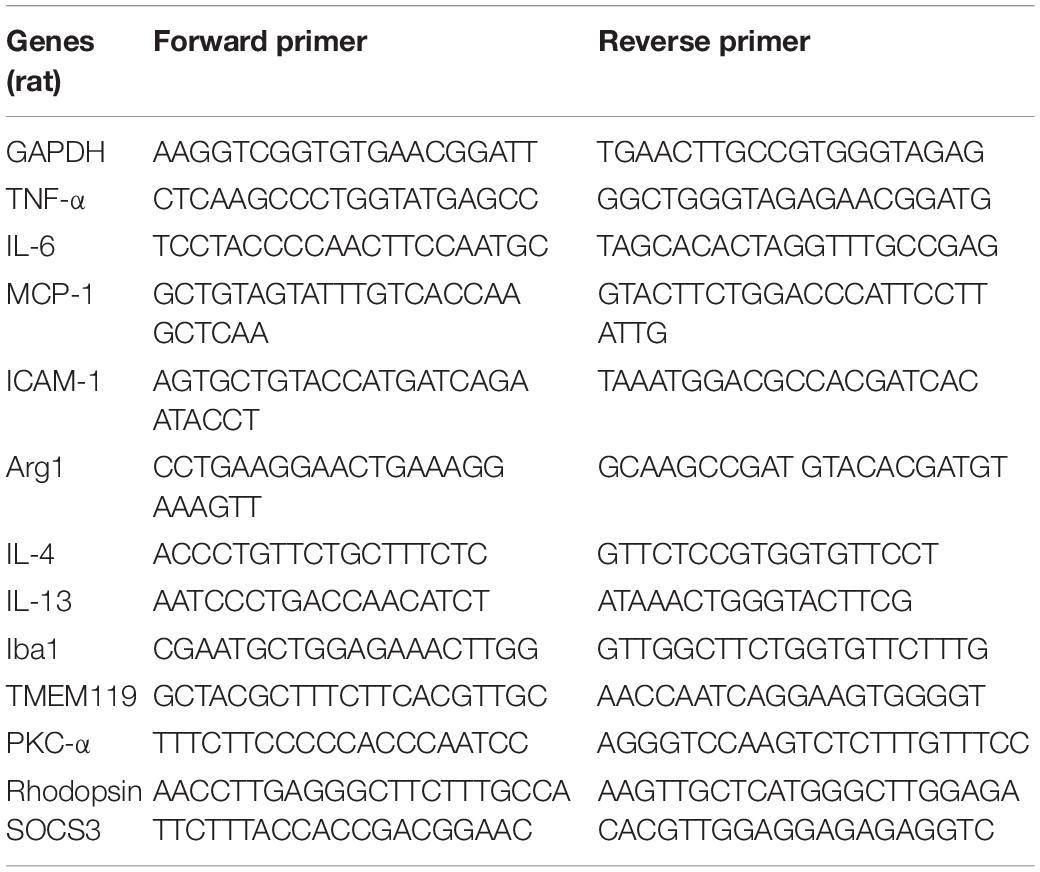
Table 2. PCR primer sequences (rat) used to detect pro- and anti-inflammatory cytokines in RCS rats’ retina.
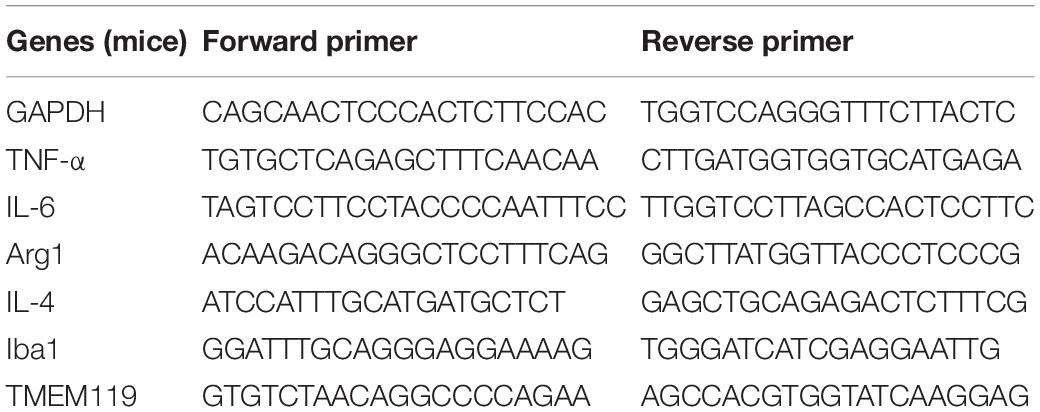
Table 3. PCR primer sequences (mice) used to detect pro- and anti-inflammatory cytokines in BV2 cells.
Western Blot
Samples (either BV2 cells or rat retinas) were collected to a glass homogenizer and grinded with radioimmunoprecipitation assay (RIPA) buffer containing protease inhibitor (Beyotime), and then incubated on ice for 15 min. The supernatant was isolated by supercentrifuge at 15,000 g/min for 5 min at 4°C. The total protein concentration in each sample was quantified using the bicinchoninic acid (BCA) Protein Quantitation Kit (Beyotime). The protein samples were added with 5× SDS (Sodium Dodecyl Sulfate) loading buffer (Beyotime) in a 4:1 ratio and then subjected to SDS-PAGE (Polyacrylamide Gel Electrophoresis; Beyotime). After electroblotting transferred onto polyvinylidene fluoride (PVDF) membranes (Bio-Rad), the 5% non-fat milk in tris-buffered saline Tween (TBST) was used to block and different primary antibodies were incubated with at 4°C overnight (Table 1). Washed the membranes with TBST three times and incubated with horseradish peroxidase-conjugated sheep anti-mouse (1:3000; Santa Cruz Biotechnology) or goat anti-rabbit immunoglobulin-G (1:3000; Santa Cruz Biotechnology) as secondary antibodies for 2 h at 25°C. After washing three times with TBST, chemiluminescence detection reagents were used to visualize the bands on the membranes. β-actin was used as a internal control.
Statistical Analysis
All data are expressed as mean ± standard deviation (SD). Data were analyzed using SPSS software (v21, IBM, Armonk, NY, United States). The data were evaluated using unpaired two-sample t-tests, to compare the means at the same time points between the experimental and control groups; one-sample t-tests where test distributions were compared to a specific value, or two-way ANOVA followed by Fisher’s protected least-significant difference post hoc tests. Values of p < 0.05 were considered statistically significant.
Results
Resident Microglia Activation and Macrophages Infiltration During Retinal Degeneration
In order to investigate the dynamic change of resident microglia activation and infiltrated macrophages during retinal degeneration, we performed immunohistochemistry on retinal sections from different age of RCS and normal control rats. We stained ionized calcium-binding adaptor molecule-1 (Iba1), a marker for both activated microglia and macrophages (Li et al., 2016), and used TMEM119 to specifically label activated resident microglia (Bennett et al., 2016). In retinas of normal control rats, we rarely saw staining with either Iba1 or TMEM119 (Figures 2A1,A3,A5,C1,C3,C5). In contrast, in RCS rats we saw Iba1-positive and TMEM119-positive cells, whose numbers varied during the course of retinal degeneration, over the first 90 post-natal days.
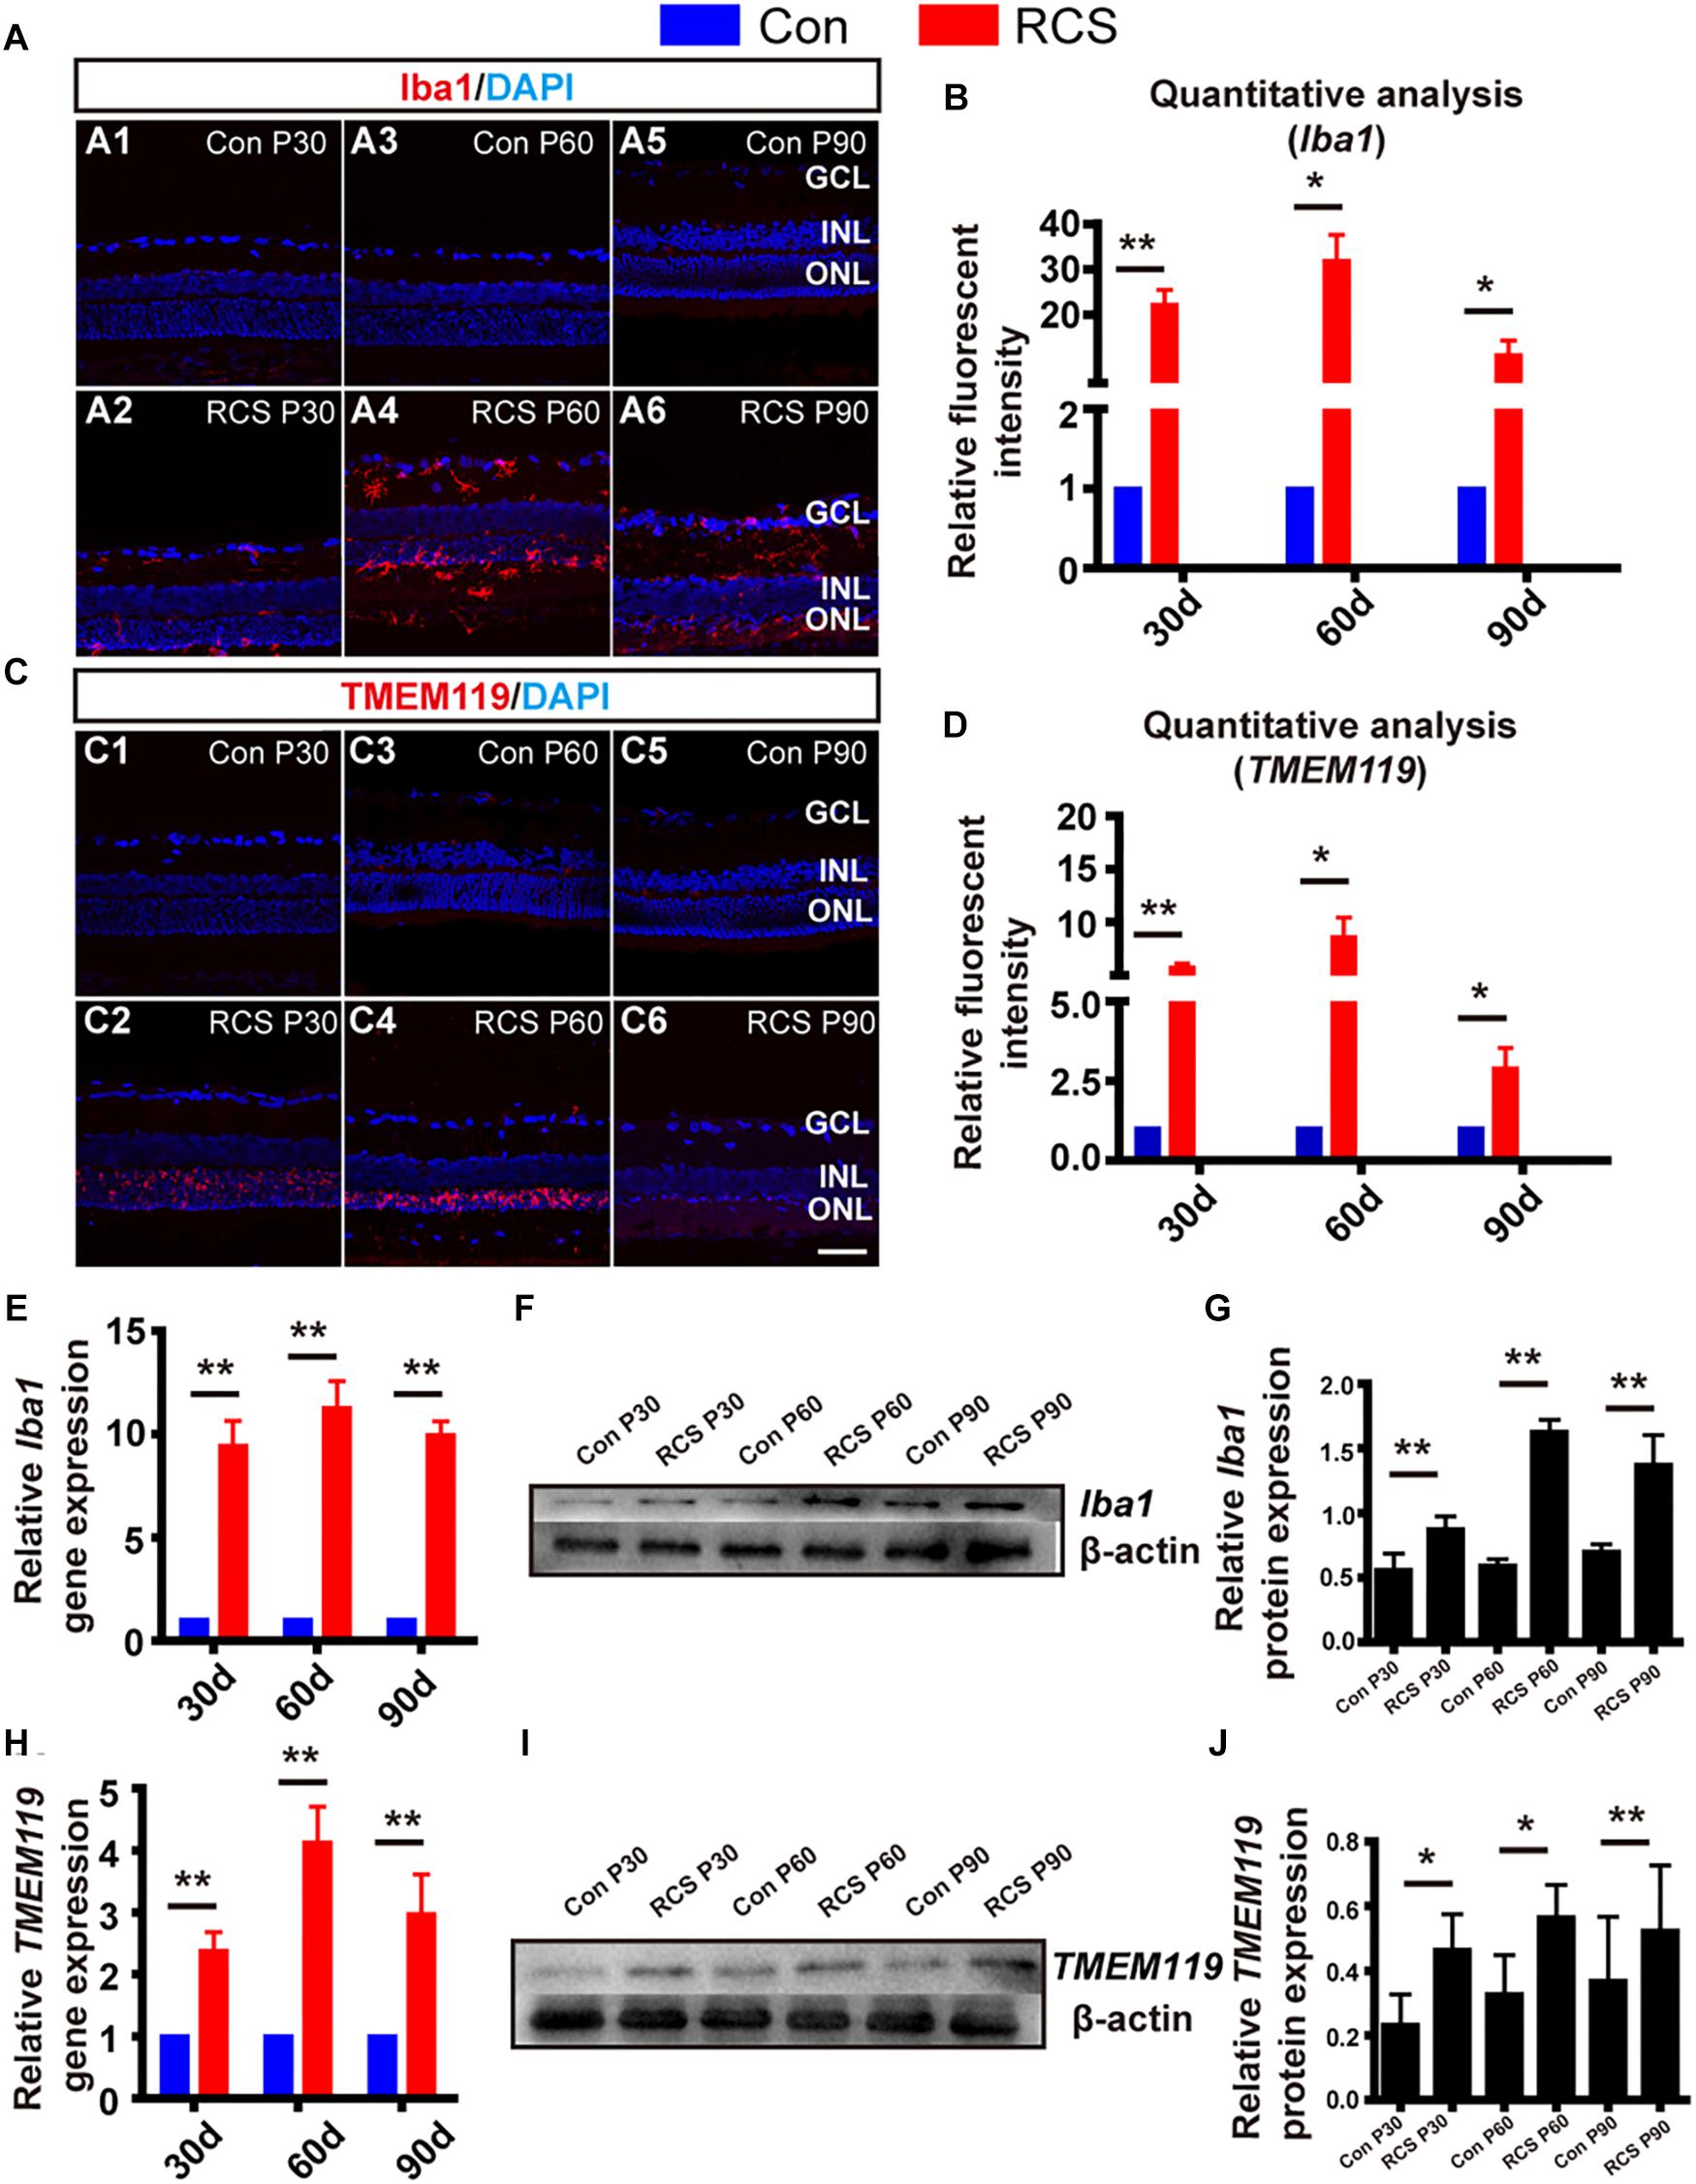
Figure 2. Distribution and activation marker change of resident microglia and infiltrated macrophage in RCS rats. (A) Immunohistological images, labeled with Iba1 (red), and DAPI (blue) in retinal slices from control (rdy) rats (A1,A3,A5), and RCS rats of different post-natal ages (A2,A4,A6). (B) Quantitative group analysis of relative Iba1 fluorescence intensity at different ages, normalized to each control (n = 3 per bar). (C,D) Same as (A,B), but for TMEM119 (red) (E) mRNA expression level of Iba1 in RCS retinas, relative to expression in control retinas of the same age (n = 3 per bar). (F) Example western blot of Iba1 protein levels. (G) Quantitative group data of Iba1 protein levels in RCS retinas, normalized to β-actin expression levels, and compared to each control retinas (n = 3 per bar). (H–J) Same as (E–G) but for TMEM119. *p < 0.05, ∗∗p < 0.01; scale bars: 50 μm.
During early-stage degeneration (P30), Iba1-positive cells in RCS rat retinas were localized in the ganglion cell layer (GCL) and ONL (Figure 2A2). There was large number of TMEM119-positive cells localized in the ONL only (Figure 2C2). At mid-stage (P60), there was an increased number of Iba1-positive cells, and these were found across the entire retina. These cells had a ramified appearance, suggesting migrating, activated microglia/macrophages (Figure 2A4). TMEM119-positive cells remained localized to the ONL but their immunofluorescence became more intense (Figure 2C4). At late-stage (P90), there was obvious apoptosis of retinal cells, and the number of both Iba1-positive and TMEM119-positive cells decreased, compared to P60 (Figures 2A6,C6).
Secondly, we performed quantitative analysis of relative fluorescence intensity, compared to control retinas. This showed that both Iba1 and TMEM119 intensity was significantly elevated at P30 (Iba1: 22.14 ± 3.3 fold; TMEM119: P30: 5.71 ± 0.42 fold; n = 3 per group; p < 0.01 for each vs. controls). Peak expression was at P60 (Iba1: 31.79 ± 5.78 fold; TMEM119: 8.59 ± 1.86 fold; n = 3 per group; p < 0.01 for each vs. control). Expression then fell at P90, but was still significantly elevated (Iba1: 11.06 ± 3.26-fold; TMEM119: 2.88 ± 0.65-fold n = 3 per bar; p < 0.01 for each vs. controls) (Figures 2B,D).
Thirdly, to investigate changes in Iba1 and TMEM119 at the mRNA and protein level, we also performed RT-PCR and WB. Compared to control rats of the same age, the mRNA expression of Iba1 was increased in RCS retinas by more than ninefold at all ages (p < 0.01 for comparisons to control at all ages, n = 3 per group; Figure 2E). The expression of TMEM119 was increased by more than twofold at all ages (p < 0.01 for comparisons to control at all ages, n = 3 per group) (Figure 2H). In WB analysis (e.g., Figures 2F,I), the densities of Iba1 and TMEM119 bands were significantly higher in the RCS rats compared with the same age of control rats (Iba1: Con vs. RCS: P30: 0.87 ± 0.1 vs. 0.56 ± 0.13; P60: 0.59 ± 0.05 vs. 1.63 ± 0.09; P90: 0.7 ± 0.06 vs. 1.38 ± 0.23 n = 3 per group; p < 0.05; Figure 2G) (TMEM119: Con vs. RCS: P30: 0.23 ± 0.09 vs. 0.46 ± 0.11; P60: 0.33 ± 0.12 vs. 0.57 ± 0.1; P90: 0.37 ± 0.2 vs. 0.52 ± 0.2 n = 3 per group; p < 0.05; Figure 2J).
Retinal Degeneration Induces JAK2/STAT3 Pathway Activation and Downstream Cytokines Expression
We next examined the expression of pJAK2, pSTAT3, JAK2 and STAT3 because the JAK/STAT pathway is a well-known modulator of microglia activation and pro-inflammatory cytokines expression. From WB result of retinal tissues from different age of RCS and normal control rats, we can find the expressions of pJAK2, pSTAT3, JAK2, and STAT3 were all up-regulated during retinal degeneration in RCS rats (n = 3 per group, Supplementary Figure S1) (JAK2: P30: 1.11 ± 0.09 fold; P60: 2.04 ± 0.13 fold; P90: 2.26 ± 0.12 fold; n = 3 per group; p < 0.01 for P60 and P90 RCS vs. control; STAT3: P30: 1.13 ± 0.12-fold; P60: 1.53 ± 0.05-fold; P90: 1.72 ± 0.11-fold; n = 3 per group; p < 0.01 for P60 and P90 RCS vs. control) (Figures 3A–C). We next examined whether retinal degeneration induced expression of classically identified STAT inducible genes. The results shown in Figure 3D reveal that retinal degeneration induced the high expression of pro-inflammatory factors such as TNF-α, IL-6, ICAM-1, and MCP-1 in a time-dependent manner, which is indicative that microglia/macrophages were activated with “classically” phenotype (Qin et al., 2016). In contrast, expression of anti-inflammatory factors such as Arg1, IL-4, and IL-10 tended to be more highly expressed at P30 and were significantly reduced at P60 and P90 (n = 3 at each time-point; p < 0.01 for each vs. controls, Figure 3E). These results collectively demonstrate that retinal degeneration induces activation of JAK2 and STAT3 and downstream gene expression in microglia/macrophages indicative of the pro-inflammatory phenotype. Alternatively activation, responsible for anti-inflammatory effects, are increased in early-stage degeneration (but at much lower multiples of the control level than pro-inflammatory cytokines). Anti-inflammatory cytokine gene expression is then reduced from P60, and this reduction in anti-inflammatory mediators may also have a pro-inflammatory outcome.
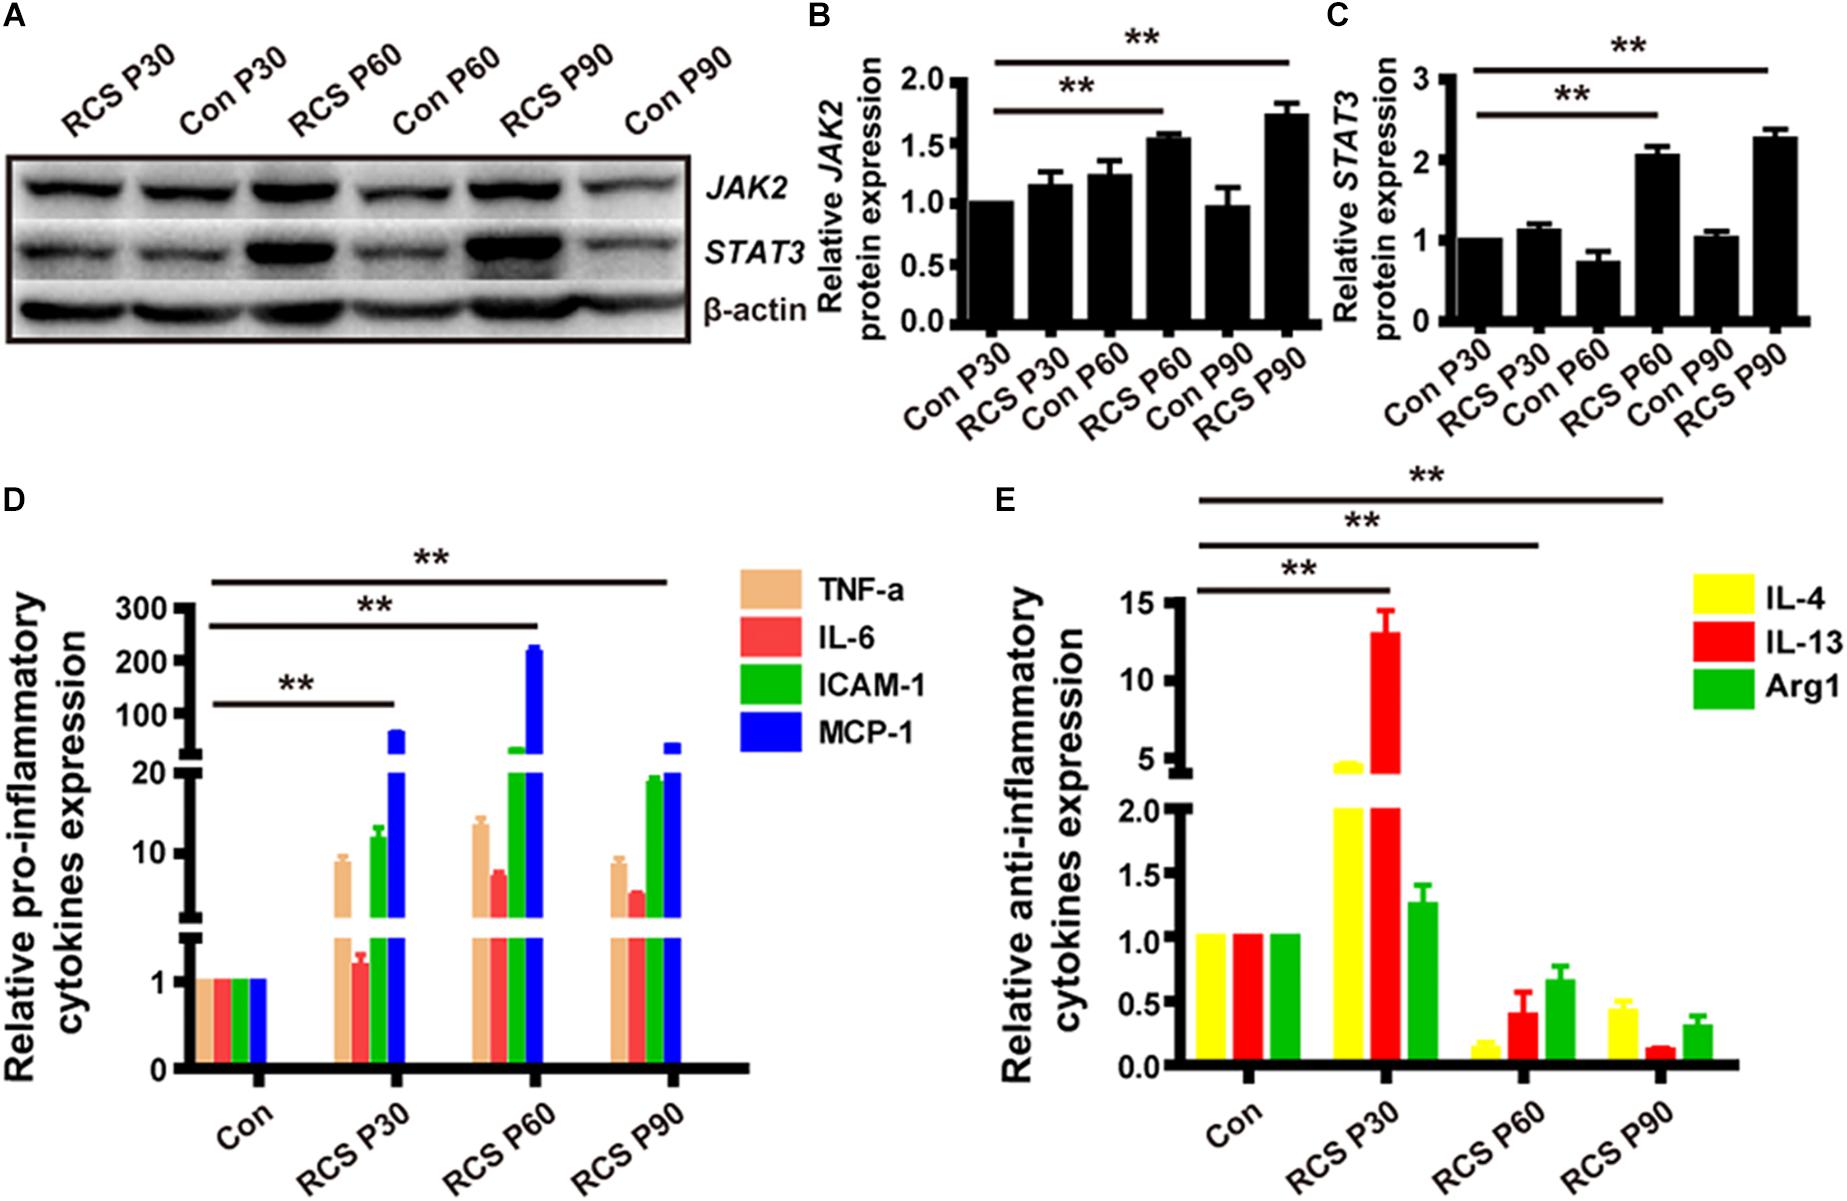
Figure 3. JAK2/STAT3 activation and the change of downstream cytokines expression in RCS rat retinas. (A) WB results for protein levels of JAK2 and STAT3 in retinas from RCS rats and control rats of different ages. (B) Group data showing JAK2 expression by western blot in RCS rats. (C) The same as (B), but for STAT3. (D) mRNA expression levels of pro-inflammatory cytokines: TNF-α, IL-6, ICAM-1, and MCP-1 (n = 3 per bar). (E) mRNA expression levels of anti-inflammatory cytokines: IL-4, IL-13, and Arg1 (n = 3 per bar). *p < 0.05, ∗∗p < 0.01.
OECs Inhibit LPS Induced BV2 Microglia Activation, and Changed the Expression Level of Inflammatory Factors and JAK2/STAT3 Pathway in vitro
To examine the immunomodulating potential of OECs against inflammation in vitro, LPS-induced microglia activation were established in BV2 cell line (experimental design in Figure 1). BV2 microglial cells were treated with LPS (1 μg/mL) for 4 h to release the pro-inflammatory factors (Dai et al., 2011; Li et al., 2016). We then co-cultured the BV2 cells with either OECs, or ONFs (control), for another 24 h, before collecting the BV2 for further use.
Following LPS treatment, we saw increased cell density consistent with microgliosis (Figures 4A1 vs. A2). BV2 cells in the untreated (BV2-only) group showed round/oval or ramified morphology (Figure 4A1’). After stimulation with LPS, the morphology of BV2 cells changed into an amoeboid shape (Figure 4A2’). BV2 cells in the group co-cultured with OECs (BV2-LPS-OEC) showed similar morphology to the BV2-only group (Figures 4A3,A3’), whereas BV2 cells co-cultured with ONFs (control) showed similar morphology to the BV2-LPS group (Figures 4A4,A4’). Immunocytochemistry using the microglial marker Iba1 (Figures 4B1–B4’) and TMEM119 (Figures 4C1–C4’) demonstrated increased expression in the LPS-stimulated BV2 group and BV2-LPS-ONF group, compared to the BV2-only, and BV2-LPS-OEC group. BV2 microglial cells were treated with LPS for 4 h to induce the pro-inflammation phenotype. The mRNA expression of microglial markers (Iba1, TMEM119, Figures 4D,E) and pro-inflammation cytokines (TNF-α, IL-6, Figures 4F,G) in BV2 cells was enhanced significantly, while the anti-inflammation cytokines (Arg1, IL-4, Figures 4H,I) decreased greatly. These trends were markedly reversed after co-culture with OECs. Thirdly, the results from WB analysis revealed that the JAK2 and STAT3 expressions in LPS-stimulated BV2 cells co-cultured with OECs were significantly lower than those in the LPS-stimulated BV2 group (JAK2: 0.62 ± 0.15-fold in BV2-LPS-OEC group; STAT3: 0.81 ± 0.07-fold in BV2-LPS-OEC group; compared with the BV2-LPS group, p < 0.05) (Figures 4J–L). Moreover, we found purified OECs were immunopositive for the specific NGFRp75 (Figure 5A1) and SOCS3 (Figure 5A2) using double immunofluorescence staining (Figure 5A3). The mRNA expression of SOCS3 in OECs was enhanced significantly from 12 to 48 h after co-cultured with LPS induced BV2 cells, ONFs were used as negative control [SOCS3: 12 h: 3.5 ± 0.74 fold; 24 h: 7.45 ± 2.12 fold; 48 h: 13.24 ± 0.51 fold; n = 3 per group; p < 0.05 for 12 and 48 h OECs vs. ONFs; p < 0.01 for 24 h OECs vs. ONFs) (Figure 5B)]. These results suggested that OECs could inhibit microglia activation, reduce expression of pro-inflammatory cytokines (TNF-α, and IL-6), increase the expression of anti-inflammatory cytokines (Arg1 and IL-4), down-regulate JAK2/STAT3 pathway by over-expressed SOCS3 in vitro.
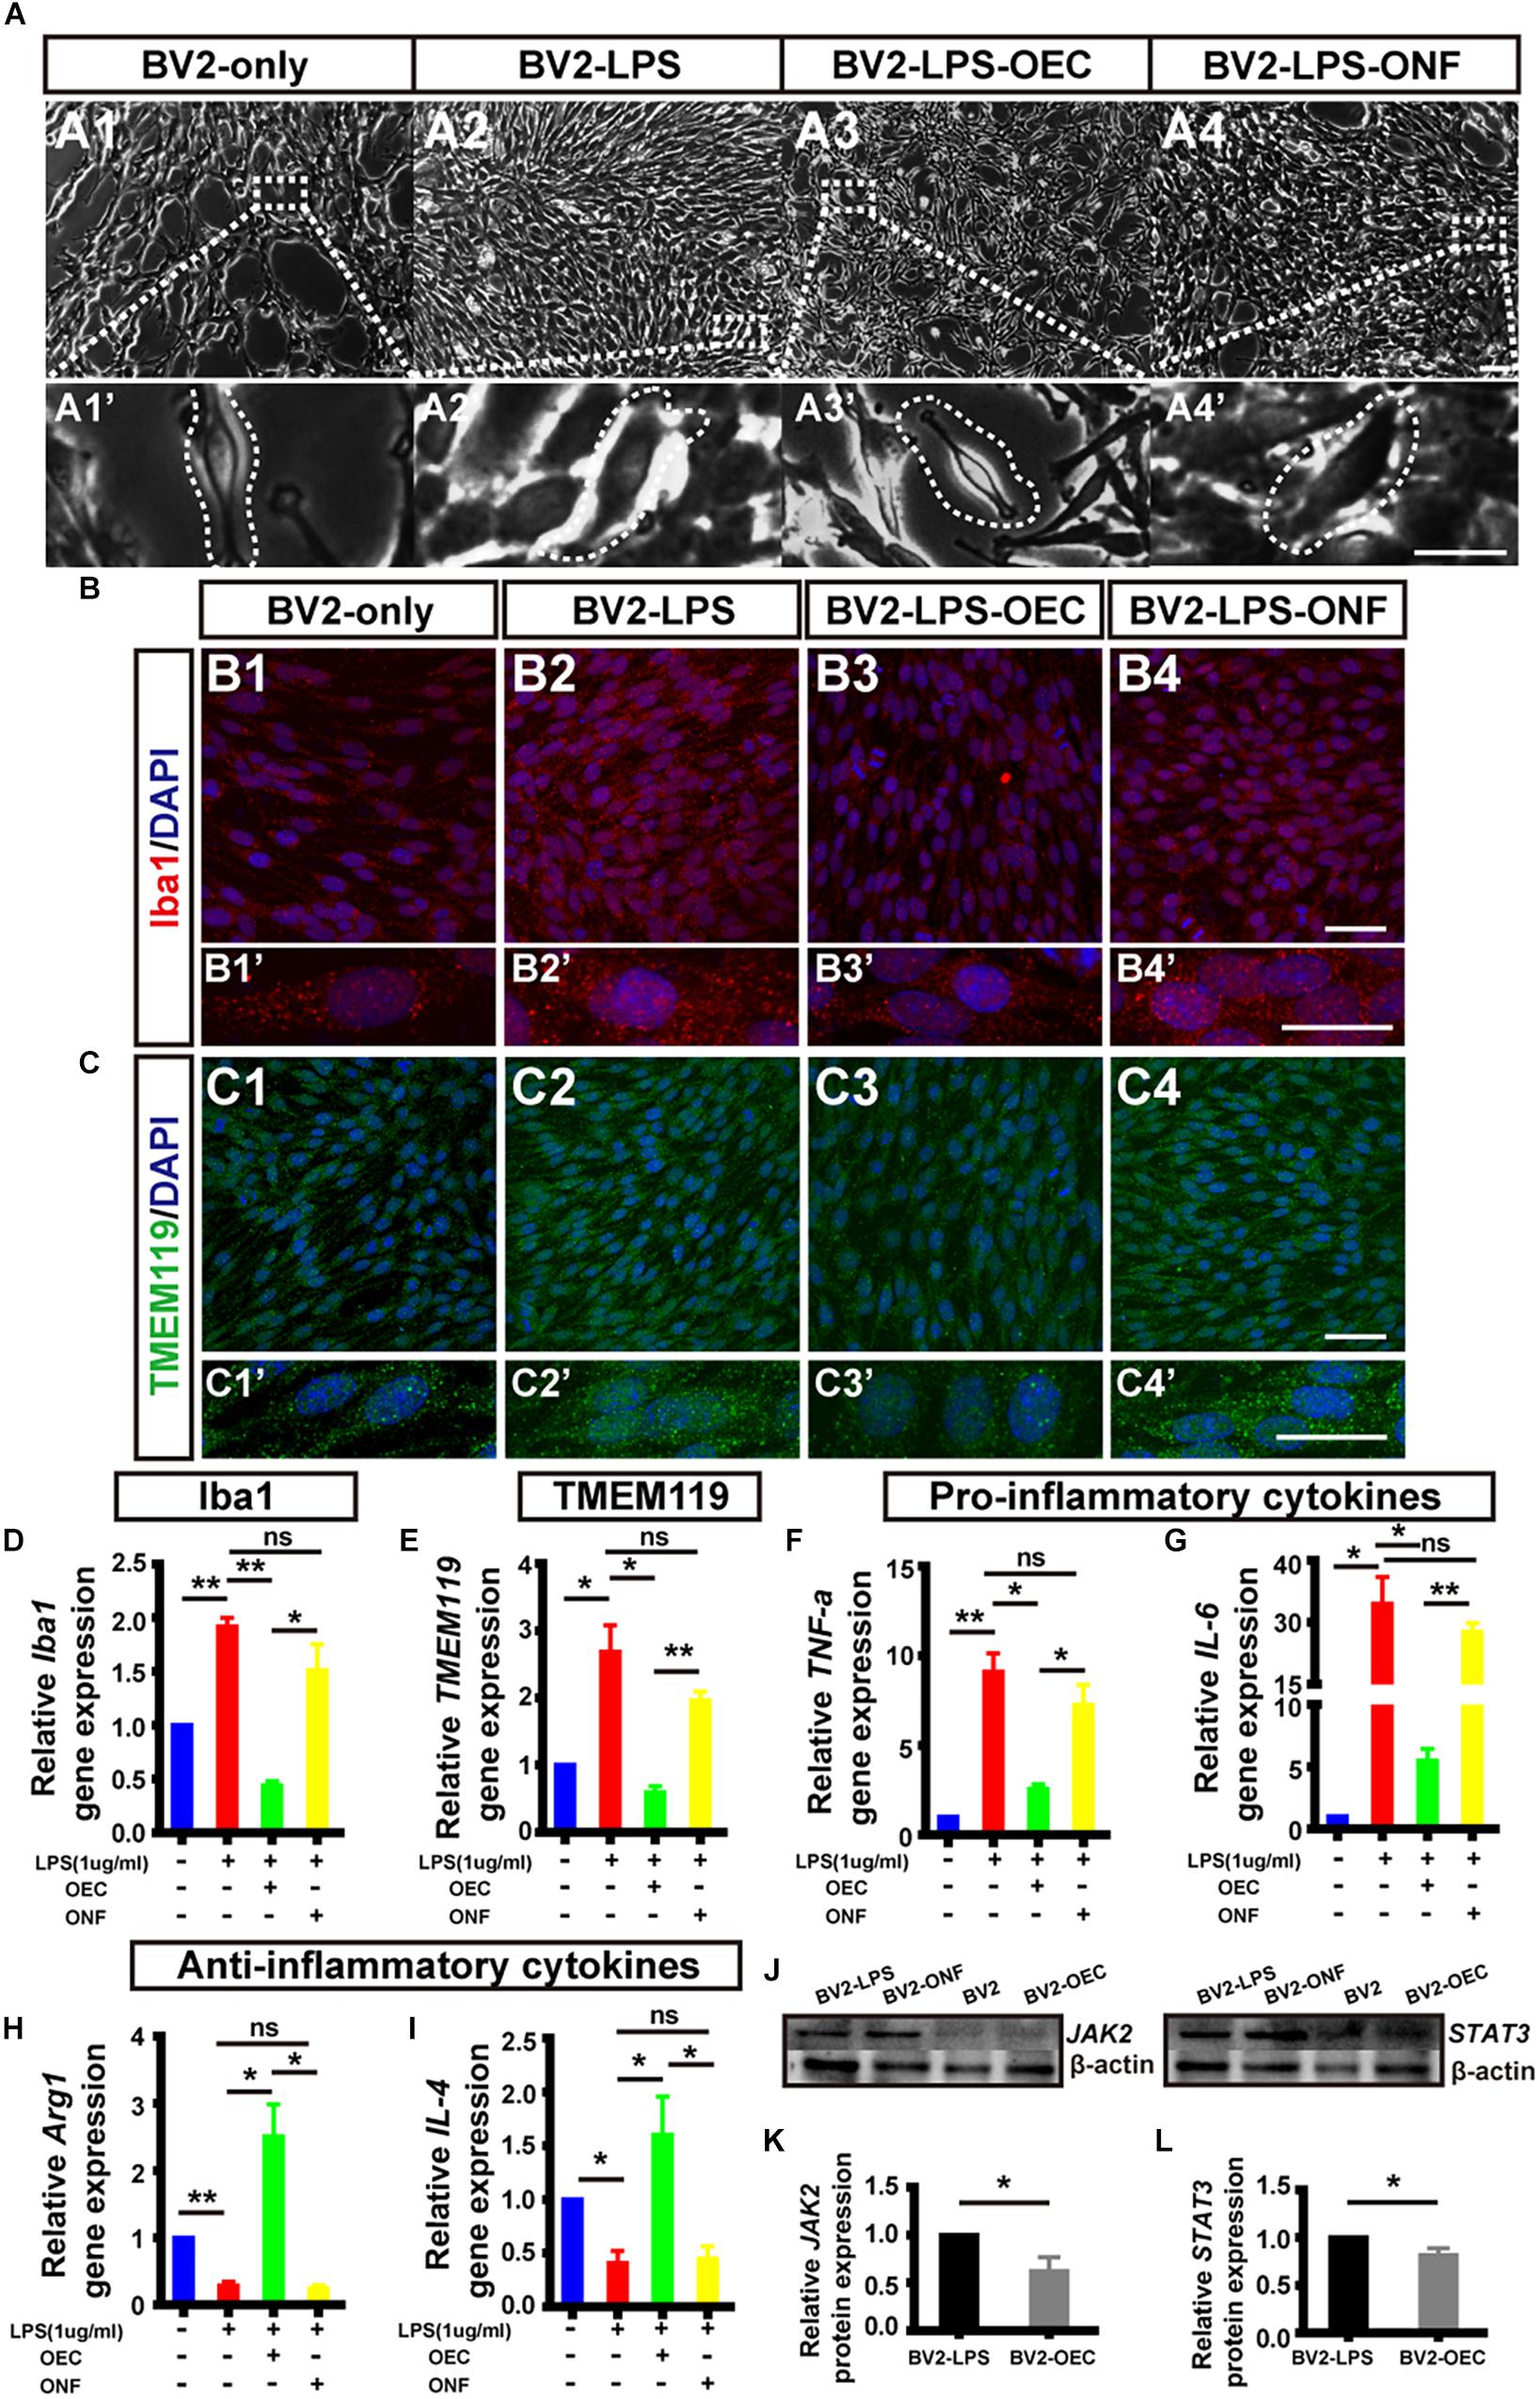
Figure 4. OECs inhibited microglial activation in vitro and changed the expression of pro- and anti-inflammatory factors. (A1) Optical microscopy image showing density of normal cultured BV2 cells (BV2-only). Lower panel (A1’) shows an enlargement of the area marked, which shows morphology of microglia. (A2) The same for BV2 cells treated with LPS for 4 h (BV2-LPS). (A3) The same for BV2 cells treated with LPS for 4 h and co-cultured with OECs (BV2-LPS-OEC). (A4) The same for BV2 cells treated with LPS for 4 h and co-cultured with ONFs (BV2-LPS-ONF). Scale bars: 100 μm. in upper panels, 20 μm in lower panels (B1–B4) Immunohistochemistry images showing staining with Iba1 (red) and DAPI (blue) for the same groups as in A1–A4. Scale bars: 50 μm. (B1’–B4’) Lower panel shows an enlargement of the cells in B1–B4. Scale bars: 20 μm. (C1–C4) The same for staining with TMEM119. Scale bars: 50 μm. (C1’–C4’) Lower panel shows an enlargement of the cells in C1–C4. Scale bars: 20 μm. (D) mRNA expression level of Iba1 after 24 h co-culture. (E) TMEM119 mRNA expression. (F,G) Expression of pro-inflammatory cytokines: TNF-α and IL-6, respectively. (H,I) Expression of anti-inflammatory cytokines: Arg1 and IL-4, respectively. (J) Example WB of JAK2 and STAT3, with β-actin as loading control. (K) Quantified JAK2 protein expression by WB (n = 3 per group). (L) Same for STAT3 (n = 3 per group). *p < 0.05, ∗∗p < 0.01.
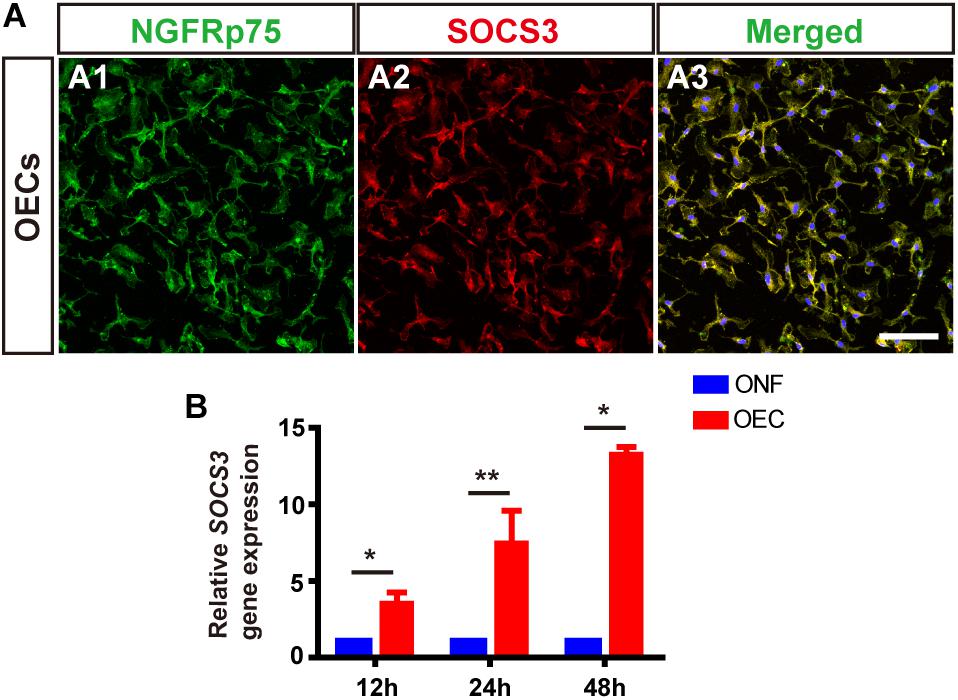
Figure 5. OECs express SOCS3 in vitro. (A) Immunohistology images, labeled for NGFRp75 (green), SOCS3 (red) and DAPI (blue) in the purified OECs. Scale bar: 50 μm. (B) mRNA expression level of SOCS3 after 12, 24, and 48 h co-culture with LPS-BV2 cells compared with ONFs (n = 3 per group). *p < 0.05, ∗∗p < 0.01.
OECs Regulate the Expression Level of Pro- and Anti-inflammatory Factors of Microglia in a JAK2/STAT3-Dependent Manner
To determine if JAK2/STAT3 pathway activation was causally involved in the OEC-induced change of pro- and anti-inflammatory factors in microglia, we incubated OECs with AG490, a specific chemical antagonist of JAK2 (at 50 μM, for 1 h) followed by co-culture with LPS-stimulated BV2 for 24 h. We found that the morphology of BV2 co-cultured with AG490-pretreated OECs was amoeboid (Figure 6A3), similar to the LPS-induced BV2 group (Figure 6A), unlike the morphology of BV2 cells co-cultured with OECs (Figures 6A2,A2’). Additionally, immunocytochemistry showed increased expression of Iba1 in the BV2-LPS-OEC-AG490 group (Figure 6B).
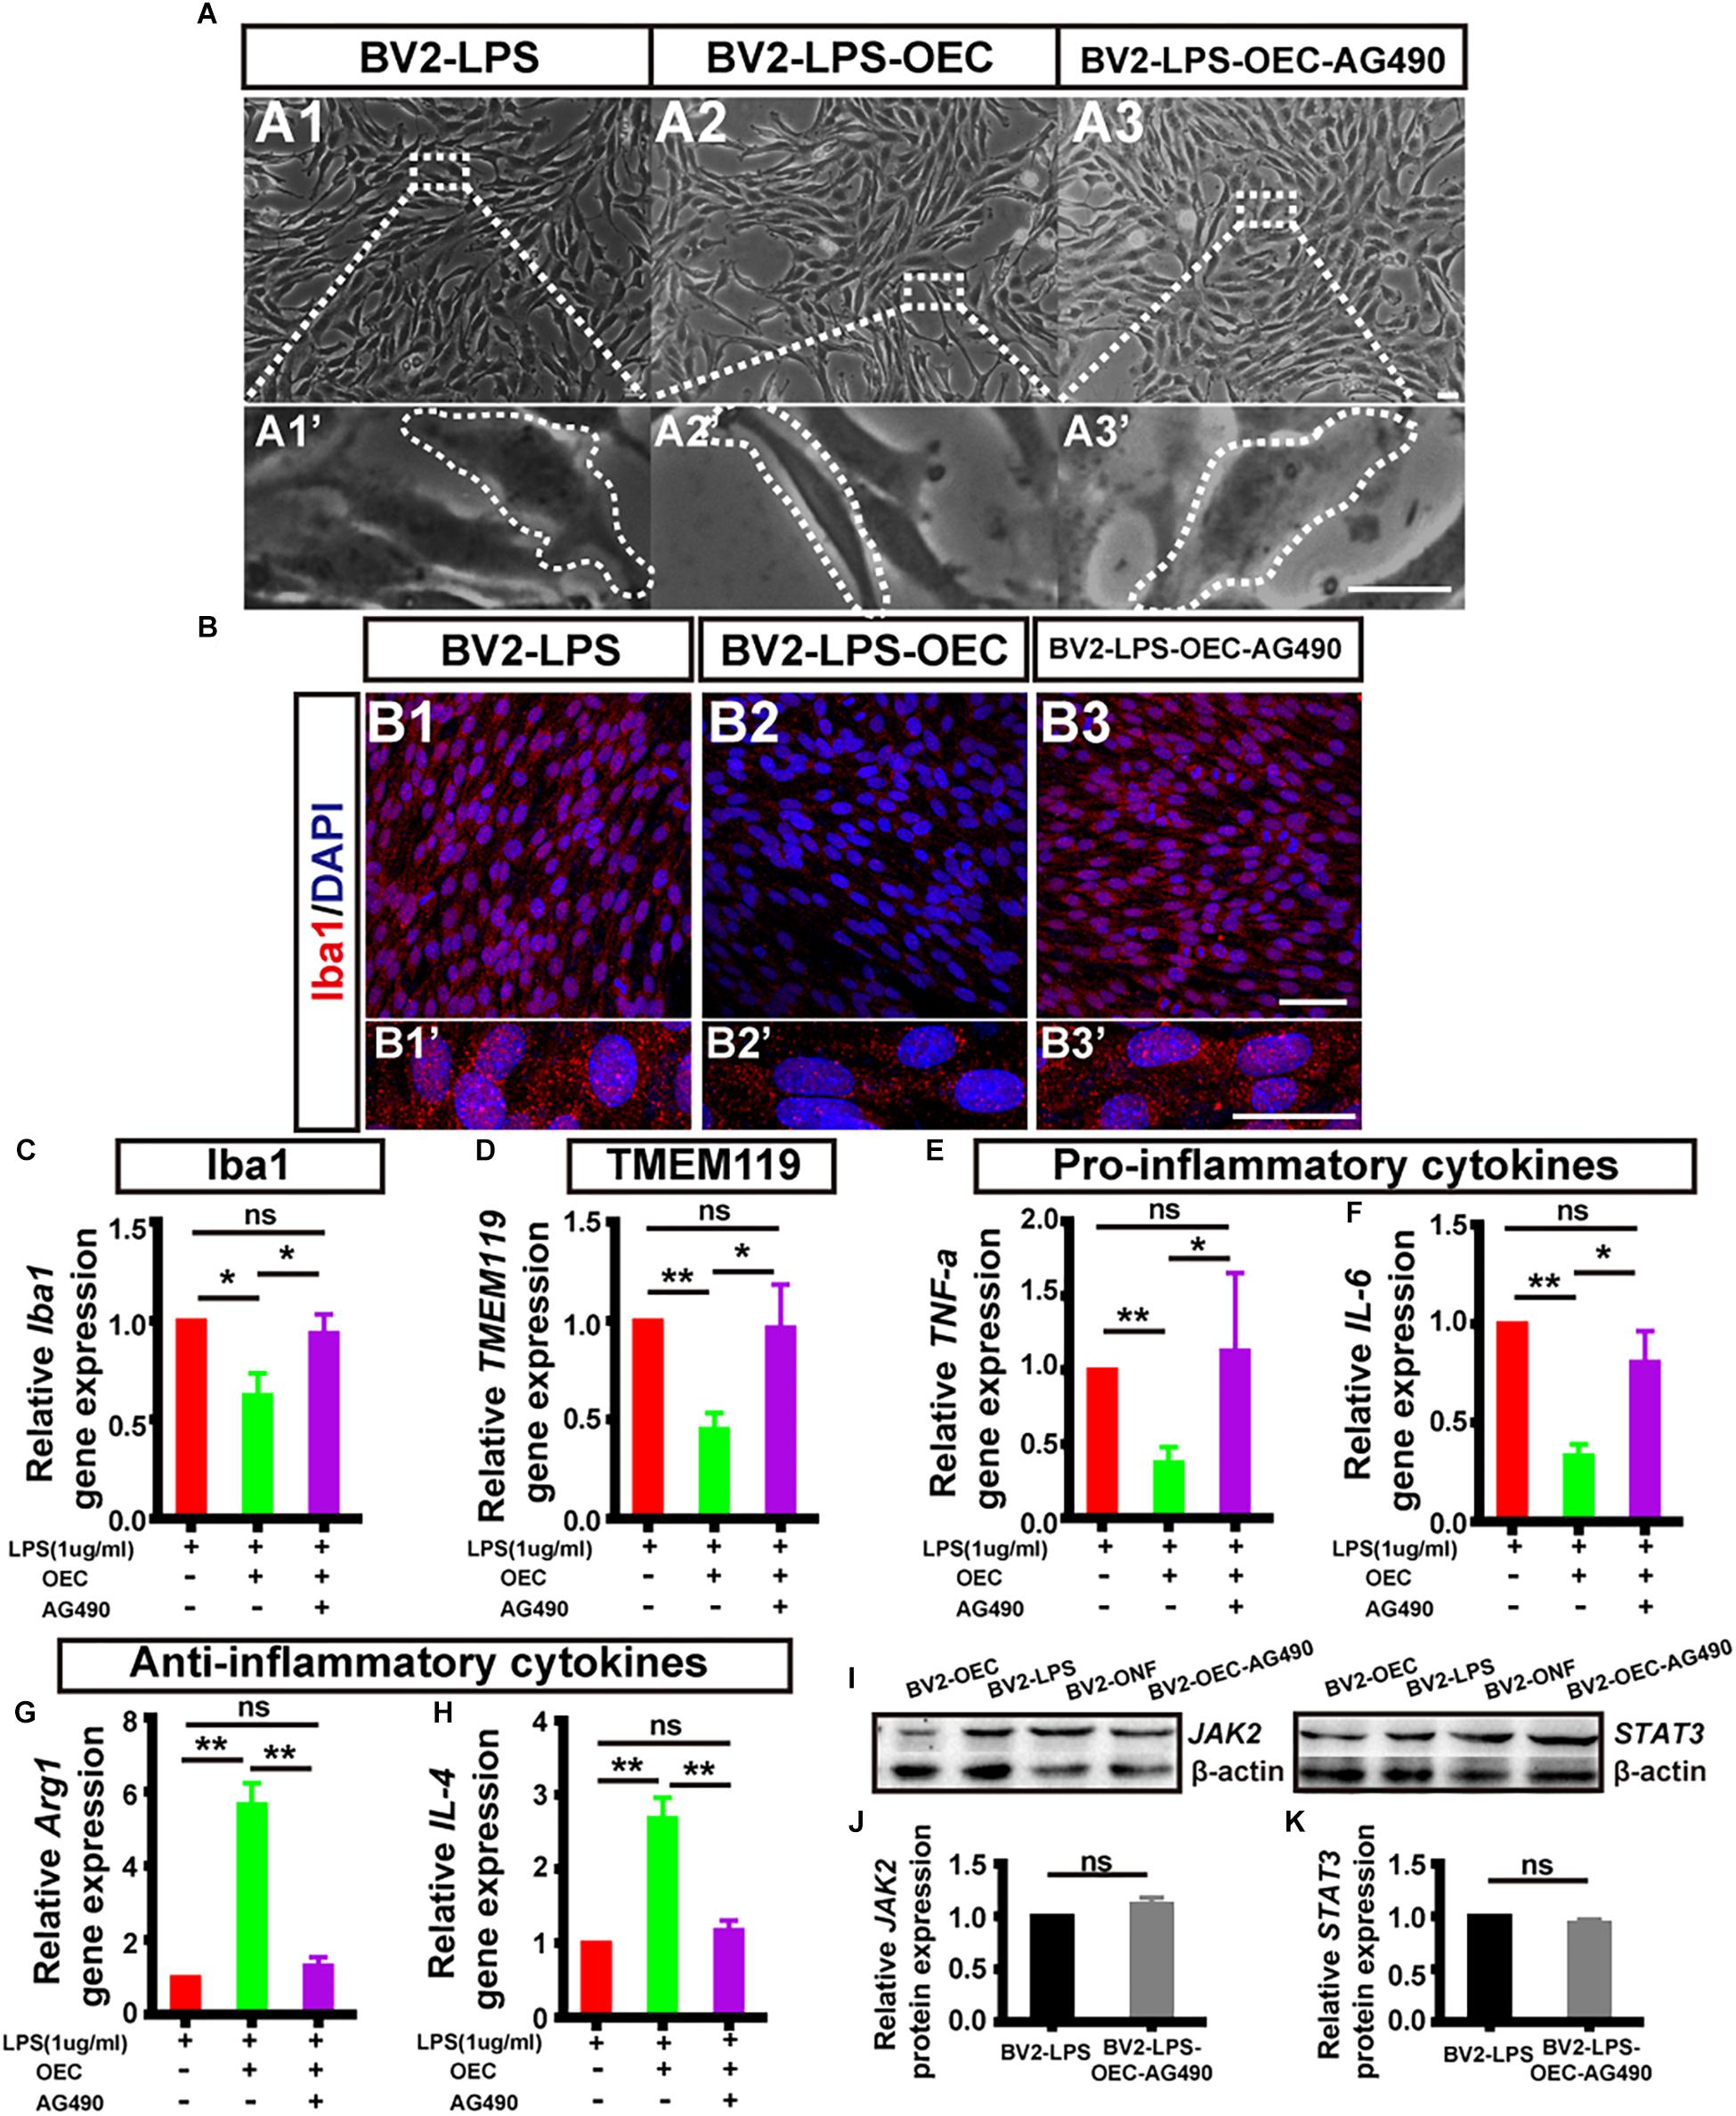
Figure 6. The expression level of pro- and anti-inflammatory factors shift in activated microglia induced by OECs. (A1) Optical microscopy image showing density of BV2 cells treated with LPS for 4 h (BV2-LPS). Lower panel (A1’) shows an enlargement of the area marked which shows the morphology of microglia. (A2) The same for BV2 cells treated with LPS for 4 h and co-cultured with OECs (BV2-LPS-OEC). (A3) The same for BV2 cells treated with LPS for 4 h and co-cultured with OECs pre-treated with AG490 (BV2-LPS-OEC-AG490). Scale bars: 100 μm in upper panels, 20 μm in lower panels (B1–B3) Immunohistochemistry images showing staining with Iba1 (red) and DAPI (blue) for the same groups as in A1–A3. Scale bars: 50 μm. (B1’–B3’) Lower panel shows an enlargement of the cells in B1–B3. Scale bars: 20 μm. (C) mRNA expression level of Iba1 after 24 h co-culture. (D) TMEM119 mRNA expression. (E,F) Expression of pro-inflammatory factors: TNF-α and IL-6, respectively. (G,H) Expression of anti-inflammatory factors: Arg1 and IL-4, respectively. (I) Example WB of JAK2 and STAT3, with β-actin as loading control. (J) Quantified JAK2 protein expression by WB (n = 3 per group). (K) Same for STAT3 (n = 3 per group). *p < 0.05, ∗∗p < 0.01.
Secondly, we measured the mRNA expression levels of microglial activation markers (Iba1, TMEM119), pro-inflammatory factors (TNF-α, IL-6), and anti-inflammatory factors (Arg1 and IL-4) of BV2 in each group, using RT-PCR. We found that AG490-pretreatment reversed the changes in mRNA expression by BV2 cells associated with OEC co-culture, such that the BV2-LPS-AG490-OEC group was statistically indistinguishable from the BV2-LPS group, and significantly different from the group treated with normal OECs (Figures 6C–H).
Finally, we studied the expression of JAK2/STAT3 proteins in BV2 cells co-cultured with AG490-pretreated OECs, using WB. We found that expression of pJAK2, pSTAT3, JAK2, and STAT3 was very similar between the BV2-LPS, BV2-LPS-ONF groups and the BV2-LPS-OEC-AG490 groups (n = 3 per group, Supplementary Figure S2) (JAK2: 1.12 ± 0.59-fold in BV2-LPS-OEC-AG490 group; STAT3: 0.94 ± 0.03-fold in BV2-LPS-OEC-AG490 group; compared with the BV2-LPS group, p > 0.05) (Figures 6I–K). These results collectively demonstrated that pretreatment of OECs with AG490 blocked their effects on pro/anti-inflammatory cytokines expression, suggesting that this effect of OECs is dependent on the JAK2/STAT3 pathway in activated BV2 microglia cells.
OECs Reduce the Classical Immune Cell Activation and the Expression Levels of Pro-inflammatory Factors in vivo
In order to understand whether OECs can show similar effect on activated microglia/macrophages in vivo, and whether they can modulate the pro-inflammatory microenvironment, we assessed the properties of resident microglia, and infiltrated macrophages, and the level of inflammatory markers, 4 weeks after subretinal OEC transplantation in live RCS rats. To do this, we successfully produced EGFP-labeled OECs, using transfection via a lentiviral vector, and these labeled cells were injected subretinally (Supplementary Figure S3). Rats were then sacrificed at 4 weeks post-transplantation, and their retinas isolated for further study.
Firstly, and in agreement with the previous in vitro results, immunohistochemistry of retinas from the in vivo model demonstrated that the number of TMEM119-positive cells (activated resident microglia; white arrows, Figure 7A) was reduced in RCS rats treated with OECs compared with the control (PBS-injected) group. Secondly, we collected homogenized retinal tissue and used RT-PCR and WB confirmed that, TMEM119 gene expression at 4 weeks in the OEC-group was 0.56 ± 0.146 of that in the control group (Figure 7B; n = 3 per group; p < 0.05 vs. PBS control), and TMEM119 protein levels were 0.56 ± 0.13 of that of the control group, both were significantly lower than PBS group (n = 3 per group; p < 0.05; Figures 7C,D). However, the number of Iba1-positive cells in the retina did not seem decreased after OEC transplantation (Figure 7E). Even Iba1 mRNA levels (Figure 7F) and protein levels (Figures 7G,H) were comparable between OEC and control groups (p > 0.05 for each).
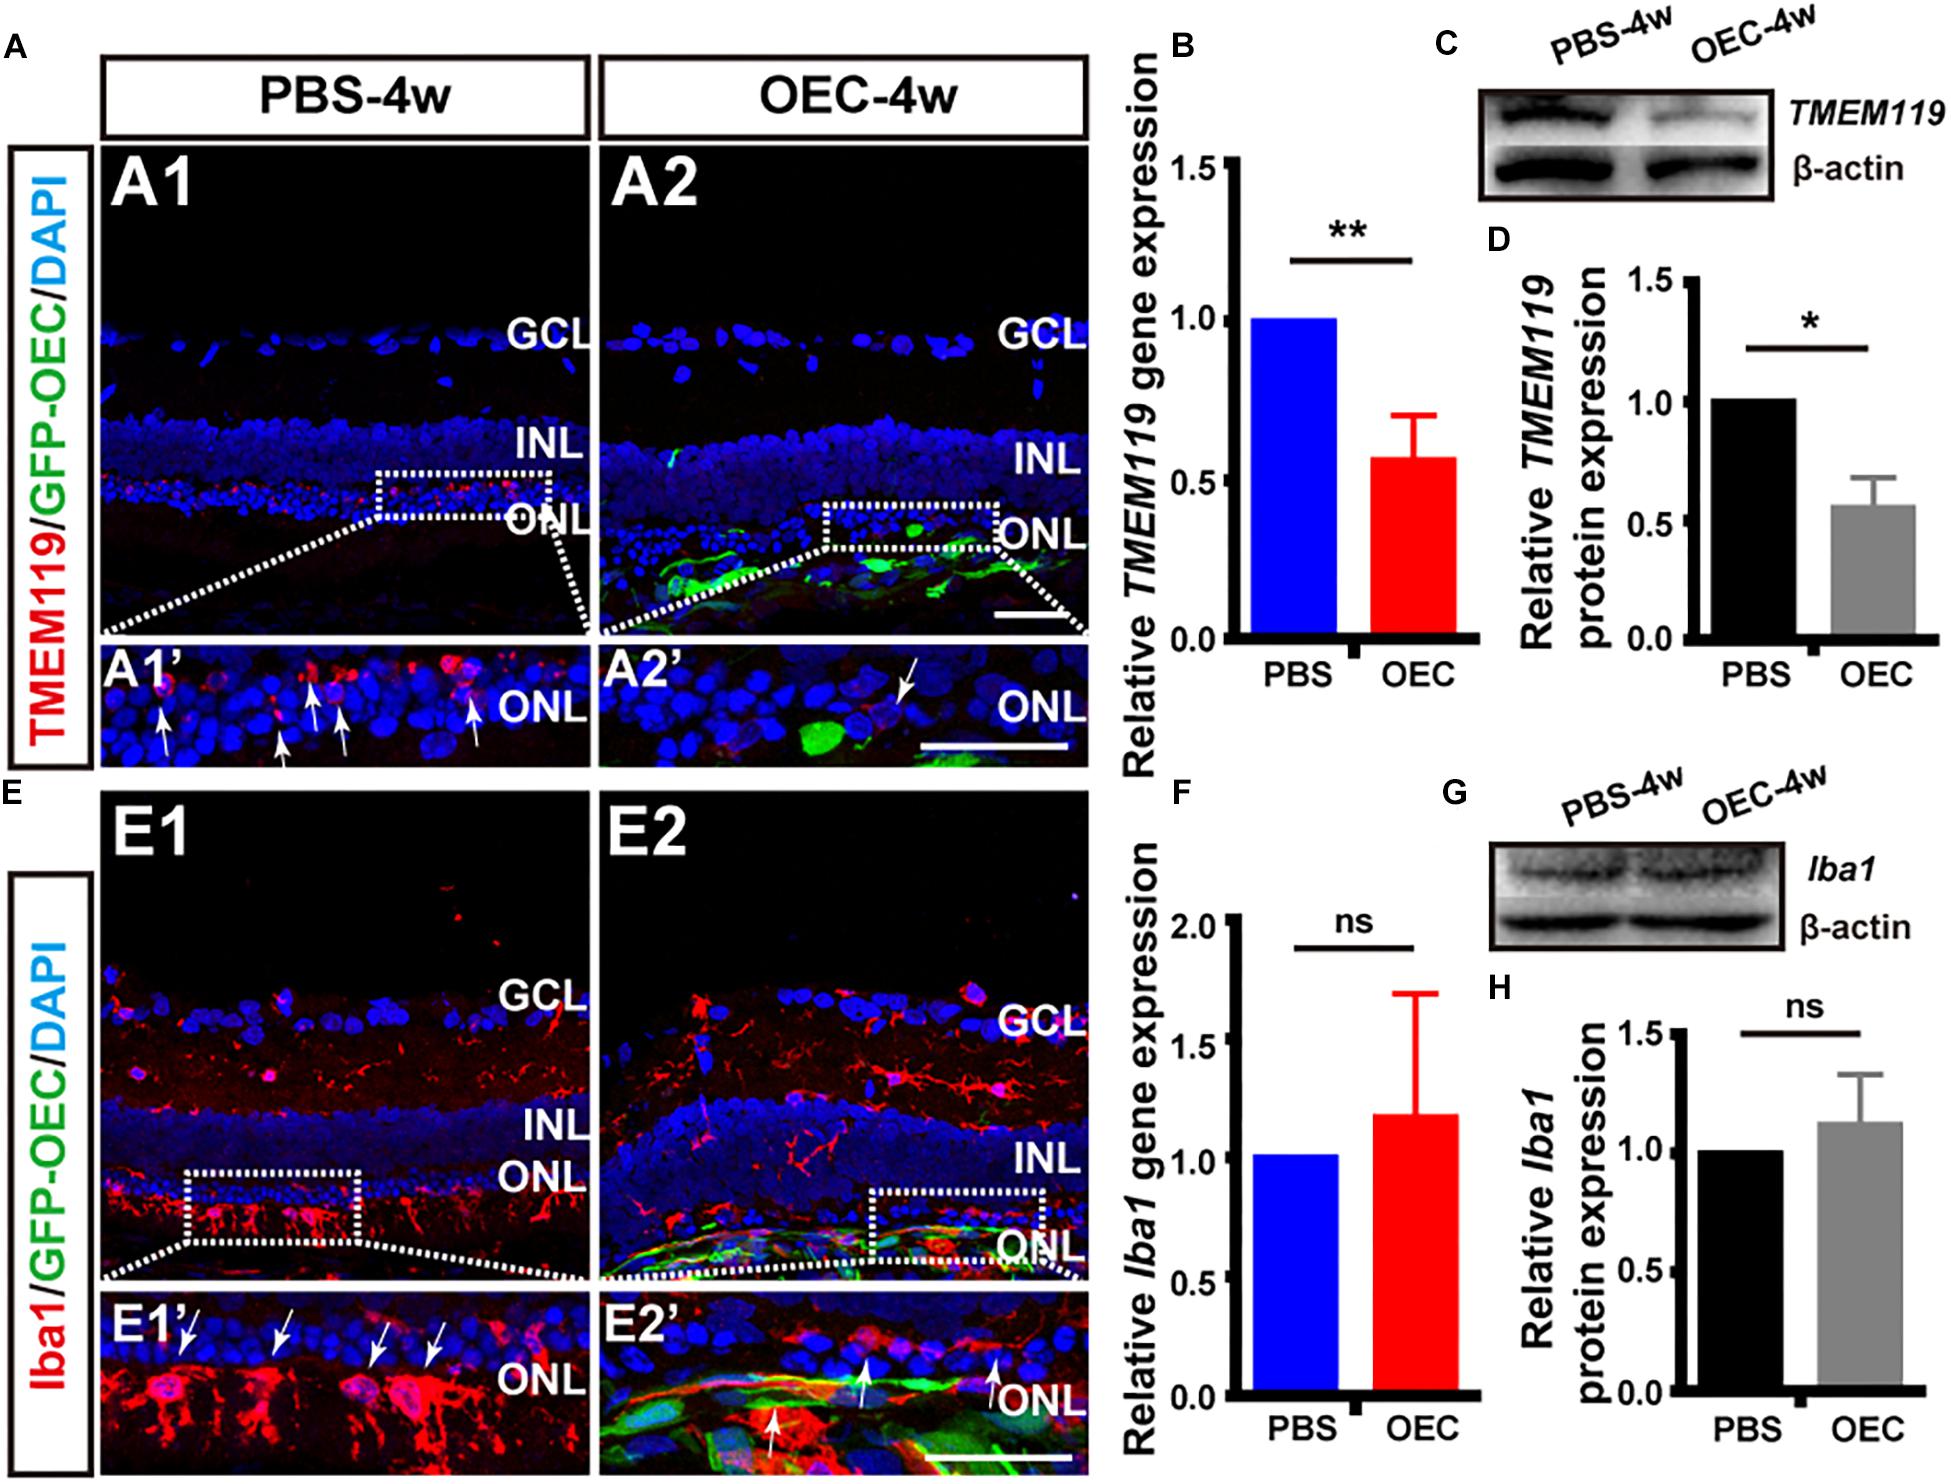
Figure 7. OECs reduce the classical microglial activation in vivo. (A1) Immunohistology image of a retina from a RCS rat, 4 weeks following subretinal injection of PBS, labeled with Iba1 (red), and DAPI (blue) (A2) Same as A1, but for a retinal from the OEC-injected group, showing grafted OECs (green, EGFP), and a reduced number of TMEM119-positive cells (white arrows). (B) mRNA expression level of TMEM119 in the OEC-group, relative to expression in PBS group (n = 3 per bar). (C) Example western blot of TMEM119 protein levels. (D) Quantitative group data of TMEM119 protein levels in OEC-group, normalized to β-actin expression levels, and compared to PBS-group retinas (n = 3 per bar). (E–H) Same as A–D, but for Iba1. *p < 0.05, ∗∗p < 0.01; Scale bars: 50 μm.
As we know, microglia are the primary immune cells in the retina, which share many phenotypic and functional properties with macrophages. We have already confirmed OECs have effect on activated microglia in vitro and in vivo, why the common marker of activated microglia and infiltrated macrophage Iba1 keep stable? We additionally used double-staining of NGFRp75 and Iba1 in purified OECs and in RCS rat after transplantation (Supplementary Figure S4). The result showed OECs not only express Iba1 in vitro, which merged with it’s special marker NGFRp75 (Supplementary Figure S2A), but also the Iba1 positive cells in vivo stain positive with GFP-OEC after transplantation (Supplementary Figure S4B). This circumstantial result indicated that transplanted OECs may also affect Iba1 expression in vivo, but due to OEC express Iba1 itself, the Iba1 expression amount keep stable in whole retinal detection.
Having shown in vitro that OECs changed the expression level of pro- and anti-inflammatory factors of microglial through the JAK2/STAT3 pathway, we wanted to investigate it in vivo. We performed WB analysis of protein lysates from retinas from the OEC group at 4 weeks post-transplantation. This showed that JAK2 expression was reduced to 0.49 ± 0.05 of control group levels (n = 3 per group; p < 0.01; Figures 8A,B) and STAT3 was reduced to 0.70 ± 0.06-fold of control group levels (n = 3 per group; p < 0.05; Figures 8C,D). These results indicate that OEC treatment reduced the activation of the JAK2/STAT3 pathway in the degenerative RCS retina. RT-PCR analysis showed in the OEC group, there was a significant reduction in mRNA expression of the pro-inflammatory cytokines compared to control (n = 3 per bar; p < 0.01 for each vs. control) (Figure 8E). In contrast, we found that anti-inflammatory factors were not affected by OEC transplantation in vivo (Figure 8F; n = 3 per bar, p > 0.05 for each vs. control). However, it did appear from immunostaining that there were a larger number of Arg1-positive cells around the transplantation site in the OEC group, compared to the PBS group (Figure 8G). Maybe the differences between RT-PCR and immunostaining indicated the expression level of anti-inflammatory factors were so low and just in the transplantation area that could not be detected in whole retina tissue.
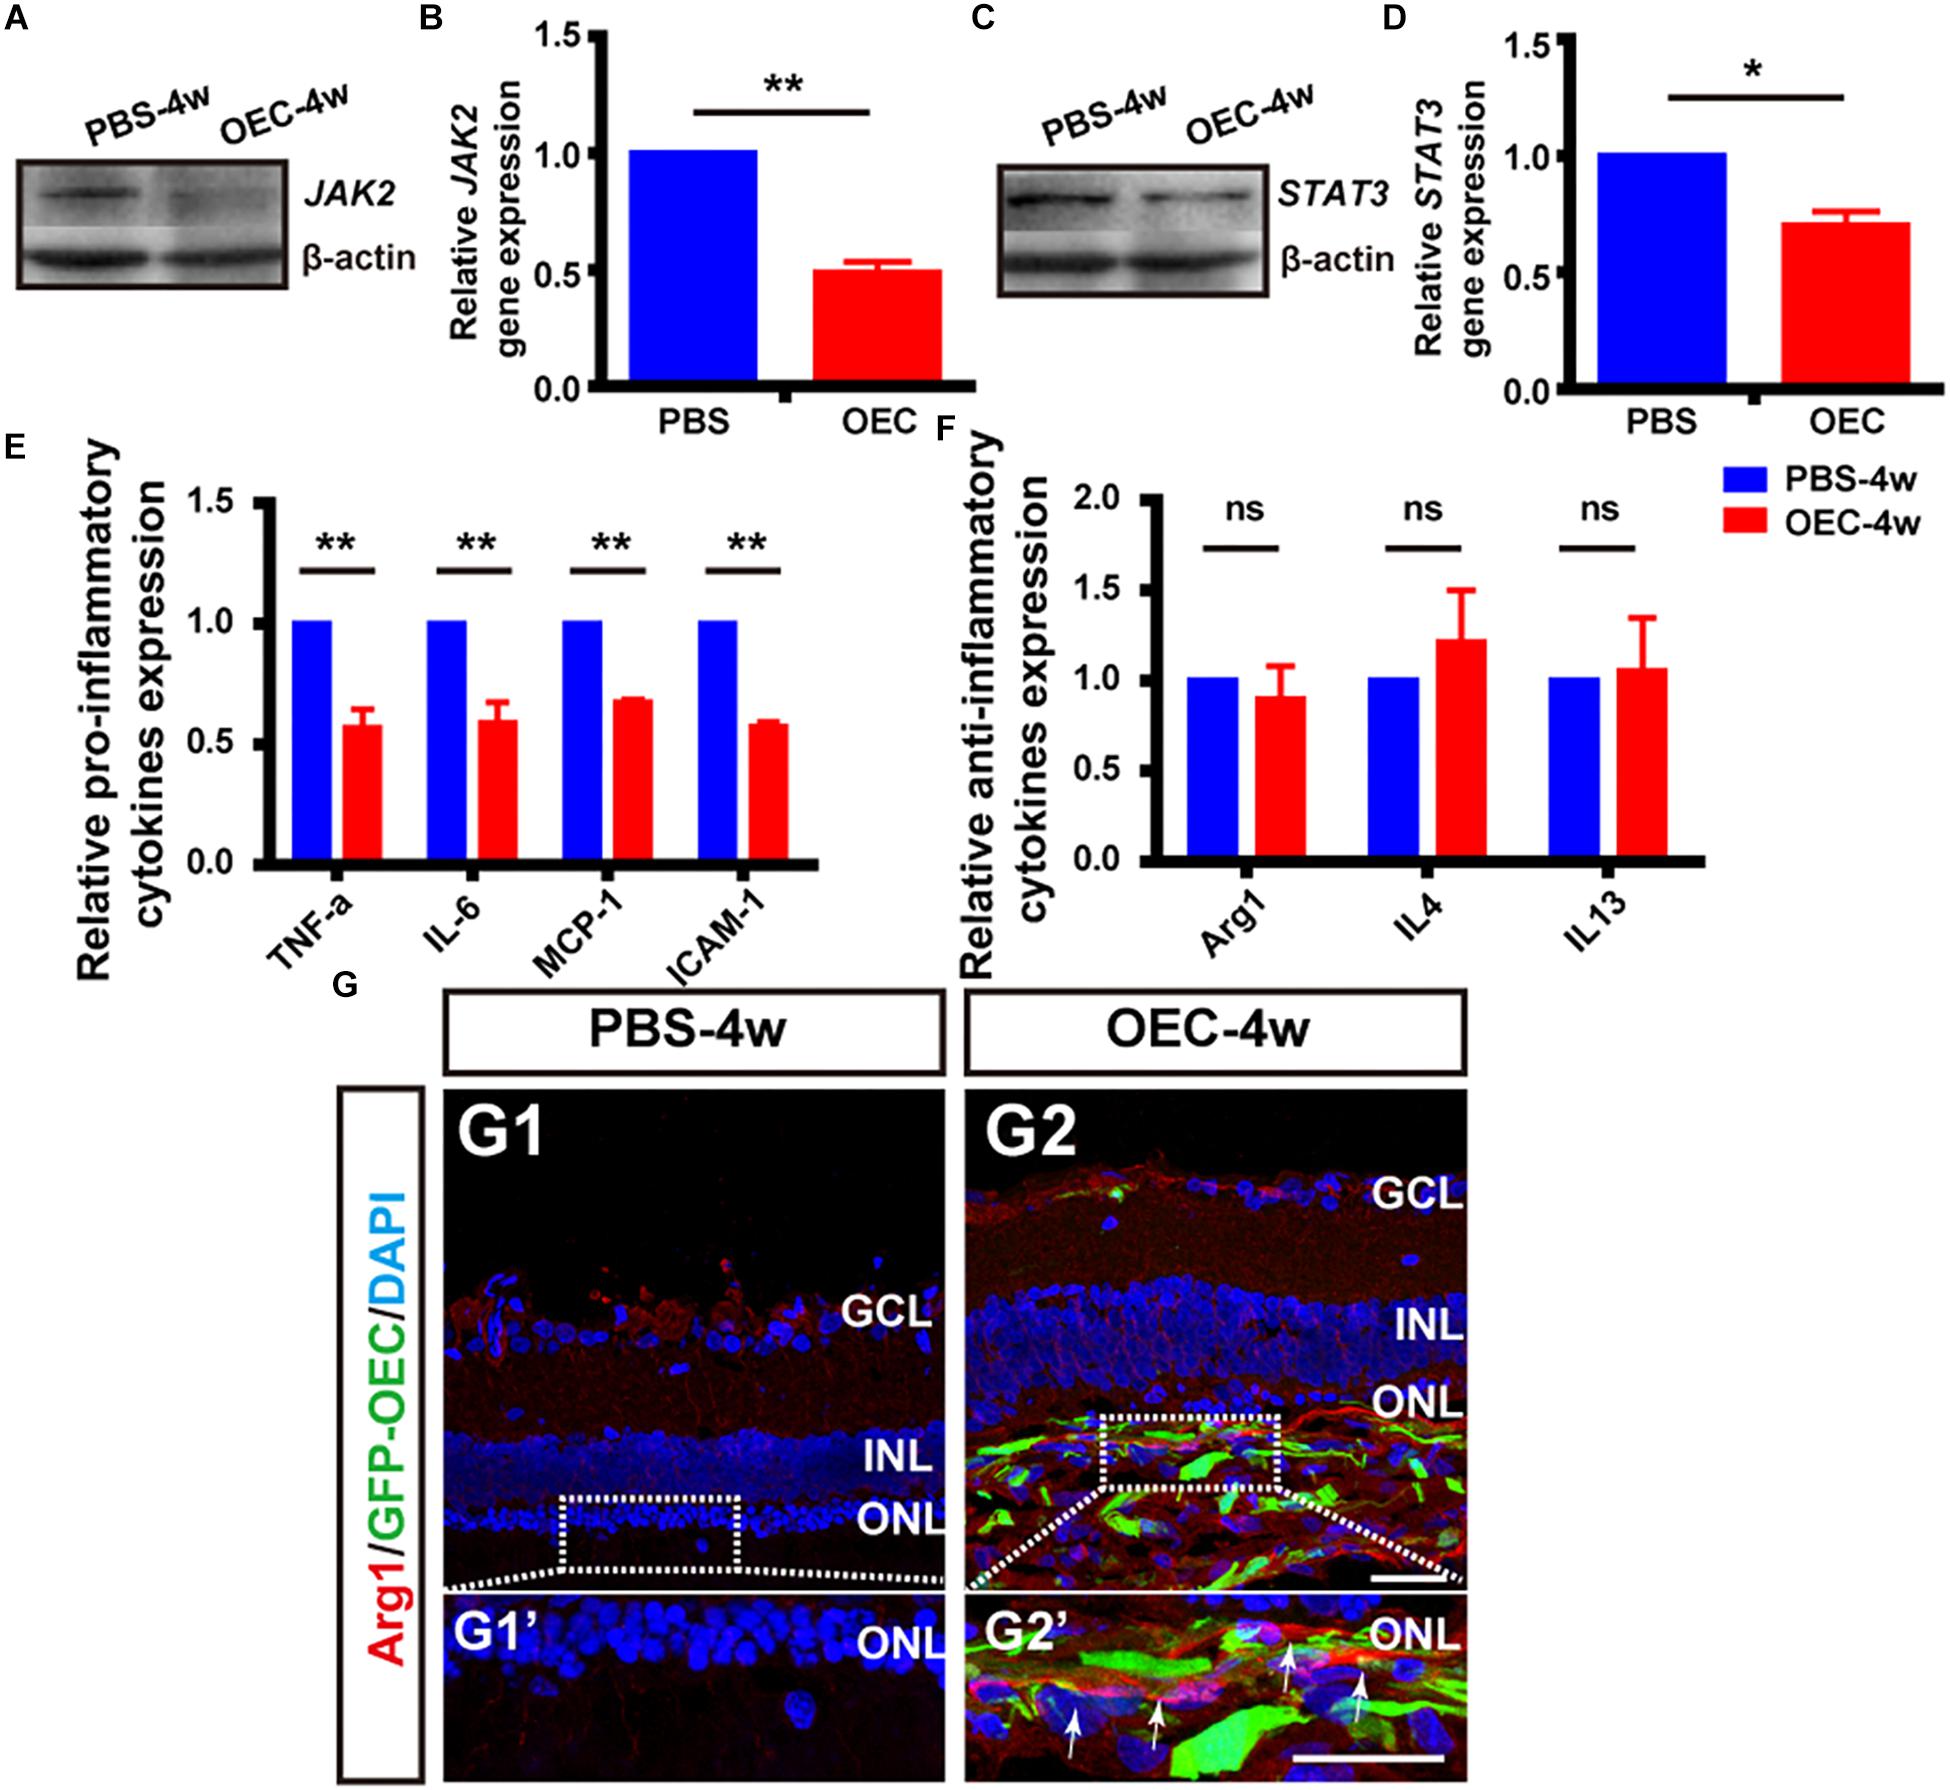
Figure 8. OECs inhibit the JAK2/STAT3 pathway and change the expression level of pro-inflammatory factors in vivo. (A,B) Example WB and group data showing effect on JAK2 expression of OEC transplantation, 4 weeks post-injection. (C,D) As per A, B, but for STAT3 expression. (E) mRNA expression levels of pro-inflammatory factors: TNF-α, IL-6, ICAM-1 and MCP-1 (n = 3 per bar, p < 0.05 for both vs. PBS-group control). (F) mRNA expression levels of anti-inflammatory factors: IL-4, IL-13, and Arg1 (n = 3 per bar, p > 0.05 for both vs. PBS-group control). (G) Immunohistology image, labeled with Arg1 (red) and DAPI (blue), of a retina from the PBS-group (G1) and OEC-group (G2), indicating increased Arg1-positive cell numbers in the transplantation area (white arrows). *p < 0.05, ∗∗p < 0.01; Scale bars: 50 μm.
OECs Delay Retinal Degeneration in RCS Rats
In previous studies, we have shown that transplanted OECs protect photoreceptors by releasing multiple neurotrophic factors, phagocytosing out segment, inhibiting Müller cell gliosis, and suppressing retinal oxidative stress reactions in rat models of retinal degeneration (Huo et al., 2011; Xie et al., 2017; Xue et al., 2017). Regardless of the model of retinal degeneration, we saw peak visual function improvement at 4 weeks post OEC transplantation. In the current study in RCS rats, we have shown a reduction in classically microglial activation and pro-inflammatory cytokine release at the same time point post OEC transplantation, and we therefore also tested visual function and observed retinal anatomy this key time point.
To determine visual function, we measured the amplitudes of the a-wave and b-wave from the ERG (Figure 9A). These are electrical features that are associated with the function of the outer and inner retina, respectively. B-wave amplitude was significantly larger in OEC-treated eyes than in PBS-treated controls (p < 0.05; Figure 9C). This suggested an improvement in inner-retinal function following OEC transplantation. However, there was no significant difference in a-wave amplitude between the transplant group and control group (p > 0.05; Figure 9B). As an additional negative control, we transplanted ONFs using the same procedure as OECs, and found no improvement in b-wave amplitude at 2, 3, or 4 weeks post-transplantation (Supplementary Figure S5).
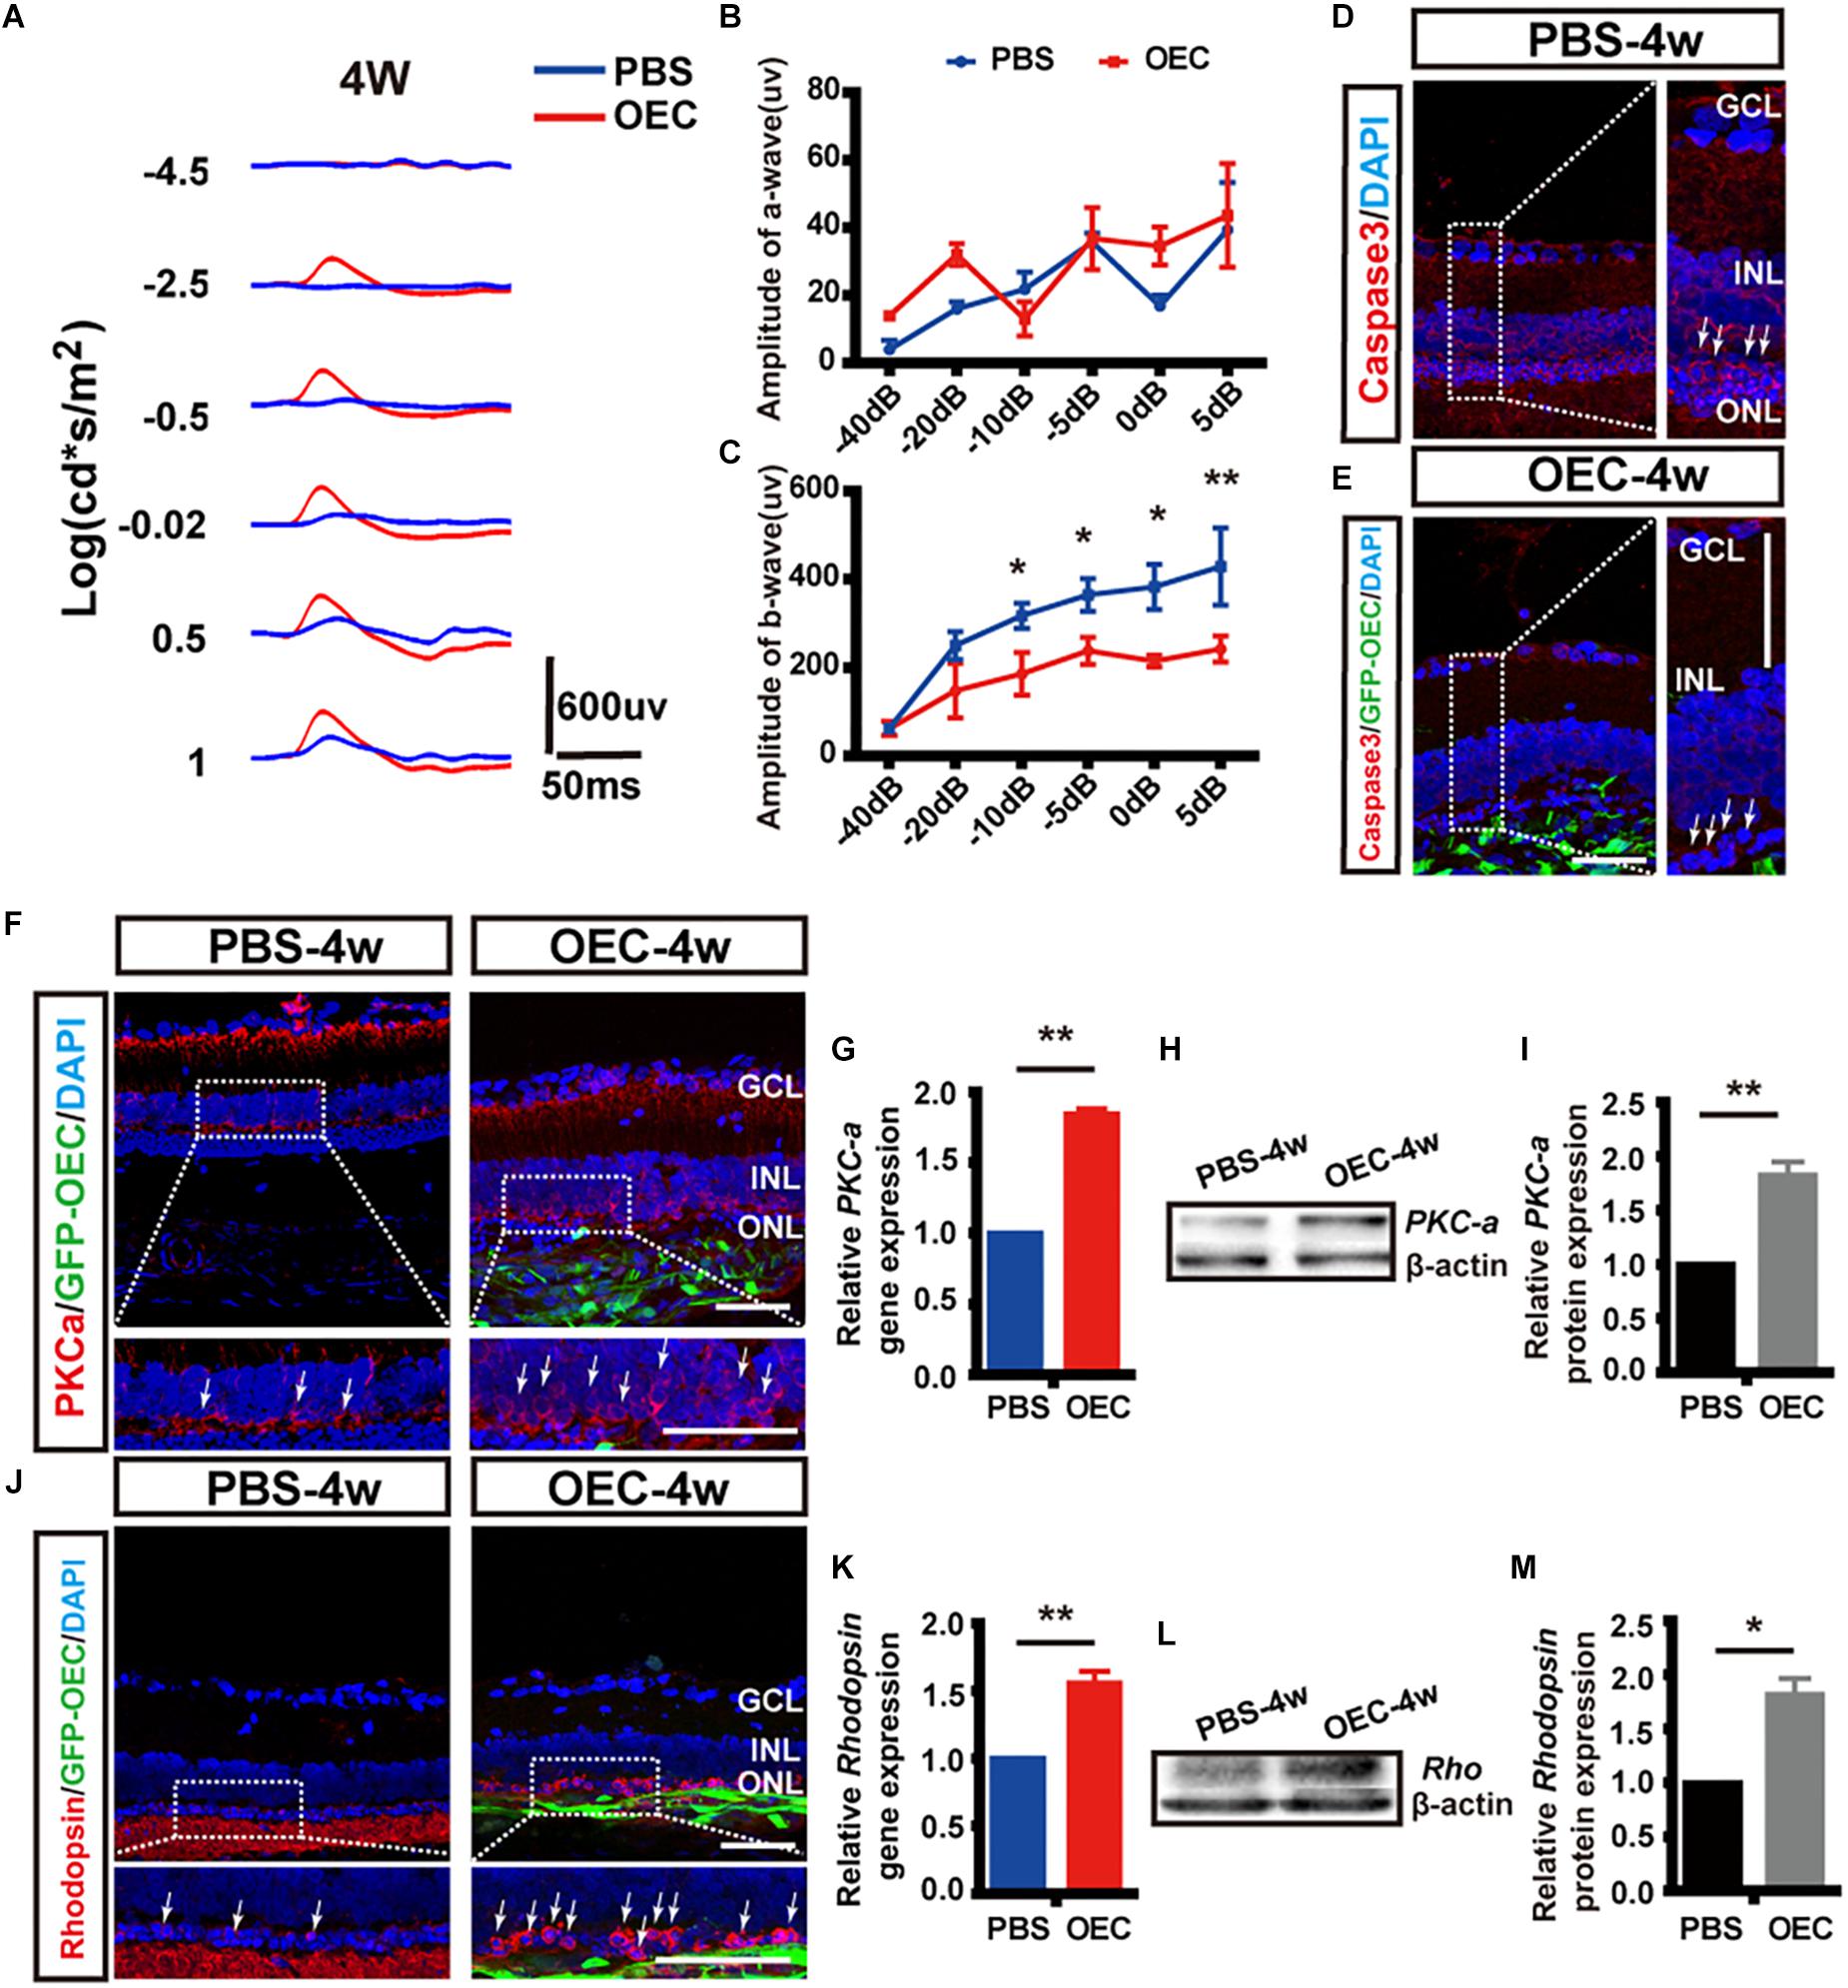
Figure 9. Subretinal OEC transplantation delays functional and anatomical retinal degeneration in RCS rats. (A) Representative ERG waveforms of a rat at 4 weeks post-OEC transplantation (red trace), or PBS control injection (blue trace). (B) ERG a-wave and (C) ERG b-wave amplitude at 4-weeks post OEC transplantation (vs. PBS control injection, n = 6). (D,E) Immunohistology images, labeled for caspase-3 (red), GFP (green, OECs) and DAPI (blue) in the retinas of the PBS (top), and OEC-treated (bottom) groups. White arrows indicate caspase-3 positive cells. (F) Immunohistology images, labeled for PKC-α (red) GFP (green, OECs) and DAPI (blue) in the retinas of the PBS (left) and OEC-treated (right) groups. White arrows indicate PKC-α positive cells. (G) Immunohistology images, labeled for Rhodopsin (red) GFP (green, OECs) and DAPI (blue) in the retinas of the PBS (left) and OEC-treated (right) groups. White arrows indicate Rhodopsin positive cells. (H,I) The mRNA level of PKC-α (H) and Rhodopsin (I) in the OEC-group at 4 weeks post-transplantation, expressed relative to the PBS control group. (J,K) Example western blot of PKC-α (J) and Rhodopsin (K) at 4 weeks post-treatment. (L,M) Quantification of protein expression level of PKC-α protein (L) and Rhodopsin (M) at 4 weeks post-treatment, measured relative to β-actin, and expressed relative to the PBS control group. *p < 0.05, ∗∗p < 0.01. ONL, outer nuclear layer; INL, inner nuclear layer; GCL, ganglion cell layer. Scale bars: 100 μm in A; 50 μm in B,H,I,J,N; 20 μm in each enlargement.
We next studied changes in the anatomical structure of the retina. During retinal degeneration, the number of photoreceptors in the ONL is reduced and the expression of Caspase-3 is increased (Gu et al., 2017). Using histological methods, we found that OEC reduced the expression of Caspase-3 in transplantation area, and there was noticeably increased preservation of photoreceptor numbers in the ONL (white arrows, Figures 9D,E). This suggested that the apoptosis of photoreceptors in RCS rats was reduced by OEC transplantation.
Immunohistochemistry showed that the expression of both PKC-α (Figure 9F), a marker of ON-bipolar cells (which contribute to the b-wave), and Rhodopsin (Figure 9G), a marker of photoreceptors (which contribute to the a-wave), was increased at 4 weeks post-OEC transplantation, and compared to PBS controls.
Finally, RT-PCR and WB were used to quantify gene and protein expression. The gene expression ratio of both PKC-α and Rhodopsin was significantly increased in the OEC-group compared with the PBS-group (PKC-α: 1.84 ± 0.04 fold, Figure 9H, n = 3 per group; Rhodopsin: 1.56 ± 0.09 fold, Figure 9I, n = 3 per group; p < 0.01 for each vs. PBS control). WB (Figures 9J,K) also showed up-regulation of PKC-α and Rhodopsin protein following OEC transplantation (PKC-α: 1.82 ± 0.12 fold, Figure 9L, n = 3 per group; Rhodopsin: 1.81 ± 0.15 fold, Figure 9M, n = 3 per group; p < 0.05 for both vs. PBS control). These results collectively demonstrate that OEC transplantation can protect photoreceptors and ON-bipolar cells, and preserve the ERG b-wave in the RCS retina.
Discussion
In the present study, we have shown how OECs can affect LPS-induced microglial activation profiles in vitro, how OEC transplantation in vivo can moderate the inflammatory microenvironment, protect photoreceptor and improve visual function, in chronic retinal degeneration animal model. Our results demonstrate that during RCS rats’ retinal degeneration, classically activated immune cells up-regulated JAK2/STAT3 pathway and produce persistent pro-inflammatory factors, but only transient anti-inflammatory factors in early stage. In vitro experiments showed that OECs exert immunomodulatory effects through a change of expression level of inflammatory factors in LPS-induced microglia activation: away from M(IL-6)-type (TNF-α, IL-6, MCP-1 and ICAM-1), toward M(Arg1)-type (Arg1, IL-4, IL-13), via a mechanism that is dependent on the JAK2/STAT3 pathway. OEC transplantation was able to improve the inflammatory microenvironment of RCS rats in vivo: indicated by a reduction in microglial/macrophage activation, down-regulated JAK2/STAT3 pathway and pro-inflammatory factors expression level. Finally, OEC transplantation helps preserve visual function and delay retinal neuron degeneration, partly via these effects on the microglia/macrophage-mediated inflammatory microenvironment.
Resident microglia have been reported to be rapidly activated and migrate toward the inflamed lesion under pathological conditions in the retina (Akhtar-Schäfer et al., 2018; Szepesi et al., 2018). In RCS rats with Mertk gene mutation, BRB disruption results in the recruitment of blood-borne macrophages to help phagocytosis the apoptotic photoreceptors (Fernández-Sánchez et al., 2018). In our study, TMEM119 was applied to distinguish resident microglia and infiltrating macrophages. Consistent with previous studies (Greenhalgh et al., 2018; Li et al., 2018), in the normal retina, we observed resident microglia with a quiescent, ramified morphology, with low Iba1, and TMEM119 staining. But in RCS rats, a large number of TMEM119-positive cells were only located in the ONL, whilst Iba1-positive cells located from the GCL to the subretinal space. Cells positive for both types of staining increased from the early stages (P30), and reached peak expression at around P60. As we know, Iba1 is the most common marker for activated microglia and macrophages. TMEM119 is a newly discovered and stable marker with unknown function for most or all mouse and human microglia, and it has been demonstrated that bone marrow-derived macrophages in the adult CNS do not express TMEM119 (Bennett et al., 2016). However, no one reported the expression manner of TMEM119 in rat’s retina. Therefore, the present study revealed that TMEM119+ cells located in ONL during retinal degeneration may stand for a subpopulation of resident microglia which associated with photoreceptor apoptosis, along with the Iba1+ microglia/infiltrating macrophages, play a crucial role in releasing of pro-inflammatory cytokines, and amplify the neurodegenerative disease process.
Emerging evidence suggests that there is a dynamic change of microglia/macrophage during the process of retinal degeneration. Jiao et al. (2015) reported the cytokines released by retinal microglia/macrophage changed from pro- to anti-inflammation-type following acute light injury from 24 h to 7 days. In rd1 mice (a rapid-onset model of RP) with rapid rods degenerative process, the activated microglia adopted M(IL-6)-dominent phenotype and lack of M(Arg1)-dominent phenotype (Zhou et al., 2017). In the P23H mice (a chronic RP model), retinal neuroinflammation persists throughout the mice life span, even after photoreceptor depletion (Noailles et al., 2016). In the present study, we found evidence of a prominent and persistent M(IL-6) phenotype and a transient M(Arg1) phenotype in a RCS rat model of RP. Pro-inflammatory cytokines expression was increased in early life time, and reached a peak (hundreds of times higher than normal rat retinas) around P60. Anti-inflammatory cytokines expression was also increased many-fold at P30, but by P60, fell below control levels. These results suggest that some anti-inflammatory cytokines are activated in the degenerative retina to enhance debris phagocytosis, release protective/trophic factors, and support regeneration in the early stages. However, as degeneration continues, pro-inflammatory cytokines are robustly releasing by M(IL-6)-type microglia/macrophages, causing expanding tissue damage, and worsen disease. Interestingly, the microglia/macrophage activation pattern found in this study, with an early peak in anti-inflammatory factors expression, is in contrast to the more commonly observed pro- to anti-inflammatory cytokines shift described in the injury in CNS, including in spinal cord injury (SCI) (Kigerl et al., 2009), stroke (Hu et al., 2012), and traumatic brain injury (Wang et al., 2013).
Two recent studies have demonstrated that OECs can change the microglia/macrophage polarization toward M(Arg1) in a SCI model, and this is accompanied by an inhibition of local inflammatory responses (Khankan et al., 2016; Zhang et al., 2017), but they didn’t mention the possible mechanism. To investigate the specific immunomodulatory effect of OECs on microglia in retina, we used an in vitro Transwell co-culture system and an in vivo OEC transplantation model. In vitro, we found that OECs not only reduced Iba1 and TMEM119 expression induced by LPS which stand for microglia cell line activation, but also changed the cytokines expression level of BV2 cells from the destructive M(IL-6) phenotype toward the neuroprotective and tissue-reparative M(Arg1) phenotype. Because of the complex microenvironment, the result of in vivo studies were not all the same as in vitro ones. In RCS rats, we confirmed a reduction of TMEM119+ resident microglial activation and a stable expression of Iba1. As we reported before, OECs, like microglia, and have the function of phagocytosis (Li et al., 2017). Some anatomy studies also suggested OECs are the primary immune cells in olfactory nervous system (Gladwin and Choi, 2015; Barton et al., 2017), but there is no reported correlation between Iba1 and OEC in past studies. From our study, immunohistochemistry demonstrates OECs co-expressed Iba1 and its specific marker NGFRp75. Presumably although the transplanted OECs suppressed the Iba1 level expressed by both resident microglia and infiltrated macrophages in transplanted area, due to the OEC itself also expressed Iba1, the whole detection level in post-transplanted retina did not vary significantly. RT-PCR result showed a decrease in pro-inflammatory cytokines and a stable in anti-inflammatory cytokines expression from whole retinal detection. Although the mRNA level of anti-inflammatory cytokines did not show significant change, the immunohistochemistry showed that Arg1-positive cells were notably increased surrounding transplantation area. We suspected OEC may increase anti-inflammatory cytokines in the transplantation area, but as the amount is limited, it couldn’t be detected in whole retinal tissue.
Mechanistically, the most critical question to address is how OECs regulate microglial activation and the M(IL-6)/M(Arg1) phenotype switch. Among numerous pathways, the JAK/STAT pathway is thought to be key regulator. It is reported that IFN-γ induced STAT1 activation leads to an increase in production of pro-inflammatory cytokines, and programs microglia/macrophages to the M(IL-6) phenotype (Qin et al., 2012). In contrast, STAT6 activation contributes to anti-inflammatory M(Arg1) phenotype and the release of neurotrophic factors, Arg1, IL-4, and IL-13. STAT3 involve both Arg1-stimulated M2 polarization and IL-6-stimulated M1 polarization (Martinez and Gordon, 2014). In our research, in vivo experiments demonstrated that the JAK2/STAT3 pathway became activated during degenerative period which was the same as research on retinal degeneration has shown that JAK2 and STAT3 proteins are involved in photoreceptor apoptosis, especially in rd1 mice model (Samardzija et al., 2006; Lange et al., 2010). After OEC co-cultured or transplanted, both JAK2 and STAT3 protein expression was strongly reduced. By using a specific chemical antagonist of JAK2, AG490 to pretreat OEC, we were able to demonstrate that the mechanism by which OECs appear to reduce retinal microglial activation and inflammation is JAK2-dependent. Recent studies about macrophage polarization have established strong potential in suppressing of cytokine signaling (SOCS) proteins. SOCS proteins, especially SOCS3, not only suppresses JAK tyrosine kinase activity and negatively regulate JAK/STAT pathway, but also inhibits gp130-related cytokine receptors and abrogates IL-6-induced pro-inflammatory effects (Carow and Rottenberg, 2014). In macrophages, SOCS3 inhibits STAT3 activity preserving the natural cytotoxicity of M1 and develop characteristics of M2a activated cells (Liu et al., 2008). Qin et al. reported astrocytes expressed SOCS1 and SOCS3 (Qin et al., 2008) while Girolami et al. (2010) found SOCS3 expression is restricted mainly to Schwann cells in peripheral nerve injury. Consistent with both astrocytes and Schwann cells, SOCS3 immunoreactivity was observed in OECs. The mRNA expression of SOCS3 in OECs was enhanced significantly from 12 to 48 h after co-cultured with LPS induced BV2 cells. As during retinal degeneration, the apoptosis of photoreceptors and glia cell produce a large number of IL-6, which band to gp130, and form a complex to activate the kinase function of JAK2. JAK2 then phosphorylate STAT3, two phosphorylated STAT3 translocate into the cell nucleus, and promote pro-inflammatory factors gene transcription (Yin et al., 2015). We speculated as the OECs high expressing SOCS3, after co-cultured or transplanted, the IL-6 was regulated, and the cascade JAK/STAT pathway was inhibited. Suppression of the JAK/STAT pathway result in a switch of the proinflammatory phenotype to the anti-inflammatory M2 phenotype, as M2-related genes, such as IL-4 and Arg1, were altered significantly in vitro.
Finally, we found substantial improvement in visual function and anatomical retinal structure following OEC transplantation in RCS rats. OECs led to nearly a twofold increase in the amplitude of the ERG b-wave, a significant inhibition of Caspase-3 expression, a up-regulated gene and protein expression of PKC-α and Rhodopsin protein which stand for ON-bipolar cells and photoreceptors. Similarly, OECs have been found to modulate the host immune response, and promotes preservation of neurons and axons in a rat model of SCI (Khankan et al., 2016). In addition, transplanted OEC promote the macrophage shift from M(INF-γ) to M(IL-4) and significantly improve motor function after SCI (Zhang et al., 2017). Therefore, combined with the previous research, we conducted the OEC injection modulate microenvironment through secrete neurotrophic factors, inhibit Müller cell gliosis, anti-oxidant, and immunomodulatory mechanisms in retinal degenerative models (Huo et al., 2011, 2012; Xie et al., 2017; Xue et al., 2017) to protect photoreceptors and inner neurons. Finally, in this study, we demonstrated that OECs have effect on activated microglia polarization from M(IL-6) to M(Arg1) through JAK2/STAT3 pathway. In addition, alleviation of activated resident microglia and reduction of pro-inflammatory microenvironment by OEC transplantation contributed to substantial visual function and structure improvement.
Data Availability
The raw data supporting the conclusions of this manuscript will be made available by the authors, without undue reservation, to any qualified researcher.
Ethics Statement
All surgical procedures and post-operative care were conducted in accordance with protocols approved by the TMMU Institutional Animal Care and Use Committee.
Author Contributions
JX conceived and designed the study, collected and assembled the data, carried out the data analysis, interpreted the data, and wrote the manuscript. YL, JD, YH, DS, and CD collected and assembled the data. HX conceived and designed the study, carried out the data analysis, interpreted the data, and wrote and approved the final version of the manuscript. ZY conceived and designed the study, was responsible for the financial support, carried out the data analysis, interpreted the data, and approved the final version of the manuscript.
Funding
This work was supported by the National Key Basic Research Program of China (973 Project 2013CB967002), the National Nature Science Foundation of China (81670857 and 81873688), and a Third Military Medical University Translational Grant (swh2016zdcx2016).
Conflict of Interest Statement
The authors declare that the research was conducted in the absence of any commercial or financial relationships that could be construed as a potential conflict of interest.
Acknowledgments
The authors would like to thank all the laboratory staff who were involved in this work.
Supplementary Material
The Supplementary Material for this article can be found online at: https://www.frontiersin.org/articles/10.3389/fncel.2019.00341/full#supplementary-material
References
Akhtar-Schäfer, I., Wang, L., Krohne, T. U., Xu, H., and Langmann, T. (2018). Modulation of three key innate immune pathways for the most common retinal degenerative diseases. EMBO Mol. Med. 10:e8259. doi: 10.15252/emmm.201708259
Athanasiou, D., Aguila, M., Bellingham, J., Li, W., McCulley, C., Reeves, P. J., et al. (2018). The molecular and cellular basis of rhodopsin retinitis pigmentosa reveals potential strategies for therapy. Prog. Retin Eye Res. 62, 1–23. doi: 10.1016/j.preteyeres.2017.10.002
Barton, M. J., John, J. S., Clarke, M., Wright, A., and Ekberg, J. (2017). The glia response after peripheral nerve injury: a comparison between schwann cells and olfactory ensheathing cells and their uses for neural regenerative therapies. Int. J. Mol. Sci. 18:E287. doi: 10.3390/ijms18020287
Ben, M., Barek, K., and Monville, C. (2019). Cell therapy for retinal dystrophies: from cell suspension formulation to complex retinal tissue bioengineering. Stem. Cells Int. 2019:4568979. doi: 10.1155/2019/4568979
Bennett, M. L., Bennett, F. C., Liddelow, S. A., Ajami, B., Zamanian, J. L., Fernhoff, N. B., et al. (2016). New tools for studying microglia in the mouse and human CNS. Proc. Natl. Acad. Sci. U. S. A. 113, E1738–E1746. doi: 10.1073/pnas.1525528113
Biscaro, B., Lindvall, O., Tesco, G., Ekdahl, C. T., and Nitsch, R. M. (2012). Inhibition of microglial activation protects hippocampal neurogenesis and improves cognitive deficits in a transgenic mouse model for Alzheimer’s disease. Neurodegener. Dis. 9, 187–198. doi: 10.1159/000330363
Carow, B., and Rottenberg, M. E. (2014). SOCS3, a major regulator of infection and inflammation. Front. Immunol. 5:58. doi: 10.3389/fimmu.2014.00058
Chuah, M. I., Hale, D. M., and West, A. K. (2011). Interaction of olfactory ensheathing cells with other cell types in vitro and after transplantation: glial scars and inflammation. Exp. Neurol. 229, 46–53. doi: 10.1016/j.expneurol.2010.08.012
Dai, C., Khaw, P. T., Yin, Z. Q., Li, D., Raisman, G., and Li, Y. (2012). Olfactory ensheathing cells rescue optic nerve fibers in a rat glaucoma model. Transl. Vis. Sci. Technol. 1:3. doi: 10.1167/tvst.1.2.3
Dai, J., Fu, Y., Zeng, Y., Li, S., and Qin Yin, Z. (2017). Improved retinal function in RCS rats after suppressing the over-activation of mGluR5. Sci. Rep. 7:3546. doi: 10.1038/s41598-017-03702-z
Dai, J. N., Zong, Y., Zhong, L. M., Li, Y. M., Zhang, W., Bian, L. G., et al. (2011). Gastrodin inhibits expression of inducible NO synthase, cyclooxygenase-2 and proinflammatory cytokines in cultured LPS-stimulated microglia via MAPK pathways. PLoS One 6:e21891. doi: 10.1371/journal.pone.0021891
de Hoz, R., Rojas, B., Ramírez, A. I., Salazar, J. J., Gallego, B. I., Trivio, A., et al. (2016). Retinal macroglial responses in health and disease. Biomed. Res. Int. 2016:2954721. doi: 10.1155/2016/2954721
Edholm, E. S., Rhoo, K. H., and Robert, J. (2017). Evolutionary aspects of macrophages polarization. Results Probl. Cell Differ. 62, 3–22. doi: 10.1007/978-3-319-54090-0_1
Fernández-Sánchez, L., Esquiva, G., Pinilla, I., Lax, P., and Cuenca, N. (2018). Retinal vascular degeneration in the transgenic p23h rat model of retinitis pigmentosa. Front. Neuroanat. 12:55. doi: 10.3389/fnana.2018.00055
Fu, X. M., Liu, S. J., Dan, Q. Q., Wang, Y. P., Lin, N., Lv, L. Y., et al. (2015). Combined bone mesenchymal stem cell and olfactory ensheathing cell transplantation promotes neural repair associated with cntf expression in traumatic brain-injured rats. Cell Transplant. 24, 1533–1544. doi: 10.3727/096368914X679345
Fu, Y., Hou, B., Weng, C., Liu, W., Dai, J., Zhao, C., et al. (2017). Functional ectopic neuritogenesis by retinal rod bipolar cells is regulated by miR-125b-5p during retinal remodeling in RCS rats. Sci. Rep. 7:1011. doi: 10.1038/s41598-017-01261-x
Garrido-Mesa, N., Zarzuelo, A., and Gálvez, J. (2013). Minocycline: far beyond an antibiotic. Br. J. Pharmacol. 169, 337–352. doi: 10.1111/bph.12139
Girolami, E. I., Bouhy, D., Haber, M., Johnson, H., and David, S. (2010). Differential expression and potential role of SOCS1 and SOCS3 in wallerian degeneration in injured peripheral nerve. Exp. Neurol. 223, 173–182. doi: 10.1016/j.expneurol.2009.06.018
Gladwin, K., and Choi, D. (2015). Olfactory ensheathing cells: part I—current concepts and experimental laboratory models. World Neurosurg. 83, 114–119. doi: 10.1016/j.wneu.2013.03.010
Greenhalgh, A. D., Zarruk, J. G., Healy, L. M., Baskar Jesudasan, S. J., Jhelum, P., Salmon, C. K., et al. (2018). Peripherally derived macrophages modulate microglial function to reduce inflammation after CNS injury. PLoS Biol. 16:e2005264. doi: 10.1371/journal.pbio.2005264
Gu, R., Tang, W., Lei, B., Ding, X., Jiang, C., and Xu, G. (2017). Glucocorticoid-induced leucine zipper protects the retina from light-induced retinal degeneration by inducing Bcl-xL in rats. Invest. Ophthalmol. Vis. Sci. 58, 3656–3668. doi: 10.1167/iovs.17-22116
He, X., Sun, D., Chen, S., and Xu, H. (2017). Activation of liver X receptor delayed the retinal degeneration of rd1 mice through modulation of the immunological function of glia. Oncotarget 8, 32068–32082. doi: 10.18632/oncotarget.16643
Hou, L., Zhou, X., Zhang, C., Wang, K., Liu, X., Che, Y., et al. (2017). NADPH oxidase-derived H2O2 mediates the regulatory effects of microglia on astrogliosis in experimental models of Parkinson’s disease. Redox Biol. 12, 162–170. doi: 10.1016/j.redox.2017.02.016
Hu, X., Leak, R. K., Shi, Y., Suenaga, J., Gao, Y., Zheng, P., et al. (2015). Microglial and macrophage polarization—new prospects for brain repair. Nat. Rev. Neurol. 11, 56–64. doi: 10.1038/nrneurol.2014.207
Hu, X., Li, P., Guo, Y., Wang, H., Leak, R. K., Chen, S., et al. (2012). Microglia/macrophage polarization dynamics reveal novel mechanism of injury expansion after focal cerebral ischemia. Stroke 43, 3063–3070. doi: 10.1161/STROKEAHA.112.659656
Huo, S. J., Li, Y., Raisman, G., and Yin, Z. Q. (2011). Transplanted olfactory ensheathing cells reduce the gliotic injury response of müller cells in a rat model of retinitis pigmentosa. Brain Res. 1382, 238–244. doi: 10.1016/j.brainres.2010.12.079
Huo, S. J., Li, Y. C., Xie, J., Li, Y., Raisman, G., Zeng, Y. X., et al. (2012). Transplanted olfactory ensheathing cells reduce retinal degeneration in royal college of surgeons rats. Curr. Eye Res. 37, 749–758. doi: 10.3109/02713683.2012.697972
Ito, T., Ikeda, K., Tomita, K., and Yokoyama, S. (2010). Interleukin-6 upregulates the expression of PMP22 in cultured rat Schwann cells via a JAK2-dependent pathway. Neurosci. Lett. 472, 104–108. doi: 10.1016/j.neulet.2010.01.061
Jiao, H., Natoli, R., Valter, K., Provis, J. M., and Rutar, M. (2015). Spatiotemporal cadence of macrophage polarisation in a model of light-induced retinal degeneration. PLoS One 10:e0143952. doi: 10.1371/journal.pone.0143952
Khankan, R. R., Griffis, K. G., Haggerty-Skeans, J. R., Zhong, H., Roy, R. R., Edgerton, V. R., et al. (2016). Olfactory ensheathing cell transplantation after a complete spinal cord transection mediates neuroprotective and immunomodulatory mechanisms to facilitate regeneration. J. Neurosci. 36, 6269–6286. doi: 10.1523/JNEUROSCI.0085-16.2016
Kigerl, K. A., Gensel, J. C., Ankeny, D. P., Alexander, J. K., Donnelly, D. J., and Popovich, P. G. (2009). Identification of two distinct macrophage subsets with divergent effects causing either neurotoxicity or regeneration in the injured mouse spinal cord. J. Neurosci. 29, 13435–13444. doi: 10.1523/JNEUROSCI.3257-09.2009
Kyger, M., Worley, A., and Adamus, G. (2013). Autoimmune responses against photoreceptor antigens during retinal degeneration and their role in macrophage recruitment into retinas of RCS rats. JNeuroimmunol. 254, 91–100. doi: 10.1016/j.jneuroim.2012.10.007
Lange, C., Thiersch, M., Samardzija, M., and Grimm, C. (2010). The differential role of Jak/STAT signaling in retinal degeneration. Adv. Exp. Med. Biol. 664, 601–607. doi: 10.1007/978-1-4419-1399-9_69
Li, Q., Lan, X., Han, X., and Wang, J. (2018). Expression of Tmem119/Sall1 and Ccr2/CD69 in FACS-Sorted microglia- and monocyte/macrophage-enriched cell populations after intracerebral hemorrhage. Front. Cell Neurosci. 12:520. doi: 10.3389/fncel.2018.00520
Li, Y., Field, P. M., and Raisman, G. (1997). Repair of adult rat corticospinal tract by transplants of olfactory ensheathing cells. Science 277, 2000–2002. doi: 10.1126/science.277.5334.2000
Li, Y., Zou, T., Xue, L., Yin, Z. Q., Huo, S., and Xu, H. (2017). TGF-β1 enhances phagocytic removal of neuron debris and neuronal survival by olfactory ensheathing cells via integrin/MFG-E8 signaling pathway. Mol. Cell. Neurosci. 85, 45–56. doi: 10.1016/j.mcn.2017.08.006
Li, Z., Zeng, Y., Chen, X., Li, Q., Wu, W., Xue, L., et al. (2016). Neural stem cells transplanted to the subretinal space of rd1 mice delay retinal degeneration by suppressing microglia activation. Cytotherapy 18, 771–784. doi: 10.1016/j.jcyt.2016.03.001
Liu, Y., Stewart, K. N., Bishop, E., Marek, C. J., Kluth, D. C., Rees, A. J., et al. (2008). Unique expression of suppressor of cytokine signaling 3 is essential for classical macrophage activation in rodents in vitro and in vivo. J. Immunol. 180, 6270–6278. doi: 10.4049/jimmunol.180.9.6270
Liu, Y., Yang, X., Utheim, T. P., Guo, C., Xiao, M., Liu, Y., et al. (2013). Correlation of cytokine levels and microglial cell infiltration during retinal degeneration in RCS rats. PLoS One 8:e82061. doi: 10.1371/journal.pone.0082061
Martinez, F. O., and Gordon, S. (2014). The M1 and M2 paradigm of macrophage activation: time for reassessment. F1000Prime Rep. 6:13. doi: 10.12703/P6-13
Neves, J., Zhu, J., Sousa-Victor, P., Konjikusic, M., Riley, R., Chew, S., et al. (2016). Immune modulation by MANF promotes tissue repair and regenerative success in the retina. Science 353:aaf3646. doi: 10.1126/science.aaf3646
Noailles, A., Maneu, V., Campello, L., Gómez-Vicente, V., Lax, P., and Cuenca, N. (2016). Persistent inflammatory state after photoreceptor loss in an animal model of retinal degeneration. Sci. Rep. 6:33356. doi: 10.1038/srep33356
Peng, B., Xiao, J., Wang, K., So, K. F., Tipoe, G. L., and Lin, B. (2014). Suppression of microglial activation is neuroprotective in a mouse model of human retinitis pigmentosa. J. Neurosci. 34, 8139–8150. doi: 10.1523/JNEUROSCI.5200-13.2014
Qin, H., Buckley, J. A., Li, X., Liu, Y., Fox, T. H. III, Meares, G. P., et al. (2016). Inhibition of the JAK/STAT Pathway protects against α-Synuclein-Induced neuroinflammation and dopaminergic neurodegeneration. J. Neurosci. 36, 5144–5159. doi: 10.1523/JNEUROSCI.4658-15.2016
Qin, H., Holdbrooks, A. T., Liu, Y., Reynolds, S. L., Yanagisawa, L. L., and Benveniste, E. N. (2012). SOCS3 deficiency promotes M1 macrophage polarization and inflammation. J. Immunol. 189, 3439–3448. doi: 10.4049/jimmunol.1201168
Qin, H., Niyongere, S. A., Lee, S. J., Baker, B. J., and Benveniste, E. N. (2008). Expression and functional significance of SOCS-1 and SOCS-3 in astrocytes. J. Immunol. 181, 3167–3176. doi: 10.4049/jimmunol.181.5.3167
Ramirez, A. I., de Hoz, R., Salobrar-Garcia, E., Salazar, J. J., Rojas, B., Ajoy, D., et al. (2017). The Role of microglia in retinal neurodegeneration: alzheimer’s disease, parkinson, and glaucoma. Front. Aging Neurosci. 9:214. doi: 10.3389/fnagi.2017.00214
Ransohoff, R. M. (2016). A polarizing question: do M1 and M2 microglia exist. Nat. Neurosci. 19, 987–991. doi: 10.1038/nn.4338
Samardzija, M., Wenzel, A., Aufenberg, S., Thiersch, M., Remé, C., and Grimm, C. (2006). Differential role of Jak-STAT signaling in retinal degenerations. FASEB J. 20, 2411–2413. doi: 10.1096/fj.06-5895fje
Sevenich, L. (2018). Brain-resident microglia and blood-borne macrophages orchestrate central nervous system inflammation in neurodegenerative disorders and brain cancer. Front. Immunol. 9:697. doi: 10.3389/fimmu.2018.00697
Shen, W., Li, S., Chung, S. H., and Gillies, M. C. (2010). Retinal vascular changes after glial disruption in rats. J. Neurosci. Res. 88, 1485–1499. doi: 10.1002/jnr.22317
Sica, A., and Bronte, V. (2007). Altered macrophage differentiation and immune dysfunction in tumor development. J. Clin. Invest. 117, 1155–1166. doi: 10.1172/jci31422
Subramaniam, S. R., and Federoff, H. J. (2017). Targeting microglial activation states as a therapeutic avenue in parkinson’s disease. Front. Aging Neurosci. 9:176. doi: 10.3389/fnagi.2017.00176
Szepesi, Z., Manouchehrian, O., Bachiller, S., and Deierborg, T. (2018). Bidirectional microglia-neuron communication in health and disease. Front. Cell Neurosci. 12:323. doi: 10.3389/fncel.2018.00323
Tam, W. Y., and Ma, C. H. (2014). Bipolar/rod-shaped microglia are proliferating microglia with distinct M1/M2 phenotypes. Sci. Rep. 4:7279. doi: 10.1038/srep07279
Vincent, A. J., Taylor, J. M., Choi-Lundberg, D. L., West, A. K., and Chuah, M. I. (2005). Genetic expression profile of olfactory ensheathing cells is distinct from that of Schwann cells and astrocytes. Glia 51, 132–147. doi: 10.1002/glia.20195
Wang, G., Zhang, J., Hu, X., Zhang, L., Mao, L., Jiang, X., et al. (2013). Microglia/macrophage polarization dynamics in white matter after traumatic brain injury. J. Cereb. Blood Flow Metab. 33, 1864–1874. doi: 10.1038/jcbfm.2013.146
Wohleb, E. S. (2016). Neuron-microglia interactions in mental health disorders: “for better, and for worse”. Front. Immunol. 7:544. doi: 10.3389/fimmu.2016.00544
Xie, J., Huo, S., Li, Y., Dai, J., Xu, H., and Yin, Z. Q. (2017). Olfactory ensheathing cells inhibit gliosis in retinal degeneration by downregulation of the müller cell notch signaling pathway. Cell Transplant. 26, 967–982. doi: 10.3727/096368917x694994
Xu, H., Chen, M., and Forrester, J. V. (2009). Para-inflammation in the aging retina. Prog. Retin Eye Res. 28, 348–368. doi: 10.1016/j.preteyeres.2009.06.001
Xue, L., Zeng, Y., Li, Q., Li, Y., Li, Z., Xu, H., et al. (2017). Transplanted olfactory ensheathing cells restore retinal function in a rat model of light-induced retinal damage by inhibiting oxidative stress. Oncotarget 8, 93087–93102. doi: 10.18632/oncotarget.21857
Yin, Y., Liu, W., and Dai, Y. (2015). SOCS3 and its role in associated diseases. Hum. Immunol. 76, 775–780. doi: 10.1016/j.humimm.2015.09.037
Zhang, J., Chen, H., Duan, Z., Chen, K., Liu, Z., Zhang, L., et al. (2017). The Effects of Co-transplantation of olfactory ensheathing cells and schwann cells on local inflammation environment in the contused spinal cord of rats. Mol. Neurobiol. 54, 943–953. doi: 10.1007/s12035-016-9709-5
Zhou, T., Huang, Z., Sun, X., Zhu, X., Zhou, L., Li, M., et al. (2017). Microglia polarization with m1/m2 phenotype changes in rd1 mouse model of retinal degeneration. Front. Neuroanat. 11:77. doi: 10.3389/fnana.2017.00077
Zhu, J., Cifuentes, H., Reynolds, J., and Lamba, D. A. (2017). Immunosuppression via loss of IL2rγ enhances long-term functional integration of hESC-derived photoreceptors in the mouse retina. Cell Stem Cell. 20:374-384.e5. doi: 10.1016/j.stem.2016.11.019
Keywords: retinitis pigmentosa, microglia, infiltrated macrophage neuroinflammation, JAK/STAT pathway, olfactory ensheathing cell
Citation: Xie J, Li Y, Dai J, He Y, Sun D, Dai C, Xu H and Yin ZQ (2019) Olfactory Ensheathing Cells Grafted Into the Retina of RCS Rats Suppress Inflammation by Down-Regulating the JAK/STAT Pathway. Front. Cell. Neurosci. 13:341. doi: 10.3389/fncel.2019.00341
Received: 17 April 2019; Accepted: 11 July 2019;
Published: 25 July 2019.
Edited by:
Guei-Sheung Liu, University of Tasmania, AustraliaReviewed by:
Jiang-Hui Wang, Centre for Eye Research Australia, AustraliaChristelle Monville, INSERM U861 Institut des Cellules Souches pour le Traitement et l’Étude des Maladies Monogéniques, France
Copyright © 2019 Xie, Li, Dai, He, Sun, Dai, Xu and Yin. This is an open-access article distributed under the terms of the Creative Commons Attribution License (CC BY). The use, distribution or reproduction in other forums is permitted, provided the original author(s) and the copyright owner(s) are credited and that the original publication in this journal is cited, in accordance with accepted academic practice. No use, distribution or reproduction is permitted which does not comply with these terms.
*Correspondence: Haiwei Xu, aGFpd2VpeHUyMDAxQDE2My5jb20=; Zheng Qin Yin, cWluenlpbkBhbGl5dW4uY29t
 Jing Xie
 Yijian Li
 Jiaman Dai
 Yan He
 Dayu Sun
 Chao Dai
 Haiwei Xu
 Zheng Qin Yin