 Radwa Khalil
 Ahmed A. Karim
 Eman Khedr
 Marie Moftah
 Ahmed A. Moustafa
- 1Department of Psychology and Methods, Jacobs University Bremen, Bremen, Germany
- 2University Clinic of Psychiatry and Psychotherapy, Tübingen, Germany
- 3Department of Neuropsychiatry, Faculty of Medicine, Assiut University, Assiut, Egypt
- 4Zoology Department, Faculty of Science, Alexandria University, Alexandria, Egypt
- 5MARCS Institute for Brain and Behaviour, Western Sydney University, Sydney, NSW, Australia
- 6Department of Social Sciences, College of Arts and Sciences, Qatar University, Doha, Qatar
Several factors regulate cortical development, such as changes in local connectivity and the influences of dynamical synapses. In this study, we simulated various factors affecting the regulation of neural network activity during cortical development. Previous studies have shown that during early cortical development, the reversal potential of GABAA shifts from depolarizing to hyperpolarizing. Here we provide the first integrative computational model to simulate the combined effects of these factors in a unified framework (building on our prior work: Khalil et al., 2017a,b). In the current study, we extend our model to monitor firing activity in response to the excitatory action of GABAA. Precisely, we created a Spiking Neural Network model that included certain biophysical parameters for lateral connectivity (distance between adjacent neurons) and nearby local connectivity (complex connections involving those between neuronal groups). We simulated different network scenarios (for immature and mature conditions) based on these biophysical parameters. Then, we implemented two forms of Short-term synaptic plasticity (depression and facilitation). Each form has two distinct kinds according to its synaptic time constant value. Finally, in both sets of networks, we compared firing rate activity responses before and after simulating dynamical synapses. Based on simulation results, we found that the modulation effect of dynamical synapses for evaluating and shaping the firing activity of the neural network is strongly dependent on the physiological state of GABAA. Moreover, the STP mechanism acts differently in every network scenario, mirroring the crucial modulating roles of these critical parameters during cortical development. Clinical implications for pathological alterations of GABAergic signaling in neurological and psychiatric disorders are discussed.
Introduction
One of the most remarkable discoveries in the developing brain is the shift of actions conducted by the neurotransmitter GABA that inhibits adult neurons but excites immature ones due to an initially higher intercellular chloride concentration [Cl−]i, leading to depolarizing and excitatory actions of GABA instead of hyperpolarizing and inhibitory actions (Ben-Ari, 2002, 2007a; Ben-Ari et al., 2007b, 2012). Thus, the development of the GABAergic system is vital for the harmony between excitatory and inhibitory neurons in adult cortical systems (Dichter, 1980; Buzsáki and Draguhn, 2004; Kato-Negishi et al., 2004; Ben-Ari, 2007a; Ben-Ari et al., 2007b). Experimental evidence revealed that the acute activity-dependent modulation of the neuron-specific potassium-chloride cotransporter (KCC2) might provide a central mechanism for a partial reversal of the excitation-to-inhibition change of GABAergic transmission (Ganguly et al., 2001; Ben-Ari, 2002; Fiumelli et al., 2005). However, transcriptional regulation of KCC2 expression and post-translational modification of KCC2 function might have a differential augmentation to the plasticity of the GABAergic system (Fiumelli et al., 2005). The low expression of KCC2 during early development is due to the rise of post-synaptic intracellular chloride [Cl–]i in young neurons; thus, GABAergic transmission is depolarizing and excitatory (Ben-Ari, 2002). Later during development, the up-regulation of KCC2 [Cl–]i generates a shift in Cl-equilibrium potential (ECl) toward more negative levels, switching GABAergic transmission from excitatory to inhibitory (Ben-Ari, 2002). Therefore, the depolarizing action of GABA itself promotes the developmental up-regulation of KCC2 through Ca2+-dependent transcriptional regulation (Ganguly et al., 2001).
It has been argued that synaptogenesis coincides reasonably well with the initiation of dendritic development and that the density of synapses significantly rises at least until the end of the third week in vitro (Ito et al., 2010). This rise in the synaptic density occurs despite the decline in neural density (Ito et al., 2010). Consequently, lateral connectivity (distance between adjacent neurons) might lead to extensive modification of the nearby local connectivity (complex connections involving those between neuronal groups) leading to the enhancement and fine-tuning neural activity (Bienenstock, 1996; Sporns et al., 2000).
Short-term synaptic plasticity (STP) plays a crucial role in sustaining the neural network activity through inducing changes in synaptic efficacy over time. This maintenance is a consequence of modulating the timing of signal processing through mediating the driven Poisson input frequency [IF (Hz)] and filtering signal propagation (Tsodyks and Markram, 1997; Tsodyks et al., 1998; Loebel and Tsodyks, 2002). There are two forms of STP: Short-term depression (STD) and Short-term facilitation (STF).
Various findings shed light on the impact of the external input frequency [IF (Hz)] on the regulation of several developmental processes. Buzsáki and Draguhn (2004) pointed that network oscillations bias input selection because they transiently assort neurons into assemblies. This input selectivity enhances the synaptic plasticity of these neurons and co-operatively maintain their temporal signaling processes of information (Buzsáki and Draguhn, 2004).
Despite the crucial influence of these parameters, there is a lack of adequate experimental evidence in addressing the correlations between them. Hence, it is necessary to afford a dynamical network model as a predictive tool to evaluate and understand the dynamical interactions of these parameters. This modeling tool would highlight our current understanding of monitoring the neural firing rate activity (Hz) through the physiological development of the GABAA reversal potential. Therefore, we propose an in silico model of the effects of immature and mature GABAA signaling.
Based on our previous work on dynamical synapses (Khalil et al., 2017a,b) and to better explain the effects of dynamical synapses on cortical network development, we extended our modeling study to observe firing activity in response to the excitatory action of GABAA. Accordingly, we considered the reversal potential of GABAA to be excitatory in the immature condition and inhibitory in the mature condition (Ben-Ari, 2002, 2007a; Ben-Ari et al., 2007b, 2012).
We targeted the impact of GABAA signaling before and after the physiological maturation crossing the dynamical switch from excitation to inhibition (Dichter, 1980; Buzsáki and Draguhn, 2004; Kato-Negishi et al., 2004; Ben-Ari, 2007a; Ben-Ari et al., 2007b). Here, we divided our model into a number of network scenarios by introducing certain proportions of lateral connectivity (distance between adjacent neurons) and the nearby local connectivity (complex connections involving those between neuronal groups). Moreover, we introduced distinct values of Poisson input frequency [IF (Hz); varying from 5 to 100 Hz, with 5 Hz interval] per network scenario. We then conducted the simulation for each network scenario for immature and mature conditions. We performed each simulation run before and after implementing STP. Therefore, we measured the effects of dynamical synapses on modulating the produced firing activity.
Methods
Here, we designed a Spike Neural Network (SNN) model to monitor the neural firing activity responses within the two physiological states of GABAA. Following fine-tuning and optimization of our model (see Supplementary Materials: Figures S.1.1, S.1.2 in Khalil et al., 2017a,b), we systematically segregated it into several scenarios (Figure 1; Appendix A, C.2: Network Scenario). For each network scenario, we relied on biophysical parameters that had been intensively used in various experiments and biophysical studies (Appendix A, E: Model Parameters, see also Khalil et al., 2017a,b). We then implemented two types of STP, with fluctuations in the membrane time constant. Consequently, we performed the simulation with and without STP (Appendix A, F: Short Term Synaptic Plasticity).
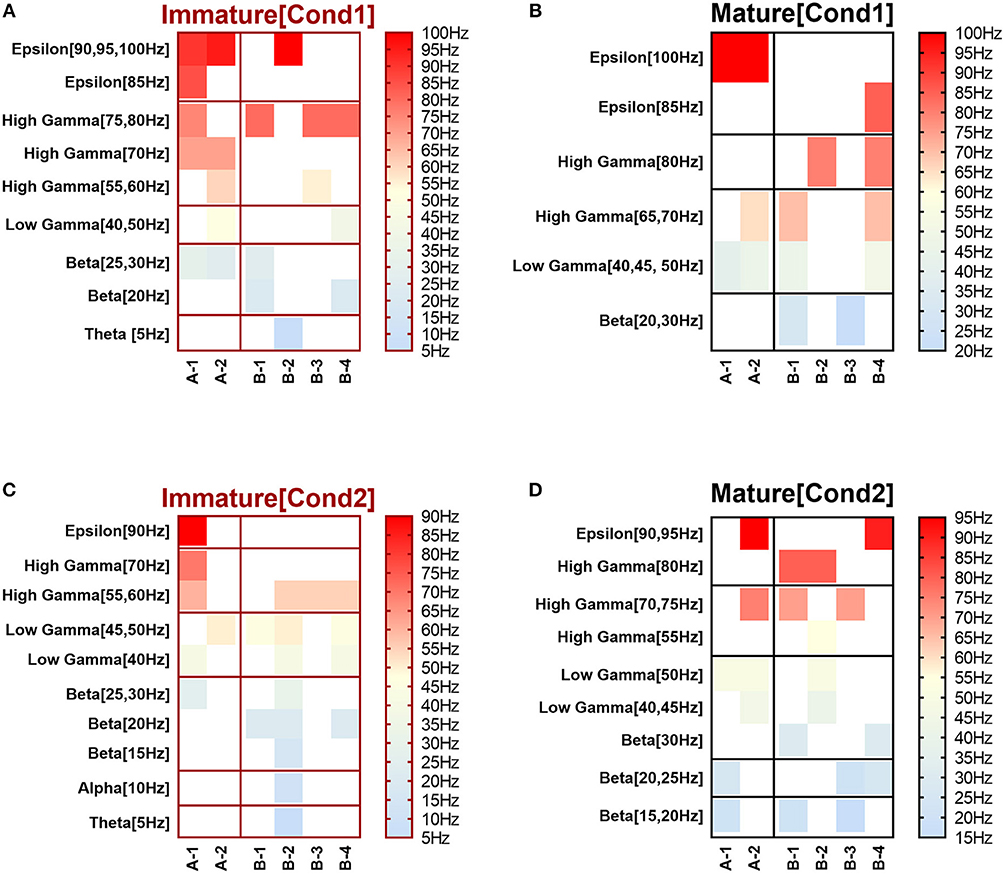
Figure 1. Selected input frequencies [IF (Hz)] that succeeded across all network scenarios of both conditions: immature (A,C) and mature networks (B,D), in triggering modulation effect after implementing depressing and facilitating dynamical synapses. Ranges are theta [3–7 Hz], alpha [7–12 Hz], beta [12–30 Hz], gamma (low [30–50 Hz] and high [50–80 Hz]), and epsilon [80–250 Hz] (throughout Figure 3A of Ji et al., 2013). (A,B) refer to condition 1, which indicates the predicted modulated responses (in response to STP) while (C,D) relate to condition 2 (unpredicted modulated responses in response to STP).
We performed a three-way ANOVA to examine the effects of network scenarios, maturation of the network (i.e., immature and mature based on the reversal potential state of GABAA) and the STP class (i.e., STD1, STD2, STF1, and STF2) for each IF value (i.e., 5, 10, …, 100 Hz ) on the firing rate activity (Hz). There were significant three-way interactions. Subsequently, we performed a two-way ANOVA as a follow up statistical test. Also, we segregated the firing rate activity (Hz) according to the observed modulated response toward both classes of dynamical synapses into the predicted and unpredicted one based on previous STP studies (Tsodyks and Markram, 1997; Tsodyks et al., 1998; Loebel and Tsodyks, 2002). Finally, we measured the significant level of the produced firing activity (Hz) before and after implementing dynamical synapses (i.e., after dynamically varying the synaptic status).
Network Description
Neuron Model
The neural network is composed of N = 3,000 neurons [2,400 excitatory (n_exc) and 600 inhibitory (n_inh)]. These neurons are simulated using leaky integrate and fire equations, which have been used in previous studies (Brette and Gerstner, 2005; Plesser and Diesmann, 2009; Ahmed et al., 2014; Grüning and Bohte, 2014; Abbott et al., 2016). The involved biophysical parameters have been previously reported (Appendix A, E: Model Parameters). To ensure the robustness of our model and to verify that data were not subjectively biased we changed the refractory period value (τref) in further simulations. We also performed additional simulations with up to 12,000 neurons in the initial trial stages to examine the legitimacy of our simulations.
Synapse Model
We modeled synaptic interactions between neurons (N) as transient conductance changes, in which we considered the synaptic time course to increase instantaneously accompanied by an exponential decay. We selectively chose the following synaptic time constant values: τexc = 5 ms and τinh = 10 ms for glutamatergic excitation (AMPA) and GABAergic inhibition (GABAA), respectively. As for AMPA synapses, we implemented it due to its critical role in regulating neural network activity during development (Bredt and Nicholl, 2003; Hall and Ghosh, 2008; Kessels and Malinow, 2009; Santos et al., 2009; Czöndör and Thoumine, 2013; Hanse et al., 2013). Next, we set reversal potentials to Eexc = 0 mV, whilst EGABA = −70 mV (inhibitory GABAA) and −40 mV (excitatory GABAA). We used 4 nS for excitatory conductance and a balance of ginh = 64 nS for inhibitory conductance unless stated otherwise. Lastly, we used 200 nS conductance for external Poisson input (gext) (Appendix A, E: Model Parameters).
Poisson Input Frequency (Hz)
Initially, we examined the responses of the network model with 1 to 10 Hz values of Poisson input frequency (IF) with an interval of 1 Hz. Since this interval did not provoke considerable variations in the firing responses, we decided to expand it to 5 to 100 Hz with a 5 Hz interval (Appendix A, D: Input and E: Model Parameters).
Connectivity Profile
Similar to the model of Yger et al. (2011), we considered neurons of our SNN model as being connected with a distance-dependent probability following a Gaussian profile (Yger et al., 2011). Nevertheless, it is acknowledged that actual connectivity between neurons is less isotropic and homogeneous (i.e., the orientation maps and the patchy horizontal connectivity in V1: Gilbert and Wiesel, 1983). Thus, the Gaussian profile is a beneficial description for a small cortical area when long-range interactions are disregarded (Yger et al., 2011). Accordingly, each neuron communicates with the remaining neurons of the network with a “2D Gaussian probability function” while we applied periodic boundary conditions during the simulation to withdraw any boundary consequences (Yger et al., 2011).
To test the efficiency of connectivity between excitatory and inhibitory populations, we examined the network response at mV level when GABAA reversal potential is inhibitory (Supplementary Materials in Khalil et al., 2017b). For the sake of picking the most optimal profile of connectivity between inhibitory and excitatory neuronal populations, we focused on outlining the connectivity structure of our network before implementing STP (Presentation 1). Accordingly, we applied a systematic procedure, in which we measured the sub-threshold voltage of neurons in response to variations in the connectivity profile between inhibitory and excitatory neuronal population (Figure S.1 in Khalil et al., 2017b). Then, we monitored the firing activity (Hz) for selecting the “best-fit” condition for the connectivity profile at an mV level (Figure S.2 of Khalil et al., 2017b). For structuring the connectivity profile, we used Gaussian-distributed local connectivity according to the probabilistic and topological features of our SNN model. We utilized this strategy for each state of GABAA (i.e., depolarization and hyperpolarization). Here, we assumed that the structure of the connectivity matrix remains fixed following the network initialization. We relied on one set of connection with comparable properties. It is presented in two values, a local density of dendritic arborization (ϵ) (i.e., lateral connectivity (distance between adjacent neurons) between neurons) and a lateral spread length between adjacent neurons (σc) [i.e., the nearby local connectivity (complex connections involving those between neuronal groups)]. Similar to the topological neural model of Yger et al. (2011), we systematically used two main parameters: the spatial extent of the Gaussian profile for the recurrent connections σc and the local density of dendritic arborization while we kept the balance between excitatory and inhibitory synaptic strength. In order to gain further insight into the performance of the network structure, we primary utilized ranges of percentages for local density of dendritic arborization {1, 2, …, 21%}, which point to the average number of synapses per neuron and their strength. This has been shown to be one of the principal relevant parameters for macroscopic quantities (Yger et al., 2011). Finally, we used proportions for a lateral spread length between neighbor neurons {1, 2, …,10%} and we selected reciprocal values for both parameters, which resulted in eliciting a reasonable firing activity response (Figure 1 in Khalil et al., 2017a,b, see also Appendix A, C: Connectivity). The design of the network scenarios relies on the variations in the percentages of (ϵ) and (σc). (ϵ) and (σc) refers to the percentages of the local density of dendritic arborization (i.e., lateral connectivity between neurons) and the percentages of lateral spread length between neighbor neurons (i.e., the nearby local connectivity), respectively. Both network scenarios; (A-1) and (A-2) have the same proportion of ϵ (1%), but two distinct σc percentages (9%) and (10%), respectively. On the other hand, (B-1), (B-2), (B-3), and (B-4) have the same σc proportion (1%), but four different ϵ percentages (9%), (10%), (19%), and (20%), respectively (see C.2: Network Scenarios, see also Figure 1 of Khalil et al., 2017b).
Short-Term Synaptic Plasticity (STP)
We adopted the typical Integrate-and-Fire balanced network configuration comprising a 4:1 ratio between excitatory and inhibitory neurons (Brunel, 2000; Nordlie et al., 2009; Vogels et al., 2011; Yger et al., 2011; Kriener et al., 2013).
We applied STP to our neural network model through implementing STD and STF. For each type, we studied two further kinds of STP based on their differential time constant of synaptic refractoriness, namely STD1, STD2, STF1, and STF2 for depressing and facilitating synapses, respectively (Appendix A, F: Short Term Synaptic Plasticity). For both forms of depressing synapses, we set the synaptic time constant for depression to 100 ms while we changed it for facilitation to 1 ms for STD1 and 10 ms for STD2. Likewise, we systematically used the same values for facilitating synapses, in which we set the time constant for facilitating synapses to 100 ms and changed it for depression to 1 ms for STF1 and 10 ms for STF2.
Algorithms and Interpretation of Model Biophysical Parameters
Conductance-Based Leaky Integrate and Fire Algorithm (LIF)
We used SNN model (Vreeken, 2002; Yger et al., 2011; Stimberg et al., 2014) with LIF neurons and balanced excitatory and inhibitory connections (80% excitation, 20% inhibition). Our neural model consisted of 3,000 IIF neurons, characterized by a membrane time constant, τm = 20 ms, and resting membrane potential, Vrest = −74 mV. For more details about this model, see Destexhe (1997).
The membrane potential of LIF neuron was determined by Equations (1.1a) (for immature network condition), (1.1b) (for mature network condition) and (1.2) (for synaptic conductance), see also Appendix A for more model description and model parameters. Equation (1.1a); El,τm, gexc, Ee, inh, EGABA and cm refer to leak reversal potential (EI = −70.6 mV), membrane time constant (τm = 20 ms), decay constant of AMPA-type conductance (gexc = 4 nS), excitatory reversal potential for AMPA (Ee = 0 mV), decay constant of GABA-type conductance (ginh = 64nS), GABAA′ reversal potential for immature neocortical network (EGABA = −40 mV), respectively. Equation (1.1b) is similar to Equation (1.1a), but Ei is instead of EGABA (i.e., GABAA′ reversal potential for the mature neocortical network [Ei = −70 mV)]. Through Equation (1.2); gexc, τexc, ginh, τinh refer to decay constant of AMPA-type conductance (excitatory glutamatergic conductance (AMPA); gexc = 4 nS), glutamatergic synaptic time constant for AMPA (τexc = 5 ms), decay constant of GABA-type conductance (inhibitory GABAergic conductance (GABAA); ginh = 64 nS) and GABAergic synaptic time constant for GABAA(τinh = 10 ms), respectively. When the membrane potential reaches a threshold value (Vt) of −50.4 mV, the neuron fires and the resting membrane potential(Vrest) remains at −74 mV for a refractory period (τref) of 5 ms, see also A: Model Summary and E: Model Parameters.
Gaussian-Distributed Local Connectivity Profile
Similar to the connectivity profile of Yger et al. (2011), each neuron sparsely communicates with the rest of the neurons through a connection probability. This probability depends on the distance rij between two neurons according to the Gaussian profile (Yger et al., 2011).
represents the variance of the connectivity profile, which refers to the spatial spread of the Gaussian profile (Yger et al., 2011). For each neuron, the incoming connections (see also Equation 1.4, A: Model Summary, Synapse Model and Synaptic Dynamics) were created by randomly selecting other neurons in the network based on the probability of developing a projection to other neurons according to a rejection method based on the Gaussian profile (Yger et al., 2011). σc refers to the spatial extent of the Gaussian profile for recurrent connections (i.e., local connectivity). The neuron density in the network is uniform and connections are restricted to the maximal value L/, the probability of finding one neuron at distance r equals:
The quantity of the established connections at r distance and the distance-dependent connection probability likelihood, given by the Gaussian profile, are thus:
With the normalization condition. The probability of connection is therefore given by Equation (2.3):
Here,
The distributions of ρ(r) are persistently influenced by σc. Indeed, these functions relate to the Gaussian profile and the likelihood P(r) of finding a pair of neurons for a given distance following a standardizing condition (Yger et al., 2011). The total number of external synapses received by each neuron represented by “K,” which relates to the number of recurrent synapses (Yger et al., 2011). We fixed K per neuron, and therefore whatever the σc value is, each neuron kept an equal number of incoming synapses (Yger et al., 2011; see also Equations 1.3, 1.4; A: Model Summary, Synapse Model and Synaptic Dynamics). The variable ϵ_ is defined as the local density of dendritic arborization. We considered neurite density (i.e., the local density of dendritic arborization) in the network, confining connections to the maximal value with the likelihood of finding one neuron at r distance as mentioned above.
Non-homogenous Propagation Delay
We used non-homogeneous delays, which depended linearly on the distances rij through
A value of 0.1–0.5 m/s for v is usually reported (Bringuier et al., 1999; González-Burgos et al., 2000), and in all simulations, we used a propagation speed (v) = 0.5 m/s, and dsyn = 0.2 ms.
Anatomical and physiological studies (Bringuier et al., 1999; González-Burgos et al., 2000) have reported standardized values of 0.1–0.5 m/s for conduction delays. Also, similar values can be recorded in voltage-sensitive dye imaging, where activity waves propagate at a comparable speed (Grinvald et al., 1994; Benucci et al., 2007). Patch recordings in vitro corroborate the fact that this delay linearly scales, as a function of distance (Larkum et al., 2001) when considering the propagation from dendrites to soma. Thus, even for a small patch of cortex of 1 mm2, with a synaptic delay (dsyn) of 0.2 ms (due to neurotransmitter release), conduction delays are widely distributed and should not be neglected. We thus built our network as an artificial square lattice of 1 mm2, and we picked a propagation speed of v = 0.5 m/s.
Model Implementation and Simulation
We performed all simulations using Brian v1.4.1 (Goodman and Brette, 2008, 2009) and the PyNN interface (Davison et al., 2009). We measured the neural firing rate activity (Hz) and discarded the first 50 s of recording from the analysis to avoid potential onset transients, as suggested by Nawrot et al. (2007). Then, we imported all the simulated firing rate values to Graph Pad Prism-software (Graph Pad Prism version 7.00 for Windows, Graph Pad Software, La Jolla California USA, www.graphpad.com). We incorporated 12 simulation trials for each step. All analyses were conducted using Graph Pad Prism-software and SPSS.
Statistical Analysis
Measures of the Modulated Responses Through two Physiological States of GABAA
In order to investigate the effects of three crucial factors on the firing rate activity (Hz), we performed a 3-way ANOVA. These factors refer to network scenarios, maturation of the network (i.e., immature and mature) and STP for each value of IF (i.e., 5, 10, …, 100 Hz.). This 3-factor-ANOVA revealed significant 3-way interactions, which are shown in Tables 1–4 and summarized as follows. (1) 5 and 10 Hz IF (theta and alpha range) induced a significant effect (P < 0.0001 for STD1, STD2, STF1 and STF2) on activity responses among all network scenarios (P < 0.0001 for STD1, STD2, STF1, and STF2) for both mature and immature conditions (P < 0.0001 for STD1, STD2, STF1, and STF2). There was an interaction between these three factors (P < 0.0001 for STD1, STD2, STF1, and STF2). (2) The 15 Hz IF (beta range) induced a significant effect (P < 0.0001 for STD1, STD2, STF1, and STF2) on activity responses among all network scenarios (P < 0.0001 for STD1, STD2, STF1, and STF2) for both mature and immature conditions (P = 0.0021 for STD1 and P < 0.0001 for STD2, STF1, and STF2). There was an interaction between these three factors (P < 0.0001 for STD1, STD2, STF1, and STF2). As to the 20 and 30 Hz IF (beta range), they induced a significant effect (P < 0.0001 for STD1, STD2, STF1, and STF2) on activity responses among all network scenarios (P < 0.0001 for STD1, STD2, STF1 and STF2) for both mature and immature conditions (P < 0.0001 for STD1, STD2, STF1, and STF2). There was an interaction between these three factors (P < 0.0001 for STD1, STD2, STF1, and STF2). Concerning the 25 Hz IF (beta range), it expressed a significant effect (P < 0.0001 for STD1, STD2, STF1, and STF2) on activity responses among all network scenarios (P < 0.0001 for STD1, STD2, STF1, and STF2) for both mature and immature conditions (P < 0.0001 for STD1, STF1, and STF2 and P = 0.0033 for STD2). There was an interaction between these three factors (P < 0.0001 for STD1, STD2, STF1, and STF2). (3) As to the 35 and 40 Hz IF (low-gamma range), they induced a significant effect (P < 0.0001 for STD1, STD2, STF1, and STF2) on activity responses among all network scenarios (P < 0.0001 for STD1, STD2, STF1, and STF2) for both mature and immature conditions (P < 0.0001 for STD1, STD2, STF1, and STF2). There was an interaction between these three factors (P < 0.0001 for STD1, STD2, STF1, and STF2). As to the 45 Hz IF (low-gamma range), it induced a significant effect (P < 0.0001 for STD1, STD2, STF1, and STF2) on activity responses among all network scenarios (P < 0.0001 for STD1, STD2, STF1, and STF2) for both mature and immature conditions (P < 0.0001 for STD1, STD2, and STF2 while P = 0.0148 for STF1). There was an interaction between these three factors (P < 0.0001 for STD1, STD2, STF1, and STF2). Regarding the 50 Hz IF (low-gamma range), it induced a significant effect (P < 0.0001 for STD1, STD2, STF1, and STF2) on activity responses among all network scenarios (P < 0.0001 for STD1, STD2, STF1, and STF2) for both mature and immature conditions (P < 0.0001 for STD2 and STF2 while P = 0.1635 for STD1 and P = 0.0519 for STF1). There was an interaction between these three factors (P < 0.0001 for STD1, STD2, STF1, and STF2). (4) For the 55 and 60 Hz IF (high-gamma range), they induced a significant effect (P < 0.0001 for STD1, STD2, STF1, and STF2) on activity responses among all network scenarios (P < 0.0001 for STD1, STD2, STF1, and STF2) for both mature and immature conditions (P < 0.0001 for STD1, STD2, STF1, and STF2). There was an interaction between the three factors (P < 0.0001 for STD1, STD2, STF1, and STF2). As to the 65 Hz IF (high-gamma range), it induced a significant effect (P < 0.0001 for STD1, STD2, STF1, and STF2) on activity responses among all network scenarios (P < 0.0001 for STD1, STD2, STF1, and STF2) for both mature and immature conditions (P = 0.0017 for STD2, P < 0.0001 for STF1 and P = 0.0014 for STF2 while P = 0.6643 for STD1). There was an interaction between these three factors (P < 0.0001 for STD1, STD2, STF1, and STF2). Concerning the 70 Hz IF (high-gamma range), it induced a significant effect (P < 0.0001 for STD1, STD2, STF1, and STF2) on activity responses among all network scenarios (P < 0.0001 for STD1, STD2, STF1, and STF2) for both mature and immature conditions (P < 0.0001 for STD1, STD2, and STF2 and P = 0.0105 for STF1). There was an interaction between these three factors (P < 0.0001 for STD1, STD2, STF1, and STF2). As to the 75 Hz IF (high-gamma range), it induced a significant effect (P < 0.0001 for STD1, STD2, STF1, and STF2) on activity responses among all network scenarios (P < 0.0001 for STD1, STD2, STF1, and STF2) for both mature and immature conditions (P < 0.0001 for STD1, STD2, and STF2 while P = 0.7598 for STF1). There was an interaction between these three factors (P < 0.0001 for STD1, STD2, STF1, and STF2, respectively). Concerning the 80 Hz IF (high-gamma range), it induced a significant effect (P < 0.0001 for STD1, STD2, STF1, and STF2) on activity responses among all network scenarios (P < 0.0001 for STD1, STD2, STF1, and STF2) for both mature and immature conditions (P < 0.0001 for STD1, STF1, and STF2 and P = 0.0050 for STD2). There was an interaction between these three factors (P < 0.0001 for STD1, STD2, STF1, and STF2). (5) Regarding the 85 and 90 Hz IF (epsilon range), they induced a significant effect (P < 0.0001 for STD1, STD2, STF1, and STF2) on activity responses among all network scenarios (P < 0.0001 for STD1, STD2, STF1, and STF2) for both mature and immature conditions (P < 0.0001 for STD1, STD2, STF1, and STF2). There was an interaction between these three factors (P < 0.0001 for STD1, STD2, STF1, and STF2). As to the 95 Hz IF (epsilon range), it induced a significant effect (P < 0.0001 for STD1, STD2, STF1, and STF2) on activity responses among all network scenarios (P < 0.0001 for STD1, STD2, STF1, and STF2) for both mature and immature conditions (P < 0.0001 for STD1 and STF2, P < 0.0101 for STF1 while P = 0.1470 for STD2). There was an interaction between these three factors (P < 0.0001 for STD1, STD2, STF1, and STF2). As to the 100 Hz IF (epsilon range), it induced differential effects (P < 0.0001 for STD1, STD2, and STF2 while P = 0.0758 for STF1) on activity responses among all network scenarios (P < 0.0001 for STD1, STD2, STF1, and STF2) for both mature and immature conditions (P < 0.0001 for STD1, STD2, STF1, and STF2). There was an interaction between these three factors (P < 0.0001 for STD1, STD2, STF1, and STF2).
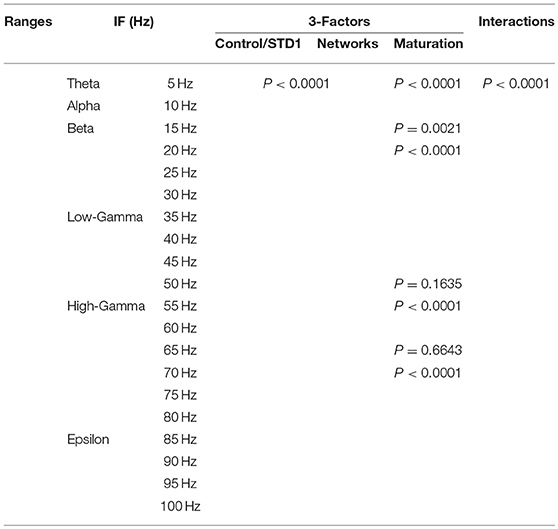
Table 1. Three-way ANOVA for STD1.
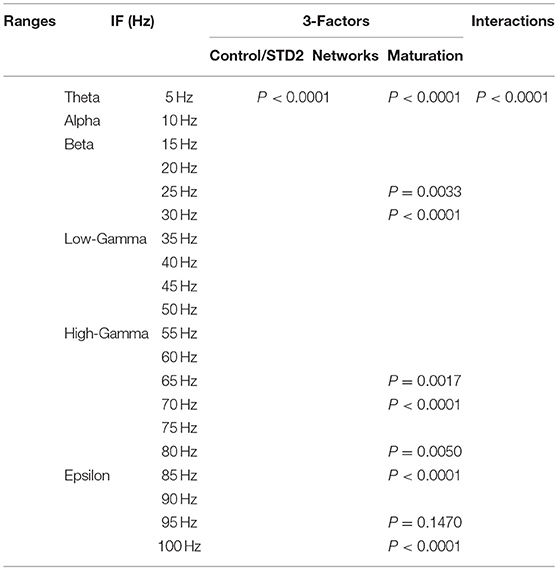
Table 2. Three-way ANOVA for STD2.
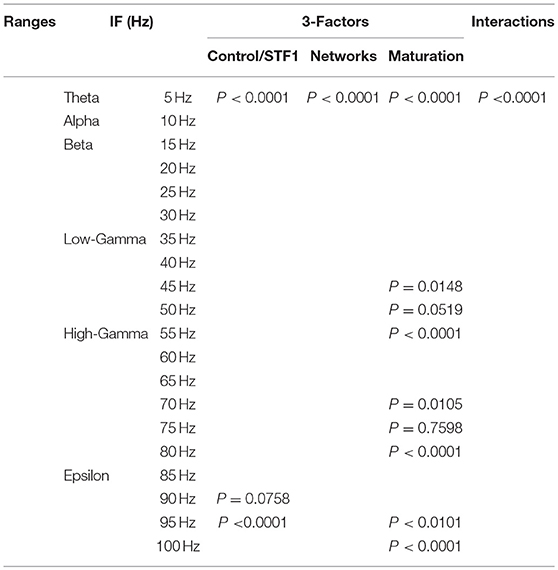
Table 3. Three-way ANOVA for STF1.
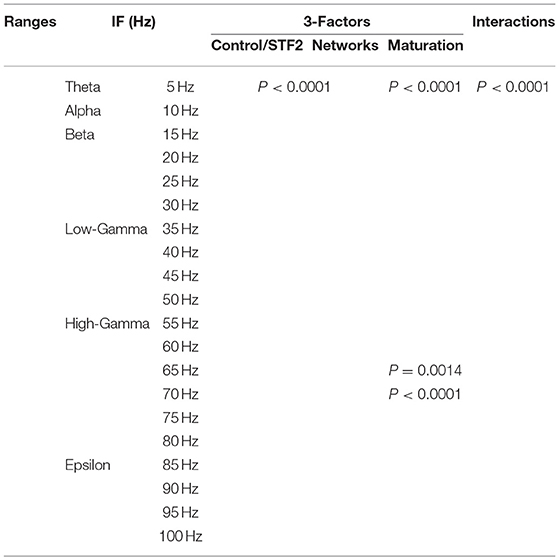
Table 4. Three-way ANOVA for STF2.
In order to monitor the effects of IF on eliciting the response of firing rate activity among all network scenarios of immature and mature network conditions before and after implementing dynamical synapses, we performed a 2-way ANOVA. Then, using the same statistical test (2-way ANOVA), we measured the modulation effects of dynamical synapses (STP) on eliciting the predicted and unpredicted firing rate activity response in each of the network scenarios [(A-1), (A-2), (B-1), (B-2), (B-3), and (B-4)] in immature and mature network conditions. The results of this analysis are shown in Tables 5, 6.

Table 5. Two-way ANOVA for immature network scenarios.
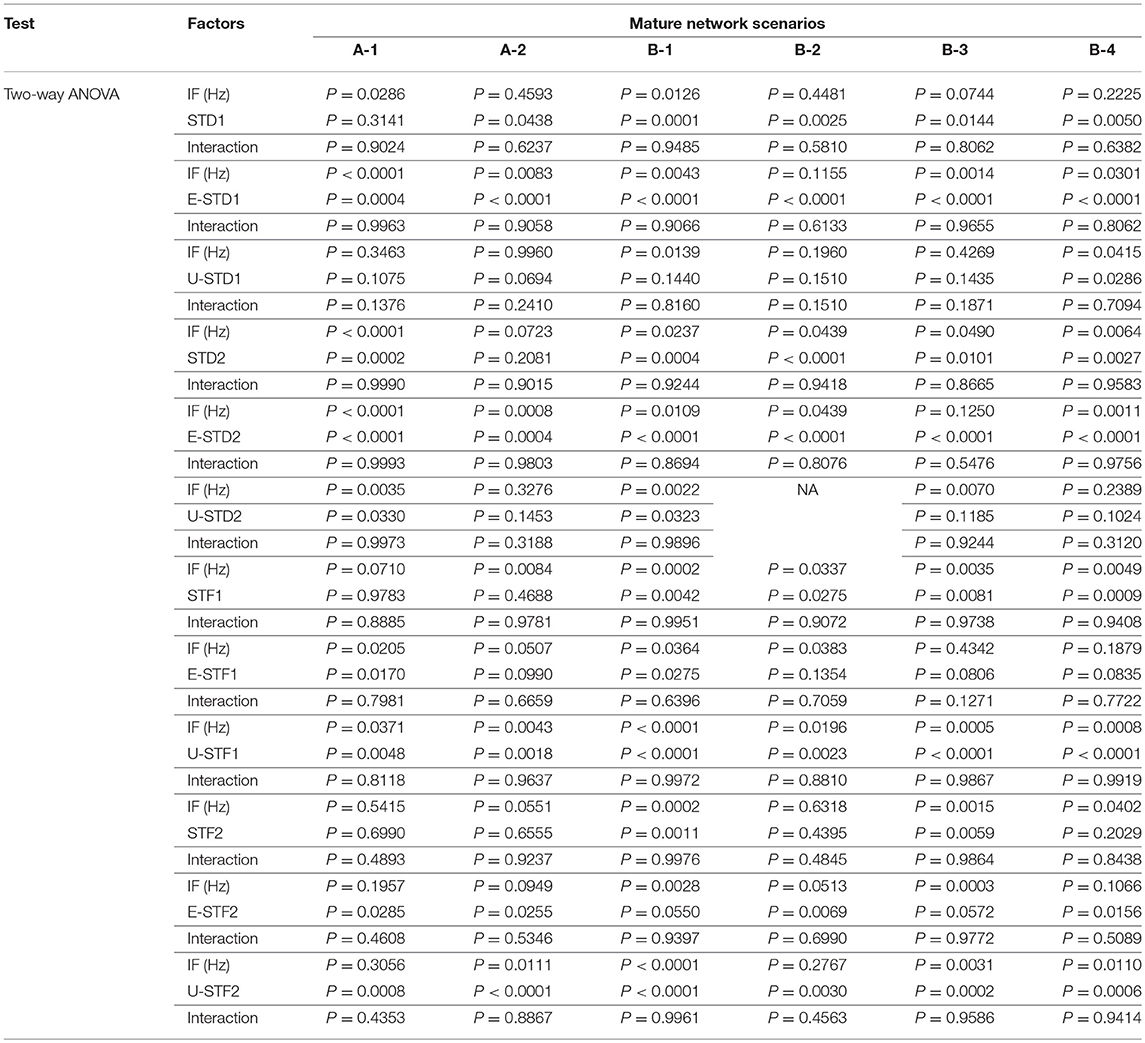
Table 6. Two-way ANOVA for mature network scenarios.
Measures of MSF and Predicting a Developmental Shift
We eliminated all unfitted responses that revealed significant variations in the scale of probability density function (PDF) of the Gaussian distribution curve of MSF (see Figures 3–17 of Khalil et al., 2017b). Therefore, we interpreted only data that did not show statistical fluctuations in PDF, before and after implementing STP.
Results
The current study is an extension of our prior plasticity modeling study (Khalil et al., 2017a,b). Here, we provide a quantitative analysis of the relationship between the modulator roles of a particular external signaling element and other crucial intrinsic signaling factors, and their influence on the maintenance of neural activity [which might be experimentally observed in Multi-Electrode Arrays (MEAs)]. The external signal element is represented in STP (triggered by different ranges of IF). On the other hand, the depolarizing and hyperpolarizing state of GABAA signaling, a local density of dendritic arborization [i.e., lateral connectivity (distance between adjacent neurons)] and a lateral spread length between neighbor neurons [i.e., the nearby local connectivity (complex connections involving those between neuronal groups)] refer to other crucial intrinsic signaling factors.
Dynamical Synapses and Modulation of Neural Network Activity Through Synaptic Fine-Tuning in Two Physiological States of GABAA
This study shows our simulation results before and after dynamically varying the synaptic status (i.e., after implementing STP). We monitored the firing rate activity (Hz) during 2,000 s in all neural networks in both conditions, immature and mature network. Our 2-way ANOVA, conducted as a follow up test after 3-way ANOVA, observed the effects of IF on eliciting firing rate activity response among all network scenarios [(A-1), (A-2), (B-1), (B-2), (B-3), and (B-4)] of immature and mature network conditions before and after implementing dynamical synapses (STD1, STD2, STF1, and STF2). It revealed the following results: (1) for the immature condition, there was no significant effect for IF (P = 0.0566) on eliciting the response of firing rate activity among all network scenarios (P = 0.3586), there was no interaction between IF and network scenarios as well (P = 0.4928). However, implementing short-term depressing synapses revealed only a significant effect of IF (P = 0.0089 and P = 0.0113 for STD1 and STD2, respectively) on the activity responses among all network scenarios (P = 0.6512 and P = 0.5675 for STD1 and STD2, respectively) and there was no interaction between IF and network scenarios (P = 0.5025 and P = 0.4903 for STD1 and STD2, respectively). In contrast, implementing STF did not show any significant effect of IF (P = 0.0508 and P = 0.2868 for STF1 and STF2, respectively) on the activity responses among all network scenarios (P = 0.4164 and P = 0.1524 for STF1 and STF2, respectively) and there was no interaction between IF and network scenarios (P = 0.6431 and P = 0.2064 for STF1 and STF2, respectively). (2) The mature condition revealed a different result in comparison to the immature condition. For instance, before implementing STP, there was a significant effect only for IF (P = 0.0389) on eliciting firing rate activity response among all network scenarios (P = 0.7118), there was no interaction as well between IF and network scenarios (P = 0.9963). In contrast with immature conditions, STD in mature conditions did not show any significant effect of IF (P = 0.1037 and P = 0.1148 for STD1 and STD2, respectively), on activity responses among all network scenarios (P = 0.1640 and P = 0.7020 for STD1 and STD2, respectively). There was no interaction between IF and network scenarios (P = 0.7911 and P = 0.5521 for STD1 and STD2, respectively). In contrast with depressing synapses, facilitating synapses in mature conditions revealed significant effects of IF (P = 0.0094 and P = 0.0086 for STF1 and STF2, respectively) on activity responses among all network scenarios (P = 0.4270 and P = 0.6037 for STF1 and STF2, respectively). There was no interaction between IF and network scenarios (P = 0.9464 and P = 0.9965 for STF1 and STF2, respectively). Overall, this observation indicates that there are differential effects of IF and dynamical synapses- triggered by- IF on modulating firing rate responses, which varies in both conditions (immature and mature ones). Concerning the IF, each class of STP (i.e., STD and STF) revealed significant reversal effect in eliciting modulating responses of the firing rate activity based on the condition of maturation reflecting the physiological state of GABAA (i.e., immature and mature conditions). In addition, there was a preference toward selecting particular ranges of IF to be triggered by dynamical synapses in each physiological state of GABAA (Figure 1). Subsequently, we segregated the results into two sections according to modulating effects induced by STP.
Modulated Responses Through Two Physiological States of GABAA
Predicted and Unpredicted Modulated Responses
The influence of dynamical synapses on eliciting a significant predicted and unpredicted modulated firing activity, is expressed uniquely among network scenarios (A-1), (A-2), (B-1), (B-2), (B-3), and (B-4), see Tables 5, 6. Predicted (i.e., expected) modulation effect implies a reduction in the firing rate activity in case of STD1 and STD2, and a reverse effect in case of STF1 and STF2. Unpredicted (i.e., unexpected) modulation effect suggests an increase in the firing rate activity in case of STD1 and STD2 and an opposing effect in case of STF1 and STF2. Additionally, these variations were not only observed in network scenarios but also in each condition (immature and mature). We presented the modulated responses in Figures 2, 3, 12.
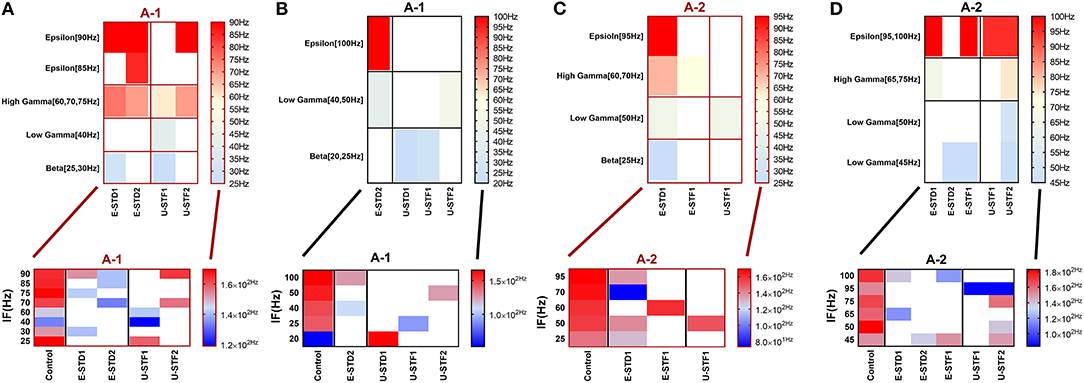
Figure 2. Heat maps of selected elicited responses in each network scenario (A-1) and (A-2), in immature and mature conditions, respectively, before and after implementing dynamical synapses. (A,C) refer to immature conditions of network scenarios (A-1 and A-2) while (B,D) relate to mature conditions of network scenarios (A-1 and A-2). The upper graphs refer to particular Poisson input frequencies [IF (Hz)] that triggered a substantial modulation effect, measured in Hz before and after STP in these networks (Lower graphs). White blocks refer to excluded values due to statistical variations in probability density function (PDF). Control refers to the condition without STP implementation (dynamical synapses); STD1 and STD2 refer to two types of depressing synapses while STF1 and STF2 refer to facilitating synapse. E-STD1, E-STD1, E-STF1, and E-STF2 relate to the expected modulation effect induced by dynamical synapses i.e., reduction of firing rate activities in response to depressing synapses (STD1 and STD2) while increasing the firing rate activity in response to facilitating synapses (STF1 and STF2). On the other hand, U-STD1, U-STD1, U-STF1, and U-STF2 relate to the expected modulation effect induced by dynamical synapses, i.e., an increase of firing rate activity in response to depressing synapses (STD1 and STD2), while reduction in the firing rate activity in response to facilitating synapses (STF1 and STF2), see also Tables 5, 6.
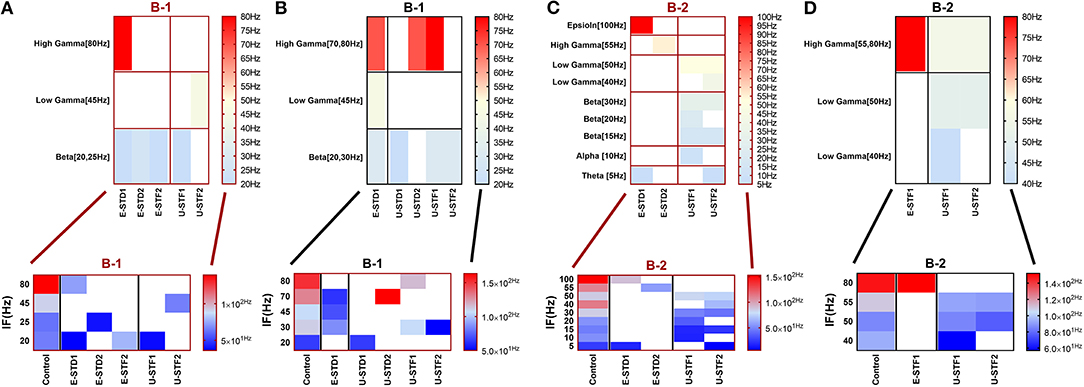
Figure 3. Heat maps of selected elicited responses in each network scenario (B-1) and (B-2), in both immature and mature conditions, respectively, before and after implementing dynamical synapses. (A,C) refer to immature conditions of network scenarios (B-1 and B-2) while (B,D) relate to mature conditions of network scenarios (B-1 and B-2). The upper graphs refer to particular Poisson input frequencies [IF (Hz)] that triggered a substantial modulation effect, measured in Hz before and after STP in these networks (Lower graphs). White blocks refer to excluded values due to statistical variations in probability density function (PDF). Control refers to the condition without STP implementation (dynamical synapses); STD1 and STD2 refer to two types of depressing synapses while STF1 and STF2 refer to facilitating synapses. E-STD1, E-STD1, E-STF1, and E-STF2 relate to the expected modulation effect induced by dynamical synapses, i.e., reduction of firing rate activities in response to depressing synapses (STD1 and STD2) while increasing the firing rate activity in response to facilitating synapses (STF1 and STF2). On the other hand, U-STD1, U-STD1, U-STF1, and U-STF2 relate to the expected modulation effect induced by dynamical synapses, i.e., an increase of firing rate activities in response to depressing synapses (STD1 and STD2), while reduction in the firing rate activity in response to facilitating synapses (STF1 and STF2), see also Tables 5, 6.
Predicted Modulated Responses
In response to depressing synapses (STD1 and STD2), the significant level of the predicted (expected) elicited modulated effect induced by STD1 was observed both in immature and mature conditions, within their respective network scenarios. For instance, the significance of the expected reduction provoked by STD1 (i.e., E-STD1), in immature conditions, was revealed by a two-way ANOVA as follows (see also Tables 5, 6): the IF (Hz) induced significant effects (P = 0.0048 for B-1 and P = 0.0087 for B-2), as well as E-STD1 that expressed significant effects (P < 0.0001 for B-1, P = 0.0003 for B-2 and P < 0.0001 for B-4). Variously, for mature network condition, IF (Hz) induced significant effects [P < 0.0001(A-1), P = 0.0083 (A-2), P = 0.0043 (B-1), P = 0.0014 (B-3) and P = 0.0301(B-4)] while E-STD1 expressed significant effects [P = 0.0004(A-1), P < 0.0001(A-2), P < 0.0001(B-1), P < 0.0001(B-2), P < 0.0001(B-3), and P < 0.0001(B-4)]. In response to STD2, the significant level of the predicted elicited modulated effect induced by STD2 (i.e., E-STD2) was observed in both immature and mature conditions, within their network scenarios. Through the immature network condition, IF (Hz) induced a significant effect [P = 0.0011 (B-2)], while E-STD2 expressed significant effects [P = 0.0034 (A-1), P = 0.0001(A-2), P < 0.0001(B-1), P = 0.0002 (B-2), and P < 0.0001(B-4)]. In contrast, for the mature condition, IF (Hz) induced significant effects [P < 0.0001(A-1), P = 0.0008 (A-2), P = 0.0109 (B-1), P = 0.0439 (B-2), and P = 0.0011(B-4)], while E-STD2 expressed significant effects [P < 0.0001 (A-1), P = 0.0004 (A-2), P < 0.0001 for (B-1), (B-2), (B-3), and (B-4)]. In case of facilitating synapses (STF1 and STF2), the significance of predicted modulated effects induced by STF1 and STF2, in both immature and mature conditions, within their respective network scenarios is illustrated as follows. In immature conditions, IF (Hz) induced a significant effect [P = 0.0179 (A-2)], as well as E-STF1 that expressed significant effects [P = 0.0179 (A-2) and P = 0.0055 (B-3)]. However, E-STF2 expressed significant effects [P = 0.0233 (A-1), P = 0.0165 (B-1), P = 0.0024 (B-2), P = 0.0212 (B-3), and P = 0.0203 (B-4)], while IF (Hz) induced significant effects [P = 0.0234 (A-1), P = 0.0296 (A-2), P = 0.0076 (B-1), P = 0.0027(B-3), and P = 0.0036 (B-4)]. Regarding mature conditions, E-STF1 expressed significant effects [P = 0.0170 (A-1) and P = 0.0275 (B-1)] and IF (Hz) induced significant effects [P = 0.0205 (A-1), P = 0.0364 (B-1) and P = 0.0383 (B-2)]. Nevertheless, E-STF2 expressed significant effects [P = 0.0285 (A-1), P = 0.0255 (A-2), P = 0.0069 (B-2), and P = 0.0156 (B-4)], while IF (Hz) induced significant effects [P = 0.0028 (B-1) and P = 0.0003 (B-3)].
Unpredicted Modulated Responses
In response to depressing synapses (STD1 and STD2), the significant level of the unpredicted (unexpected) elicited modulated effect induced by STD1 (i.e., U-STD1) was observed in the immature condition as follows; U-STD1 expressed significant effects [P = 0.0361 (A-2), P = 0.0084 (B-2) and P = 0.0027 (B-3)], while IF (Hz) induced a significant effect [P = 0.0001 (B-3)]. In the case of a mature condition, IF (Hz) induced significant effects [P = 0.0139 (B-1) and P = 0.0415 (B-4)], while U-STD1 expressed a significant effect [P = 0.0286 (B-4)]. As for the significant level of the unpredicted elicited modulated effect induced by STD2 (i.e., U-STD2), it was observed in both immature and mature conditions, within their particular network scenarios. For example, in immature condition, IF (Hz) did not induce any significant effect at any network scenario, however, U-STD2 expressed significant effects [P = 0.0379 (A-2), P = 0.0185 (B-1), P = 0.0254 (B-2), P = 0.0216(B-3), and P = 0.0342(B-4)]. In comparison, the mature condition revealed the following: IF (Hz) induced significant effects on (A-1), (B-1), and (B-3) (P = 0.0035, P = 0.0022, and P = 0.0070, respectively), but U-STD2 expressed significant effects [P = 0.0330 (A-1) and P = 0.0323 (B1)]. Concerning facilitating synapses (STF1 and STF2), the significant level of the unpredicted elicited modulated effect induced by STF1 was observed in both immature and mature conditions, within their particular network scenarios. In case of the immature condition, IF (Hz) induced significant effects [P = 0.0174 (A-1), P = 0.0135(B-1), P = 0.0211(B-2), and P = 0.0023 (B-3)], while U-STF1 expressed significant effects [P = 0.0238 (A-2), P = 0.0008 (B-1), P = 0.0156 (B-2), and P = 0.0006 (B-3)]. For the mature condition, IF (Hz) induced significant effects [P = 0.0371(A-1), P = 0.0043(A-2), P < 0.0001(B-1), P = 0.0196(B-2), P = 0.0005(B-3), and P = 0.0008(B-4)], while U-STF1 expressed significant effects [P = 0.0048(A-1), P = 0.0018(A-2), P < 0.0001(B-1), P = 0.0023(B-2), P < 0.0001(B-3), and P < 0.0001(B-4)].
Regarding the unpredicted modulation effects induced by STF2 in the immature condition, IF (Hz) induced significant effects [P = 0.0036(B-1), P = 0.0086 (B-2), and P = 0.0036 (B-3)], while U-STF2 expressed significant effects [P = 0.0048 (A-2), P < 0.0001(B-1), P = 0.0139 (B-2), and P = 0.0030 (B-3)]. As for the mature condition, IF (Hz) induced significant effects [P = 0.0111(A-2), P < 0.0001 (B-1) P = 0.0031 (B-3), and P = 0.0110 (B-4)], while U-STF2 expressed significant effects [P = 0.0008 (A-1), P < 0.0001 (A-2), P < 0.0001 (B-1), P = 0.0030 (B2), P = 0.0002 (B-3), and P = 0.0006 (B-4)].
Prediction of a Developmental Shift
We observed a trend toward modulating the neural firing activity of immature network scenarios through expressing significant changes in the amount of mean spike frequency (MSF) in response to STP (Figures 2A,C, 3A,C, 12A,C). This trend might resemble what could be experimentally recorded in MEAs during early developmental stages in vitro [before (5–10 DIV) and during (11–17 DIV) of the GABAA shift, i.e., the change in GABAergic synaptic transmission]. Such modulation might predict a developmental shift to an earlier time window that could be within or before the same stage (i.e., for the mature condition, see Khalil et al., 2017b, P12–P16).
A Developmental Shift to an Earlier Time Window, Before the First Week in vitro (5–10 DIV)
In response to STF2 (when IF = 5 Hz: in the range of theta), (B-2) expresses a remarkable reduction in MSF amount (about 76.7%, from 25.8 to 6 Hz; Figures 3C, 4A,C). This might suggest a dynamical developmental shift in the firing activity, which might be observed experimentally in vitro (in MEAs) in early stages (before (5–10 DIV). This amount of MSF was experimentally reported to be in the range of 7.86 ± 1.30 Hz at this stage (Table 1; Baltz et al., 2010).
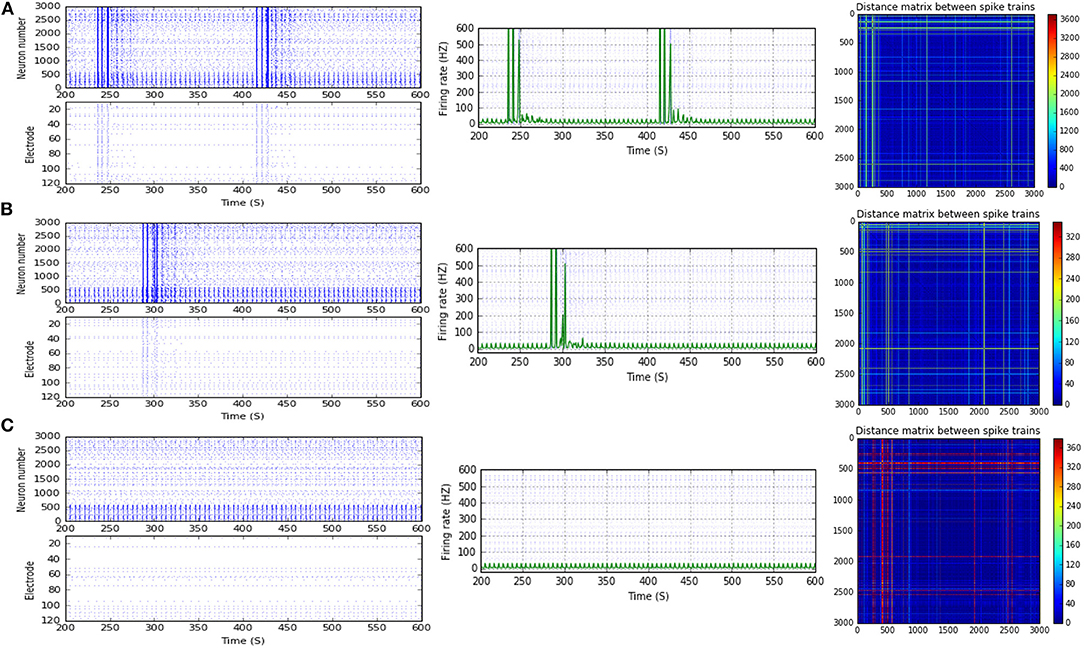
Figure 4. Selected elicited firing response activity in the immature network scenario (B-2) before and after implementing STD1 and STF2 (when IF = 5 Hz: in the range of theta). (A) refers to the condition without implementing dynamical synapses (control) while (B,C) refer to that after implementing depressing synapses (STD1) and facilitating synapses (STF2), respectively. The first two figures of each panel refer to monitoring the pattern of firing activity in time windows from 200 to 600 seconds (s). Heat maps of each panel represent modulation changes in spike distance matrix of the network scenario (B-2) before and after implementing STD1 and STF2. The simulation time for heat maps of the spike distance is equal to 2,000 s.
A Developmental Shift to the Transitional Period Between Week 1 and 2 in vitro [Before (5–10 DIV) and During (11–17 DIV) of the GABAA Shift]
Scenario (B-2) reveals a reduction of ~30.2%, from 25.8 to 18 Hz, in response to STD1 (when IF = 5 Hz: in the range of theta; Figures 3C, 4A,B). It also expresses a bigger reduction of about 67.9%, from 53.0 to 17.0 Hz, after implementing STF1 (when IF = 10 Hz: in the range of alpha; Figures 3C, 5A,B). Similarly, STF1 and STF2 (when IF = 15 Hz: in the range of beta) trigger a higher level of reduction in produced MSF (~61.7%, from 47.0 to 18.0 Hz and 48.9%, from 47.0 to 24.0 Hz, respectively; Figures 3C, 6). Additionally, implementing STF1 (when IF = 20 Hz: in the range of beta) to (B-2) induces a considerable reduction in MSF amount (~22.5%, from 54.0 to 35.8 Hz; Figures 3C, 7). However, the same scenario (B-2) revealed a reduction of about 33.7% (from 85.0 to 49.0 Hz) and 48.5% (from 85.0 to 43.8 Hz), after implementing STF1 and STF2, respectively (when IF = 30 Hz: in the range of beta; Figure 8).
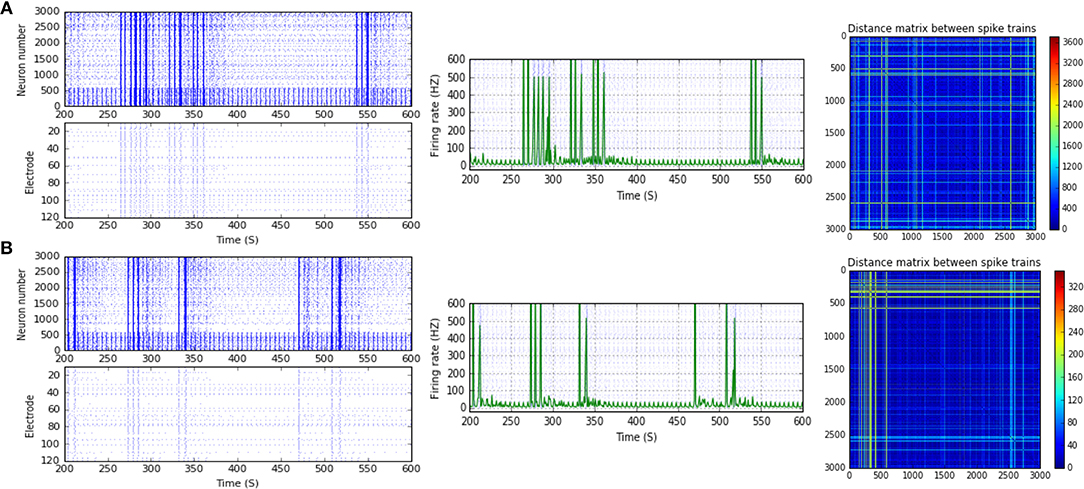
Figure 5. Selected elicited firing response activity in the immature network scenario (B-2) before and after implementing STF1 (when IF = 10 Hz: in the range of alpha). (A) refers to the condition without implementing dynamical synapses (control) while (B) refers to that after implementing facilitating synapses (STF1). The first two figures of each panel refer to monitoring the pattern of firing activity in time windows from 200 to 600 seconds (s). Heat maps of each panel represent modulation changes in spike distance matrix of the network scenario (B-2) before and after implementing STF1. The simulation time for heat maps of the spike distance is equal to 2,000 s.
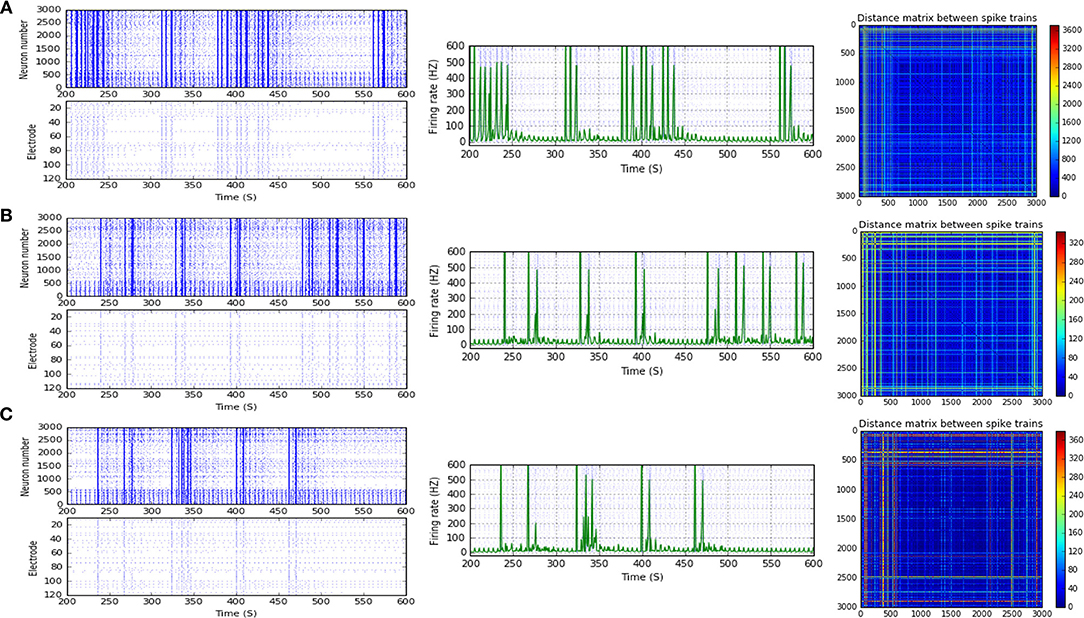
Figure 6. Selected elicited firing response activity in the immature network scenario (B-2) before and after implementing STF1 and STF2 (when IF = 15 Hz: in the range of beta). (A) refers to the condition without implementing dynamical synapses (control) while (B,C) refer to that after implementing facilitating synapses (STF1 and STF2, respectively). The first two figures of each panel refer to monitoring the pattern of firing activity in time windows from 200 to 600 seconds(s). Heat maps of each panel represent modulation changes in spike distance matrix of the network scenario (B-2) before and after implementing STD1 and STF2. The simulation time for heat maps of the spike distance is equal to 2,000 s.
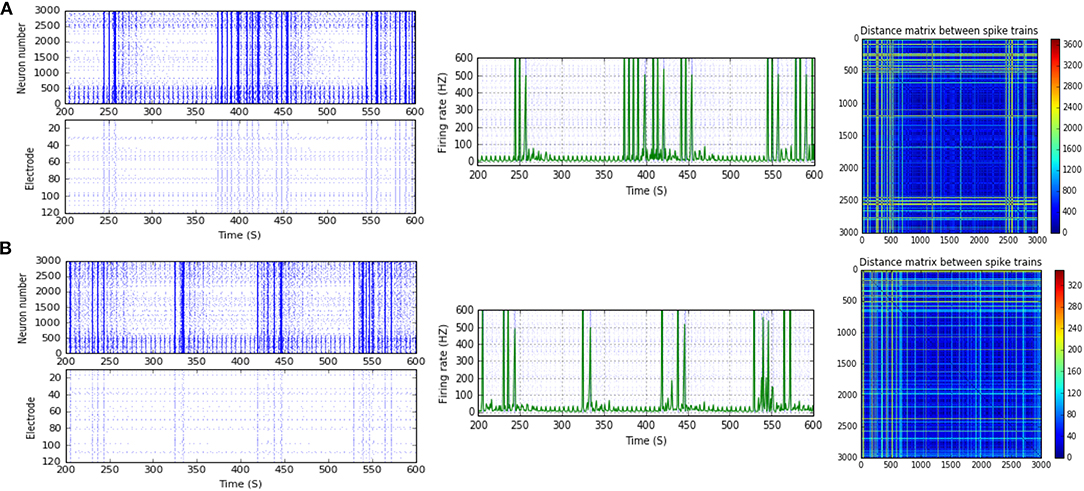
Figure 7. Selected elicited firing response activity in the immature network scenario (B-2) before and after implementing STF1 (when IF = 20 Hz: in the range of beta). (A) refers to the condition without implementing dynamical synapses (control) while (B) refers to that after implementing facilitating synapses (STF1). The first two figures of each panel refer to monitoring the pattern of firing activity in time windows from 200 to 600 seconds(s). Heat maps of each panel represent the modulation changes in spike distance matrix of the network scenario (B-2) before and after implementing STF1. The simulation time for heat maps of the spike distance is equal to 2,000 s.
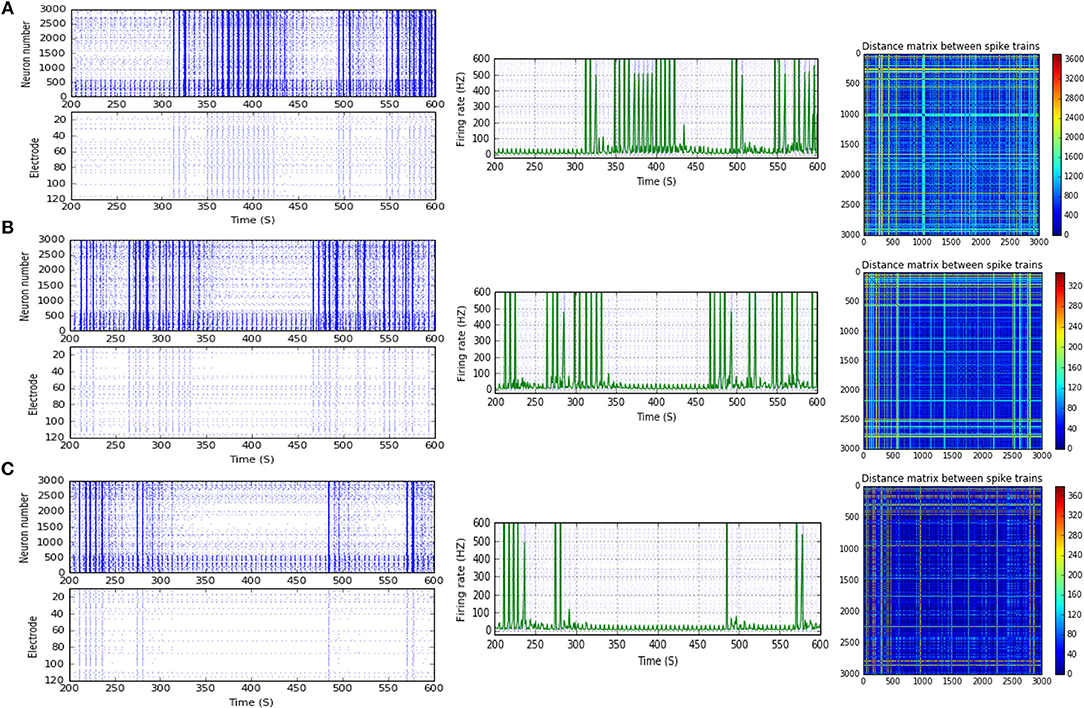
Figure 8. Selected elicited firing response activity in the immature network scenario (B-2) before and after implementing STF1 and STF2 (when IF = 30 Hz: in the range of beta). (A) refers to the condition without implementing dynamical synapses (control) while (B,C) refer to that after implementing facilitating synapses (STF1 and STF2, respectively). The first two figures of each panel refer to monitoring the pattern of firing activity in time windows from 200 to 600 seconds(s). Heat maps of each panel represent modulation changes in spike distance matrix of the network scenario (B-2) before and after implementing STF1 and STF2. The simulation time for heat maps of the spike distance is equal to 2,000 s.
The last three reduction outcomes showed a similar trend, which might imply a dynamical shift in development. This amount of MSF was experimentally reported to be in the range of 54.27 ± 7.22 Hz at this stage (Table 1; Baltz et al., 2010).
Dynamical Synapses Sustain the Survival of Network Activity by Extracting the Extra Amount of Noise
STP (dynamical synapses) strongly modulated the firing activity of several network scenarios (B-2), (B-3), and (B-4) by inducing a remarkable reduction in the amount of MSF. This might propose a dynamical developmental shift comparable to what was previously experimentally reported in vitro (MEAs model) by the end of week 2 (Table 1; Baltz et al., 2010). This amount of MSF was experimentally reported to be in the range of 54.27 ± 7.22 Hz at this stage (Table 1; Baltz et al., 2010).
In response to IF, scenario (B-2) in the range of beta (30 Hz), (B-3) [high gamma (80 Hz)], and (B-4) [low gamma (40 Hz)], express reduction in the amount of MSF after implementing STP. STF1 and STF2 (when IF = 30 Hz: in the range of beta) induce a considerable but critical reduction in MSF amount (B-2). These reductions are ~42.3% (from 85.0 to 49.0 Hz) and about 48.5% (from 85.0 to 43.8 Hz) after implementing STF1 and STF2, respectively (Figures 3C, 8). On the other hand, STD1 strongly induces a significant reduction in MSF amount in both network scenarios, namely (B-3) when IF = 80 Hz (in the range of high gamma) and (B-4) when IF = 40 Hz (in the range of low gamma). In response to STD1, (B-3) shows a reduction of about 88.6%, from 133.8 to 15.2 Hz (when IF = 80 Hz: in the range of high gamma) while (B-4) induces a reduction of about 45%, from 110.0 to 60.5 Hz (when IF = 40 Hz: in the range of low gamma). This reduction is observed after implementing STD2 (when IF = 80 Hz: in the range of high gamma; Figure 12C).
Consequently, these decreases indicate a crucial dynamical shift from higher firing activity, which exceeded the experimentally reported value of MSF in normal developmental conditions at this stage (Table 1; Baltz et al., 2010). Thus, this modulation suggests a dynamical survival, as seen in a reduction shift of firing rate activity. Such reductions could resemble what might be observed in MEAs in a transitional period of development between week 1 and 2 in vitro.
In certain situations, network scenarios (A-1), (A-2), (B-1), (B-2), (B-3), and (B-4) expressed modulation in their firing activity in response to dynamical synapses, even though STP were not able to induce a sufficient developmental shift to resemble what might be observed experimentally during early developmental stages (first and second week) in vitro (Table 1; Baltz et al., 2010). Then, dynamical synapses might lose their ability to sustain the survival of network activity when it exceeds what was experimentally reported in MEAs model during the change in GABAergic synaptic transmission [before (5–10 DIV) and/or during (11–17 DIV) the GABAA shift] (Table 1; Baltz et al., 2010).
In the previous examples, the induced modulation effects refer to two distinct situations. In the first situation, STP-triggered by all selected ranges of IF, in both network scenarios (A-1) and (A-2) does not succeed in expressing the amount of MSF similar to what was reported experimentally in MEAs during week 1 and 2 in vitro (Table 1; Baltz et al., 2010).
In the second situation, STP in response to specific IF in (B-1), (B-2), (B-3), and (B-4) does not express a similar amount of MSF compared to what could be recorded from MEAs during early stages of development (Table 1; Baltz et al., 2010).
After implementing STF2 (when IF = 20 Hz: in the range of beta), (B-1) shows about 20.3% increase, from 65.0 to 78.2 Hz (Figure 3A). It also expresses a 27.6% reduction, from 90.5 to 65.5 Hz, in response to STF2 (when IF = 45 Hz: in the range of low gamma) and a 47.6% reduction from 139.0 to 72.8 Hz, in response to STD1 (when IF = 80 Hz: in the range of high gamma; Figure 3A). Thus, despite the presence of STP modulation effects, it was not enough to adequately extort overflow of the firing activity. This observation indicates that it does not fall within the range of the experimentally reported MSF of MEAs model during the first and second week in vitro (Table 1; Baltz et al., 2010), i.e., 7.86 ± 1.30 Hz [before (5–10 DIV)] and 54.27 ± 7.22 Hz [during (11–17 DIV)]. Nevertheless, certain exceptional cases are illustrating substantial strength of dynamical synapses in gaining suitability for the survival of network activity by provoking the required modulation. This modulation signature mimics the amount of MSF that might be produced in normal conditions in vitro (Table 1; Baltz et al., 2010). For example, implementing STD1 and STF1 (when IF = 20 Hz: in the range of beta) to (B-1) leads to a high reduction in the amount of MSF (~44.6%, from 65.0 to 36.0 Hz and 41.5% from 65.0 to 38.0 Hz, respectively; Figure 3A). This high reduction might refer to a dynamical shift resembling experimental reports in vitro, that is, the recorded amount of MSF in the transitional developmental stage before the second week, just before the beginning of the second week and early in week 2 (Table 1; Baltz et al., 2010). Besides, the same scenario (B-1) shows a reduction of ~36.3%, from 62.5 to 39.8 Hz, in response to STD2 (when IF = 25 Hz: in the range of beta; Figure 3A).
Moreover, (B-2) shows a considerable reduction in MSF amount, about 40.3% (from 112.0 to 66.8 Hz) in the presence of STF2 (when IF = 40 Hz: in the range of low gamma; Figures 3C, 9). Likewise, it expresses a slight reduction in MSF amount, about 4.6% (from 86.0 to 82.0 Hz) and 11.6% (from 86.0 to 76.0 Hz) in the presence of STF1 and STF2 (when IF = 50 Hz: in the range of low gamma), respectively (Figures 3C, 10). In contrast, STD2 (when IF = 100 Hz) induces a significant reduction (roughly about 41. 4%, from 152.7 to 89.5 Hz; Figures 3C, 11A,C). Nevertheless, the modulation effects in both situations are different from the experimentally reported values of MSF during the early stages of development in vitro (Table 1; Baltz et al., 2010).
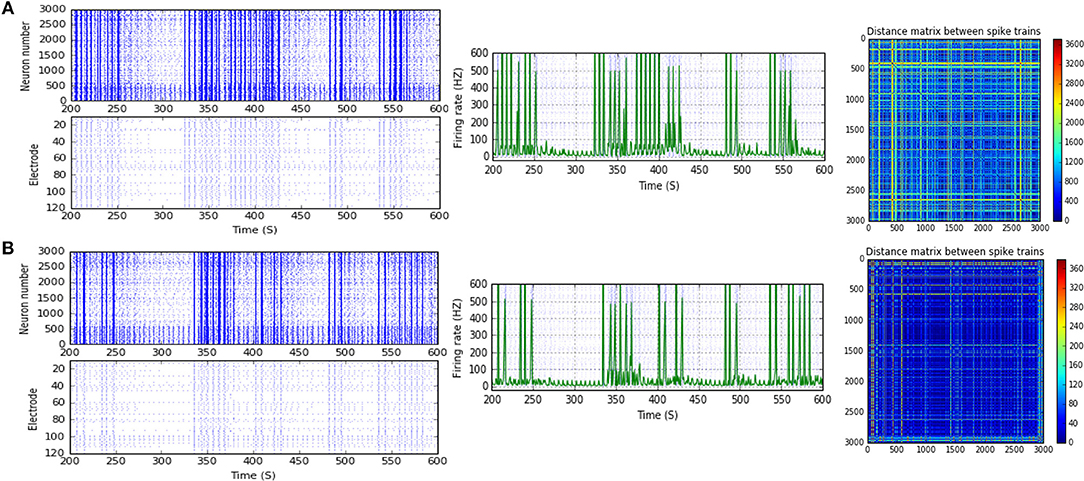
Figure 9. Selected elicited firing response activity in the immature network scenario (B-2) before and after implementing STF2 (when IF = 40 Hz: in the range of low gamma). (A) refers to the condition without implementing dynamical synapses (control) while (B) refers to that after implementing facilitating synapses (STF2). The first two figures of each panel refer to monitoring the pattern of firing activity in time windows from 200 to 600 seconds(s). Heat maps of each panel represent modulation changes in spike distance matrix of the network scenario (B-2) before and after implementing STF2. The simulation time for heat maps of the spike distance is equal to 2,000 s.

Figure 10. Selected elicited firing response activity in the immature network scenario (B-2) before and after implementing STF1 and STF2 (when IF = 50 Hz: in the range of low gamma). (A) refers to the condition without implementing dynamical synapses (control) while (B,C) refer to that after implementing facilitating synapses (STF1 and STF2, respectively). The first two figures of each panel refer to monitoring the pattern of firing activity in time windows from 200 to 600 seconds(s). Heat maps of each panel represent modulation changes in spike distance matrix of the network scenario (B-2) before and after implementing STF1 and STF2. The simulation time for heat maps of the spike distance is equal to 2,000 s.
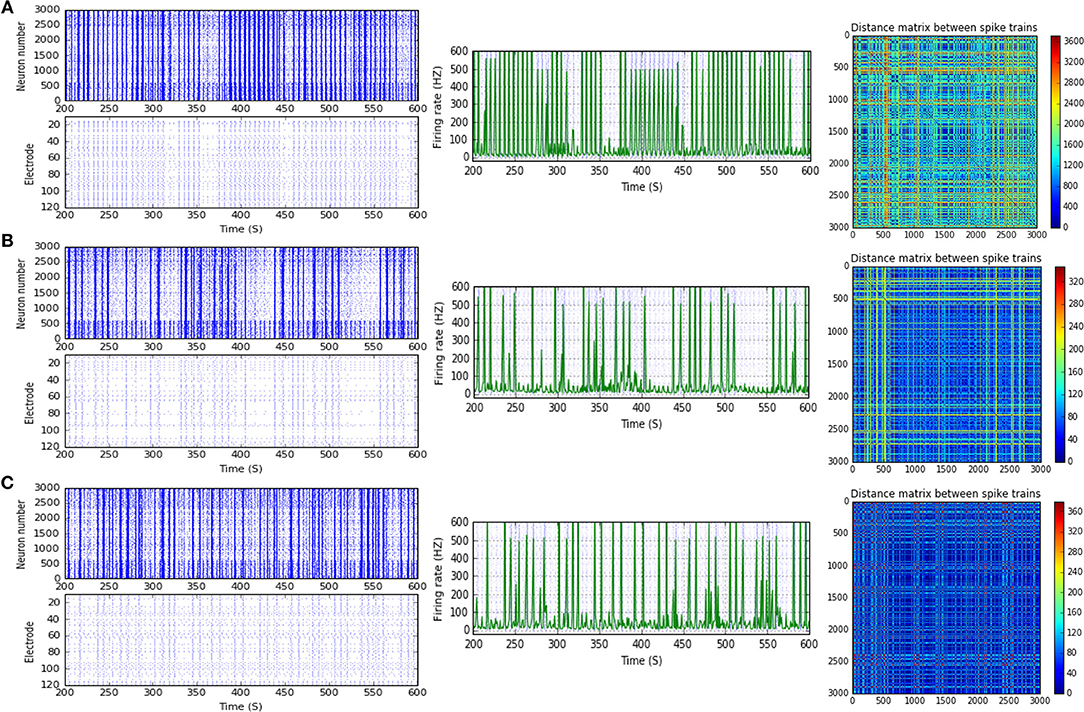
Figure 11. Selected elicited firing response activity in the immature network scenario (B-2) before and after implementing STD1 and STD2 (when IF = 100 Hz: in the range of high gamma). (A) refers to the condition without implementing dynamical synapses (control) while (B,C) refer to that after implementing depressing synapses (STD1 and STD2, respectively). The first two figures of each panel refer to monitoring the pattern of firing activity in time windows from 200 to 600 seconds(s). Heat maps of each panel represent modulation changes in spike distance matrix of the network scenario (B-2) before and after implementing STD1 and STD2. The simulation time for heat maps of the spike distance is equal to 2,000 s.
For (B-3), STD1 and STD2 (when IF = 55 Hz: in the range of high gamma) induce a remarkable decrease in MSF (about 40%, from 108.2 to 64.9 Hz and about 38.5%, from 108.2 to 66.5 Hz). Furthermore, STD2 (when IF = 80 Hz: in the range of high gamma) expresses a remarkable reduction in MSF, about 45.6% (from 133.8 to 72.8 Hz). Despite observing a reduction in firing activity, it is beyond the normal range of MSF during early stages of development, which was experimentally reported (Table 1; Baltz et al., 2010). Lastly, scenario (B-4) reveals certain conditions, through which STD2, STF1, and STF2 do not trigger the required modulation effects that could resemble what was experimentally reported during early stages of development, in vitro (Table 1; Baltz et al., 2010). For instance, (B-4) expresses a considerable increase in MSF amount, about 17.9% (from 107.7 to 127.0 Hz) in the presence of STF2 (when IF = 20 Hz: in the range of beta; Figure 12C). Moreover, it induces a remarkable reduction in MSF amount, roughly 31.2% (from 110.5 to 76.0 Hz) and 39.2% (from 110.5 to 67.2 Hz), in the presence of STF1 and STF2 (when IF = 45 Hz: in the range of low gamma), respectively (Figure 12C). Similarly, (B-4) expresses a considerable reduction in the amount of MSF, about 25.7% (from 109.1 to 81.0 Hz) and 13.4% (from 109.1 to 94.5 Hz) in the presence of STF1 and STF2 (when IF = 55 Hz: in the range of high gamma), respectively (Figure 12C). On the other hand, (B-4) triggers a slight reduction in the amount of MSF, about 2.2% (from 136.5 to 133.5 Hz) in the presence of STD2 (when IF = 80 Hz: in the range of high gamma; Figure 12C).
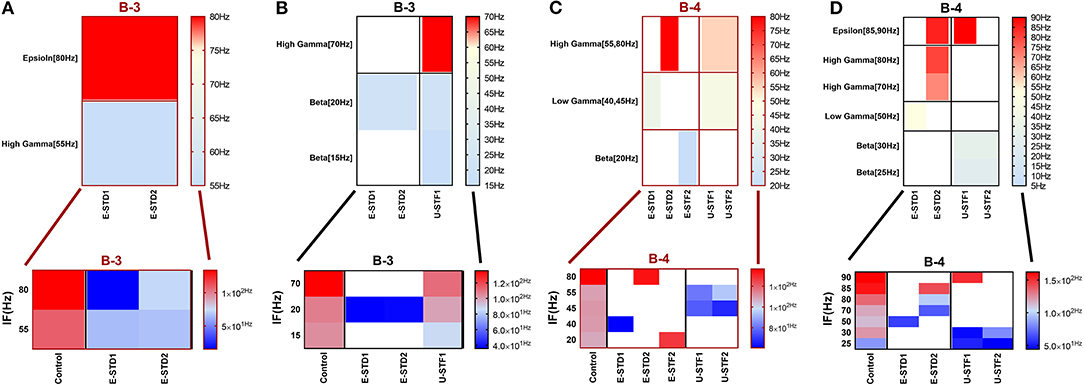
Figure 12. Heat maps of selected elicited responses in each network scenario (B-3) and (B-4), in both immature and mature conditions, respectively, before and after implementing dynamical synapses. (A,C) refer to immature conditions of network scenarios (B-3 and B-4) while (B,D) relate to mature conditions of network scenarios (B-3 and B-4). The upper graphs refer to particular Poisson input frequencies [IF (Hz)] that triggered a substantial modulation effect, measured in Hz before and after STP in these networks (Lower graphs). White blocks refer to excluded values due to statistical variations in probability density function (PDF). Control refers to the condition without STP implementation (dynamical synapses); STD1 and STD2 refer to two types of depressing synapses while STF1 and STF2 refer to facilitating synapses. E-STD1, E-STD1, E-STF1, and E-STF2 relate to the expected modulation effect induced by dynamical synapses, i.e., reduction of firing rate activities in response to depressing synapses (STD1 and STD2) while increasing the firing rate activity in response to facilitating synapses (STF1 and STF2). On the other hand, U-STD1, U-STD1, U-STF1, and U-STF2 relate to the expected modulation effect induced by dynamical synapses, i.e., an increase of firing rate activities in response to depressing synapses (STD1 and STD2), while reduction in the firing rate activity in response to facilitating synapses (STF1 and STF2), see also Tables 5, 6.
A Significant Influence of STP on the Two Physiological States of GABAA
The differential significant modulation effects of each class of dynamical synapses (STD1, STD2, STF1 and STF2) triggered by IF in eliciting firing rate activity in each network scenario (immature and mature conditions), namely (A-1), (A-2), (B-1), (B-2), (B-3), and (B-4) is illustrated in the following section (Tables 5, 6).
Immature Network Scenarios
Analyzed with a two-way ANOVA, the elicited modulated effects, induced by IF (Hz) and dynamical synapses (STP) in an immature condition within its network scenarios (i.e., each network scenario related to immature condition) are shown in Table 5 and summarized as follows:
(1) STD1 revealed significant effects [P = 0.0056 (A-1), P = 0.0141(A-2), P < 0.0001(B-1), P = 0.0138 (B-3), and P = 0.0010 (B-4)], while IF (Hz) had a significant effect on (B-3) (P = 0.0420). As to depressing synapses (STD1), which expressed reduction in the firing rate activity by STD1 (E-STD1), IF (Hz) induced significant effects [P = 0.0048 (B-1) and P = 0.0087 (B-2)], while E-STD1 expressed significant effects [P < 0.0001(B-1), P = 0.0003 (B-2), and P < 0.0001 (B-4)]. On the other hand, the unexpected elicited modulation effect induced by depressing synapses (STD1) expressed an increase in the firing rate activity by STD1 (U-STD1). IF (Hz) induced a significant effect [P = 0.0001 (B-3)] while U-STD1 expressed significant effects [P = 0.0361 (A-2), P = 0.0084 (B-2), and P = 0.0027 (B-3)].
(2) STD2 expressed significant effects [P = 0.0360 (A-1), P = 0.0143 (A-2), P = 0.0143 (B-1), P = 0.0328 (B-3), and P = 0.0008 (B-4)], while IF (Hz) had a significant effect on (B-3) (P = 0.0419). As for the expected elicited modulation effect induced by depressing synapses (STD2), which expressed reduction in the firing rate activity by STD2 (E-STD2), IF (Hz) induced significant effects [P = 0.0011 (B-2)], while E-STD2 expressed significant effects [P = 0.0034(A-1), P = 0.0001(A-2), P < 0.0001(B-1), P = 0.0002(B-2), and P < 0.0001(B-4)]. Concerning the unexpected elicited modulation effect induced by depressing synapses (STD2), which expressed an increase in the firing rate activity by STD2 (U-STD2), IF (Hz) did not induce any significant effects at any network scenario, however, U-STD2 expressed significant effects [P = 0.0379(A-2), P = 0.0185(B-1), P = 0.0254(B-2), P = 0.0216(B-3), and P = 0.0342(B4)].
(3) STF1 expressed significant effects [P = 0.0047 (B-1) and P = 0.0127 (B-4)], while IF (Hz) had significant effects on (B-1) and (B-2) (P = 0.0268 and P < 0.0001, respectively). As to the expected elicited modulation effect induced by facilitating synapses (STF1), which expressed an increase in the firing rate activity by STF1 (E-STF1), IF (Hz) induced a significant effect [P = 0.0179 (A-2)], while E-STF1 expressed significant effects [P = 0.0179 (A-2) and P = 0.0055 (B-3)]. Concerning the unexpected elicited modulation effect induced by facilitating synapses (STF1), which expressed a reduction in the firing rate activity by STF1 (U-STF1), IF (Hz) induced significant effects [P = 0.0174 (A-1), P = 0.0135 (B-1), P = 0.0211 (B-2), and P = 0.0023 (B-3)], while U-STF1 expressed significant effects [P = 0.0238 (A-2), P = 0.0008 (B-1), P = 0.0156 (B-2), and P = 0.0006 (B-3)].
(4) STF2 expressed significant effects [P = 0.0464 (B-1), P = 0.0057(B-2), and P = 0.0031(B-3)], while IF (Hz) had significant effects on (B-1), (B-2), and (B-3) (P = 0.0273, P = 0.0040, and P = 0.0031, respectively). As to the expected elicited modulation effect induced by facilitating synapses (STF2) [which expressed an increase in the firing rate activity by STF2 (E-STF2)] IF (Hz) induced significant effects [P = 0.0234(A-1), P = 0.0296(A-2), P = 0.0076(B-1), P = 0.0027(B-3), and P = 0.0036(B-4)] as well as E-STF2 that expressed significant effects [P = 0.0233(A-1), P = 0.0165(B-1), P = 0.0024(B-2), P = 0.0212(B-3), and P = 0.0203(B-4)]. Regarding the unexpected elicited modulation effect induced by facilitating synapses (STF2), which expressed a reduction in the firing rate activity by STF2 (U-STF2), IF (Hz) induced significant effects [P = 0.0036 (B-1), P = 0.0086 (B-2), and P = 0.0036 (B-3)], while U-STF2 expressed significant effects [P = 0.0048 (A-2), P < 0.0001(B-1), P = 0.0139 (B-2), and P = 0.0030 (B-3)].
Mature Network Scenarios
The results of the two-way ANOVA of the elicited modulated effects induced by IF (Hz) and dynamical synapses (STP) in the mature condition, within its network scenarios are illustrated in Table 6 and can be summarized as follows:
(1) STD1 expressed significant effects [P = 0.0438 (A-2), P = 0.0001(B-1), P = 0.0025 (B-2), P = 0.0144 (B-3), and P = 0.0050 (B-4)], while IF (Hz) had significant effects on (A-1) and (B-1) (P = 0.0286 and P = 0.0126). As to the expected elicited modulation effect induced by depressing synapses (STD1), which expressed reduction in the firing rate activity by STD1 (E-STD1), IF (Hz) induced significant effects [P < 0.0001(A-1), P = 0.0083 (A-2), P = 0.0043(B-1), P = 0.0014(B-3), and P = 0.0301(B-4)], while E-STD1 expressed significant effects [P = 0.0004 (A-1), P < 0.0001(A-2), P < 0.0001(B-1), P < 0.0001(B-2), P < 0.0001(B-3), and P < 0.0001(B-4)]. On the other hand, the unexpected elicited modulation effect induced by depressing synapses (STD1), which expressed an increase in the firing rate activity by STD1 (U-STD1), IF (Hz) induced significant effects [P = 0.0139 (B-1) and P = 0.0415 (B-4)], while U-STD1 expressed a significant effect [P = 0.0286 (B-4)].
(2) STD2 expressed significant effects [P = 0.0002 (A-1), P = 0.0004 (B-1), P < 0.0001 (B-2), P = 0.0101 (B-3), and P = 0.0027 (B-4)], while IF (Hz) had significant effects on (A-1), (B-1), (B-2), (B-3), and (B-4) (P < 0.0001, P = 0.0237, P = 0.0439, P = 0.0490, and P = 0.0064, respectively). As to the expected elicited modulation effect induced by depressing synapses (STD2), which expressed reduction in the firing rate activity by STD2 (E-STD2), IF (Hz) induced significant effects [P < 0.0001(A-1), P = 0.0008(A-2), P = 0.0109 (B-1), P = 0.0439 (B-2), and P = 0.0011(B-4)], while E-STD2 expressed significant effects [P < 0.0001 (A-1), P = 0.0004 (A-2), P < 0.0001 for (B-1), (B-2), (B-3), and (B-4)]. Regarding the unexpected elicited modulation effect induced by depressing synapses (STD2), which expressed an increase in the firing rate activity by STD2 (U-STD2), IF (Hz) induced significant effects on (A-1), (B-1), and (B-3) (P = 0.0035, P = 0.0022, and P = 0.0070, respectively), however, U-STD2 expressed significant effects [P = 0.0330 (A-1) and P = 0.0323 (B-1)].
(3) STF1 expressed significant effects [P = 0.0042 (B-1), P = 0.0275 (B-2), P = 0.0081(B-3) and P = 0.0009 (B4)], while IF (Hz) had significant effects on (A-2), (B-1), (B-2), (B-3), and (B-4) (P = 0.0084, P = 0.0002, P = 0.0337, P = 0.0035, and P = 0.0049, respectively). As to the expected elicited modulation effect induced by facilitating synapses (STF1), which expressed an increase in the firing rate activity by STF1 (E-STF1), IF (Hz) induced significant effects [P = 0.0205 (A-1), P = 0.0364 (B-1), and P = 0.0383 (B-2)], while E-STF1 expressed significant effects [P = 0.0170 (A-1) and P = 0.0275 (B-1)]. Concerning the unexpected elicited modulation effect induced by facilitating synapses (STF1), which expressed a reduction in the firing rate activity by STF1 (U-STF1), IF (Hz) induced significant effects [P = 0.0371(A-1), P = 0.0043 (A-2), P < 0.0001(B-1), P = 0.0196 (B-2), P = 0.0005 (B-3), and P = 0.0008 (B-4)], while U-STF1 expressed significant effects [P = 0.0048 (A-1), P = 0.0018 (A-2), P < 0.0001(B-1), P = 0.0023 (B-2), P < 0.0001(B-3), and P < 0.0001(B-4)].
(4) STF2 expressed significant effects [P = 0.0011(B-1) and P = 0.0059 (B-3)], while IF (Hz) had significant effects on (B-1), (B-3), and (B-4) (P = 0.0002, P = 0.0015, and P = 0.0402, respectively). As for the expected elicited modulation effect induced by facilitating synapses (STF2), which expressed an increase in the firing rate activity by STF2 (E-STF2), IF (Hz) induced significant effects [P = 0.0028 (B-1) and P = 0.0003 (B-3)], while E-STF2 expressed significant effects [P = 0.0285 (A-1), P = 0.0255 (A-2), P = 0.0069 (B-2), and P = 0.0156 (B-4)]. Regarding the unexpected elicited modulation effect induced by facilitating synapses (STF2), which expressed a reduction in the firing rate activity by STF2 (U-STF2), IF (Hz) induced significant effects [P = 0.0111(A-2), P < 0.0001(B-1), P = 0.0031(B-3), and P = 0.0110 (B-4)], while U-STF2 expressed significant effects [P = 0.0008 (A-1), P < 0.0001(A-2), P < 0.0001(B-1), P = 0.0030 (B2), P = 0.0002 (B-3), and P = 0.0006 (B-4)].
Discussion
Investigations do not reveal a consensus on the type of non-linearities in synapses at different maturational stages of the neocortex (Baltz et al., 2010). Therefore, we present herein a simulation study under various network scenarios, based on incorporating particular percentages of a local density of dendritic arborization (i.e., lateral connectivity between neurons) and a lateral spread length between neighboring neurons (i.e., the nearby local connectivity). Our results provide a prediction of how several neural network scenarios, including GABAA switch, lateral and local connectivity, and dynamical synapses, interact during cortical development.
Monitoring Firing Responses
Through Measuring MSF
Before implementing STP, we observed a certain level of variability in the produced amount of MSF between network scenarios of mature and immature condition. This validates the independent nature of each scenario. Furthermore, the increment in the amount of MSF was associated with the increase in the values of IF (Hz). Nevertheless, there were notable differences between immature and mature conditions. For instance, before implementing the dynamical synapses, there was no significant impact of IF on eliciting firing responses among all the network scenarios of the immature condition. In contrast, IF expressed significant effects on the firing responses among all the network scenarios of the mature condition. This observation might reflect the relation between the selectivity of IF and the maturation nature of the network based on the physiology of the GABAergic influence. However, some exceptional situations expressed certain degrees of fluctuation, in particular, after implementing dynamical synapses. These fluctuations were distinctively shown in each scenario, thus indicating their dynamical nature, as well as for immature and mature conditions, reflecting the impact of the GABAergic signature. Therefore, we argue that higher IF values (in ranges of high gamma and epsilon) do not often lead to higher firing responses in both conditions (immature and mature), i.e., the inducing effect of such values on the immature network scenarios lead to higher firing responses in comparison with mature network scenarios (Khalil et al., 2017b). Consequently, IF (Hz) is not the exclusive driving factor, as there are additional fundamental elements, such as the proportion of lateral and local connectivity, and more importantly, the physiological state of GABAA.
After implementing dynamical synapses (STP), all network scenarios—of both conditions—expressed remarkable differences in the produced amount of MSF.
In general, the effects of depressing synapses support the findings of Loebel and Tsodyks (2002). These effects have been thoroughly explained in many studies (Tsodyks and Markram, 1997; Tsodyks et al., 1998; Loebel and Tsodyks, 2002). Facilitating synapses showed high dynamical variability, i.e., reduction and increase in MSF amount, in both conditions (immature and mature). Nevertheless, the slight increment in the amount of MSF in response to STF is in line with the study of Barak and Tsodyks (2007). They proposed that facilitating synapses (STF) serve to optimize information transfer for high firing rate activity due to the rise in synaptic strength. Hence, one can argue that during later stages of development (weeks 3 and 4 in vitro), dynamical facilitating synapses can develop their synaptic strength within a certain limit. This argument is further indicated through varying synaptic non-linearity parameters that influence the structure of each network scenario, which explains the observed reduction in MSF across scenarios. Together, these effects may temporally synchronize with the physiological maturation of GABAA during early stages of cortical development (weeks 1 and 2 in vitro).
To conclude, dynamical synapses expressed two contrasting modulation effects among network scenarios of both conditions (immature and mature). One effect indicated its substantial contribution in producing a remarkable and adequate reduction in the amount of MSF to resemble what is biologically observed in MEA models during these stages of development. Another revealed the failure of STP to maintain the survival of network activity when MSF was high, exceeding what might be experimentally observed in MEAs during the first 2 weeks (immature network scenarios) and the third and fourth week (mature network scenarios) in vitro. Therefore, in certain circumstances, dynamical synapses could express a capacity to influence the network survival. Thus, it would remain in the normal developmental range of what was seen in the in vitro model in various stages of development by inducing a significant modulator effect. These effects would be capable of producing the normal amount of MSF. We also demonstrated how STP could modulate the amount of MSF, which implies a developmental shift to earlier developmental stages in vitro, either within the first 2 weeks, the third and fourth week or slightly earlier. Accordingly, abundant supplies of STP signaling [triggered by IF (Hz)] might resemble an intrinsic driving factor for shaping the pattern of firing activity during different developmental stages in vitro.
Through Measuring Firing Rate Activity (Hz)
Each STP type induced two contrasting modulation effects with variation from one network scenario to another in mature and immature conditions. Accordingly, it was imperative to separate these responses into two parts: predicted and unpredicted. The former refers to the success of depressing synapses (i.e., STD) in inducing a significant reduction in neural firing activity. This reduction is in agreement with the study of Barak and Tsodyks (2007). In contrast, the latter points to the opposite effect of STD, which is not in line with the majority of short-term plasticity studies. Nevertheless, states of predicted modulation effects were lower in the case of depressing synapses (i.e., modulation through reduction) and higher in the case of facilitating synapses (i.e., modulation through increasing firing activity in immature condition) and vice versa (i.e., mature condition).
On the other hand, unpredicted modulation effects were higher in the case of STD (i.e., modulation through increasing firing activity) and lower in the case of facilitating synapses (i.e., modulation through a reduction in immature condition) and vice versa. Our finding supports the suggestion of the diverse functions of STP components in synaptic computations (Deng and Klyachko, 2011; Blackman et al., 2013; Larsen and Sjöström, 2015). Then, there is a possibility of having developmental STP switch, which serves for a particular function.
According to Cheetham and Fox (2010), during the early development, there is a strong short-term synaptic depression of excitation, which is essential to avoid the uncontrolled excitation due to the partial maturation of the inhibition at this time. Nevertheless, in the mature condition, having “fully developed inhibition” may cancel the need for this strong depression, thus allowing excitatory synapses to express “a richer spectrum of short-term dynamics” (Cheetham and Fox, 2010). One of the appealing possibilities according to Blackman et al. (2013), is that the dynamics of several synapse types may mature in a differential manner. i.e., synapse types with similar STP may become dissimilar with age while those with different subclasses of synaptic dynamics (i.e., depressing synapses (STD1, STD2) and facilitating synapses (STF1 and STF2) in the immature condition may be similar until the neural network reaches the level of maturation. However, this possibility has not yet been extensively explored. Therefore, one can claim that STP expresses a differential potential to influence the network activity, based on its membrane time constant, IF (Hz), the network structure, and the physiological state of GABAA.
Dynamical Synapses and the Modulation of Neural Network Activity Through Synaptic Fine Tuning
After the implementation of dynamical synapses, we observed the following: (1) differential effects of IF in inducing the modulated responses, which is expressed in the noticeable changes in the firing rate activity, among network scenarios for both conditions (immature and mature networks). These differential effects refer to the significant effects of IF in expressing modulated firing activity after implementing; depressing synapses (STD1 and STD2) in immature condition, and facilitating synapses (STF1 and STF2) in mature condition. In contrast, there was a slight but not significant effect of IF in expressing modulated firing activity after implementing; depressing synapses (STD1 and STD2) in mature condition, and facilitating synapses (STF1 and STF2) in immature condition. (2) The modulation responses, which were elicited after the implementation of dynamical synapses, expressed differently in each network scenario for both conditions (immature and mature networks). Overall, there was a significant modulation effect in response to dynamical synapses (STP). However, the degree of significance varied based on the state of GABAA reversal potential, which referred to the maturation of the neural networks. This observation confirms the crucial role of the physiological state of GABAA in response to dynamical synapses. Thus, our findings reflect the crucial role of STP in modulating neural network activity by mediating several ranges of IF through two physiological states of GABAA. This finding is in line with fundamental studies on STP mechanisms (Tsodyks and Markram, 1997; Tsodyks et al., 1998; Loebel and Tsodyks, 2002) highlighting the essential role of STP in filtering signal propagation to sustain and maintain neural network activity.
Each class of STP showed two contrasting modulation effects not only with the variation in each network scenario but also from one condition to another, i.e., immature and mature network condition. Notably, there were differential effects of IF in inducing the modulated responses, expressed in noticeable changes in the firing rate activity after implementing dynamical synapses, among network scenarios for both conditions (immature and mature networks). Thus, IF induced significant effects in expressing modulated firing activity after implementing; (1) depressing synapses (STD1 and STD2) in immature condition, and (2) facilitating synapses (STF1 and STF2) in mature condition. In contrast, IF (Hz) did not reveal a significant effect in expressing modulated firing activity after implementing; depressing synapses (STD1 and STD2) in mature condition, and implementing facilitating synapses (STF1 and STF2) in immature condition. This observation indicates the crucial impact of IF in modulating the firing rate responses, and its relation to dynamical synapses and the GABAergic physiological state of maturation. Therefore, it was necessary to segregate these modulated responses (according to studies on STP) into two sections: Predicted and Unpredicted. The first modulation effect referred to the substantial contribution of depressing synapses in inducing a remarkable and sufficient reduction in the neural firing rate activity (Hz) while increment effect in case of facilitating synapses.
On the other hand, the contrasting effect of STF relates to unpredicted influence, which is not in agreement with the majority of STP plasticity studies. Noticeably, the number of predicted modulation effects induced by depressing synapses (STD) was lower in comparison with facilitating synapses (STF) in immature condition and vice versa in mature condition. Therefore, STP might express a capacity to influence network activity based on the physiological state of GABAA. Thus, reflecting the diverse functions of STP components in synaptic computations (Deng and Klyachko, 2011; Blackman et al., 2013; Larsen and Sjöström, 2015), then, there are potential functions and many mechanisms underlying “target-specific STP.” There are several examples of “STP specific to the target cell (Angulo et al., 1999; Reyes and Sakmann, 1999; Buchanan et al., 2012; Costa et al., 2013), and despite the existence of a few common principles, it is clear that not nearly enough is known about the why and the how.” Therefore, the specificity of STP should be explored elaborately, both theoretically and empirically (Blackman et al., 2013).
Clinical Implications and Future Directions
STP is an essential element for evaluating firing rate activity (Hz) during the physiological development of GABAA signaling. Consequently, STP might represent an indicator for the interplay between the action of physiological maturation of GABAA signaling on one hand and the functional maturation of both the local and lateral connectivity between neurons on the other hand. Therefore, our study might have a potential biological relevance for more complex biological network scenarios. Thus, additional requisite puzzles, related to neocortical development from a biophysical perspective, could be approached using our SNN model. We consider our model as a robust predictive tool for further evaluation of the impact of functional and structural changes. These might be due to several factors, such as an excess or a deficit of IF or maladaptive modulation of dynamical synapses. A better understanding of GABAergic signaling in brain maturation and neuropsychiatric disorders can help develop novel treatment interventions. Ben-Ari et al. (2012) argued that since GABA depolarizes pathological neurons, then agents capable of reducing [Cl−]i maybe of therapeutic value. Remarkably, it has been shown that Oxytocin-mediated reduction of [Cl−]i exerts neuroprotective actions, reducing the severity of anoxic episodes (Tyzio et al., 2006) and also exerts analgesic actions, increasing the threshold of pain reactions (Mazzuca et al., 2011). Although several factors can mediate changes in [Cl−]i, they usually involve the chloride importer NKCC1 and the chloride exporter KCC2. Increased activity of NKCC1, as well as down-regulation of KCC2, have been observed in experimental and human epileptic neurons (Huberfeld et al., 2007; Ben-Ari et al., 2012). Although the GABA-acting antiepileptic drug phenobarbital (PB) is the drug of first choice to treat neonatal seizures (Bassan et al., 2008), in many cases, it fails to block or significantly reduce epileptic seizures (Guillet and Kwon, 2007). However, pioneering studies have found empirical evidence for the therapeutic role of diuretics that, by reducing [Cl−]i, facilitate the antiepileptic effects of PB and related drugs (Dzhala et al., 2008, 2010).
Moreover, further studies suggest alterations of GABAergic signaling in autism spectrum disorders (ASDs) (Zhang et al., 2010; Pizzarelli and Cherubini, 2011). Lemonnier and Ben-Ari (2010) investigated the effects of long-term administrations of the diuretic bumetanide on infants with ASD and found highly beneficial effects. Interestingly, Oxytocin has also been shown to transiently improve visual communication in adults with ASD (Andari et al., 2010). Thus, future studies will have to investigate the therapeutic effects of agents capable of reducing [Cl−]i in the different subtypes of patients with ASDs showing different pathophysiological conditions (Krippl and Karim, 2009, 2011; for a review see Khalil et al., 2018). Recently, we suggested a multilayer neural network model for patients with ASDs including the mirror neuron system on a first layer and transforming this information to a higher layer network responsible for reasoning (Khalil et al., 2018). Future studies with ASD participants combining behavioral tasks with neuroimaging methods and pharmacological interventions as well as computational modeling can help validate and complement this suggested model and reveal the therapeutic role of GABAergic modulation in specific subtypes of ASDs and other neurological and psychiatric disorders.
Author Contributions
RK and AM designed the study and performed the simulation and data analyses. RK and MM interpreted the data, wrote the manuscript and provided critical revisions. EK and AK provided clinical implications. AK and MM critically revised language and references for the final revisions.
Funding
RK was funded by the Deutsche Forschungsgemeinschaft (DFG), DFG KA 4267/3-1.
Conflict of Interest Statement
The authors declare that the research was conducted in the absence of any commercial or financial relationships that could be construed as a potential conflict of interest.
Acknowledgments
We would like to thank the Institute für Physiology, Medizinische Fakultät, Otto-von-Guericke University, Magdeburg, Germany, and the Leibniz-Institute für Neurobiologie (LIN), Leibniz Graduate School, Project: Genetics of synaptic functions and dysfunctions (WGL Pakt für Forschung & Innovation), Magdeburg, Germany.
Supplementary Material
The Supplementary Material for this article can be found online at: https://www.frontiersin.org/articles/10.3389/fncel.2018.00468/full#supplementary-material
Abbreviations
IF, Poisson input frequency; MEAs, multi-electrode arrays; SNN, spiking neural network; STD, short-term depression—depressing synapses; STF, short-term facilitation—facilitating synapses; STP, short-term synaptic plasticity—dynamical synapses.
References
Abbott, L. F., DePasquale, B., and Memmesheimer, R. (2016). Building functional networks of spiking model neurons. Nat. Neurosci. 19, 1–16. doi: 10.1038/nn.4241
Ahmed, F. Y., Yusob, B., and Hamed, H. N. A. (2014). Computing with spiking neuron networks: a review. Int. J. Adv. Soft Comput. Appl. Sydney, 6, 1–21. Available online at: https://pdfs.semanticscholar.org/ecba/7b5a713cf3b175b78e59f0789f851245d01b.pdf
Andari, E., Duhamel, J. R., Zalla, T., Herbrecht, E., Leboyer, M., and Sirigu, A. (2010). Promoting social behavior with oxytocin in high-functioning autism spectrum disorders. Proc. Natl. Acad. Sci. U.S.A. 107, 4389–4394. doi: 10.1073/pnas.0910249107
Angulo, M. C., Staiger, J. F., Rossier, J., and Audinat, E. (1999). Developmental synaptic changes increase the range of integrative capabilities of an identified excitatory neocortical connection. J. Neurosci. 19, 1566–1576. doi: 10.1523/JNEUROSCI.19-05-01566.1999
Baltz, T., De Lima, A. D., and Voigt, T. (2010). Contribution of GABAergic interneurons to the development of spontaneous activity patterns in cultured neocortical networks. Front. Cell. Neurosci. 4:15. doi: 10.3389/fncel.2010.00015
Barak, O., and Tsodyks, M. (2007). Persistent activity in neural networks with dynamic synapses. PLoS Comput. Biol. 3:e35. doi: 10.1371/journal.pcbi.0030035
Bassan, H., Bental, Y., Shany, E., Berger, I., Froom, P., Levi, L., et al. (2008). Neonatal seizures: dilemmas in workup and management. Pediatr. Neurol. 38, 415–421. doi: 10.1016/j.pediatrneurol.2008.03.003
Ben-Ari, Y. (2002). Excitatory actions of gaba during development: the nature of the nurture. Nat. Rev. Neurosci. 3:728. doi: 10.1038/nrn920
Ben-Ari, Y. (2007a). GABA, a key transmitter for fetal brain maturation. Med. Sci. 23, 751–755. doi: 10.1051/medsci/20072389751
Ben-Ari, Y., Gaiarsa, J., Tyzio, R., and Khazipov, R. (2007b). GABA: a pioneer transmitter that excites immature neurons and generates primitive oscillations. Physiol. Rev. 87, 1215–1284. doi: 10.1152/physrev.00017.2006
Ben-Ari, Y., Khalilov, I., Kahle, K. T., and Cherubini, E. (2012). The GABA excitatory/inhibitory shift in brain maturation and neurological disorders. Neuroscientist 18, 467–486. doi: 10.1177/1073858412438697
Benucci, A., Frazor, R. A., and Carandini, M. (2007). Standing waves and traveling waves distinguish two circuits in visual cortex. Neuron 55, 103–117. doi: 10.1016/j.neuron.2007.06.017
Bienenstock, E. (1996). On the dimensionality of cortical graphs. J. Physiol. 90, 251–256. doi: 10.1016/S0928-4257(97)81434-9
Blackman, A. V., Abrahamsson, T., Costa, R. P., Lalanne, T., and Sjöström, P. J. (2013). Target-cell-specific short-term plasticity in local circuits. Front. Synaptic Neurosci. 5:11. doi: 10.3389/fnsyn.2013.00011
Bredt, D., and Nicholl, R. (2003). AMPA receptor trafficking at excitatory synapses. Neuron 40, 361–379. doi: 10.1016/S0896-6273(03)00640-8
Brette, R., and Gerstner, W. (2005). Adaptive exponential integrate-and-fire model as an effective description of neuronal activity. J. Neurophysiol. 94, 3637–3642. doi: 10.1152/jn.00686.2005
Brette, R., Rudolph, M., Carnevale, T., Hines, M., Beeman, D., Bower, J. M., et al. (2007). Simulation of networks of spiking neurons: a review of tools and strategies. J. Comput. Neurosci. 23, 349–398. doi: 10.1007/s10827-007-0038-6
Bringuier, V., Chavane, F., Glaeser, L., and Frégnac, Y. (1999). Horizontal propagation of visual activity in the synaptic integration field of area 17 neurons. Science 283, 695–699. doi: 10.1126/science.283.5402.695
Brunel, N. (2000). Dynamics of networks of randomly connected excitatory and inhibitory spiking neurons. J. Physiol. 94, 445–463. doi: 10.1016/S0928-4257(00)01084-6
Buchanan, K. A., Blackman, A. V., Moreau, A. W., Elgar, D., Costa, R. P., Lalanne, T., et al. (2012). Target-specific expression of presynaptic NMDA receptors in neocortical microcircuits. Neuron 75, 451–466. doi: 10.1016/j.neuron.2012.06.017
Buzsáki, G., and Draguhn, A. (2004). Neuronal oscillations in cortical networks. Science 304, 1926–1929. doi: 10.1126/science.1099745
Cheetham, C. E. J., and Fox, K. (2010). Presynaptic development at L4 to L2/3 excitatory synapses follows different time courses in visual and somatosensory cortex. J. Neurosci. 30, 12566–12571. doi: 10.1523/JNEUROSCI.2544-10.2010
Clopath, C., Büsing, L., Vasilaki, E., and Gerstner,, W (2010). Connectivity reflects coding: A model of voltage-based STDP with homeostasis. Nat. Neurosci. 13, 344–352. doi: 10.1038/nn.2479
Costa, R. P., Sjostrom, P. J., and Van Rossum, M. C. (2013). Probabilistic inference of short-term synaptic plasticity in neocortical microcircuits. Front. Comput. Neurosci. 7:75. doi: 10.3389/fncom.2013.00075
Czöndör, K., and Thoumine, O. (2013). Biophysical mechanisms regulating AMPA receptor accumulation at synapses. Brain Res. Bull. 93, 57–68. doi: 10.1016/j.brainresbull.2012.11.001
Davison, A. P., Hines, M. L., and Muller, E. (2009). Trends in programming languages for neuroscience simulations. Front. Neurosci. 3, 374–380. doi: 10.3389/neuro.01.036.2009
Deng, P. Y., and Klyachko, V. A. (2011). The diverse functions of short-term plasticity components in synaptic computations. Commun. Integr. Biol. 4, 543–548. doi: 10.4161/cib.15870
Destexhe, A. (1997). Conductance-based integrate-and-fire models. Neural Comput. 9, 503–514. doi: 10.1162/neco.1997.9.3.503
Dichter, M. A. (1980). Physiological identification of GABA as the inhibitory transmitter for mammalian cortical neurons in cell culture. Brain Res. 190, 111–121. doi: 10.1016/0006-8993(80)91163-4
Dzhala, V. I., Brumback, A. C., and Staley, K. J. (2008). Bumetanide enhances phenobarbital efficacy in a neonatal seizure model. Ann. Neurol. 63, 222–235. doi: 10.1002/ana.21229
Dzhala, V. I., Kuchibhotla, K. V., Glykys, J. C., Kahle, K. T., Swiercz, W. B., Feng, G., et al. (2010). Progressive NKCC1-dependent neuronal chloride accumulation during neonatal seizures. J. Neurosci. 30, 11745–11761. doi: 10.1523/JNEUROSCI.1769-10.2010
Fiumelli, H., Cancedda, L., and Poo, M. M. (2005). Modulation of GABAergic transmission by activity via postsynaptic Ca2+-dependent regulation of KCC2 function. Neuron 48, 773–786. doi: 10.1016/j.neuron.2005.10.025
Ganguly, K., Schinder, A. F., Wong, S. T., and Poo, M. (2001). GABA itself promotes the developmental switch of neuronal GABAergic responses from excitation to inhibition. Cell 105, 521–532. doi: 10.1016/S0092-8674(01)00341-5
Gilbert, C. D., and Wiesel, T. N. (1983). Clustered intrinsic connections in cat visual cortex. J. Neurosci. 3, 1116–1133. doi: 10.1523/JNEUROSCI.03-05-01116.1983
González-Burgos, G., Barrionuevo, G., and Lewis, D. A. (2000). Horizontal synaptic connections in monkey prefrontal cortex: an in vitro electrophysiological study. Cereb. Cortex 10, 82–92. doi: 10.1093/cercor/10.1.82
Goodman, D. F., and Brette, R. (2008). Brian: a simulator for spiking neural networks in Python. Front. Neuroinform. 2:5. doi: 10.3389/neuro.11.005.2008
Goodman, D. F. M., and Brette, R. (2009). The brian simulator. Front. Neurosci. 3:2009. doi: 10.3389/neuro.01.026.2009
Grinvald, A., Lieke, E. E., Frostig, R. D., and Hildesheim, R. (1994). Cortical point-spread function and long-range lateral interactions revealed by real-time optical imaging of Macaque monkey primary visual cortex. J. Neurosci. 14, 2545–2568. doi: 10.1523/JNEUROSCI.14-05-02545.1994
Grüning, A., and Bohte, S. M. (2014). Spiking neural networks: principles and challenges. Elen. Ucl. Ac. Be 23–25. Available online at: http://www.i6doc.com/fr/livre/?GCOI=28001100432440
Guillet, R., and Kwon, J. (2007). Seizure recurrence and developmental disabilities after neonatal seizures: outcomes are unrelated to use of phenobarbital prophylaxis. J. Child Neurol. 22, 389–395. doi: 10.1177/0883073807301917
Hall, B. J., and Ghosh, A. (2008). Regulation of AMPA receptor recruitment at developing synapses. Trends Neurosci. 31, 82–89. doi: 10.1016/j.tins.2007.11.010
Hanse, E., Seth, H., and Riebe, I. (2013). AMPA-silent synapses in brain development and pathology. Nat. Rev. Neurosci. 14, 839–850. doi: 10.1038/nrn3642
Huberfeld, G., Wittner, L., Clemenceau, S., Baulac, M., Kaila, K., Miles, R., et al. (2007). Perturbed chloride homeostasis and GABAergic signaling in human temporal lobe epilepsy. J. Neurosci. 27, 9866–9873. doi: 10.1523/JNEUOSCI.2761-07.2007
Ito, D., Tamate, H., Nagayama, M., Uchida, T., Kudoh, S. N., and Gohara, K. (2010). Minimum neuron density for synchronized bursts in a rat cortical culture on multi-electrode arrays. Neuroscience 171, 50–61. doi: 10.1016/j.neuroscience.2010.08.038
Ji, B., Wang, X., Pinto-Duarte, A., Kim, M., Caldwell, S., Young, J. W., et al. (2013). Prolonged ketamine effects in Sp4 hypomorphic mice: mimicking phenotypes of schizophrenia. PLoS ONE 8:e66327. doi: 10.1371/journal.pone.0066327
Kato-Negishi, M., Muramoto, K., Kawahara, M., Kuroda, Y., and Ichikawa, M. (2004). Developmental changes of GABAergic synapses formed between primary cultured cortical neurons. Dev. Brain Res. 152, 99–108. doi: 10.1016/j.devbrainres.2004.05.013
Kessels, H. W., and Malinow, R. (2009). Synaptic AMPA receptor plasticity and behavior. Neuron 61, 340–350. doi: 10.1016/j.neuron.2009.01.015
Khalil, R., Moftah, M. Z., Landry, M., and Moustafa, A. A. (2017a). “Models of dynamical synapses and cortical development. Computational models of brain and behavior,” in Computational Models of Brain and Behavior, ed A. Moustafa (Sydney: Wiley-Blackwell), p. 321.
Khalil, R., Moftah, M. Z., and Moustafa, A. A. (2017b). The effects of dynamical synapses on firing rate activity: a spiking neural network model. Eur. J. Neurosci. 46, 2445–2470. doi: 10.1111/ejn.13712
Khalil, R., Tindle, R., Boraud, T., Moustafa, A., and Karim, A. A. (2018). Social decision making in autism: on the impact of mirror neurons, motor control and imitative behaviors. CNS Neurosci. Therap. 24, 669–676. doi: 10.1111/cns.13001
Kriener, B., Helias, M., Rotter, S., Diesmann, M., and Einevoll, G. T. (2013). How pattern formation in ring networks of excitatory and inhibitory spiking neurons depends on the input current regime. Front. Comput. Neurosci. 7:187. doi: 10.1186/1471-2202-14-S1-P123
Krippl, M., and Karim, A. A. (2009). “‘Theory of Mind' bei forensisch relevanten Störungen,” in Neurobiologie Forensisch-Relevanter Störungen, ed J. L. Müller (Stuttgart: Kohlhammer), 248–259.
Krippl, M., and Karim, A. A. (2011). “Theory of mind” and its neuronal correlates in forensically relevant disorders. Nervenarzt 82, 843–852. doi: 10.1007/s00115-010-3073-x
Larkum, M. E., Zhu, J. J., and Sakmann, B. (2001). Dendritic mechanisms underlying the coupling of the dendritic with the axonal action potential initiation zone of adult rat layer 5 pyramidal neurons. J. Physiol. 533(Pt 2), 447–466. doi: 10.1111/j.1469-7793.2001.0447a.x
Larsen, R. S., and Sjöström, P. J. (2015). Synapse-type-specific plasticity in local circuits. Curr. Opin. Neurobiol. 35, 127–135. doi: 10.1016/j.conb.2015.08.001
Lemonnier, E., and Ben-Ari, Y. (2010). The diuretic bumetanide decreases autistic behaviour in five infants treated during 3 months with no side effects. Acta Paediatr. 99, 1885–1888. doi: 10.1111/j.1651-2227.2010.01933.x
Loebel, A., and Tsodyks, M. (2002). Computation by ensemble synchronization in recurrent networks with synaptic depression. J. Comput. Neurosci. 13, 111–124. doi: 10.1023/A:1020110223441
Mazzuca, M., Minlebaev, M., Shakirzyanova, A., Tyzio, R., Taccola, G., Janackova, S., et al. (2011). Newborn analgesia mediated by oxytocin during delivery. Front. Cell. Neurosci. 5:3. doi: 10.3389/fncel.2011.00003
Nawrot, M. P., Boucsein, C., Rodriguez-Molina, V., Aertsen, A., Grün, S., and Rotter, S. (2007). Serial interval statistics of spontaneous activity in cortical neurons in vivo and in vitro. Neurocomputing 70, 1717–1722. doi: 10.1016/j.neucom.2006.10.101
Nordlie, E., Gewaltig, M. O., and Plesser, H. E. (2009). Towards reproducible descriptions of neuronal network models. PLoS Comput. Biol. 5:e1000456. doi: 10.1371/journal.pcbi.1000456
Pizzarelli, R., and Cherubini, E. (2011). Alterations of GABAergic signaling in autism spectrum disorders. Neural Plast. 2011:297153. doi: 10.1155/2011/297153
Plesser, H. E., and Diesmann, M. (2009). Simplicity and efficiency of integrate-and-fire neuron models. Neural Comput. 21, 353–359. doi: 10.1162/neco.2008.03-08-731
Reyes, A., and Sakmann, B. (1999). Developmental switch in the short-term modification of unitary EPSPs evoked in layer 2/3 and layer 5 pyramidal neurons of rat neocortex. J. Neurosci. 19, 3827–3835. doi: 10.1523/JNEUROSCI.19-10-03827.1999
Rheims, S., Minlebaev, M., Ivanov, A., Represa, A., Khazipov, R., Holmes, G. L., et al. (2008). Excitatory GABA in rodent developing neocortex in vitro. J. Neurophysiol. 100, 609–619. doi: 10.1152/jn.90402.2008
Santos, S. D., Carvalho, A. L., Caldeira, M. V., and Duarte, C. B. (2009). Regulation of AMPA receptors and synaptic plasticity. Neuroscience 158, 105–125. doi: 10.1016/j.neuroscience.2008.02.037
Song, S., and Abbott, L. F. (2001). Cortical development and remapping through spike timing-dependent plasticity. Neuron 32, 339–350. doi: 10.1016/S0896-6273(01)00451-2
Song, S., Miller, K. D., and Abbott, L. F. (2000). Competitive Hebbian learning through spike-timing-dependent synaptic plasticity. Nat. Neurosci. 3, 919–926. doi: 10.1038/78829
Sporns, O., Tononi, G., and Edelman, G. M. (2000). Theoretical neuroanatomy: relating anatomical and functional connectivity in graphs and cortical connection matrices. Cereb. Cortex 10, 127–141. doi: 10.1093/cercor/10.2.127
Stimberg, M., Goodman, D. F. M., Benichoux, V., and Brette, R. (2014). Equation-oriented specification of neural models for simulations. Front. Neuroinform. 8:6. doi: 10.3389/fninf.2014.00006
Tsodyks, M., Pawelzik, K., and Markram, H. (1998). Neural networks with dynamic synapses. Neural Comput. 10, 821–835. doi: 10.1162/089976698300017502
Tsodyks, M. V., and Markram, H. (1997). The neural code between neocortical pyramidal neurons depends on neurotransmitter release probability. Proc. Natl. Acad. Sci. U.S.A. 94, 719–723. doi: 10.1073/pnas.94.2.719
Tyzio, R., Cossart, R., Khalilov, I., Minlebaev, M., Hübner, C. A., Represa, A., et al. (2006). Maternal oxytocin triggers a transient inhibitory switch in GABA signaling in the fetal brain during delivery. Science 314, 1788–1792. doi: 10.1126/science.1133212
Vogels, T. P., Sprekeler, H., Zenke, F., Clopath, C., and Gerstner, W. (2011). Inhibitory plasticity balances excitation and inhibition in sensory pathways and memory networks. Science 334, 1569–1573. doi: 10.1126/science.1211095
Yger, P., El Boustani, S., Destexhe, A., and Frégnac, Y. (2011). Topologically invariant macroscopic statistics in balanced networks of conductance-based integrate-and-fire neurons. J. Comput. Neurosci. 31, 229–245. doi: 10.1007/s10827-010-0310-z
Keywords: firing rate activity, local connectivity, in vitro, dynamical synapses, GABAA signaling, cortical development, STD, STF
Citation: Khalil R, Karim AA, Khedr E, Moftah M and Moustafa AA (2018) Dynamic Communications Between GABAA Switch, Local Connectivity, and Synapses During Cortical Development: A Computational Study. Front. Cell. Neurosci. 12:468. doi: 10.3389/fncel.2018.00468
Received: 10 January 2018; Accepted: 16 November 2018;
Published: 17 December 2018.
Edited by:
Tommaso Pizzorusso, Italian National Research Council, ItalyReviewed by:
Marco Mainardi, Scuola Normale Superiore di Pisa, ItalyAbhishek Banerjee, Massachusetts Institute of Technology, United States
Copyright © 2018 Khalil, Karim, Khedr, Moftah and Moustafa. This is an open-access article distributed under the terms of the Creative Commons Attribution License (CC BY). The use, distribution or reproduction in other forums is permitted, provided the original author(s) and the copyright owner(s) are credited and that the original publication in this journal is cited, in accordance with accepted academic practice. No use, distribution or reproduction is permitted which does not comply with these terms.
*Correspondence: Radwa Khalil, cmFkd2FraGFsaWxAaG90bWFpbC5jb20=
Ahmed A. Karim, YWhtZWQua2FyaW1AdW5pLXR1ZWJpbmdlbi5kZQ==
Marie Moftah, bWFyaWUubW9mdGFoQGFsZXh1LmVkdS5lZw==