 Feng Feng1,2†
 Pan Wang1,3†
 Kun Zhao4,5
 Bo Zhou1Hongxiang Yao6Qingqing Meng1
 Lei Wang2Zengqiang Zhang1,7Yanhui Ding5Luning Wang1Ningyu An6
 Xi Zhang1*
 Yong Liu4,5,8,9,10*
- 1Department of Neurology, Nanlou Division, Chinese PLA General Hospital, National Clinical Research Center for Geriatric Diseases, Beijing, China
- 2Department of Neurology, The General Hospital of the PLA Rocket Force, Beijing, China
- 3Department of Neurology, Tianjin Huanhu Hospital, Tianjin, China
- 4Brainnetome Center, Institute of Automation, Chinese Academy of Sciences, Beijing, China
- 5School of Information Science and Engineering, Shandong Normal University, Jinan, China
- 6Department of Radiology, Chinese PLA General Hospital, Beijing, China
- 7Hainan Branch of Chinese PLA General Hospital, Sanya, China
- 8National Laboratory of Pattern Recognition, Institute of Automation, Chinese Academy of Sciences, Beijing, China
- 9CAS Center for Excellence in Brain Science and Intelligence Technology, Institute of Automation, Chinese Academy of Sciences, Beijing, China
- 10School of Artificial Intelligence, University of Chinese Academy of Sciences, Beijing, China
Alzheimer’s disease (AD) is characterized by progressive dementia, especially in episodic memory, and amnestic mild cognitive impairment (aMCI) is associated with a high risk of developing AD. Hippocampal atrophy/shape changes are believed to be the most robust magnetic resonance imaging (MRI) markers for AD and aMCI. Radiomics, a method of texture analysis, can quantitatively examine a large set of features and has previously been successfully applied to evaluate imaging biomarkers for AD. To test whether radiomic features in the hippocampus can be employed for early classification of AD and aMCI, 1692 features from the caudal and head parts of the bilateral hippocampus were extracted from 38 AD patients, 33 aMCI patients and 45 normal controls (NCs). One way analysis of variance (ANOVA) showed that 111 features exhibited statistically significant group differences (P < 0.01, Bonferroni corrected). Among these features, 98 were significantly correlated with Mini-Mental State Examination (MMSE) scores in AD and aMCI subjects (P < 0.01). The support vector machine (SVM) model demonstrated that radiomic features allowed us to distinguish AD from NC with an accuracy of 86.75% (specificity = 88.89% and sensitivity = 84.21%) and an area under curve (AUC) of 0.93. In conclusion, these findings provide evidence showing that radiomic features are beneficial in detecting early cognitive decline, and SVM classification analysis provides encouraging evidence for using hippocampal radiomic features as a potential biomarker for clinical applications in AD.
Introduction
As the leading cause of neurodegenerative dementia, Alzheimer’s disease (AD) is characterized by a progressive deterioration in cognitive function, especially in episodic memory. Due to its influence on the normal lives of both patients and caregivers, AD has become a considerable burden on society (Reitz and Mayeux, 2014; Alzheimer’s Association, 2017). Mild cognitive impairment (MCI) is generally defined as a transitional stage between the cognitive changes associated with normal aging and early dementia. Amnestic MCI (aMCI) means that while the memory ability of a patient has decreased, the patient does not fulfill the criteria for dementia, and aMCI is thought to be the prodromal stage of dementia due to AD and has a high risk of developing into AD (Petersen and Jack, 2009; Petersen, 2016).
Medial temporal atrophy is believed to be one of the magnetic resonance imaging (MRI) markers for progression to AD in a prodromal stage, and atrophy of the hippocampus, the most vulnerable structure in the medial temporal lobe, is one of its most robust markers (Ferreira et al., 2011; Yang et al., 2012; Ezzati et al., 2016). In the past decade, structural MRI has been widely used to quantify hippocampal atrophy for distinguishing MCI from AD (Pruessner et al., 2000; Shen et al., 2002; Apostolova et al., 2012). Evidence has also demonstrated that aMCI patients converting to AD show greater atrophy in the hippocampus than is found in those who do not convert to AD (Chételat et al., 2005; Apostolova et al., 2006; Leung et al., 2013). Beyond the decrease in volume, changes in the morphology of the hippocampus have also been found and may appear even earlier than atrophy in AD (Achterberg et al., 2014; Sørensen et al., 2016).
Radiomics, a morphological method for imaging analysis, can quantitatively examine a large set of texture features (Parmar et al., 2015) and is used in the classification of tumors and in predicting radiation therapy outcomes (Huynh et al., 2016). The implications of “texture” include many image properties, such as coarseness, rugosity, and smoothness. Recently, texture analysis has been successfully applied to produce imaging biomarkers for AD (de Oliveira et al., 2011; Anandh et al., 2015; Chincarini et al., 2015). For example, studies have shown that hippocampal texture abnormalities appear in MCI/AD, indicating that texture may serve as a prognostic neuroimaging biomarker for early cognitive impairment (Sørensen et al., 2016, 2017).
Hippocampal head (anterior) atrophy is the most obvious in AD (Raji et al., 2009) and has been reported as a predictive marker of conversion to AD (Costafreda et al., 2011). Convergence evidence has also demonstrated the existence of functional differences along the anterior-posterior axis of the hippocampus (Strange et al., 2014; Collin et al., 2015). The anterior-posterior discrepancies in the hippocampus have also been associated with neuropsychiatric symptoms in early AD (Lyketsos et al., 2011). Given that the posterior and anterior parts of the hippocampal are differentially vulnerable to neuropathology in AD (La Joie et al., 2014; Delli Pizzi et al., 2016; Zeidman and Maguire, 2016), evaluating imaging measurements in different subfields would provide more accurate and sensitive information for the early detection of AD (La Joie et al., 2013; Blanken et al., 2017; Mak et al., 2017). Thus, hippocampal morphological differentiation along the posterior-anterior axis of the hippocampus deserves more attention because they are relevant for the early diagnosis of AD.
Inspired by the above studies, we hypothesized that radiomic features in the hippocampus would be disrupted and that these changes might be employed in the early classification of AD and aMCI. To test this hypothesis, radiomic features that were used in previous studies (Aerts et al., 2014; Parmar et al., 2015) were calculated from hippocampal subregions based on the Brainnetome Atlas (Fan et al., 2016) from a structural MRI data of 38 AD patients, 33 aMCI patients and 45 normal controls (NCs). One-way ANOVA was then used to identify changes in the radiomic features among AD, aMCI and NC subjects. Then, correlation analyses between the identified radiomic features and Mini-Mental State Examination (MMSE) scores were calculated to evaluate the relationships between hippocampal textures and cognitive ability. In addition to these case-control comparisons, we employed the support vector machine (SVM) model to evaluate the diagnostic power of radiomic features (Figure 1).
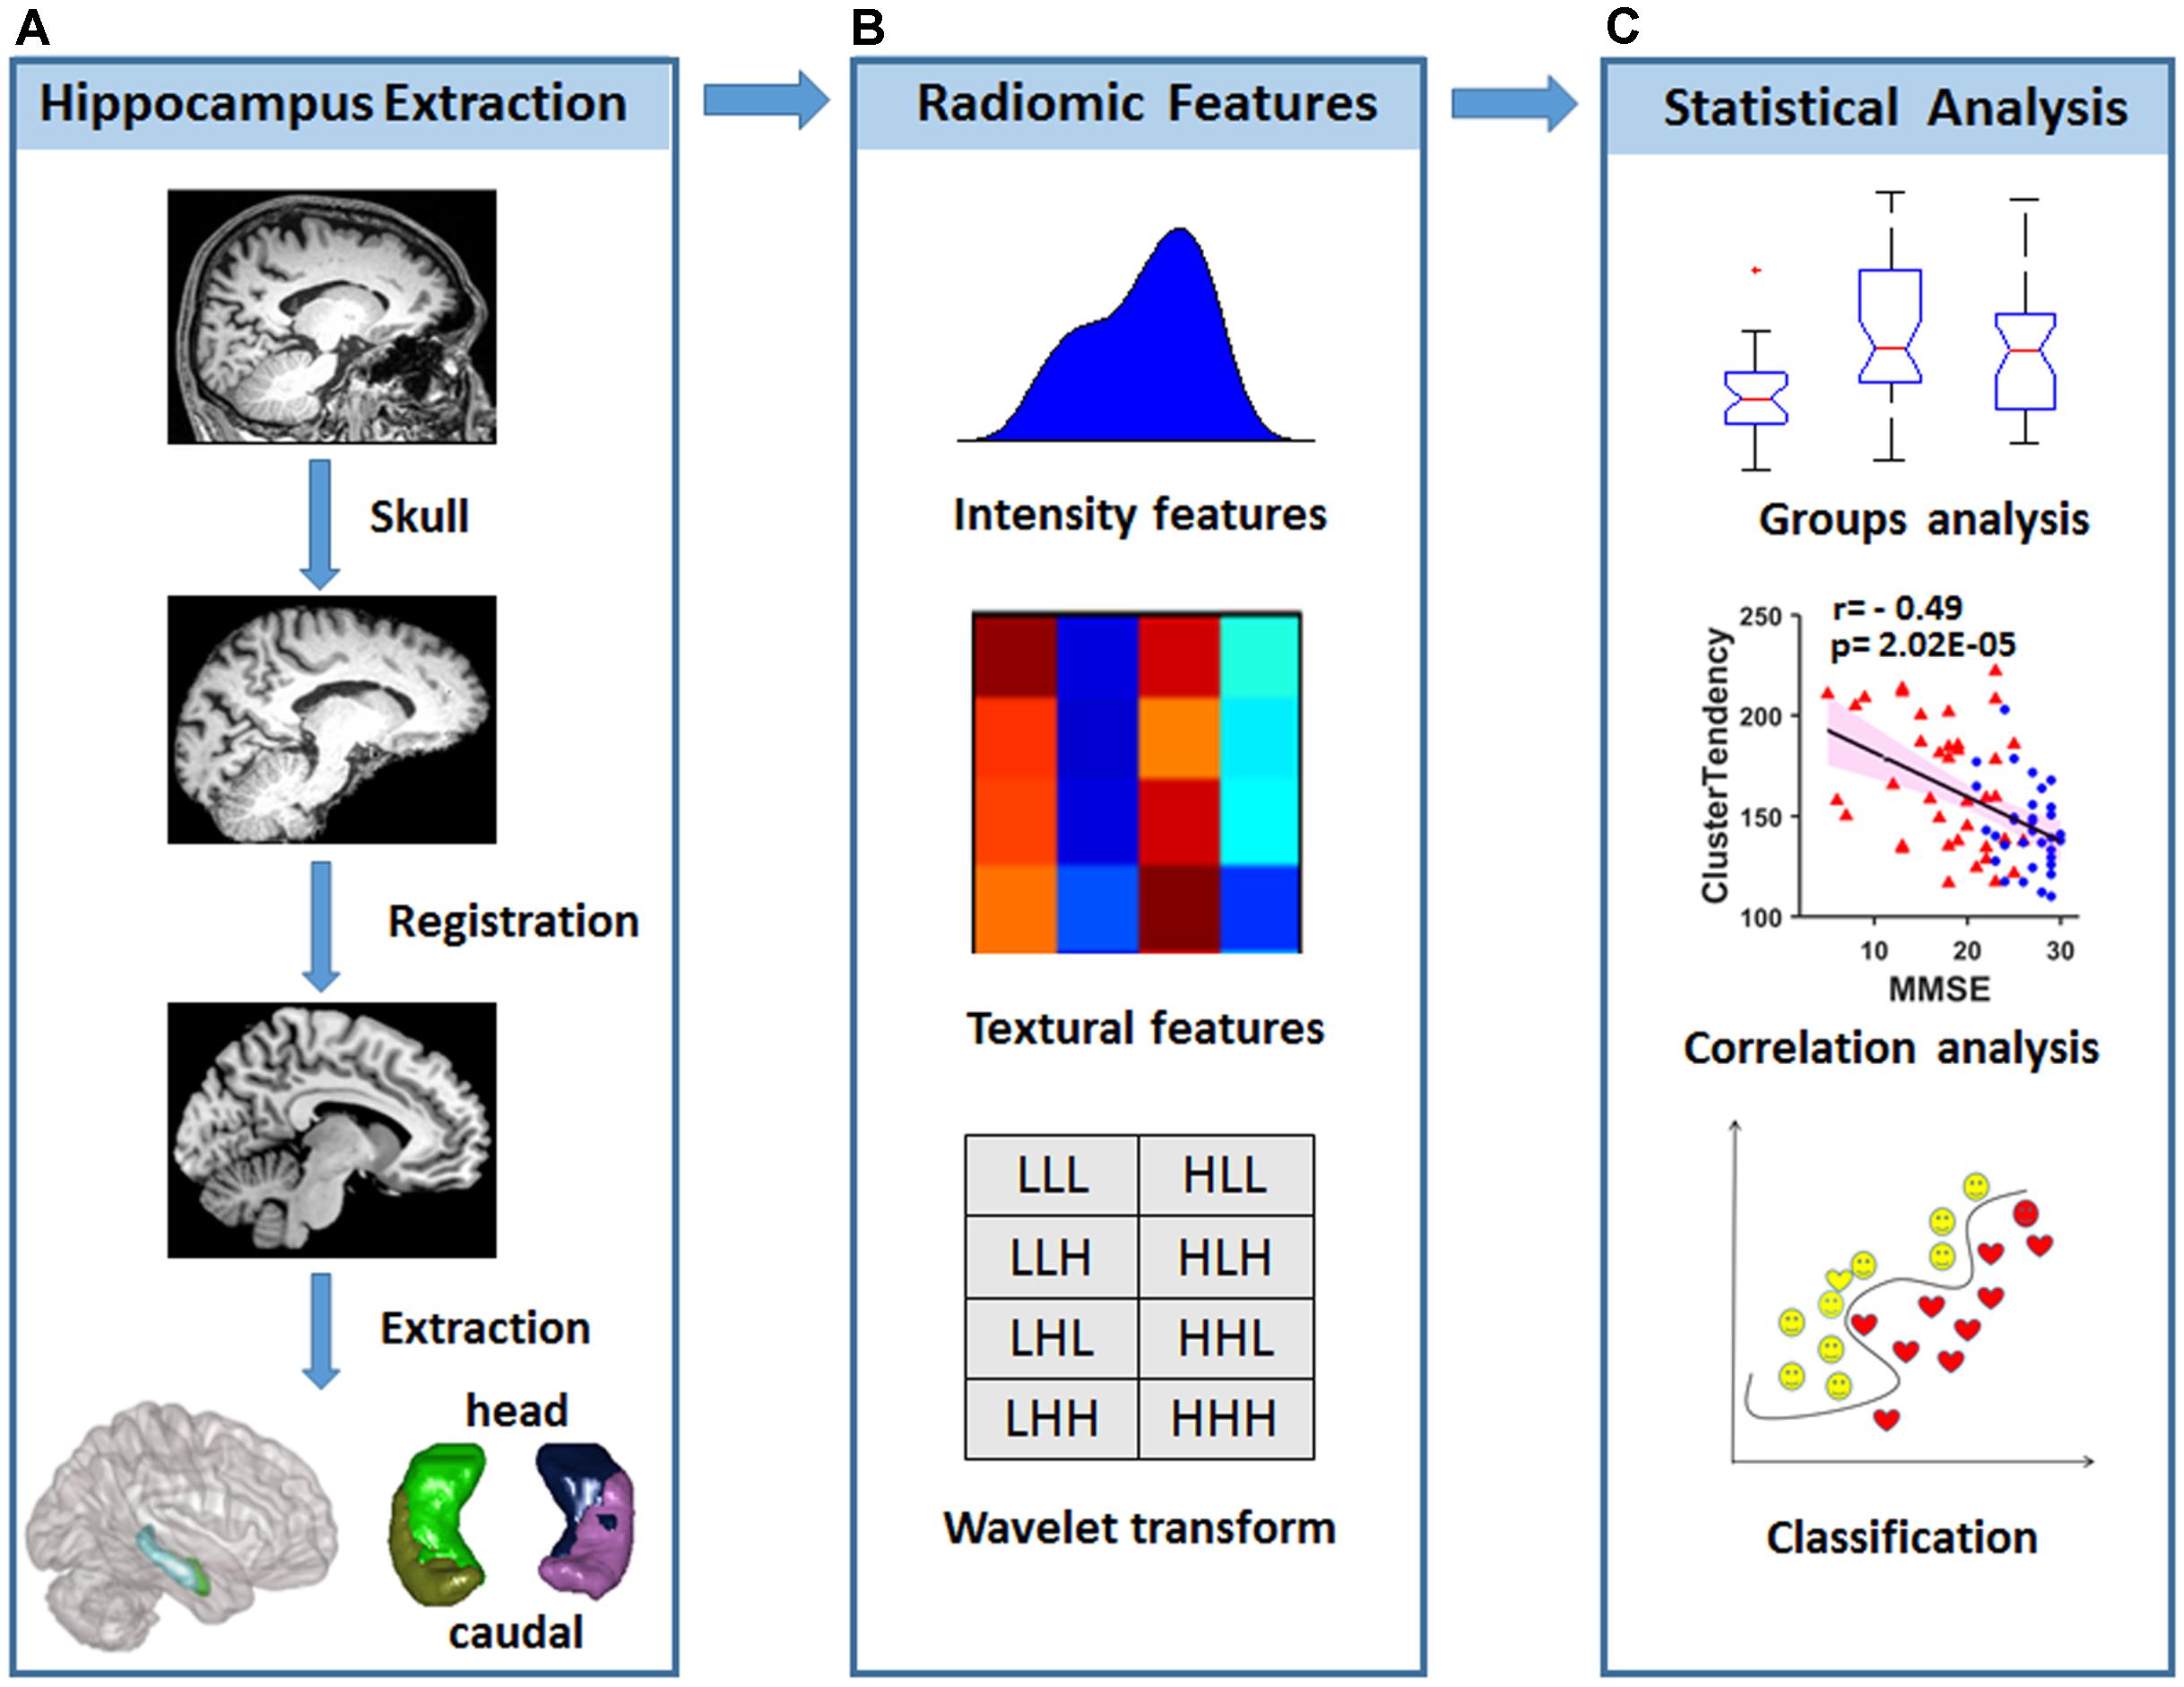
FIGURE 1. Diagram of data processing and statistical analyses. (A) Strategy for hippocampal subregion extraction from high-resolution structural MRI. (B) Intensity features and textural features were extracted from the images, and wavelet transformation was achieved in each hippocampal subregion. (C) Statistical analysis was used to find radiomic features that were different among the groups, and correlations with the MMSE were performed to evaluate the relationship between radiomic features and cognitive performance. A classification analysis was performed to determine whether radiomic features could be used for diagnosis.
Materials and Methods
Ethics Statement, Subject Recruitment, and Neuropsychological Assessment
This study was approved by the Medical Ethics Committee of the Chinese PLA General Hospital. All subjects or their legal guardians (a family member) signed written informed consent forms. All subjects met identical methodological stringency criteria, and comprehensive clinical details can be found elsewhere in our previous studies (Zhang Z. et al., 2012, 2014; Yao et al., 2013; Zhou et al., 2013; Wang et al., 2015). To maintain the scientific integrity of the present study, herein we provide a brief introduction regarding the data inclusion and exclusion criteria, acquisition and processing.
The recruited AD patients fulfilled the NINCDS-ADRDA (National Institute of Neurological and Communicative Disorders and Stroke and the AD and Related Disorders Association) criteria for the diagnosis of probable AD (McKhann et al., 1984). The aMCI patients were required to conform to the criteria described by Petersen (Petersen, 2004). The AD and aMCI patients also met the core clinical criteria of the new diagnostic criteria for probable AD and aMCI due to AD (Albert et al., 2011; McKhann et al., 2011). The NCs included subjects lacking memory decline but matching with AD and aMCI patients in gender and age. All of the participants were 55 to 85 years old and were neurological inpatients and outpatients of the Chinese PLA General Hospital. Clinical, physical and neuropsychological assessments were performed before MRI examination. Subjects with neurological or psychiatric diseases or with a history of cerebrovascular attacks or other degenerative disorders were excluded.
All subjects underwent a battery of neuropsychological tests at the department of neurology of the Chinese PLA General Hospital. These tests included the MMSE, Clinical Dementia Rating, Auditory Verbal Learning Test (AVLT), Geriatric Depression Scale and Activities of Daily Living scale.
Structural MRI Data Acquisition
Discovery Data
Magnetic resonance imaging examinations were performed at the department of radiology of the Chinese PLA General Hospital using a 3.0 T Siemens MR system (Skyra, Siemens, Germany) with a 20-channel head coil. During the examinations, the subjects were given comfortable foam padding to minimize head motion and ear plugs to reduce the scanner noise. Before the structural MRI data were collected, T2-weighted images were collected and evaluated by two senior radiologists. Sagittal T1-weighted structural images (192 continuous slices) were acquired for each subject using a magnetization-prepared rapid gradient echo sequence with the following scan parameters: repetition time (TR) = 2,530 ms, echo time (TE) = 3.43 ms, inversion time (TI) = 1100 ms, field of view (FOV) = 256 mm × 256 mm, acquisition matrix = 256 × 256, flip angle (FA) = 7°, and slice thickness = 1 mm. The obtained three-dimensional images had a resolution of 1 mm × 1 mm × 1 mm.
Replicated Data
Magnetic resonance imaging examinations were further performed in the same department of radiology using another 3.0 T Siemens MR system (Skyra, Siemens, Germany) for other subjects, including AD and aMCI patients and NCs. The protocol and parameters used in the MRI examinations were all consistent with those used in the discovery data.
Hippocampal Radiomic Feature Extraction
All preprocessing steps were performed using statistical parametric mapping (SPM12)1 and the Brainnetome fMRI Toolkit2 (Xu et al., 2018). Briefly, each individual T1-weighted DICOM image of the brain was first converted to NIFTI data. Next, skull stripping was performed, and the obtained images were normalized to the Montreal Neurological Institute (MNI) standard T1 template (standard space 181 × 217 × 181 with a resolution of 1 mm × 1 mm × 1 mm). Meanwhile, we resliced the Brainnetome Atlas3 to the standard MNI space with a resolution of 1 mm × 1 mm × 1 mm, and the caudal and head regions of the bilateral hippocampus were further extracted as masks. Lastly, for each subject, we obtained the subregions by point multiplication of the masks and the normalized T1 images.
Quantitative radiomic features were calculated using in-house MATLAB script as previously reported (Aerts et al., 2014; Huynh et al., 2016), and detailed descriptions of each feature are listed in the supplemental information to maintain the scientific integrity of the present study. Briefly, the intensity features were calculated based on the histogram, which represented the distribution of voxel intensities within the images (14 features), the textural features on the gray level co-occurrence matrix (GLCM) and the gray level run-length matrix (GLRLM) (33 features). Wavelet transformation (Symlet wavelet filter, “sym4” were used here) in eight directions (LLL, LLH, LHL, LHH, HLL, HLH, HHL, and HHH) was performed for the four hippocampal subregions to combine the spatial and frequency characteristics (for more detailed information, please refer to the Supplementary Material). As a result, 423 radiomic features were obtained for each hippocampal subregion, resulting in the inclusion of a total of 1692 (423 × 4) features for further analyses (Figure 1).
Statistical Analysis
Radiomic features were adjusted using the linear regression method to control the age and gender effects and were then statistically tested to determine the number of indices with significant differences among groups and to perform the further correlation analysis.
One-way ANOVA was employed to evaluate the differences between the AD, aMCI and NC groups at each subregion. Hence, 423 × 4-fold comparisons were performed, and we then used the Bonferroni correction to control type 1 error with P < 0.01/(N = 423 × 4). A post hoc analysis was performed to verify the differences between any two groups.
To assess the association between radiomic texture and cognitive ability, Spearman’s correlation coefficient was calculated to evaluate the relationships between the identified features and MMSE (P < 0.01). In addition, a detailed map was provided of the correlations between these features and the AVLT scores in immediate recall, delayed recall, recognition of primary and new words (P < 0.05). To evaluate the replication of the results related to radiomic features that showed significant differences and their correlations with MMSE, another dataset was further analyzed using the same statistical methods.
Classification Analysis
To assess the multivariate performance of radiomic features, a classification model was established based on the SVM. A nonlinear SVM with a radial basis function (RBF) kernel was employed in LIBSVM.4 The performance of the classifier was evaluated by the leave-one-out cross-validation (LOOCV) method, which has been widely used as a reliable estimating approach of true generalization performance. In the present study, the following univariate feature-ranking approach based on t-test was performed, as described in previous studies (Kamkar et al., 2015; Beheshti et al., 2016):
where μck σ2ck and nck (k = 1,2) are the mean, variance, and number of samples, respectively, in the two classes (c1 and c2: AD and NC). Each feature was normalized before the rank analysis was performed with the following method:
These features were ranked by the t-test, with a high value indicating large discrimination performance in the training dataset. To avoid over-filtering, only up to 200 features were selected for analysis.
In this model, there were two LOOCV procedures for grid search (Beheshti et al., 2016). In the inner and outer loop, there were both training data and testing data. First, the feature rankings with t-tests were employed in the inner loop’s training data; the parameters c (regularization) and g (control the kernel width) obtained by LOOCV and grid search were also used. Then, the feature rankings with t-tests were further employed in the outer loop’s training data. Lastly, the parameters c and g obtained from the inner loop’s training data were used in the testing data to access the classification performance.
Input: radiomic features
for i ← 1 to N (the number of data)
do: testing data = data (i)
training data = data (N| i)
Ranking features with t-test among training data
for j ← 1 to N-1
do: LOOCV with different c and g.
Compute the accuracy for each c and g.
Choose the best c and g.
Compute the accuracy for classification.
Output: the best classification results
The classification performance was evaluated by means of accuracy (ACC), sensitivity (SEN), and specificity (SPE). The diagnostic capabilities of the radiomic features were evaluated using receiver operating characteristic (ROC) curves with the corresponding area under the ROC curve (AUC). Finally, to assess the clinical relevance of this radiomic-based classification, we investigated correlations between the classifier output and cognitive ability scores (MMSE) in individual subjects.
Data Sharing
The patients’ hippocampus nii image files, the texture features and the codes are available online at https://github.com/yongliulab.
Results
Demographic Characteristics and Neuropsychological Assessment of Groups
In the present study, 116 subjects (38 AD patients, 33 aMCI patients and 45 NCs) were included in the discovery data. Mean age and gender ratio had no significant differences (P > 0.05). The MMSE score was remarkably and significantly different (P < 0.001), with AD patients having the lowest scores and subjects in the NC group having the highest scores. For the scores on the AVLT in immediate recall, delayed recall, and recognition of primary words and new words, the same sequence was observed among AD, aMCI and NC subjects (P < 0.001) (Table 1). The replicated dataset, which included 42 AD patients, 37 aMCI patients and 43 age- and gender-matched NCs, was used for a replication analysis of the identified feature changes (Supplementary Table S1).
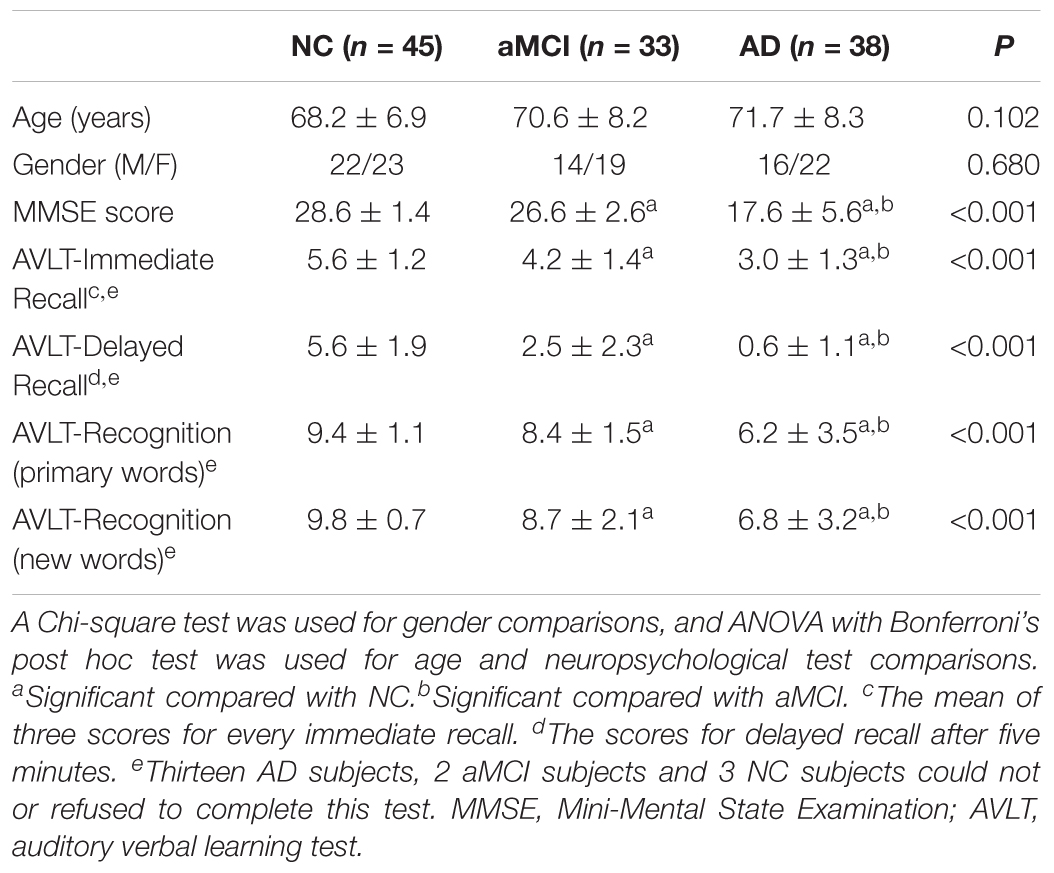
TABLE 1. Demographic, clinical and neuropsychological discovery data for AD, aMCI, and NC subjects.
Radiomic Features in AD, aMCI and NC Subjects
As a whole, 111 features showed significant differences (P < 0.01, Bonferroni corrected with N = 423 × 4) among the three groups. Of these, 39 parameters were altered in more than one subregion (Figure 2A). The post hoc analysis further demonstrated that differences were more significant when comparing the AD and NC groups than that when comparing the AD and aMCI groups or the aMCI and NC groups (Figure 2A). Considering the category of these features, 8 of the 39 parameters belonged to the intensity features, 13 were textural features of the GLCM, 6 were from the GLRLM (Table 2). As shown in Figure 2A, most of the 39 parameters were found in the left caudal, left head and right caudal regions of the hippocampus, whereas a small number of parameters were found in the right head region of the hippocampus. The features that indicated the most significant alterations among groups included kurtosis (-lg(P) = 12.97), Energy-LLL (-lg(P) = 12.60) and Entropy-LLL (-lg(P) = 12.54) in the right caudal part and Sum Entropy (-lg(P) = 12.57) in the left head part (Figure 2A). The same 39 parameters were evaluated in the replication dataset, in which they showed similar but weaker alterations (Figure 2B). Note that the most significant changes were identified in the caudal part of right hippocampus in the AD group in both datasets (Figure 2).
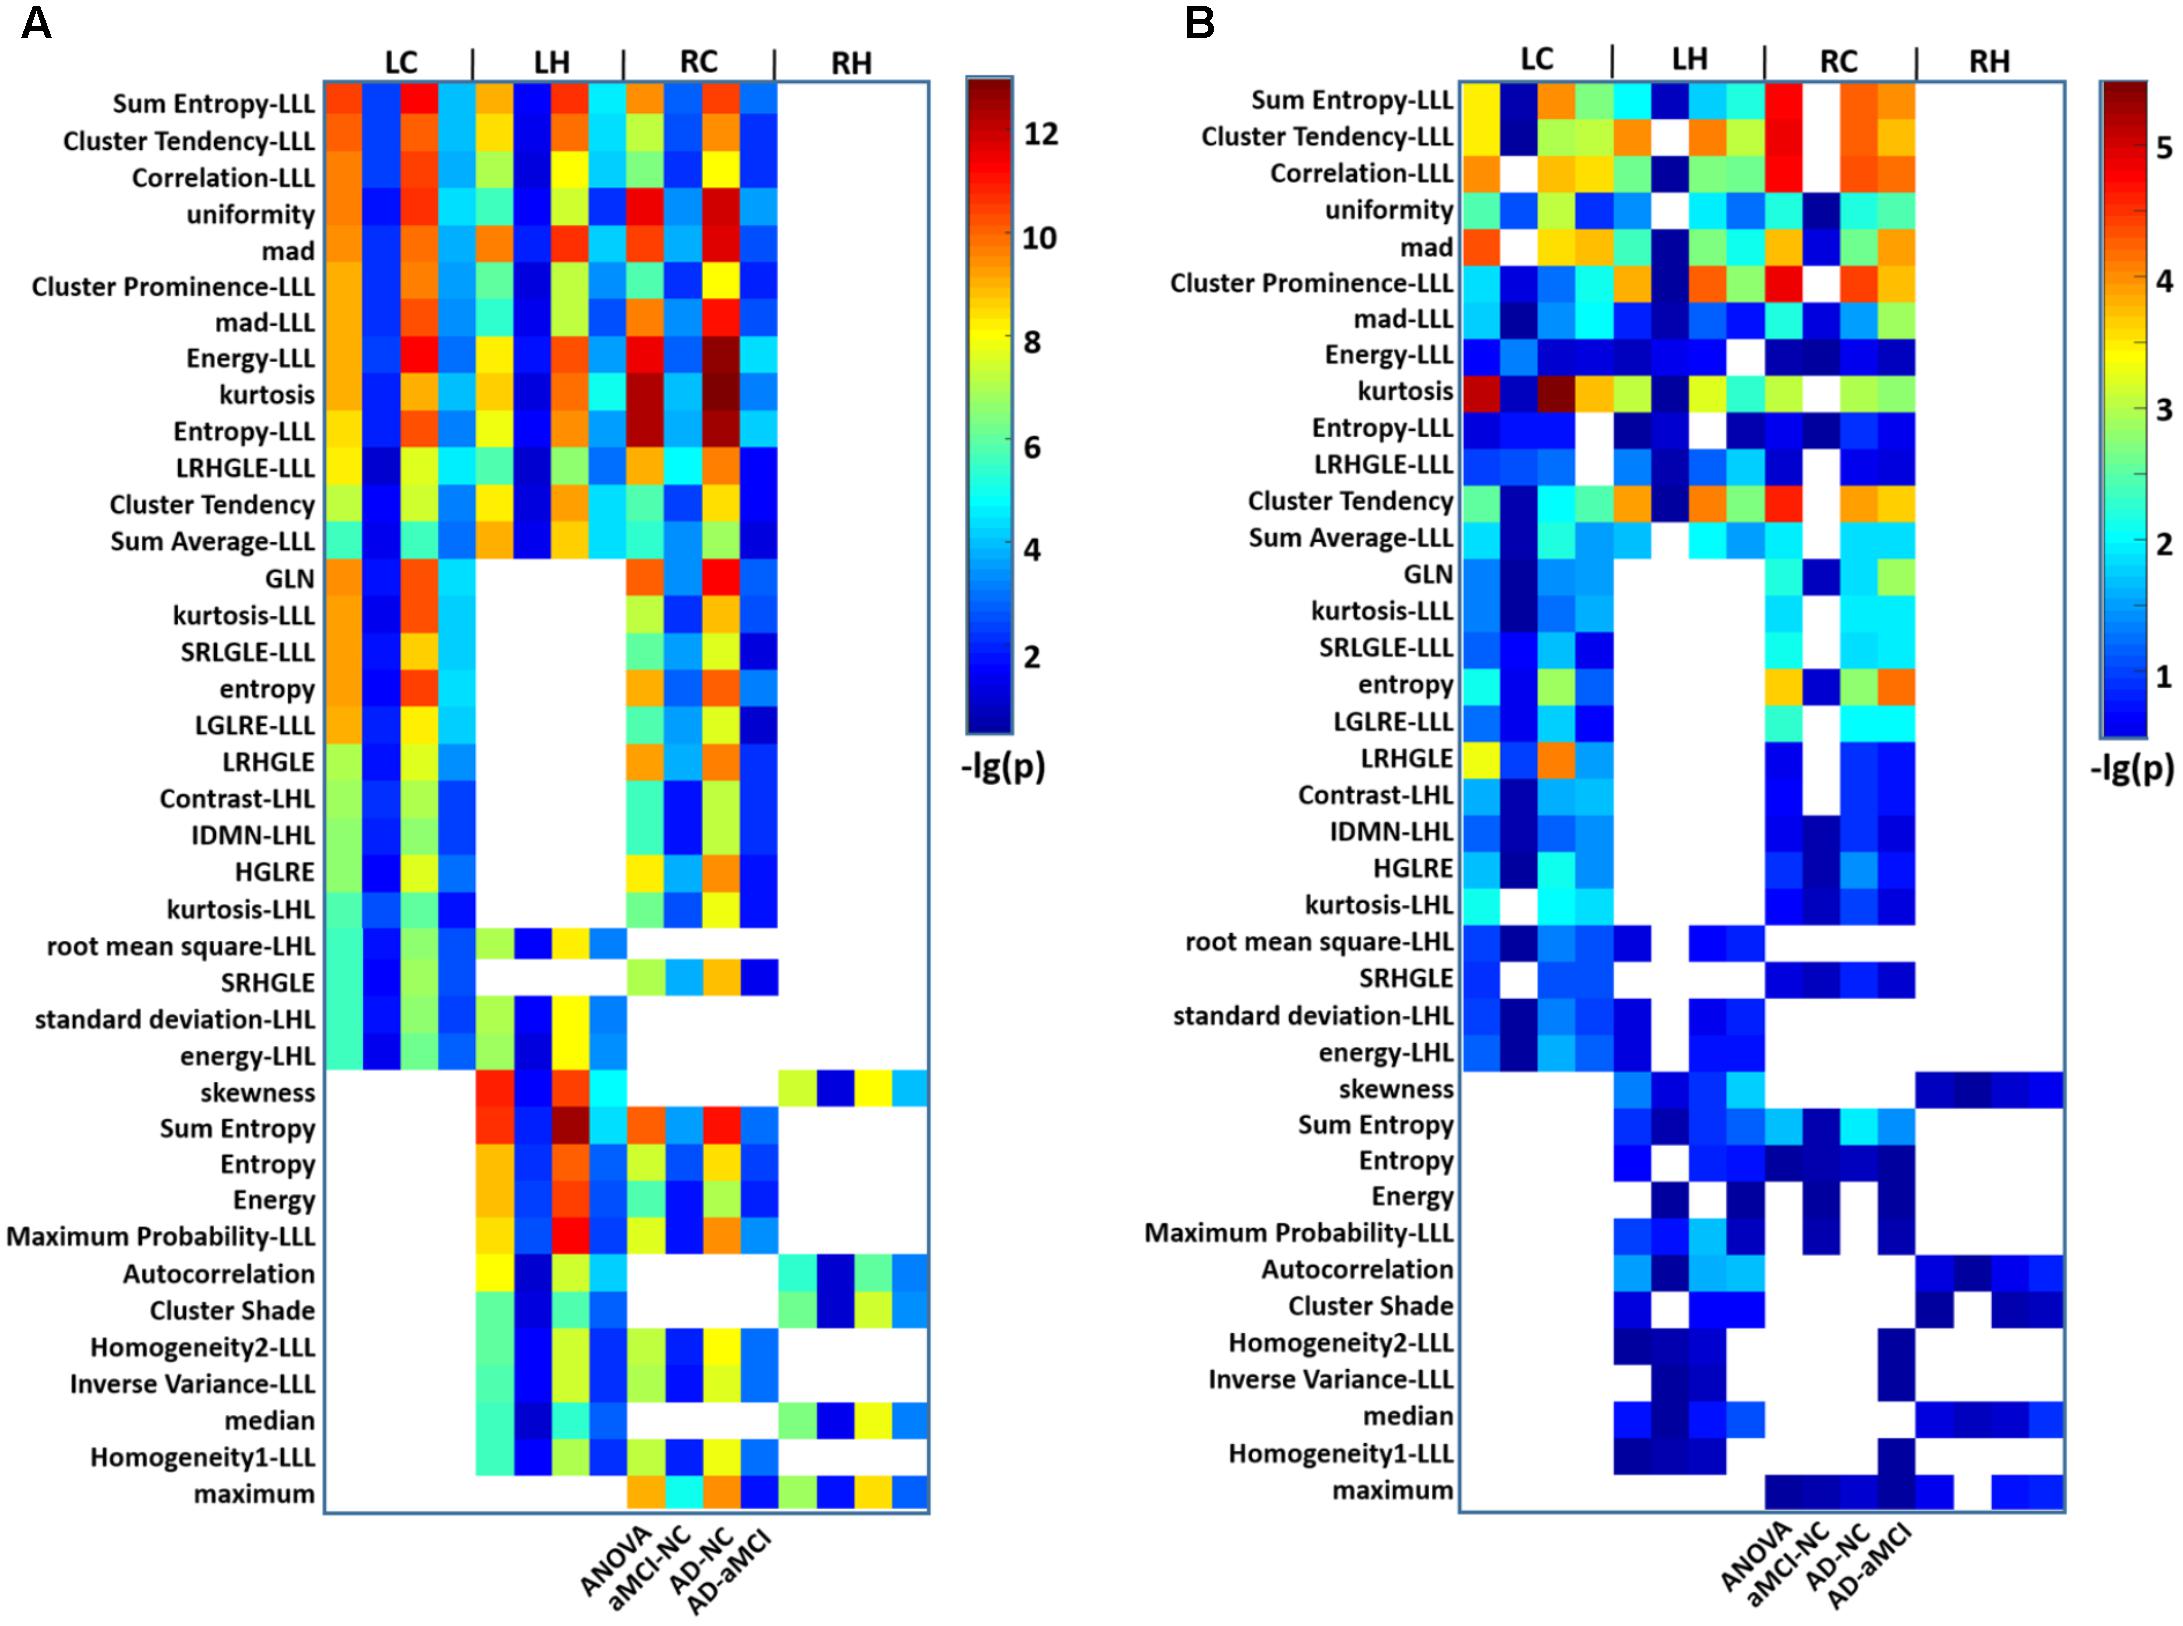
FIGURE 2. Heat maps of radiomic features that were significantly different among groups in more than one hippocampal subregion in AD and aMCI subjects. (A) A total of 39 radiomic features showed significant differences among groups in more than one hippocampal subregion. Thirteen features were identified in the LC, LH, and RC subregions at the same time. For each feature observed in four subregions, there were four grids (P-values for ANOVA and P-values for the t-tests between aMCI and NC, AD and NC, and AD and aMCI). The color bar represents the –lg(P) values, a blank grid indicates there was no significant alteration in the related radiomic feature between AD and aMCI or AD and NC subjects (P < 0.01, Bonferroni corrected). (B) The replication results of another dataset were analyzed using the same procedure. LC, Left caudal; LH, Left head; RC, Right caudal; RH, Right head; mad, mean absolute deviation; LRHGLE, Long run, high gray level emphasis; GLN, Gray level non-uniformity; SRLGLE, Short run, low gray level emphasis; LGLRE, Low gray level run emphasis; IDMN, Inverse difference moment normalized; HGLRE, High gray level run emphasis; SRHGLE, Short run, high gray level emphasis.
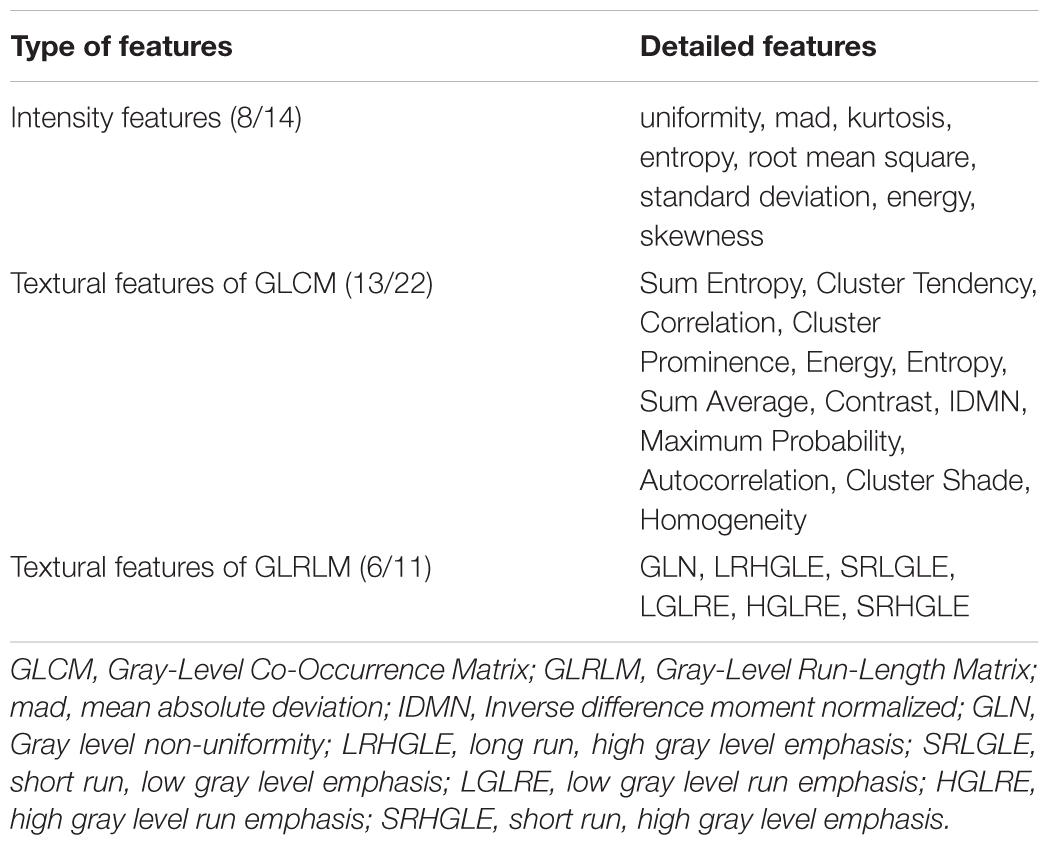
TABLE 2. Summary of radiomic features with significant differences in hippocampal subregions.
Correlations Between Radiomic Features and MMSE Scores
A total of 98 among the 111 identified features were significantly correlated with MMSE scores in AD and aMCI subjects (P < 0.01). Among these, 34 parameters in the bilateral subregions of the hippocampus were significantly correlated in two or three subregions (Figure 3A and Table 3). The other 64 features in one subregion are shown in Supplementary Figure S2. To construct a sketch map of these correlations, four typical features were selected for illustration in scatter diagrams (Figure 3B). Importantly, the same 34 parameters were significantly correlated with MMSE in more than one subregion in the replication dataset (P < 0.05, uncorrected) (Supplementary Figure S3B). For the bilateral caudal and left head subregions, approximately 50 parameters were significantly correlated with AVLT scores in more than one subregion, while 4 textural features were significantly correlated with AVLT scores in the right head region (Supplementary Figure S4).
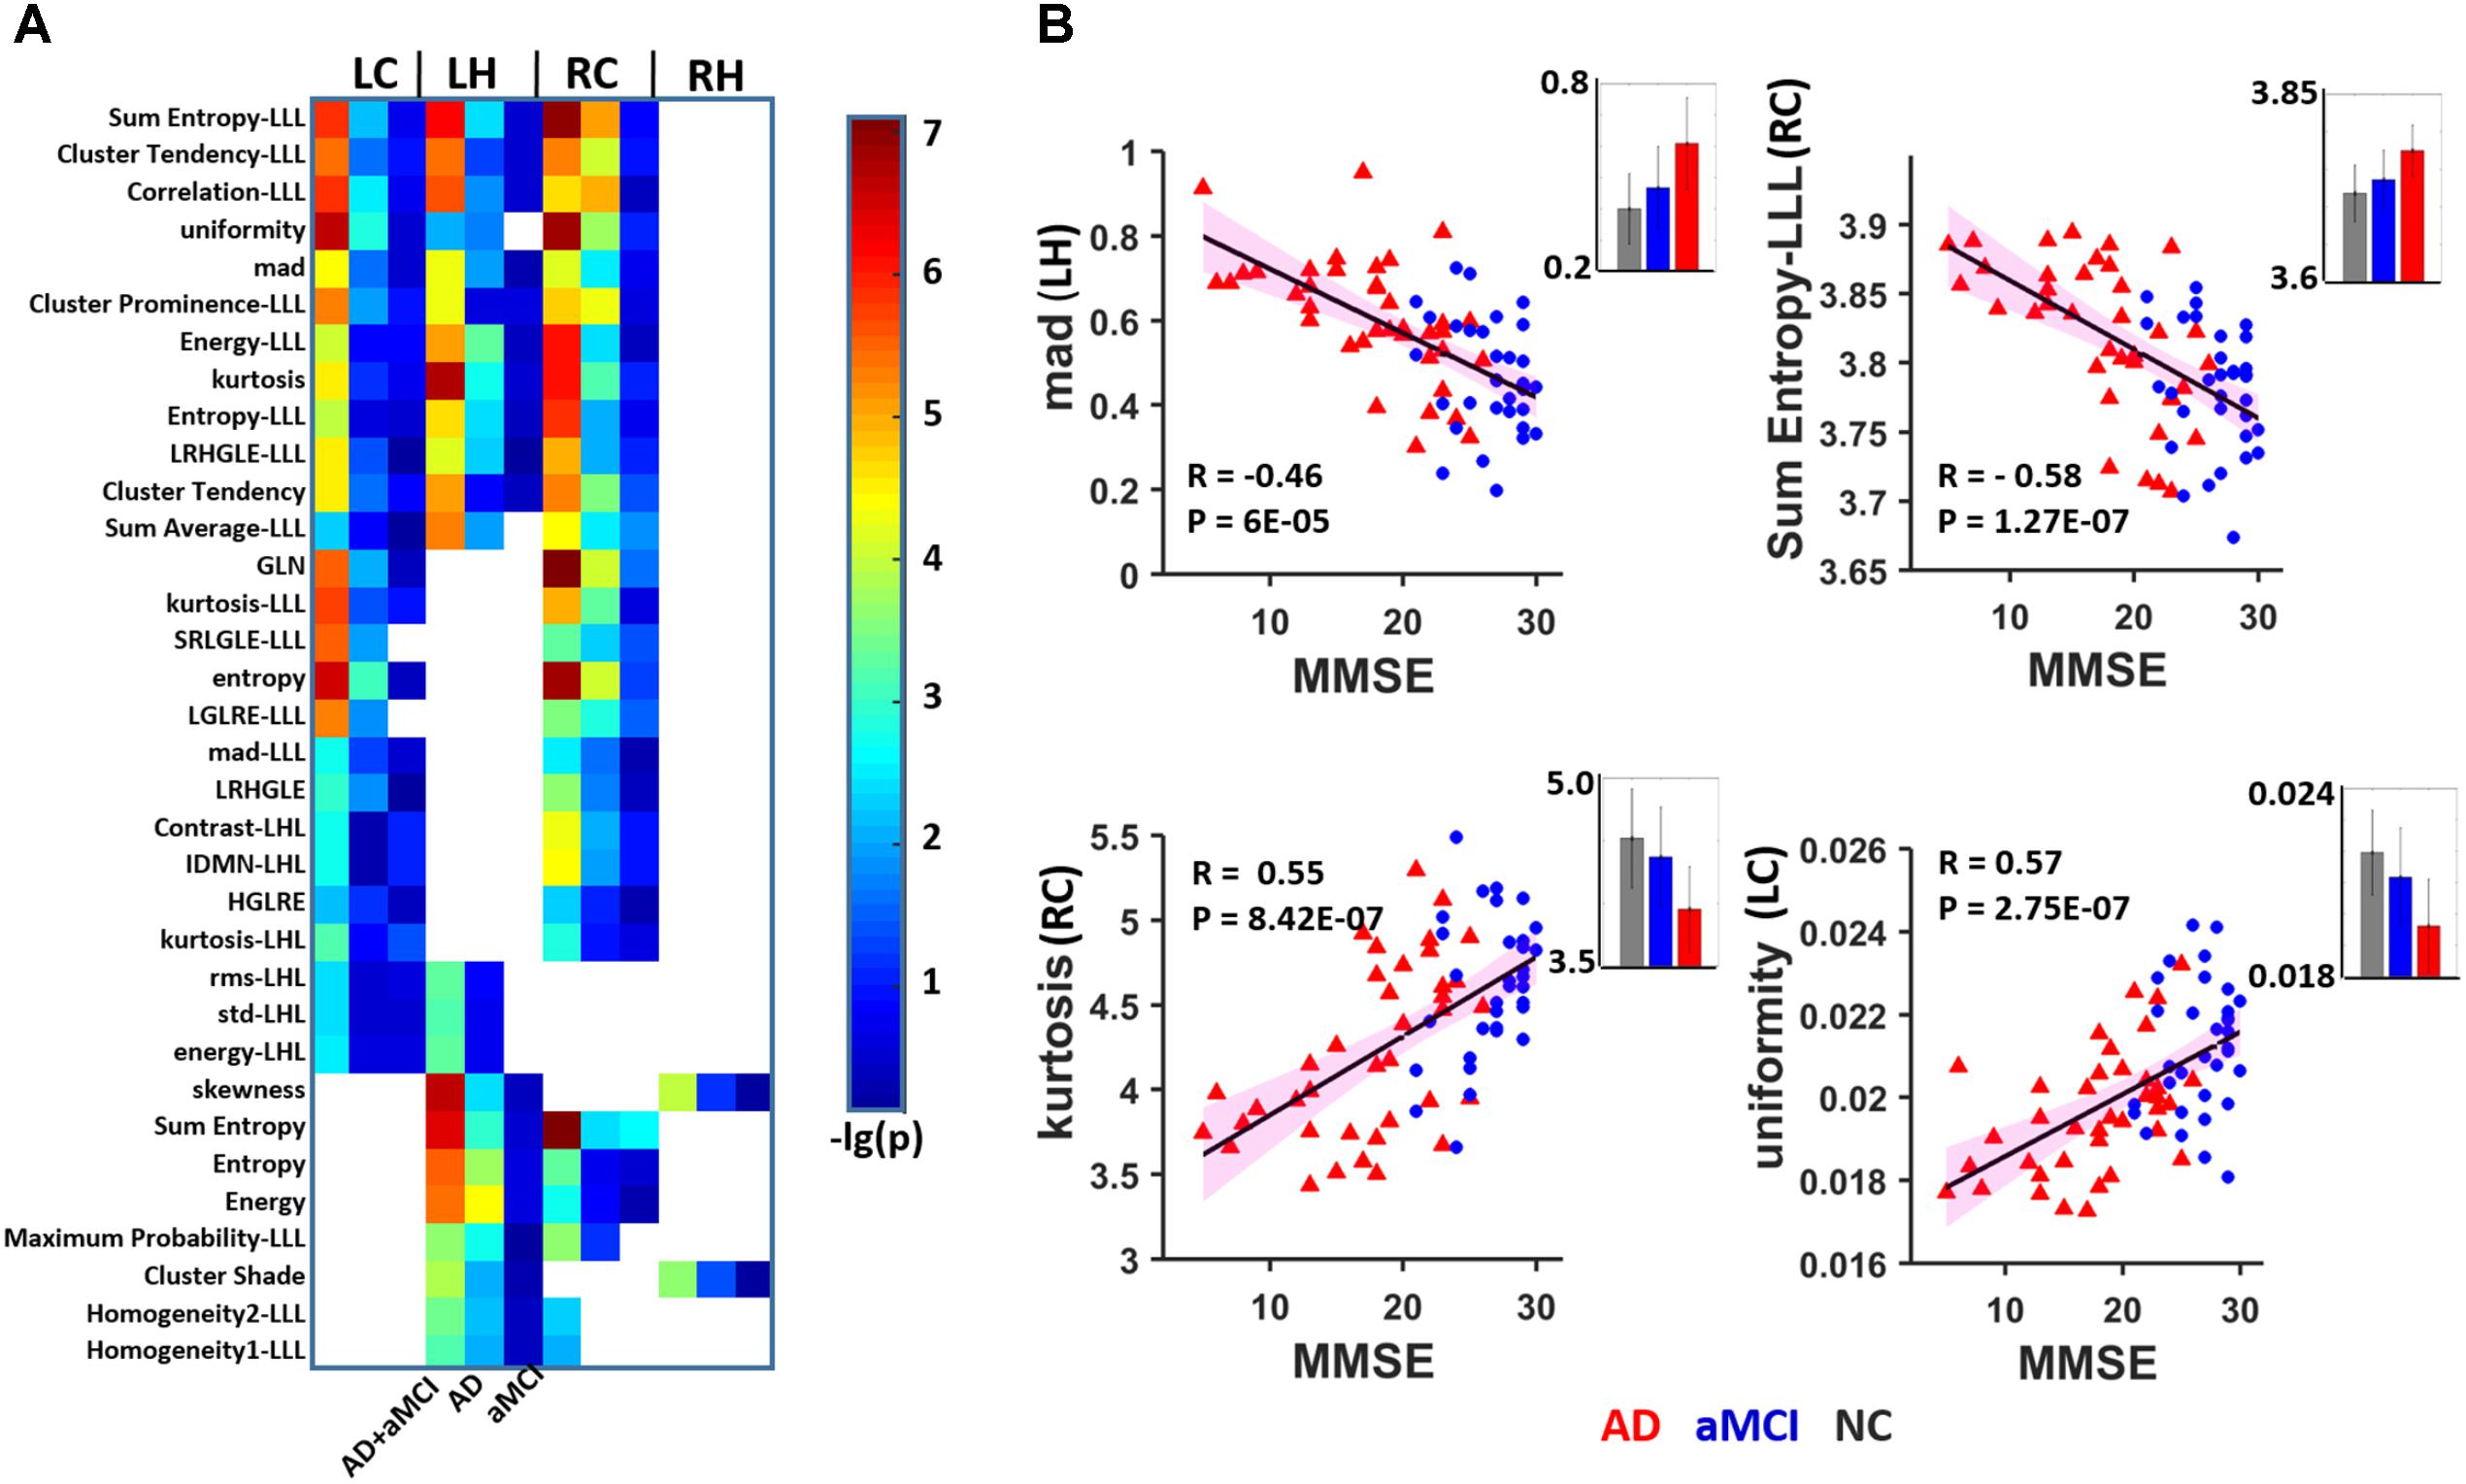
FIGURE 3. Heat map of radiomic features correlating with MMSE in more than one hippocampal subregion. (A) A total of 16 features were significantly correlated with the MMSE in two or three subregions (P < 0.01, Bonferroni corrected). The color bar represents the –lg(P) values, a blank grid indicates there was no significant correlation between the related radiomic features and MMSE scores between AD and aMCI. (B) Four typical features were selected for illustration in scatter diagrams. The corresponding mean values are provided (gray: NC, blue: aMCI; red: AD). LC, Left caudal; LH, Left head; RC, Right caudal; mad, mean absolute deviation; LRHGLE, Long run, high gray level emphasis; GLN, Gray level non-uniformity; SRLGLE, Short run, low gray level emphasis; LGLRE, Low gray level run emphasis; IDMN, Inverse difference moment normalized; HGLRE, High gray level run emphasis.
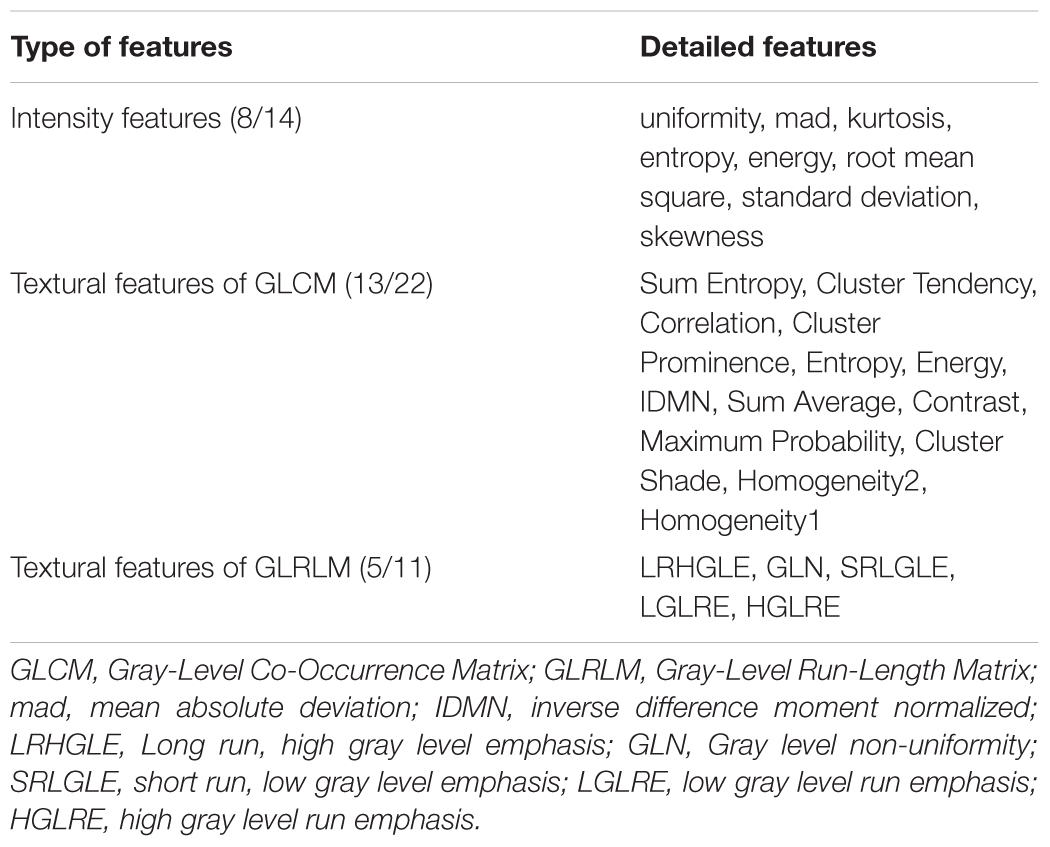
TABLE 3. Summary of radiomic features correlated with MMSE scores in hippocampal subregions.
Classification Performance
We introduced the SVM model to determine whether these textures were good features for classification analysis in the discovery data (N = 116, 38 AD patients, 33 aMCI patients and 45 NCs). To avoid over-filtering, up to 200 top features based on t-test rankings were selected for classification analysis. After training steps, we obtained the maximum classification accuracy with 163 features. Table 4 presents the classifier performance results obtained using LOOCV for SVM classifiers in terms of ACC, SEN, SPE, and AUC. The accuracy of the feature vectors with 163 features for SVM classifiers was 86.75% (SPE = 88.89%, SEN = 84.21%, and AUC = 0.93) for distinguishing AD from NC. This rate was reduced by approximately 10% for all performance indicators (ACC, SEN, SPE, and AUC) when using the same features to distinguish aMCI from NC or AD from aMCI (Figure 4). In addition, we found that the distance from the hyperplane was highly correlated with MMSE scores in the AD plus NC (r = 0.70, P < 0.001) and AD (r = 0.38, P = 0.020) groups designated by the classification analysis (Figure 4B).
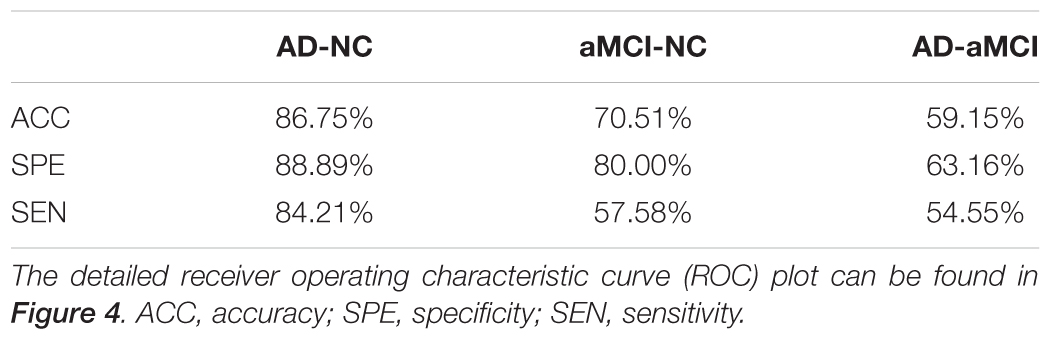
TABLE 4. Classification performance by the classification features (feature number = 163) between two groups.
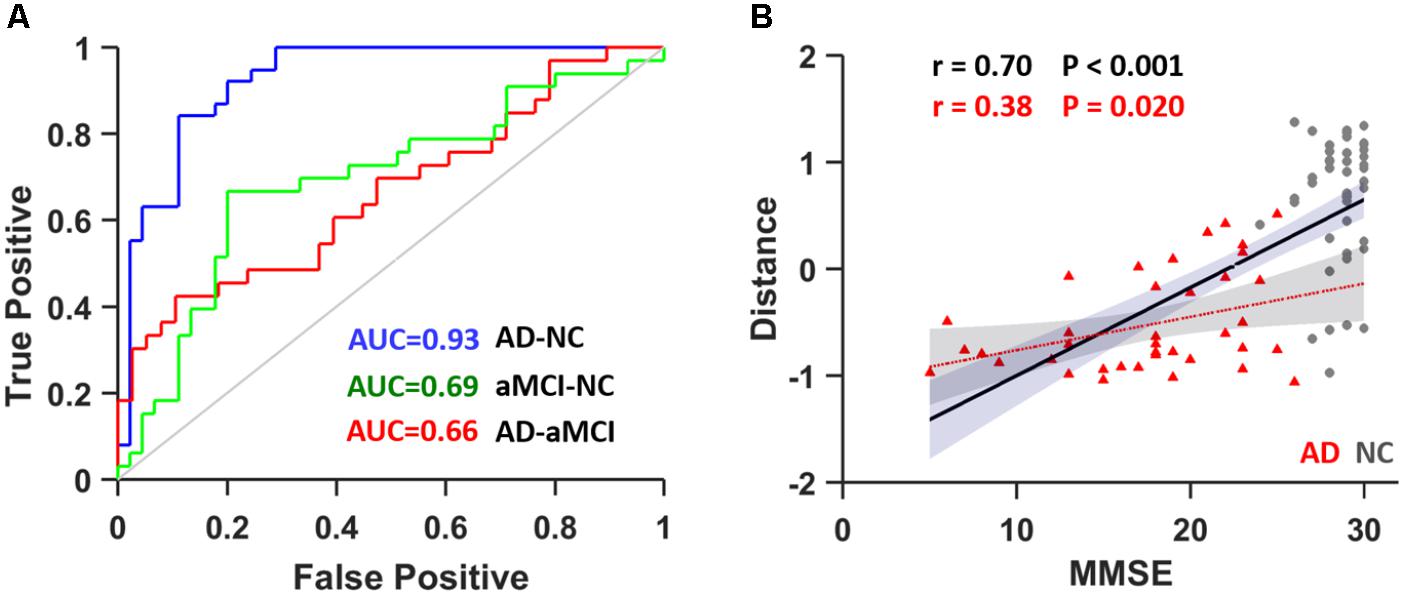
FIGURE 4. (A) ROC curve for distinguishing between AD and NC subjects (blue), aMCI and NC subjects (green) and AD and aMCI subjects (red). (B) The correlation between the distance from the hyperplane and MMSE scores in AD plus NCs (black line) as well as in AD (red line). AUC, area under curve.
Discussion
In the present study, we are the first to identify significantly different radiomic features in hippocampal subregions among AD and aMCI patients and NCs. These features demonstrated were significantly associated with cognitive ability in AD and/or aMCI subjects. More importantly, an SVM analysis demonstrated that these hippocampal textures are potential markers of AD.
In recent years, MRI-based biomarkers of AD that target gray matter atrophy or shape were found to be the most commonly used measures (Risacher et al., 2009; Ezzati et al., 2016; Caldwell et al., 2017). Reduced hippocampal volume has been well studied in AD and MCI individuals (for a review, see Shi et al., 2009). In the revised National Institute on Aging-Alzheimer’s Association diagnostic criteria, hippocampal atrophy was one of the core markers for AD (Albert et al., 2011; Catani et al., 2013). Except for the reduced volume, abnormal metabolism levels, disrupted brain activity and microstructural properties within the hippocampus have been well reported (for a review, see Huijbers et al., 2015). The current results show that radiomic features are different in more than one subregion of the hippocampus, especially in the caudal parts. Among these identified to show altered texture features, three indices (kurtosis, Energy-LLL and Entropy-LLL) from the right caudal region exhibited the most significant alterations. In probability theory and statistics, kurtosis is a measure of flatness in probability distributions in brain images.5 Entropy is a statistical measure of randomness that can be used to characterize the texture of an image. Significant differences in the above features indicate that cognitive impairments in AD and aMCI might result in complicated and changed distributions of voxel values within the hippocampus. This inference was supported by the significant correlation found between texture features and MMSE scores in the AD/aMCI groups and has also been confirmed by previous related studies (de Oliveira et al., 2011; Sørensen et al., 2016). Several investigators have reported that the shapes of brain structures can provide an additional dimension (structural morphology) when quantifying alterations in cognitive ability in AD/MCI patients (Qiu et al., 2008; Tang et al., 2015, 2016). However, hippocampal shape abnormalities (Apostolova et al., 2006; Christensen et al., 2015) and texture features (Li et al., 2010; Zhang J. et al., 2012) have been reported to be associated with individual memory performance. Hence, the present study provides additional clues regarding the morphological alterations that occur in the hippocampus in AD.
As shown in the present study, several texture measures (such as the mean absolute deviation (mad), kurtosis, uniformity, entropy and Sum Entropy-LLL) showed a significant correlation with the MMSE score in AD/aMCI. Among these measures, mad reflects dispersion, kurtosis represents flatness, and both uniformity and entropy measure randomness of the intensity value distribution. For example, a positive kurtosis indicates a more peaked histogram than a Gaussian (normal) distribution of the selected image in AD than that in NC. This phenomenon might be caused by the atrophy of gray matter, which results in a less highly peaked histogram for the voxel intensity values similar to that due to atrophy. It should also be noted that the MMSE is limited in terms of its sensitivity to high and low levels of cognitive functioning (Tombaugh and McIntyre, 1992). Moreover, the correlation results between the textures and the AVLT scores immediate recall, delayed recall and recognition of primary words and new words provide further evidence suggesting that texture is an important and beneficial supplementary index, in addition to volume measurements, for understanding impaired cognitive ability in patients. Although the pathological features of AD, such as neurofibrillary tangles (NFTs) and amyloid-β (Aβ) plaques, cannot be detected on MRI, these microstructural changes might lead to altered textural patterns (Castellano et al., 2004) and might be manifested by texture analysis (Csernansky et al., 2005; Manning et al., 2015; Hwang et al., 2016). Indeed, a negative correlation between image textures and FDG-PET metabolism was identified in a recent excellent study (Shi et al., 2009). Regions with the highest atrophy rates were demonstrated to be located in the anterolateral hippocampus, which is also the region with the highest tau deposition (Franko and Joly, 2013). The anterior (head) hippocampus is thus thought to be the brain region in which the majority of volume differences are found in aMCI and AD patients.
Despite the identification of significantly different features and their correlation with MMSE scores, the application of these hippocampal features as a biomarker still needs to be confirmed. Using simple and common models of nonlinear (RBF) SVM, we obtained an accuracy of 86.75% (SPE: 88.89%; SEN: 84.21%) for distinguishing AD from NC by LOOCV. This finding is consistent with many previous imaging studies (Mak et al., 2011; Zhang Z. et al., 2012; Guo et al., 2014) suggesting that the hippocampal textures might be potential imaging markers for AD. The performance in terms of ACC, SEN, SPE, and AUC was competitive with several state-of-the-art results reported in previous studies (Jie et al., 2015; Ritter et al., 2015; Beheshti et al., 2016; Schouten et al., 2016). In addition, by analyzing the frequencies of the features selected in each LOOCV run, we found that the most powerful feature was the “intensity” of the hippocampus. More importantly, the individualized distance to the hyperplane was a neuroanatomical signature of AD and was significantly correlated with MMSE scores, indicating that the more severe AD becomes, the more likely it is to be identified using radiomic features based on the classifier’s output. This result means that the atrophy and shape of the hippocampus play a very important role in distinguishing AD patients from healthy controls, as suggested by previous studies (Hampel et al., 2008; Beheshti et al., 2016; Sørensen et al., 2016).
Limitations
There were several limitations in this study. First, the hippocampal subregions segmentation was based on the atlas, which resulted in the same shape features in different subregions and, thus, were excluded from the analysis. Because only the hippocampus was included, some other important regions, such as the parahippocampus, amygdala and ventricles, should be investigated in future work. The hippocampus is also divided into subfields, including the Cornu Ammonis (CA1–4), the dentate gyrus and the subiculum, each of which has distinctive histological characteristics and specialized functions (Bird and Burgess, 2008; Delli Pizzi et al., 2016; Zeidman and Maguire, 2016; Blanken et al., 2017). However, radiomic feature extractions are unsuitable for such small regions as the above-described parcellation. Second, the results of the present study demonstrate that radiomic features have potential use in clinical diagnosis; meanwhile, we should also admit that the LOOCV might also have potentially overestimating performance (Varoquaux, 2017; Varoquaux et al., 2017). To validate if the result was robust, we performed a leave-four-subjects-out cross-validation and simulation 1000 times, and the results showed that we could obtain an accuracy of 83.55% (SPE: 84.66%; SEN: 82.66%) for distinguishing AD from NC. Using larger multi-center datasets is a solution to future challenges in reproducibility and statistical power by taking testing data from independent centers. Furthermore, a prospective longitudinal study with a large multi-center sample size is needed to detect the earlier stages of AD (Dubois et al., 2016). Lastly, although we believe this approach will increase our understanding of the multiple levels of hippocampal alterations observed over the course of AD, the radiomic features is much less widespread and less well developed than are other imaging approaches, therefore, combining texture with other markers (for example brain volume, cortical thickness, functional connectivity, and CSF, etc.) to achieve a powerful biomarker of sufficient quality to be considered for clinical applications is needed for future studies.
Conclusion
In conclusion, in the present study, we found that hippocampal radiomic features exhibit significant disease-severity-related alterations in AD. We specifically investigated hippocampal textures as an MRI-based biomarker of AD. The results showed that hippocampal textures could be used as potential MRI markers for the early detection of AD from NC, with a relatively high correction ratio (ACC = 86.75%, specificity = 88.89%, and sensitivity = 84.21%) with the LOOCV method. The results of the present study highlight the importance of hippocampal texture abnormalities in AD and support the possibility that textures may serve as a neuroimaging biomarker for the early detection of AD and aMCI.
Author Contributions
FF, PW, BZ, HY, QM, ZZ, LNW, LW, and NA collected the data. YL, KZ, and YD analyzed the data and performed the measurements. FF, KZ, and YL had the major responsibility of preparing the paper. YL and XZ supervised the project.
Funding
This work was partially supported by the National Key Research and Development Program of China (No. 2016YFC1305904), the National Natural Science Foundation of China (Grant Nos. 81571062, 81471120, and 61431012), the Strategic Priority Research Program (B) of Chinese Academy of Sciences (Grant No. XDBS01020200), the Youth Innovation Promotion Association CAS (Grant No. 2014119), the Primary Research & Development Plan of Shandong Province (Grant No. 2017GGX10112), and the Youth Cultivate Project for Medical Research in PLA (Grant No. 16QNP136) and the specific Healthcare Research Projects (Grant No. 13BJZ50).
Conflict of Interest Statement
The authors declare that the research was conducted in the absence of any commercial or financial relationships that could be construed as a potential conflict of interest.
Supplementary Material
The Supplementary Material for this article can be found online at: https://www.frontiersin.org/articles/10.3389/fnagi.2018.00290/full#supplementary-material
Footnotes
- ^ http://www.fil.ion.ucl.ac.uk/spm
- ^ http://brant.brainnetome.org
- ^ http://atlas.brainnetome.org
- ^ http://www.csie.ntu.edu.tw/tildecjlin/libsvm/
- ^ https://en.wikipedia.org/wiki/Kurtosis
References
Achterberg, H. C., van der Lijn, F., den Heijer, T., Vernooij, M. W., Ikram, M. A., and Niessen, W. J. (2014). Hippocampal shape is predictive for the development of dementia in a normal, elderly population. Hum. Brain Mapp. 35, 2359–2371. doi: 10.1002/hbm.22333
Aerts, H. J., Velazquez, E. R., Leijenaar, R. T. H., Parmar, C., Grossmann, P., Cavalho, S., et al. (2014). Decoding tumour phenotype by noninvasive imaging using a quantitative radiomics approach. Nat. Commun. 5:4006. doi: 10.1038/ncomms5006
Albert, M. S., Dekosky, S. T., Dickson, D., Dubois, B., Feldman, H. H., and Fox, N. C. (2011). The diagnosis of mild cognitive impairment due to Alzheimer’s disease: recommendations from the National Institute on Aging-Alzheimer’s Association workgroups on diagnostic guidelines for Alzheimer’s disease. Alzheimers Dement. 7, 270–279. doi: 10.1016/j.jalz.2011.03.008
Alzheimer’s Association (2017). 2017 Alzheimer’s disease facts and figures. Alzheimer’s Dement. 13, 325–373. doi: 10.1016/j.jalz.2017.02.001
Anandh, K. R., Sujatha, C. M., and Ramakrishnan, S. (2015). Segmentation and analysis of corpus callosum in Alzheimer MR images using total variation based diffusion filter and level set method. Biomed. Sci. Instrum. 51, 355–361.
Apostolova, L. G., Dutton, R. A., Dinov, I. D., Hayashi, K. M., Toga, A. W., Cummings, J. L., et al. (2006). Conversion of mild cognitive impairment to Alzheimer disease predicted by hippocampal atrophy maps. Arch. Neurol. 63, 693–699. doi: 10.1001/archneur.63.5.693
Apostolova, L. G., Green, A. E., Babakchanian, S., Hwang, K. S., Chou, Y. Y., Toga, A. W., et al. (2012). Hippocampal atrophy and ventricular enlargement in normal aging, mild cognitive impairment (MCI), and Alzheimer Disease. Alzheimer Dis. Assoc. Disord. 26, 17–27. doi: 10.1097/WAD.0b013e3182163b62
Beheshti, I., Demirel, H., Alzheimer’s Disease, and Neuroimaging Initiative (2016). Feature-ranking-based Alzheimer’s disease classification from structural MRI. Magn. Reson. Imaging 34, 252–263. doi: 10.1016/j.mri.2015.11.009
Bird, C. M., and Burgess, N. (2008). The hippocampus and memory: insights from spatial processing. Nat. Rev. Neurosci. 9, 182–194. doi: 10.1038/nrn2335
Blanken, A. E., Hurtz, S., Zarow, C., Biado, K., Honarpisheh, H., Somme, J., et al. (2017). Associations between hippocampal morphometry and neuropathologic markers of Alzheimer’s disease using 7 T MRI. Neuroimage Clin. 15, 56–61. doi: 10.1016/j.nicl.2017.04.020
Caldwell, J. Z. K., Berg, J. L., Cummings, J. L., Banks, S. J., and Alzheimer’s Disease Neuroimaging Initiative (2017). Moderating effects of sex on the impact of diagnosis and amyloid positivity on verbal memory and hippocampal volume. Alzheimers Res. Ther. 9:72. doi: 10.1186/s13195-017-0300-8
Castellano, G., Bonilha, L., Li, L. M., and Cendes, F. (2004). Texture analysis of medical images. Clin. Radiol. 59, 1061–1069. doi: 10.1016/j.crad.2004.07.008
Catani, M., Dell’acqua, F., and Thiebaut de Schotten, M. (2013). A revised limbic system model for memory, emotion and behaviour. Neurosci. Biobehav. Rev. 37, 1724–1737. doi: 10.1016/j.neubiorev.2013.07.001
Chételat, G., Landeau, B., Eustache, F., Mézenge, F., Viader, F., de la Sayette, V., et al. (2005). Using voxel-based morphometry to map the structural changes associated with rapid conversion in MCI: a longitudinal MRI study. Neuroimage 27, 934–946. doi: 10.1016/j.neuroimage.2005.05.015
Chincarini, A., Sensi, F., Rei, L., Gemme, G., Squarcia, S., Longo, R., et al. (2015). Integrating longitudinal information in hippocampal volume measurements for the early detection of Alzheimer’s disease. Neuroimage 125, 834–847. doi: 10.1016/j.neuroimage.2015.10.065
Christensen, A., Alpert, K., Rogalski, E., Cobia, D., Rao, J., Beg, M. F., et al. (2015). Hippocampal subfield surface deformity in non-semantic primary progressive aphasia. Alzheimers Dement. 1, 14–23.
Collin, S. H., Milivojevic, B., and Doeller, C. F. (2015). Memory hierarchies map onto the hippocampal long axis in humans. Nat. Neurosci. 18, 1562–1564. doi: 10.1038/nn.4138
Costafreda, S. G., Dinov, I. D., Tu, Z., Shi, Y., Liu, C. Y., Kloszewska, I., et al. (2011). Automated hippocampal shape analysis predicts the onset of dementia in mild cognitive impairment. Neuroimage 56, 212–219. doi: 10.1016/j.neuroimage.2011.01.050
Csernansky, J. G., Wang, L., Swank, J., Miller, J. P., Gado, M., McKeel, D., et al. (2005). Preclinical detection of Alzheimer’s disease: hippocampal shape and volume predict dementia onset in the elderly. Neuroimage 25, 783–792. doi: 10.1016/j.neuroimage.2004.12.036
de Oliveira, M. S., Balthazar, M. L., D’Abreu, A., Yasuda, C. L., Damasceno, B. P., Cendes, F., et al. (2011). MR imaging texture analysis of the corpus callosum and thalamus in amnestic mild cognitive impairment and mild Alzheimer disease. AJNR Am. J. Neuroradiol. 32, 60–66. doi: 10.3174/ajnr.A2232
Delli Pizzi, S., Franciotti, R., Bubbico, G., Thomas, A., Onofrj, M., and Bonanni, L. (2016). Atrophy of hippocampal subfields and adjacent extrahippocampal structures in dementia with Lewy bodies and Alzheimer’s disease. Neurobiol. Aging 40, 103–109. doi: 10.1016/j.neurobiolaging.2016.01.010
Dubois, B., Hampel, H., Feldman, H. H., Scheltens, P., Aisen, P., and Andrieu, S. (2016). Preclinical Alzheimer’s disease: definition, natural history, and diagnostic criteria. Alzheimers Dement. 12, 292–323. doi: 10.1016/j.jalz.2016.02.002
Ezzati, A., Katz, M. J., Zammit, A. R., Lipton, M. L., Zimmerman, M. E., Sliwinski, M. J., et al. (2016). Differential association of left and right hippocampal volumes with verbal episodic and spatial memory in older adults. Neuropsychologia 93, 380–385. doi: 10.1016/j.neuropsychologia.2016.08.016
Fan, L., Li, H., Zhuo, J., Zhang, Y., Wang, J., Chen, L., et al. (2016). The human brainnetome atlas: a new brain atlas based on connectional architecture. Cereb. Cortex 26, 3508–3526. doi: 10.1093/cercor/bhw157
Ferreira, L. K., Diniz, B. S., Forlenza, O. V., Busatto, G. F., and Zanetti, M. V. (2011). Neurostructural predictors of Alzheimer’s disease: a meta-analysis of VBM studies. Neurobiol. Aging 32, 1733–1741. doi: 10.1016/j.neurobiolaging.2009.11.008
Franko, E., and Joly, O. (2013). Evaluating Alzheimer’s disease progression using rate of regional hippocampal atrophy. PLoS One 8:e71354. doi: 10.1371/journal.pone.0071354
Guo, Y., Zhang, Z., Zhou, B., Wang, P., Yao, H., Yuan, M., et al. (2014). Grey-matter volume as a potential feature for the classification of Alzheimer’s disease and mild cognitive impairment: an exploratory study. Neurosci. Bull. 30, 477–489. doi: 10.1007/s12264-013-1432-x
Hampel, H., Bürger, K., Teipel, S. J., Bokde, A. L., Zetterberg, H., and Blennow, K. (2008). Core candidate neurochemical and imaging biomarkers of Alzheimer’s disease. Alzheimers Dement. 4, 38–48. doi: 10.1016/j.jalz.2007.08.006
Huijbers, W., Mormino, E. C., Schultz, A. P., Wigman, S., Ward, A. M., Larvie, M., et al. (2015). Amyloid-beta deposition in mild cognitive impairment is associated with increased hippocampal activity, atrophy and clinical progression. Brain 138, 1023–1035. doi: 10.1093/brain/awv007
Huynh, E., Coroller, T. P., Narayan, V., Agrawal, V., Hou, Y., Romano, J., et al. (2016). CT-based radiomic analysis of stereotactic body radiation therapy patients with lung cancer. Radiother. Oncol. 120, 258–266. doi: 10.1016/j.radonc.2016.05.024
Hwang, E. J., Kim, H. G., Kim, D., Rhee, H. Y., Ryu, C. W., Liu, T., et al. (2016). Texture analyses of quantitative susceptibility maps to differentiate Alzheimer’s disease from cognitive normal and mild cognitive impairment. Med. Phys. 43:4718. doi: 10.1118/1.4958959
Jie, B., Zhang, D., Cheng, B., Shen, D., and Alzheimer’s Disease Neuroimaging Initiative (2015). Manifold regularized multitask feature learning for multimodality disease classification. Hum. Brain Mapp. 36, 489–507. doi: 10.1002/hbm.22642
Kamkar, I., Gupta, S. K., Phung, D., and Venkatesh, S. (2015). Stable feature selection for clinical prediction: exploiting ICD tree structure using Tree-Lasso. J. Biomed. Inform. 53, 277–290. doi: 10.1016/j.jbi.2014.11.013
La Joie, R., Landeau, B., Perrotin, A., Bejanin, A., Egret, S., Pélerin, A., et al. (2014). Intrinsic connectivity identifies the hippocampus as a main crossroad between Alzheimer’s and semantic dementia-targeted networks. Neuron 81, 1417–1428. doi: 10.1016/j.neuron.2014.01.026
La Joie, R., Perrotin, A., de La Sayette, V., Egret, S., Doeuvre, L., Belliard, S., et al. (2013). Hippocampal subfield volumetry in mild cognitive impairment, Alzheimer’s disease and semantic dementia. Neuroimage Clin. 3, 155–162. doi: 10.1016/j.nicl.2013.08.007
Leung, K. K., Bartlett, J. W., Barnes, J., Manning, E. N., Ourselin, S., Fox, N. C., et al. (2013). Cerebral atrophy in mild cognitive impairment and Alzheimer disease: rates and acceleration. Neurology 80, 648–654. doi: 10.1212/WNL.0b013e318281ccd3
Li, X., Yu, C., Jiang, G., Liu, W., Tong, L., et al. (2010). “3D texture analysis of hippocampus based on MR images in patients with Alzheimer disease and mild cognitive impairment,” in Proceedings of the 2010 3rd International Conference on Biomedical Engineering and Informatics, Vol. 1, (Yantai), 1–4. doi: 10.1109/BMEI.2010.5639520
Lyketsos, C. G., Carrillo, M. C., Ryan, J. M., Khachaturian, A. S., Trzepacz, P., Amatniek, J., et al. (2011). Neuropsychiatric symptoms in Alzheimer’s disease. Alzheimers Dement. 7, 532–539. doi: 10.1016/j.jalz.2011.05.2410
Mak, E., Gabel, S., Su, L., Williams, G. B., Arnold, R., Passamonti, L., et al. (2017). Multi-modal MRI investigation of volumetric and microstructural changes in the hippocampus and its subfields in mild cognitive impairment, Alzheimer’s disease, and dementia with Lewy bodies. Int. Psychogeriatr. 29, 545–555. doi: 10.1017/S1041610216002143
Mak, H. K., Zhang, Z., Yau, K. K., Zhang, L., Chan, Q., and Chu, L. W. (2011). Efficacy of voxel-based morphometry with DARTEL and standard registration as imaging biomarkers in Alzheimer’s disease patients and cognitively normal older adults at 3.0 Tesla MR imaging. J. Alzheimers Dis. 23, 655–664. doi: 10.3233/JAD-2010-101659
Manning, E. N., Macdonald, K. E., Leung, K. K., Young, J., Pepple, T., Lehmann, M., et al. (2015). Differential hippocampal shapes in posterior cortical atrophy patients: a comparison with control and typical AD subjects. Hum. Brain Mapp. 36, 5123–5136. doi: 10.1002/hbm.22999
McKhann, G., Drachman, D., Folstein, M., Katzman, R., Price, D., and Stadlan, E. M. (1984). Clinical diagnosis of Alzheimer’s disease: report of the NINCDS-ADRDA Work Group under the auspices of Department of Health and Human Services Task Force on Alzheimer’s Disease. Neurology 34, 939–944. doi: 10.1212/WNL.34.7.939
McKhann, G. M., Knopman, D. S., Chertkow, H., Hyman, B. T., Jack, C. R. Jr., Kawas, C. H., et al. (2011). The diagnosis of dementia due to Alzheimer’s disease: recommendations from the National Institute on Aging-Alzheimer’s Association workgroups on diagnostic guidelines for Alzheimer’s disease. Alzheimers Dement. 7, 263–269. doi: 10.1016/j.jalz.2011.03.005
Parmar, C., Leijenaar, R. T., Grossmann, P., Rios Velazquez, E., Bussink, J., Rietveld, D., et al. (2015). Radiomic feature clusters and prognostic signatures specific for Lung and Head & Neck cancer. Sci. Rep. 5:11044. doi: 10.1038/srep11044
Petersen, R. C. (2004). Mild cognitive impairment as a diagnostic entity. J. Intern. Med. 256, 183–194. doi: 10.1111/j.1365-2796.2004.01388.x
Petersen, R. C. (2016). Mild cognitive impairment. Continuum 22, 404–418. doi: 10.1212/CON.0000000000000313
Petersen, R. C., and Jack, C. R. Jr. (2009). Imaging and biomarkers in early Alzheimer’s disease and mild cognitive impairment. Clin. Pharmacol. Ther. 86, 438–441. doi: 10.1038/clpt.2009.166
Pruessner, J. C., Li, L. M., Serles, W., Pruessner, M., Collins, D. L., Kabani, N., et al. (2000). Volumetry of hippocampus and amygdala with high-resolution MRI and three-dimensional analysis software: minimizing the discrepancies between laboratories. Cereb. Cortex 10, 433–442. doi: 10.1093/cercor/10.4.433
Qiu, A., Younes, L., Miller, M. I., and Csernansky, J. G. (2008). Parallel transport in diffeomorphisms distinguishes the time-dependent pattern of hippocampal surface deformation due to healthy aging and the dementia of the Alzheimer’s type. Neuroimage 40, 68–76. doi: 10.1016/j.neuroimage.2007.11.041
Raji, C. A., Lopez, O. L., Kuller, L. H., Carmichael, O. T., and Becker, J. T. (2009). Age, Alzheimer disease, and brain structure. Neurology 73, 1899–1905. doi: 10.1212/WNL.0b013e3181c3f293
Reitz, C., and Mayeux, R. (2014). Alzheimer disease: epidemiology, diagnostic criteria, risk factors and biomarkers. Biochem. Pharmacol. 88, 640–651. doi: 10.1016/j.bcp.2013.12.024
Risacher, S. L., Saykin, A. J., West, J. D., Shen, L., Firpi, H. A., and McDonald, B. C. (2009). Baseline MRI predictors of conversion from MCI to probable AD in the ADNI cohort. Curr. Alzheimer Res. 6, 347–361. doi: 10.2174/156720509788929273
Ritter, K., Schumacher, J., Weygandt, M., Buchert, R., Allefeld, C., and Haynes, J. D. (2015). Multimodal prediction of conversion to Alzheimer’s disease based on incomplete biomarkers. Alzheimers Dement. 1, 206–215. doi: 10.1016/j.dadm.2015.01.006
Schouten, T. M., Koini, M., de Vos, F., Seiler, S., van der Grond, J., and Lechner, A. (2016). Combining anatomical, diffusion, and resting state functional magnetic resonance imaging for individual classification of mild and moderate Alzheimer’s disease. Neuroimage Clin. 11, 46–51. doi: 10.1016/j.nicl.2016.01.002
Shen, D., Moffat, S., Resnick, S. M., and Davatzikos, C. (2002). Measuring size and shape of the hippocampus in MR images using a deformable shape model. Neuroimage 15, 422–434. doi: 10.1006/nimg.2001.0987
Shi, F., Liu, B., Zhou, Y., Yu, C., and Jiang, T. (2009). Hippocampal volume and asymmetry in mild cognitive impairment and Alzheimer’s disease: meta-analyses of MRI studies. Hippocampus 19, 1055–1064. doi: 10.1002/hipo.20573
Sørensen, L., Igel, C., Liv Hansen, N., Osler, M., Lauritzen, M., and Rostrup, E. (2016). Early detection of Alzheimer’s disease using MRI hippocampal texture. Hum. Brain Mapp. 37, 1148–1161. doi: 10.1002/hbm.23091
Sørensen, L., Igel, C., Pai, A., Balas, I., Anker, C., Lillholm, M., et al. (2017). Differential diagnosis of mild cognitive impairment and Alzheimer’s disease using structural MRI cortical thickness, hippocampal shape, hippocampal texture, and volumetry. Neuroimage Clin. 13, 470–482. doi: 10.1016/j.nicl.2016.11.025
Strange, B. A., Witter, M. P., Lein, E. S., and Moser, E. I. (2014). Functional organization of the hippocampal longitudinal axis. Nat. Rev. Neurosci. 15, 655–669. doi: 10.1038/nrn3785
Tang, X., Holland, D., Dale, A. M., Miller, M. I., and Alzheimer’s Disease Neuroimaging Initiative (2015). APOE affects the volume and shape of the amygdala and the hippocampus in mild cognitive impairment and Alzheimer’s disease: age matters. J. Alzheimers Dis. 47, 645–660. doi: 10.3233/JAD-150262
Tang, X., Qin, Y., Wu, J., Zhang, M., Zhu, W., and Miller, M. I. (2016). Shape and diffusion tensor imaging based integrative analysis of the hippocampus and the amygdala in Alzheimer’s disease. Magn. Reson. Imaging 34, 1087–1099. doi: 10.1016/j.mri.2016.05.001
Tombaugh, T. N., and McIntyre, N. J. (1992). The mini-mental state examination: a comprehensive review. J. Am. Geriatr. Soc. 40, 922–935. doi: 10.1111/j.1532-5415.1992.tb01992.x
Varoquaux, G. (2017). Cross-validation failure: small sample sizes lead to large error bars. Neuroimage (in press). doi: 10.1016/j.neuroimage.2017.06.061
Varoquaux, G., Raamana, P. R., Engemann, D. A., Hoyos-Idrobo, A., Schwartz, Y., and Thirion, B. (2017). Assessing and tuning brain decoders: cross-validation, caveats, and guidelines. Neuroimage 145, 166–179. doi: 10.1016/j.neuroimage.2016.10.038
Wang, P., Zhou, B., Yao, H., Zhan, Y., Zhang, Z., Cui, Y., et al. (2015). Aberrant intra- and inter-network connectivity architectures in Alzheimer’s disease and mild cognitive impairment. Sci. Rep. 5:14824. doi: 10.1038/srep14824
Xu, K., Liu, Y., Zhan, Y., Ren, J., Jiang, T., et al. (2018). BRANT: a Versatile and Extendable Resting-state fMRI Toolkit. Front. Neuroinform. 12:52. doi: 10.3389/fninf.2018.00052
Yang, J., Pan, P., Song, W., Huang, R., Li, J., Chen, K., et al. (2012). Voxelwise meta-analysis of gray matter anomalies in Alzheimer’s disease and mild cognitive impairment using anatomic likelihood estimation. J. Neurol. Sci. 316, 21–29. doi: 10.1016/j.jns.2012.02.010
Yao, H., Liu, Y., Zhou, B., Zhang, Z., An, N., Wang, P., et al. (2013). Decreased functional connectivity of the amygdala in Alzheimer’s disease revealed by resting-state fMRI. Eur. J. Radiol. 82, 1531–1538. doi: 10.1016/j.ejrad.2013.03.019
Zeidman, P., and Maguire, E. A. (2016). Anterior hippocampus: the anatomy of perception, imagination and episodic memory. Nat. Rev. Neurosci. 17, 173–182. doi: 10.1038/nrn.2015.24
Zhang, J., Yu, C., Jiang, G., Liu, W., and Tong, L. (2012). 3D texture analysis on MRI images of Alzheimer’s disease. Brain Imaging Behav. 6, 61–69. doi: 10.1007/s11682-011-9142-3
Zhang, Z., Liu, Y., Jiang, T., Zhou, B., An, N., Dai, H., et al. (2012). Altered spontaneous activity in Alzheimer’s disease and mild cognitive impairment revealed by Regional Homogeneity. Neuroimage 59, 1429–1440. doi: 10.1016/j.neuroimage.2011.08.049
Zhang, Z., Liu, Y., Zhou, B., Zheng, J., Yao, H., An, N., et al. (2014). Altered functional connectivity of the marginal division in Alzheimer’s disease. Curr. Alzheimer Res. 11, 145–155. doi: 10.2174/1567205011666140110112608
Keywords: alzheimer’s disease, amnestic mild cognitive impairment, hippocampal subregions, radiomic features, support vector machine
Citation: Feng F, Wang P, Zhao K, Zhou B, Yao H, Meng Q, Wang L, Zhang Z, Ding Y, Wang L, An N, Zhang X and Liu Y (2018) Radiomic Features of Hippocampal Subregions in Alzheimer’s Disease and Amnestic Mild Cognitive Impairment. Front. Aging Neurosci. 10:290. doi: 10.3389/fnagi.2018.00290
Received: 04 May 2018; Accepted: 03 September 2018;
Published: 25 September 2018.
Edited by:
Robert Perneczky, Ludwig-Maximilians-Universität München, GermanyReviewed by:
Stefano Delli Pizzi, Università degli Studi G. d’Annunzio Chieti e Pescara, ItalyXianfeng Yang, Nanjing University of Science and Technology, China
Feng Shi, Cedars-Sinai Medical Center, United States
Copyright © 2018 Feng, Wang, Zhao, Zhou, Yao, Meng, Wang, Zhang, Ding, Wang, An, Zhang and Liu. This is an open-access article distributed under the terms of the Creative Commons Attribution License (CC BY). The use, distribution or reproduction in other forums is permitted, provided the original author(s) and the copyright owner(s) are credited and that the original publication in this journal is cited, in accordance with accepted academic practice. No use, distribution or reproduction is permitted which does not comply with these terms.
*Correspondence: Xi Zhang, emhhbmd4aUAzMDFob3NwaXRhbC5jb20uY24= Yong Liu, eWxpdUBubHByLmlhLmFjLmNu
†These authors have contributed equally to this work