 Swan L. S. Sow
 Thomas W. Trull
 Levente Bodrossy
- 1Institute for Marine and Antarctic Studies, University of Tasmania, Hobart, TAS, Australia
- 2Oceans and Atmosphere, Commonwealth Scientific and Industrial Research Organisation (CSIRO), Hobart, TAS, Australia
The cosmopolitan haptophyte Phaeocystis is recognized as a key contributor to marine biogeochemical cycling and important primary producer within polar marine environments. Yet, little is known about its solitary, non-colonial cell stages or its distribution during the colder, low-productivity seasons. We examined the biogeography of Phaeocystis along a high-resolution (0.5-degree latitudinal interval) transect from the Antarctic ice-edge to the equator of the South Pacific, in the austral autumn-winter. Using high-throughput 18S rRNA gene sequences with single nucleotide variable (zero-radius) operational taxonomic units (zOTUs) allowed us to explore the possibility of strain-level variation. From water samples within the upper water column, we show the presence of an abundant Phaeocystis assemblage that persisted during the colder months, contributing up to 9% of the microbial eukaryote community at high latitudes. The biogeography of Phaeocystis was strongly shaped by oceanographic boundaries, most prominently the polar and subantarctic fronts. Marked changes in dominant Phaeocystis antarctica zOTUs between different frontal zones support the concept that ecotypes may exist within the Phaeocystis assemblage. Our findings also show that the Phaeocystis assemblage did not abide by the classical latitudinal diversity gradient of increasing richness from the poles to the tropics; richness peaked at 30°S and declined to a minimum at 5°S. Another surprise was that P. globosa and P. cordata, previously thought to be restricted to the northern hemisphere, were detected at moderate abundances within the Southern Ocean. Our results emphasize the importance of oceanographic processes in shaping the biogeography of Phaeocystis and highlights the importance of genomics-based exploration of Phaeocystis, which have found the assemblage to be more complex than previously understood. The high winter relative abundance of the Phaeocystis assemblage suggests it could be involved in more complex ecological interactions during the less productive seasons, which should be considered in future studies to better understand the ecological role and strategies of this keystone species.
Introduction
Climate change is fast altering many aspects of marine ecosystems (Burrows et al., 2011; Achterberg, 2014). Thus, advancing our knowledge on keystone organisms such as phytoplankton, which form the base of marine food webs, is central in forecasting the effects of climate change. The prymnesiophyte phytoplankton of the genus Phaeocystis have a cosmopolitan marine distribution and play pivotal roles in the marine carbon and sulfur cycles (DiTullio et al., 2000; Verity et al., 2007). This is particularly true at high latitude marine environments such as the Southern Ocean, where primary productivity has a considerable contribution toward global ocean biogeochemistry and climate (Sarmiento et al., 2004). Phaeocystis antarctica is a known species commonly found in the Southern Ocean, where it exhibits extensive blooms (El-Sayed et al., 1983). It has significantly higher rates of carbon dioxide (CO2) and nitrate drawdown as well as rapid carbon export potential compared to diatoms (Arrigo et al., 1999; DiTullio et al., 2000). Thus, changes to the Phaeocystis community could strongly impact nutrient cycling efficiency and carbon export (Schoemann et al., 2005; Hutchins and Fu, 2017). However, Phaeocystis blooms are thought to be prevalent only within high latitude environments during the spring-summer months (Long et al., 2007). Seasonal variation and succession of overall composition of microbial communities is well recognized (Winter et al., 2009; Gilbert et al., 2012; Grzymski et al., 2012; Salter et al., 2015; Parada and Fuhrman, 2017), but little is known about the Phaeocystis assemblage outside its blooming season. This is because molecular identification of Phaeocystis remains scarce and morphological (microscopy) identification is ambiguous (Baumann et al., 1994). This situation is exacerbated by the complexity of Phaeocystis ecology, which includes a polymorphic life cycle with a wide distribution of its solitary free-living form, as well as the occurrence of colonial assemblages in which hundreds of cells are grouped in a polysaccharide matrix (Schoemann et al., 2005). This complexity means that its effective size in the plankton community can vary several orders of magnitude, from a few microns for the solitary forms to a few hundreds of microns for colonies. Current understanding is limited by insufficient temporal and spatial sampling of Phaeocystis, along with incomplete understanding of species and strains (Verity et al., 2007).
The full range of controls on the oceanic distribution of Phaeocystis species and strains remains to be determined. It is known to be regulated in part by its specific light and nutrient requirements, particularly the concentration of phosphate and nitrate (Verity et al., 2007). Within the Southern Ocean, micronutrients such as iron are limiting and also play a role in controlling Phaeocystis distribution (Stefels and van Leeuwe, 1998; van Leeuwe and Stefels, 1998, 2007). Because species and community composition of microbes are known to differ with ocean salinity and temperature (Brown et al., 2012; Raes et al., 2018), it is expected that oceanographic features are likely to be important in the control of Phaeocystis distributions, especially fronts which separate the euphotic ocean into zones or regions which have different hydrographical properties such as salinity, temperature, density and nutrients (Sokolov and Rintoul, 2002). For example, the Southern Ocean polar front is known to be a major ecological boundary for bacteria, archaea and zooplankton (Chiba et al., 2001; Hunt et al., 2001; Esper and Zonneveld, 2002; Ward et al., 2003; Wilkins et al., 2013; Raes et al., 2018).
Another expectation is the latitudinal diversity gradient, characterized as an increase in species richness from higher to lower latitudes (Ekman, 1953), as a fundamental biodiversity pattern found across a broad range of terrestrial, aquatic and marine taxa (Pianka, 1966; Gaston, 2000; Hillebrand, 2004). However, knowledge on the applicability of this biodiversity pattern on the highly diverse microbial communities remain uncertain. The gradient effect is expected to decrease with decreasing organism size, as microbes have large population sizes, rapid generation times and are easily dispersed (Finlay, 2002). With the exception of several recent works (Pommier et al., 2007; Fuhrman et al., 2008; Ladau et al., 2013; Endo et al., 2018; Raes et al., 2018; Ibarbalz et al., 2019), the microbial community, particularly microbial eukaryotes such as Phaeocystis are still under-represented with regards to research relating to latitudinal diversity patterns. Exceptions to the gradient have also been reported (Brayard et al., 2005; Tittensor et al., 2010; Powell et al., 2012; Woolley et al., 2016).
In the late austral autumn to winter of 2016, we investigated distribution trends of Phaeocystis from high to low latitude (−66 to 0°) epipelagic waters using high-throughput sequencing of the 18S ribosomal RNA marker gene. Our research encompassed both colonial and non-colonial Phaeocystis assemblages sampled on a latitudinal transect spanning ∼ 7000 km within the South Pacific Ocean, using the first high-resolution (∼0.5° sampling interval) study. Our goal was to refine our understanding of Phaeocystis distributions outside the period of its summer blooms. We hypothesized that stable fronts and oceanographic features can act as ecological boundaries that delineate the beta-diversity patterns of the Phaeocystis assemblage. From this hypothesis, we also set out to examine the species composition within each zone during the austral autumn-winter. This included determining whether the Phaeocystis assemblage followed the latitudinal diversity gradient during the less-productive seasons.
Materials and Methods
Study Region and Sampling
Seawater samples were collected on the RV Investigator during the GO-SHIP P15S repeat hydrographic transect1 (26th April to 29th June, 2016). Seawater was collected on a 36-bottle rosette water sampler mounted with the SBE911 conductivity, temperature and depth (CTD) sensors (Seabird Scientific, United States), SBE43 dissolved oxygen sensor (Seabird Scientific, United States), Aquatracka fluorometer (Chelsea Technologies, United Kingdom) and Wet Labs C-StarTM transmissometer (Seabird Scientific, United States).
Samples for DNA analysis of the Phaeocystis assemblage were collected from 10-litre Niskin bottles deployed at four different depths within the upper water column (depth ranges 1–286 m; see Supplementary Table S1). The four sampling depths within the upper water column consisted of one sample each from the surface, deep chlorophyll maximum, mixed layer depth (MLD) and just below the mixed layer, and covered a latitudinal range of 0–66°S at longitude ranges of 169–174°W (Figure 1). Water column mixed layer depths were calculated according to Talley et al. (2011). For MLD values along the P15S transect referenced in this study, see Supplementary Figure S5 in Raes et al. (2018).
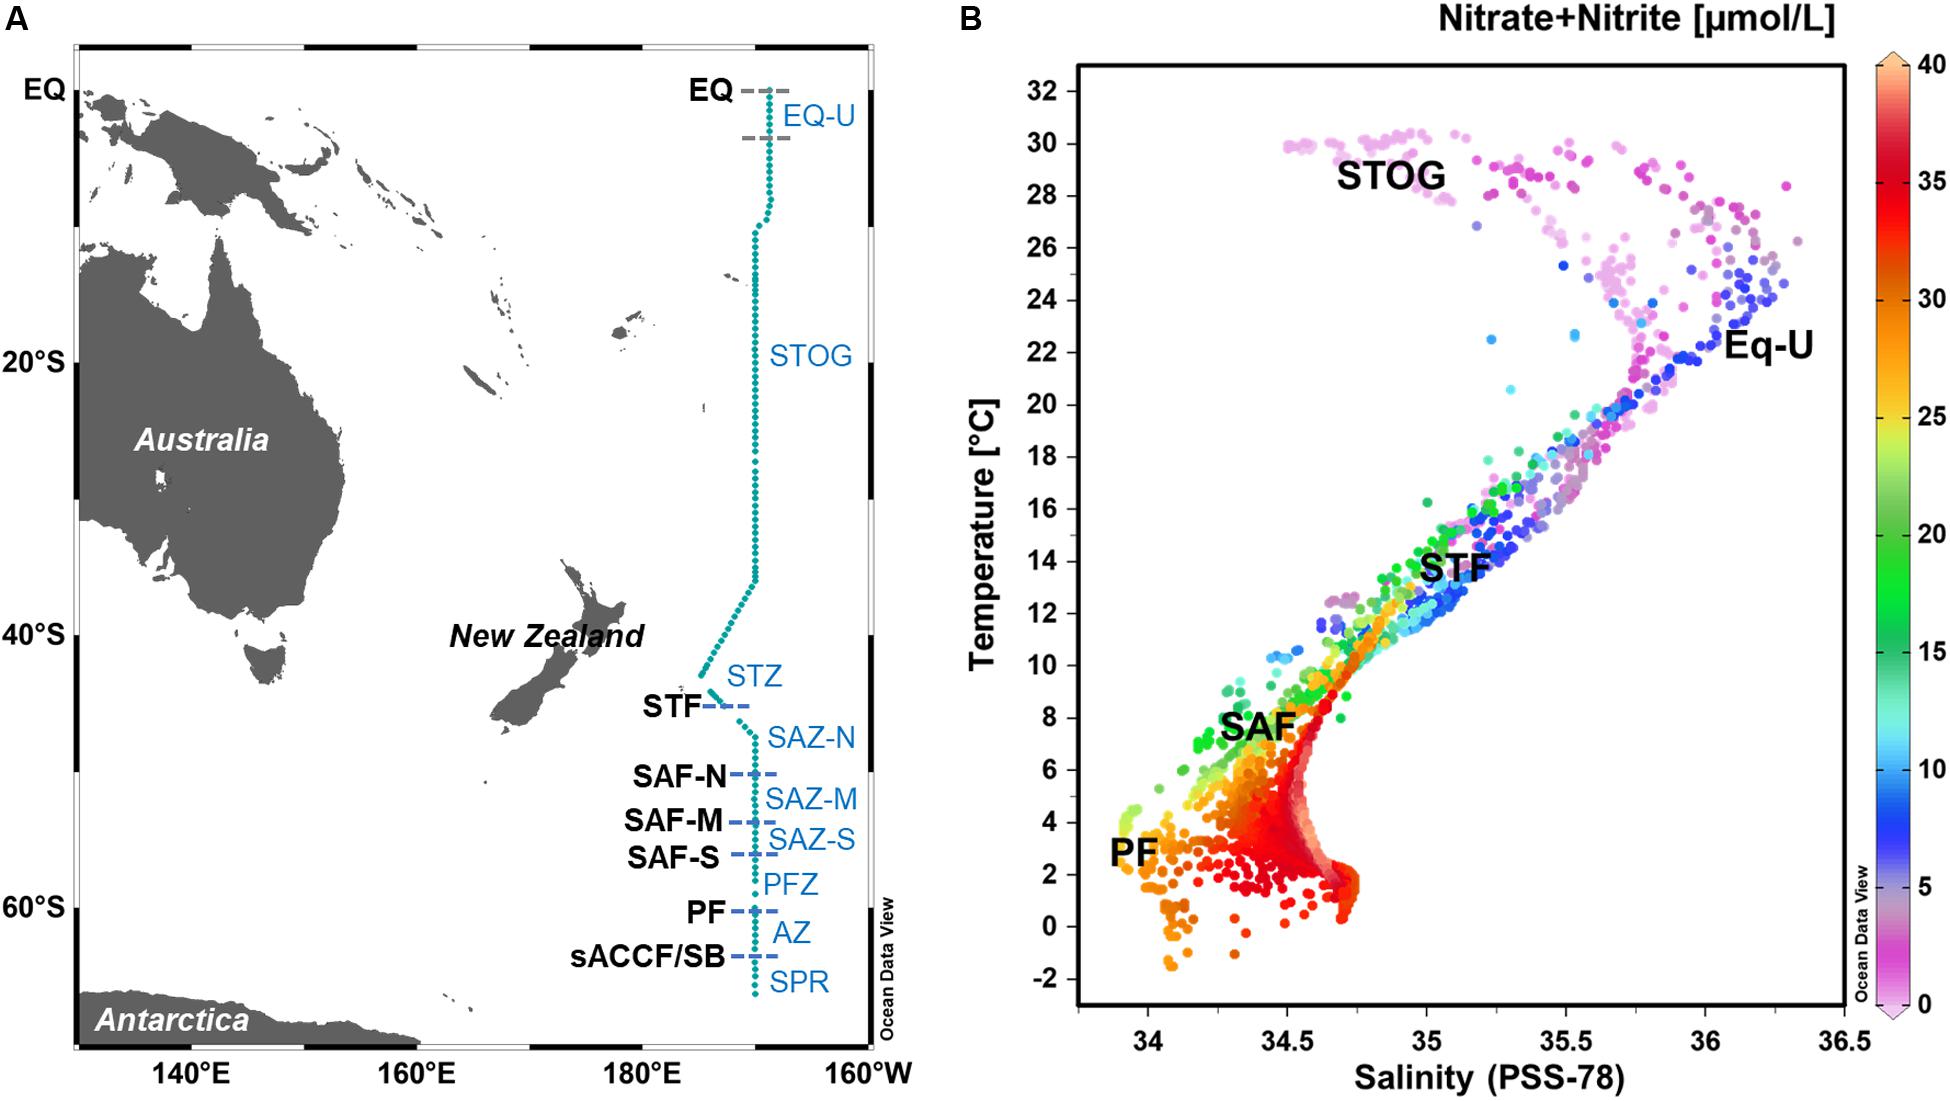
Figure 1. (A) Map depicting microbial sampling stations within the GO-SHIP P15S transect (teal line) with approximate locations (latitudes) of the major oceanic fronts. (B) Plot of temperature against salinity (T-S) overlaid with nitrate + nitrite (NOx), with indicative temperature-salinity-NOx ranges of the different oceanic zones. T-S plots were generated using data recorded from all depths measured within the full water column. EQ, equator; EQ-U, equatorial upwelling zone; STOG, subtropical oligotrophic gyre zone; STZ, subtropical zone; SAZ-N, subantarctic zone-north; SAZ-M, SAZ-mid; SAZ-S, SAZ-south; PFZ, polar frontal zone; AZ, Antarctic zone; sACCF, southern Antarctic circumpolar current front; SPR, subpolar region.
Physico-Chemical Variable Measurements and Nutrient Analyses
Hydrochemistry and nutrients analyses were assayed by the Commonwealth Scientific and Industrial Research Organisation (CSIRO) Hydrochemistry team as described in Raes et al. (2018). In this paper, all presented salinities are based on the PSS-78 reference (SP) and are therefore unitless. The latitude, longitude, and absolute pressure values at the depths of sample collection (i.e., the sample “depths” in pressure units of dbar) provided with the data enable Absolute Salinity (SA) to be calculated via the TEOS-10 equation2 of state for seawater. Chlorophyll a profiles were generated using extracts from 0.525 liters of sample water from five sampling depths within the upper water column. Extraction was done using gentle vacuum filtration (pressure drop < 10 kPa) using 25-mm GF/F grade Whatman® glass microfiber filters (Merck, Germany) and samples were measured on a Trilogy laboratory fluorometer (Turner Designs, United States). Chlorophyll a data is as presented in Raes et al. (2017). Physical, biogeochemical, nutrient and metadata reported or discussed here can be accessed through the CLIVAR and Carbon Hydrographic Data Office (CCHDO) webpage3.
DNA Isolation, Amplification and High-Throughput Sequencing
Two liters of seawater were collected for each sample, filtered through 0.22 μm pore size polyethersulfone SterivexTM filter cartridges (Millipore, Germany) and stored immediately at −80°C until DNA extraction. DNA isolation was performed using a modified organic (phenol:chloroform:isoamyl alcohol-based) DNA isolation protocol of the DNeasy® PowerWater® SterivexTM Kit (Qiagen, Germany) (Appleyard et al., 2013; Supplementary Methods). Individual microbial samples were assigned unique Bioplatforms Australia (BPA) IDs from the Australian National Data Service (Supplementary Table S1). DNA was sequenced at the Ramaciotti Centre for Genomics4 (University of New South Wales, Sydney), where amplicons targeting the V4 region of eukaryotic 18S rRNA gene [18SV4F and 18SV4R primer pair modified from Stoeck et al. (2010), see Supplementary Table S7] were generated and sequenced using the MiSeqTM (Illumina, United States) dual-indexed 250 bp paired-end approach following protocols established by the Australian Microbiome (Marine Microbes) Initiative5. Full PCR amplification conditions, primer sequences and sequencing protocols used can be found in Supplementary Methods or downloaded from the methods page of the Bioplatforms Australia data portal6.
Bioinformatics, Statistical and General Analyses
All sequences were analyzed as part of the Australian Microbiome Initiative as previously described by Brown et al. (2018) (Supplementary Methods). Zero-radius operational taxonomic unit (zOTU) data with single nucleotide variation between zOTUs were used to enable data analysis at the highest possible phylogenetic variation (Edgar, 2016, 2018). zOTUs were taxonomically classified using the Protist Ribosomal Reference Database (PR2, v4.11.1) (Guillou et al., 2013), and zOTU tables were subsampled to a constant sampling depth of 25,000 sequences per sample for subsequent statistical analyses using the “sub.sample” command in MOTHUR v.1.36.1 (Schloss et al., 2009). zOTUs from all samples that were assigned to the family Phaeocystaceae (and genus Phaeocystis) were considered within this study.
Paired end reads (R1, R2), indexed reads (I1, I2) in.fastq format, and latest sequence read abundance tables are available from the Australian Microbiome page of the Bioplatforms Australia data portal7. Genomic datasets associated with this study are accessible from the NCBI BioProject PRJNA385736 webpage8. Sequence accession numbers for each sample are listed in Supplementary Table S1.
Biogeographic distribution patterns are known to be influenced by sampling effort (number of sequences) (Chaudhary et al., 2017; Meyer et al., 2018; Hermans et al., 2019). Lower abundance or sporadically present zOTUs may be present as a result of sequencing artifacts or noise, affecting the credibility of inferred biogeographic information. To account for this, we considered the abundance-ubiquity (Ab-Ub) relationship when analyzing relative abundances of the Phaeocystis assemblage. The Ab-Ub relationship of all Phaeocystis zOTUs were computed using Perl scripts from the CORe microBiome Analysis Tools (Corbata) project (Li et al., 2013). We considered 0.01% of the cumulative relative abundance (relative abundance averaged across all the samples analyzed) and 20% ubiquity as the minimum Ab-Ub threshold (which would translate to 2.5 sequencing reads and 25 sampling sites, respectively).
Richness and Good’s coverage for the Phaeocystis assemblage was calculated with 100 permutations using the “ecopy” (Lemoine, 2015) and “scikit-bio” packages on Python 3.6.1. Rarefaction curves were generated using the “rarecurve” function in the R package “vegan” (Oksanen et al., 2018). Richness, Good’s coverage and rarefaction curves were calculated based on average zOTU relative abundance values of the four sampling depths within the upper water column per station (latitude), to obtain single values reflecting the overall Phaeocystis assemblage within the upper water column. Richness was defined as the number of zOTUs (non-zero columns) observed per station (“spRich” function from “ecopy”). Good’s coverage was defined as C = 1−(n1/N), where C is the Good’s coverage estimator, n1 is the number of zOTUs that have been sampled once and N is the total number of individuals in the sample (“skbio.diversity.alpha.goods_coverage” function from “scikit-bio”). Analysis of similarities (ANOSIM) was conducted in PRIMER (v7.0.13, PRIMER-E, United Kingdom) (Clarke and Gorley, 2015) following square-root transformation of zOTU abundances, to test for the strength of assemblage clustering according to oceanic zones.
The relative abundance and alpha-diversity distribution of the Phaeocystis population (after accounting for low Ab-Ub zOTUs) were analyzed by considering (in separate plots) the percentage of Phaeocystis sequences and richness across the range of latitudes sampled. Percentage of Phaeocystis sequences were calculated as average Phaeocystis relative abundance value per station (of the four sampled depths within the upper water column) against all microbial eukaryote 18S rRNA gene sequences per station (i.e., 25,000 sequences).
Each individual Phaeocystis zOTU was categorized as either “high,” “mid” or “low” abundance zOTUs based on the total cumulative percentages for each zOTU of the total Phaeocystis sequences. The latitudinal distribution of each Phaeocystis zOTU from the “high” and “mid” categories were visualized on a plot of percent relative abundance of each zOTU against latitude. Percent relative abundance of each zOTU was defined by considering its relative abundance (total reads) at each latitude out of total 18S rRNA gene sequence reads per latitude (i.e., 25,000).
A phylogenetic tree was inferred using the neighbor-joining method with 1000 bootstraps using ARB (v6.06) (Ludwig et al., 2004) based on 382 bp aligned regions of the 18S rRNA gene sequences. Sequences were aligned using MUSCLE v3.8.31 (Edgar, 2004) based on the default alignment mode and was rooted using outgroup sequences Prymnesium parvum (NCBI accession no.: AJ246269), Imantonia rotunda (AJ246267), Pleurochrysis carterae (AJ246263), Gephyrocapsa oceanica (AB058360), and Isochrysis galbana (AJ246266).
Most analyses and graphical plots were generated in the R statistical computing platform (v3.4.4) (R Core Team, 2018) using ggplot2 (Wickham, 2016), Microsoft Excel and Ocean Data View (v5.1.7) (Schlitzer, 2019).
Results
Physico-Chemical Profile and Major Epipelagic Oceanic Zones
From the 132 sampling stations along the GO-SHIP P15S transect, we identified six different ocean fronts and nine different oceanic zones (regions) according to temperature, salinity and nutrient values (Figures 1, 2 and Supplementary Table S1). Fronts and oceanic regions were determined according to temperature and salinity range indicators suggested by Orsi et al. (1995), Sokolov and Rintoul (2002), and Longhurst (2007). Clear temperature (polar front – PF, ∼60°S; subantarctic front – SAF) and salinity (subtropical front – STF, ∼44°S) changes were observed when passing through the fronts (Figure 2). Three branches of the subantarctic front were also observed: SAF-south (SAF-S, ∼56°S), SAF-mid (SAF-M, ∼54°S) and SAF-north (SAF-N, ∼50°S) (Figure 2A). Colder waters at depths of ∼150 m approximately 5°S from the equator were indicative of an equatorial upwelling (Figures 2A,E).
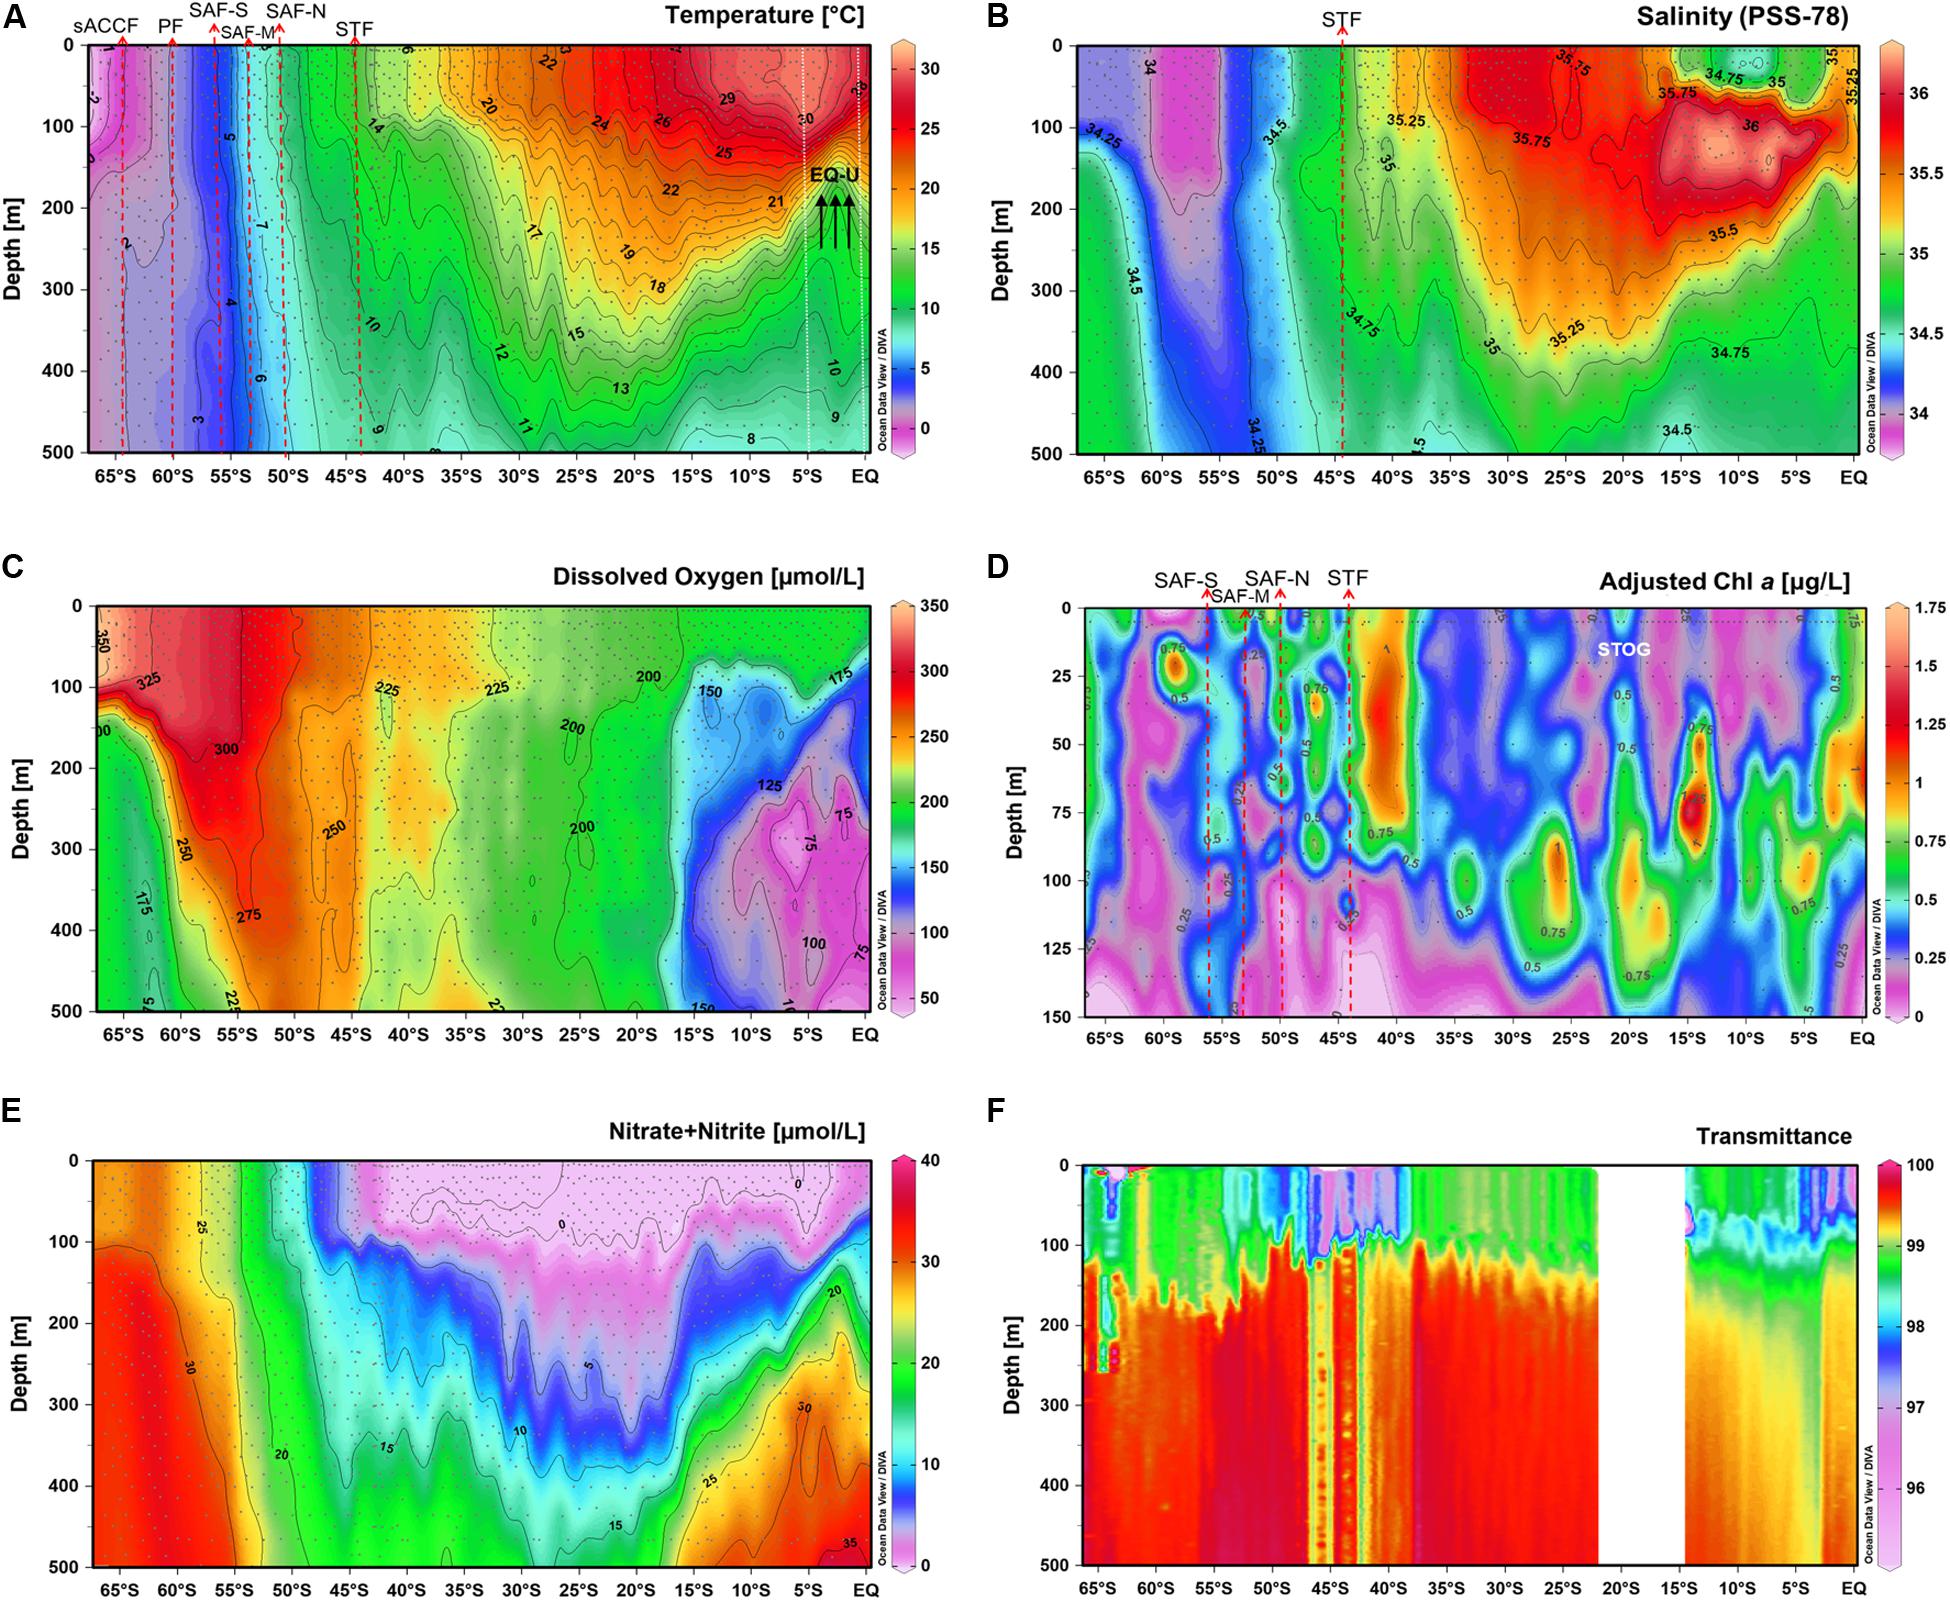
Figure 2. Vertical distributions of (A) temperature, (B) salinity, (C) dissolved oxygen, (D) chlorophyll a, (E) nitrate + nitrite and (F) transmittance (%) within the top 500 m of the water column along the P15S sampling section (top 150 m for chlorophyll a). Major oceanographic fronts are indicated by red dashed arrows, white dotted lines indicate approximate boundaries for subtropical gyre and equatorial upwelling zones. Front acronyms are as detailed in Figure 1.
Temperature of the surface waters ranged from −2°C to 30°C and increased gradually from 66°S to the equator (Figure 2A). Salinity values (PSS-78) ranged from 34 to 36.5, were lowest at higher latitudes and increased toward the equator, peaking in subtropical waters at ∼30°S (Figure 2B). Oxygen values of the surface waters peaked at ∼350 μmol L–1 at higher latitudes and decreased toward warmer waters at the equator to ∼200 μmol L–1 (Figure 2C), consistent with temperature control of oxygen solubility and near atmospheric equilibrium in surface waters. Within the top 50 m of the water column, chlorophyll a values were highest (0.75–1.25 μg L–1) between 40 and 55°S within the STZ and SAZ, and lowest (0–0.35 μg L–1) within the subtropical oligotrophic gyre (STOG) (Figure 2D).
Richness Profile of the Phaeocystis Assemblage Within the South Pacific
The subsampled 18S rRNA zOTU table with samples from the four different sampling depths within the upper water column yielded 237,016 sequences that classified under the Phaeocystis genus, which translated to ∼2% of all 18S rRNA gene sequences considered. When considered based on average relative abundance values of the four depths per station (latitude) basis, there was a total of 59,736 sequences from the 132 sampling stations. Rarefactions plots (Supplementary Figure S1) and Good’s coverage of >0.9 for all stations (Supplementary Table S2) indicate adequate sampling to capture the Phaeocystis diversity that was present.
A total of 92 Phaeocystis zOTUs were observed. We considered the Ab-Ub relationship of all 92 Phaeocystis zOTUs found within this study (Supplementary Figure S2), where 29 Phaeocystis zOTUs had abundances and ubiquity above the 0.01–20% Ab-Ub threshold (Supplementary Figure S2 and Supplementary Table S3). Phaeocystis zOTUs below the Ab-Ub threshold are listed in Supplementary Table S6 with their respective relative abundances.
The average percentage of Phaeocystis sequences per station within the microbial eukaryote community was greater at the higher latitudes, peaking at ∼9% at 64°S (Figure 3A). Average percentage of Phaeocystis sequences (aggregated value for four samples in the water column) decreased toward the STF and was lowest within the subtropical oligotrophic gyre (10–40°S; 0.3–0.9%), increasing slightly again after 5°S within the equatorial upwelling zone (Figure 3A). Phaeocystis richness peaked at 25 zOTUs at ∼30°S (r2 = 0.83) (Figure 3B). Richness increased after crossing the PF (northward) toward the SAF. Richness was lowest in the region right before the PF (∼61°S, four zOTUs) and the equatorial upwelling (∼5°S, six zOTUs) (Figure 3B). Overall, the region with the highest richness corresponded with the region with the lowest percentage of Phaeocystis in the subtropical oligotrophic gyre (∼20–40°S) (Figures 3, 4A).
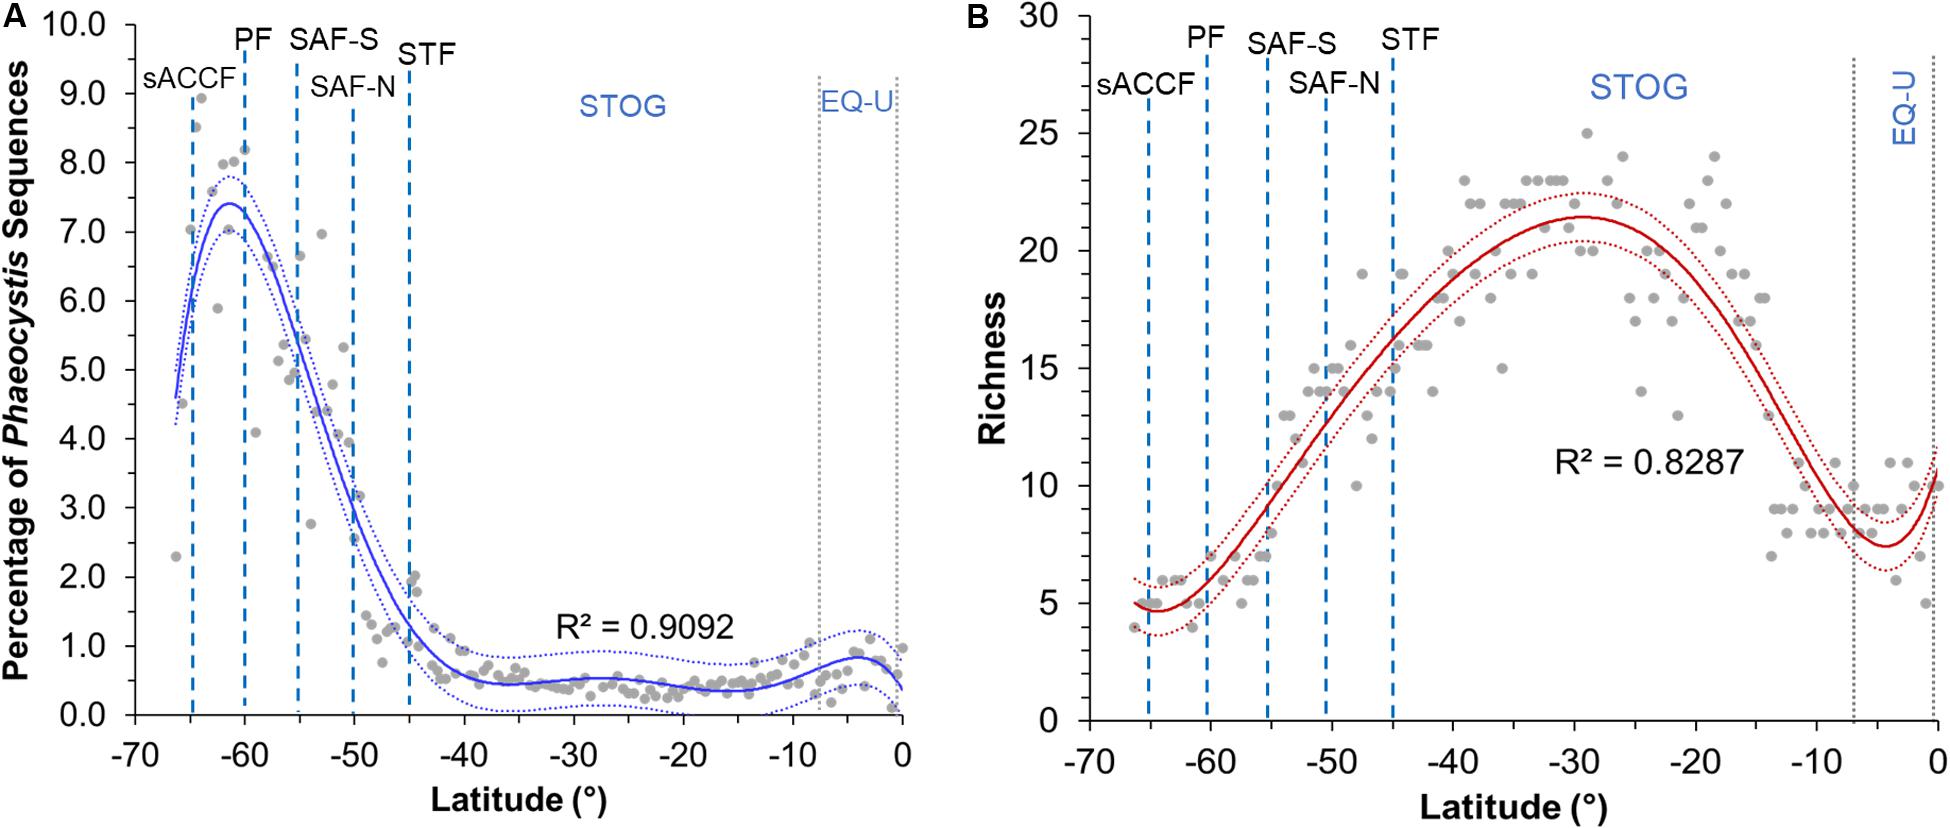
Figure 3. Plot of (A) percentage of Phaeocystis sequences against latitude and (B) richness against latitude for sampling stations across all latitudes. Percentage values presented in plot A are calculated as average Phaeocystis relative abundance value per station (of the four sampled depths within the upper water column) against all microbial eukaryote 18S rRNA gene sequences per station (i.e., 25,000 sequences). Sixth-order polynomial fit is indicated by the blue line for the sequence percentage plot and by the red line for the richness plot. 95% confidence intervals are indicated by blue (Phaeocystis sequence percentage plot) and red dotted lines (richness plot). Blue dashed lines indicate approximate location of fronts, gray dotted lines indicate approximate boundaries for subtropical gyre and equatorial upwelling zones. Acronyms for fronts and zones are as listed in Figure 1.
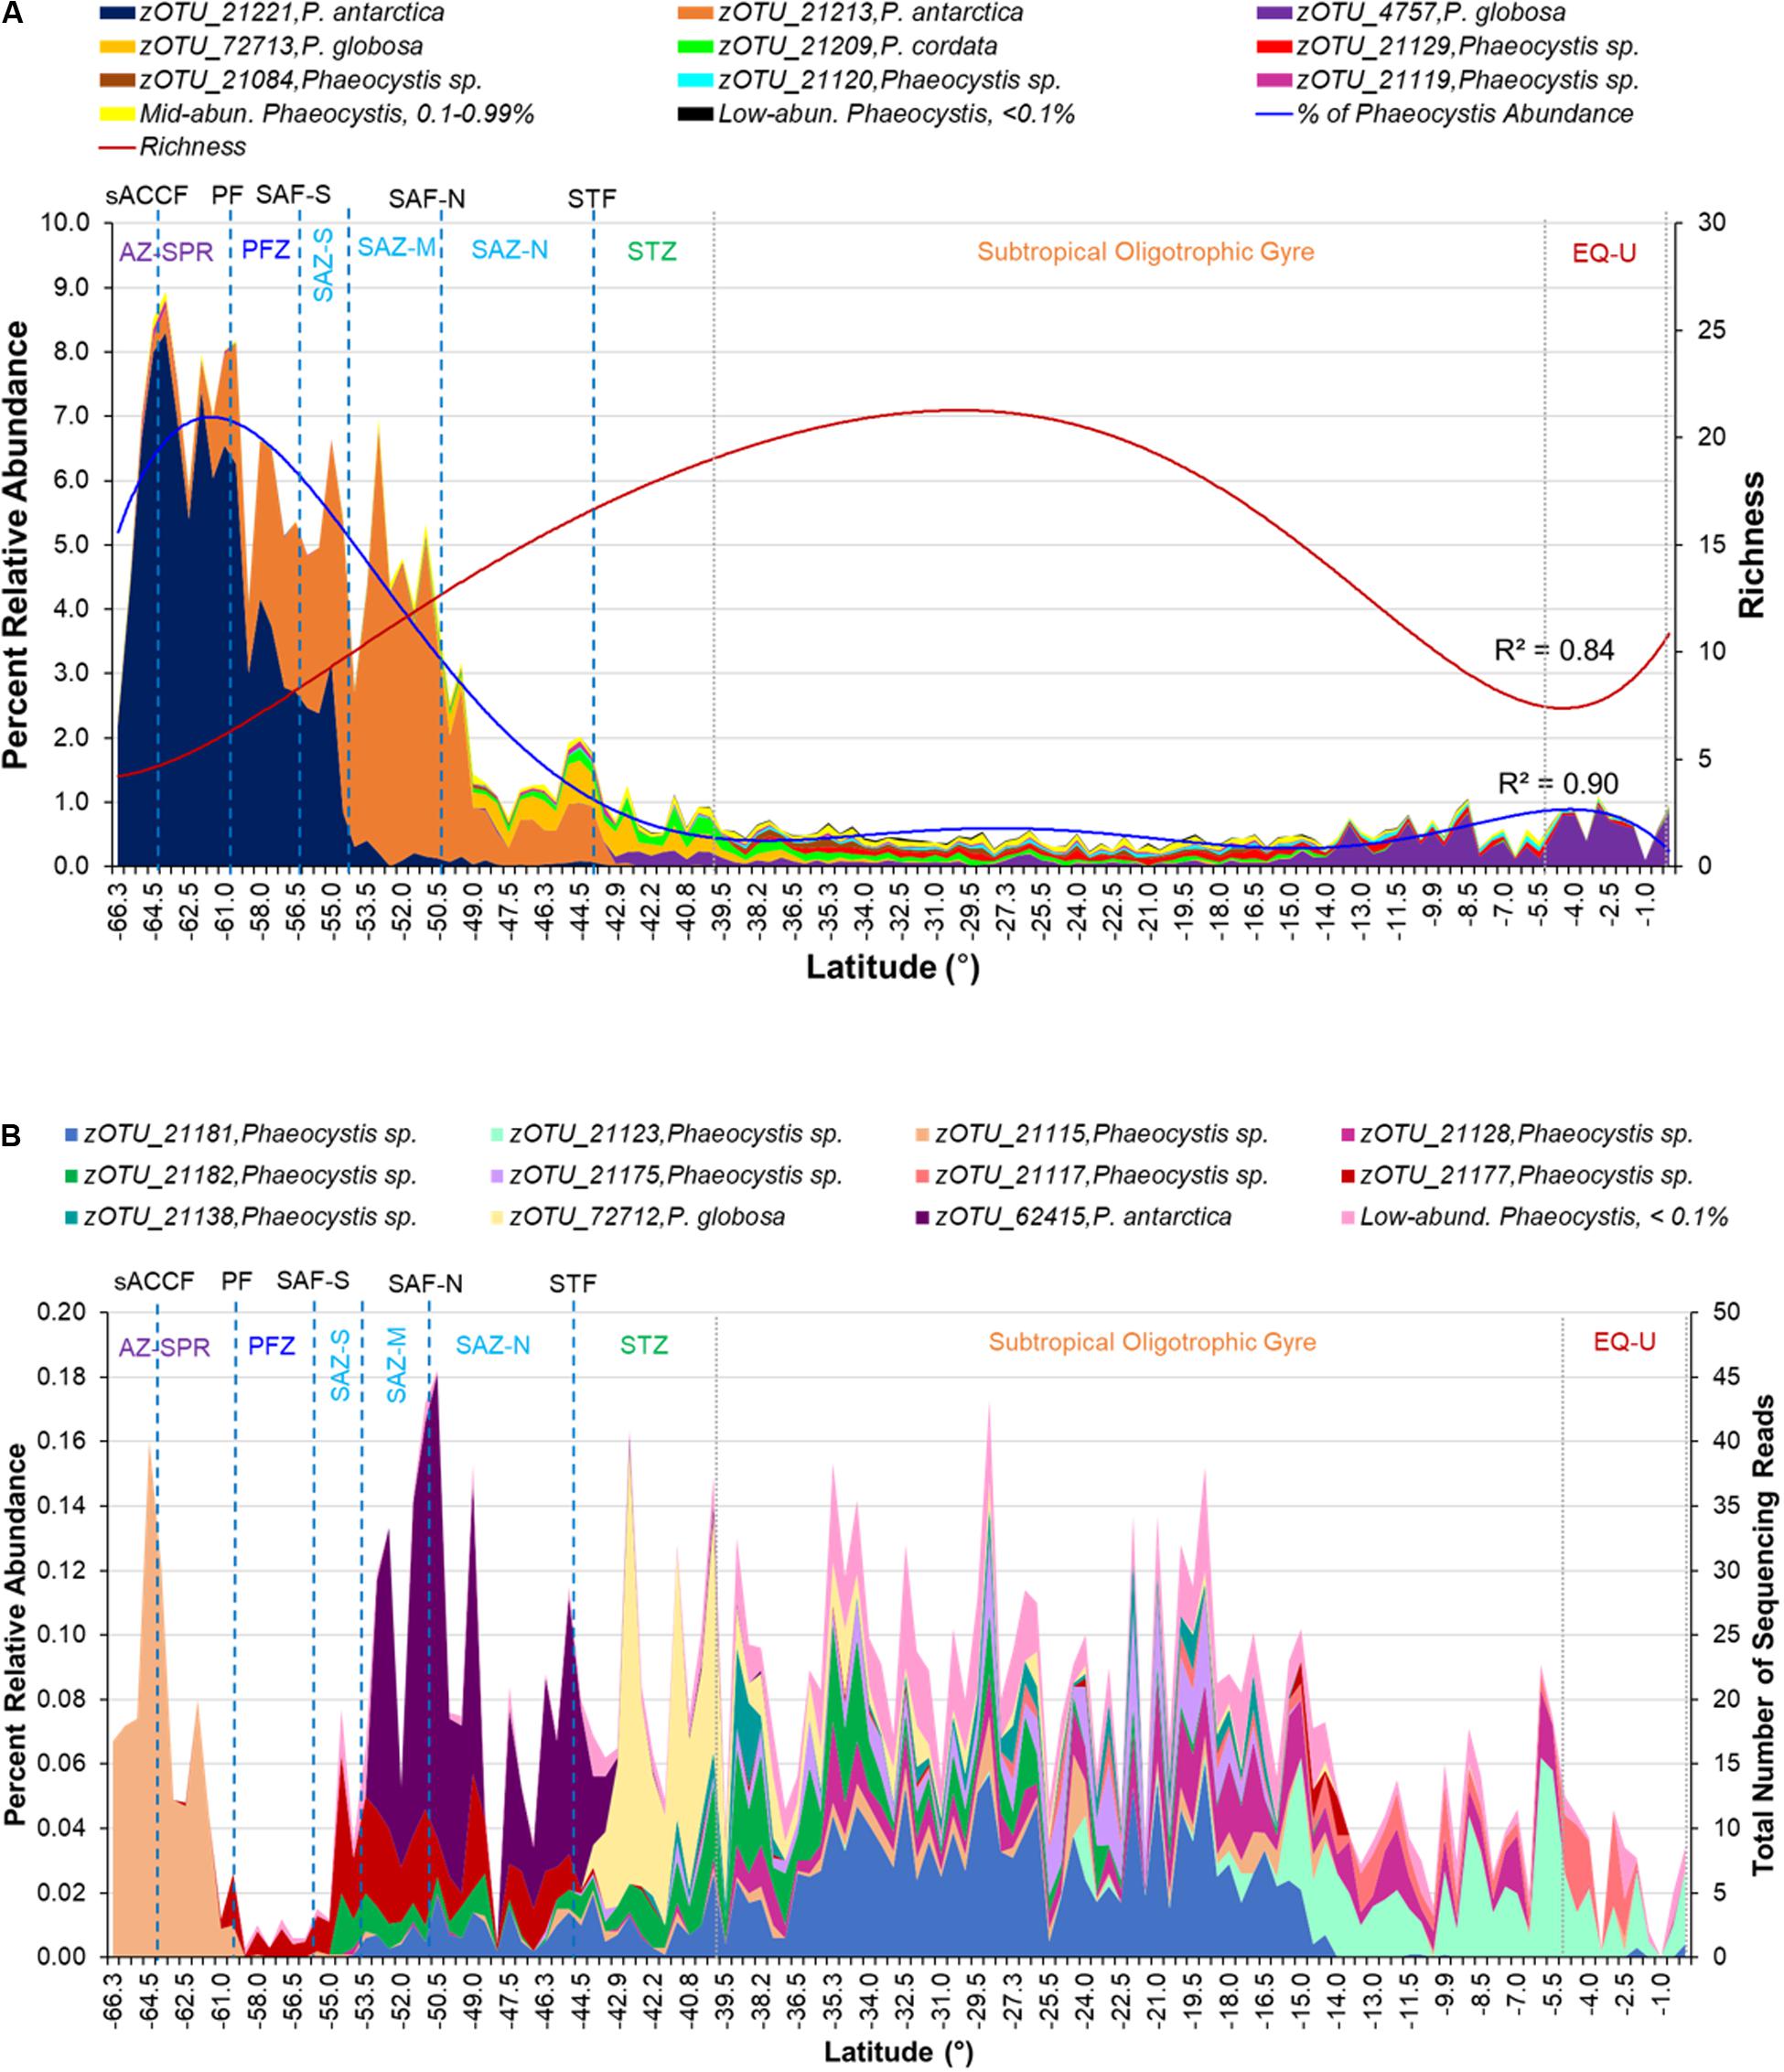
Figure 4. (A) Percent relative abundance of high-abundance Phaeocystis zOTUs (relative abundance >1% of all Phaeocystis 18S rRNA gene sequences) above the Ab-Ub threshold within the P15S transect. Mid- (0.1–0.99% of all Phaeocystis 18S rRNA gene sequences) and low- (< 0.1% of all Phaeocystis 18S rRNA gene sequences) abundance zOTUs are indicated as separate, pooled categories. Richness (red line) and percent relative abundance (blue line) profiles of the Phaeocystis assemblage fitted with a sixth-order polynomial regression curve are overlaid. (B) Average relative abundance of mid-abundance Phaeocystis zOTUs above the Ab-Ub threshold. Low-abundance zOTUs are indicated as a pooled category. Approximate locations of fronts are indicated by blue dotted lines, while approximate boundaries for subtropical gyre and equatorial upwelling zones are indicated by gray dotted lines. Acronyms for fronts and zones are as listed in Figure 1.
Phaeocystis Assemblage Composition From the Subpolar Region to the Equator
Of the 29 Phaeocystis zOTUs above the Ab-Ub threshold, nine (31%) were high-abundance (making up more than 1% of the Phaeocystis 18S rRNA gene sequences across all the samples analyzed), and were classified as P. antarctica, P. globosa, P. cordata, and unclassified Phaeocystis (Figure 4A and Supplementary Table S3). Eleven (38%) zOTUs were classified as mid-abundance (0.1–0.99% of Phaeocystis 18S rRNA gene sequences) and comprised of P. antarctica, P. globosa and unclassified Phaeocystis species (Figure 4B and Supplementary Table S3). The remaining nine (31%) were low-abundance (< 0.1% of Phaeocystis 18S rRNA gene sequences) and were all unclassified Phaeocystis (Supplementary Table S3). The 63 Phaeocystis zOTUs below the Ab-Ub threshold identified as P. pouchetti, P. jahnii, P. globosa, and P. antarctica and unclassified Phaeocystis (Supplementary Table S6).
Overall, the Phaeocystis assemblage was significantly different between most of the oceanographic zones as demonstrated by the ANOSIM test (Supplementary Table S4). Pairwise ANOSIM between STZ and STOG Phaeocystis assemblages as well as between STOG and EQ-U assemblages found that Phaeocystis in these oceanic zone pairs were moderately but significantly different (R = 0.505–0.514, p = 0.01; Supplementary Table S4). Assemblages in the PFZ and SAZ-S pair as well as SAZ-S and SAZ-M pair were different (R = 0.6), but without statistical significance (p = 0.8–2.4; Supplementary Table S4).
The two major P. antarctica zOTUs (zOTU_21221, zOTU_21213) were abundant mainly at the higher latitudes within the Southern Ocean sector of the transect (Figure 4A). From the ice edge, P. antarctica was abundant beyond the PF up till the SAF, with distinct assemblage composition (zOTU) changes observed after crossing the PF and SAF-M (Figure 4A). At ∼49°S within the SAZ-N, P. antarctica declined sharply in relative abundance with a corresponding moderate increase in the relative abundance of P. globosa (Figure 4A). The EQ-U zone comprised mainly of P. globosa, though the assemblage (zOTUs) were distinct from those found within the SAZ-N and STZ (Figure 4A).
The mid- to low-abundance Phaeocystis assemblage also exhibited distinct assemblage compositions between the different oceanographic zones. Notably, the AZ-SPR consisted mainly of an unclassified Phaeocystis zOTU (zOTU_21115) not prevalent in other zones, as did the SAZ (Figure 4B). A highly diverse Phaeocystis assemblage with higher proportions of low-abundance Phaeocystis was observed within the subtropical oligotrophic gyre which had the lowest percentages of Phaeocystis sequences (Figures 3, 4).
Latitudinal distribution patterns of Phaeocystis relative abundance and richness were consistent whether considering only those above the Ab-Ub threshold or all Phaeocystis zOTUs. Latitudinal distribution patterns and ANOSIM incorporating all Phaeocystis zOTUs, including those below the Ab-Ub threshold are provided in Supplementary Figure S3 and Supplementary Table S5.
The phylogenetic relationship amongst all high- and mid-abundance Phaeocystis sequences from this study with reference to sequences from previous studies are depicted in Figure 5. Known colony-forming species, P. antarctica, P. globosa, P. pouchetti, and P. cordata clustered together within a common clade. P. antarctica sequences branched out further forming separate high-latitude and low-latitude clusters (Figure 5). P. antarctica zOTU_21221 was abundant within the AZ-SPR and PFZ. zOTU_21221 sequences clustered together with P. antarctica sequences previously isolated from high latitude (63–65°S) locations at the Weddell Sea and McMurdo Sound (Medlin et al., 1994) which we term the high-latitude P. antarctica cluster within this study (Figure 5). P. antarctica zOTU_21213 was abundant within the SAZ. zOTU_21213 sequences clustered with sequences previously isolated from a lower latitude (49°S) location at the Atlantic sector of the Antarctic Circumpolar Convergence (ACC) (Zingone et al., 2011) and we term this as the low-latitude P. antarctica cluster (Figure 5). zOTU_21120 and zOTU_21119, detected within the subtropical oligotrophic gyre, clustered together with P. jahnii. The two P. globosa zOTUs (zOTU_72713 and zOTU_4745) that were detected also seemed to group with two distinct subclades on the phylogenetic tree and were each detected in higher abundances in two different regions (subantarctic region for zOTU_72713, low latitude region for zOTU_4745). The remaining unclassified Phaeocystis zOTU sequences clustered together to form three separate clades distinct from other reference Phaeocystis sequences and clades (clade P15S.16.1, P15S.16.2, P15S.16.3; Figure 5).
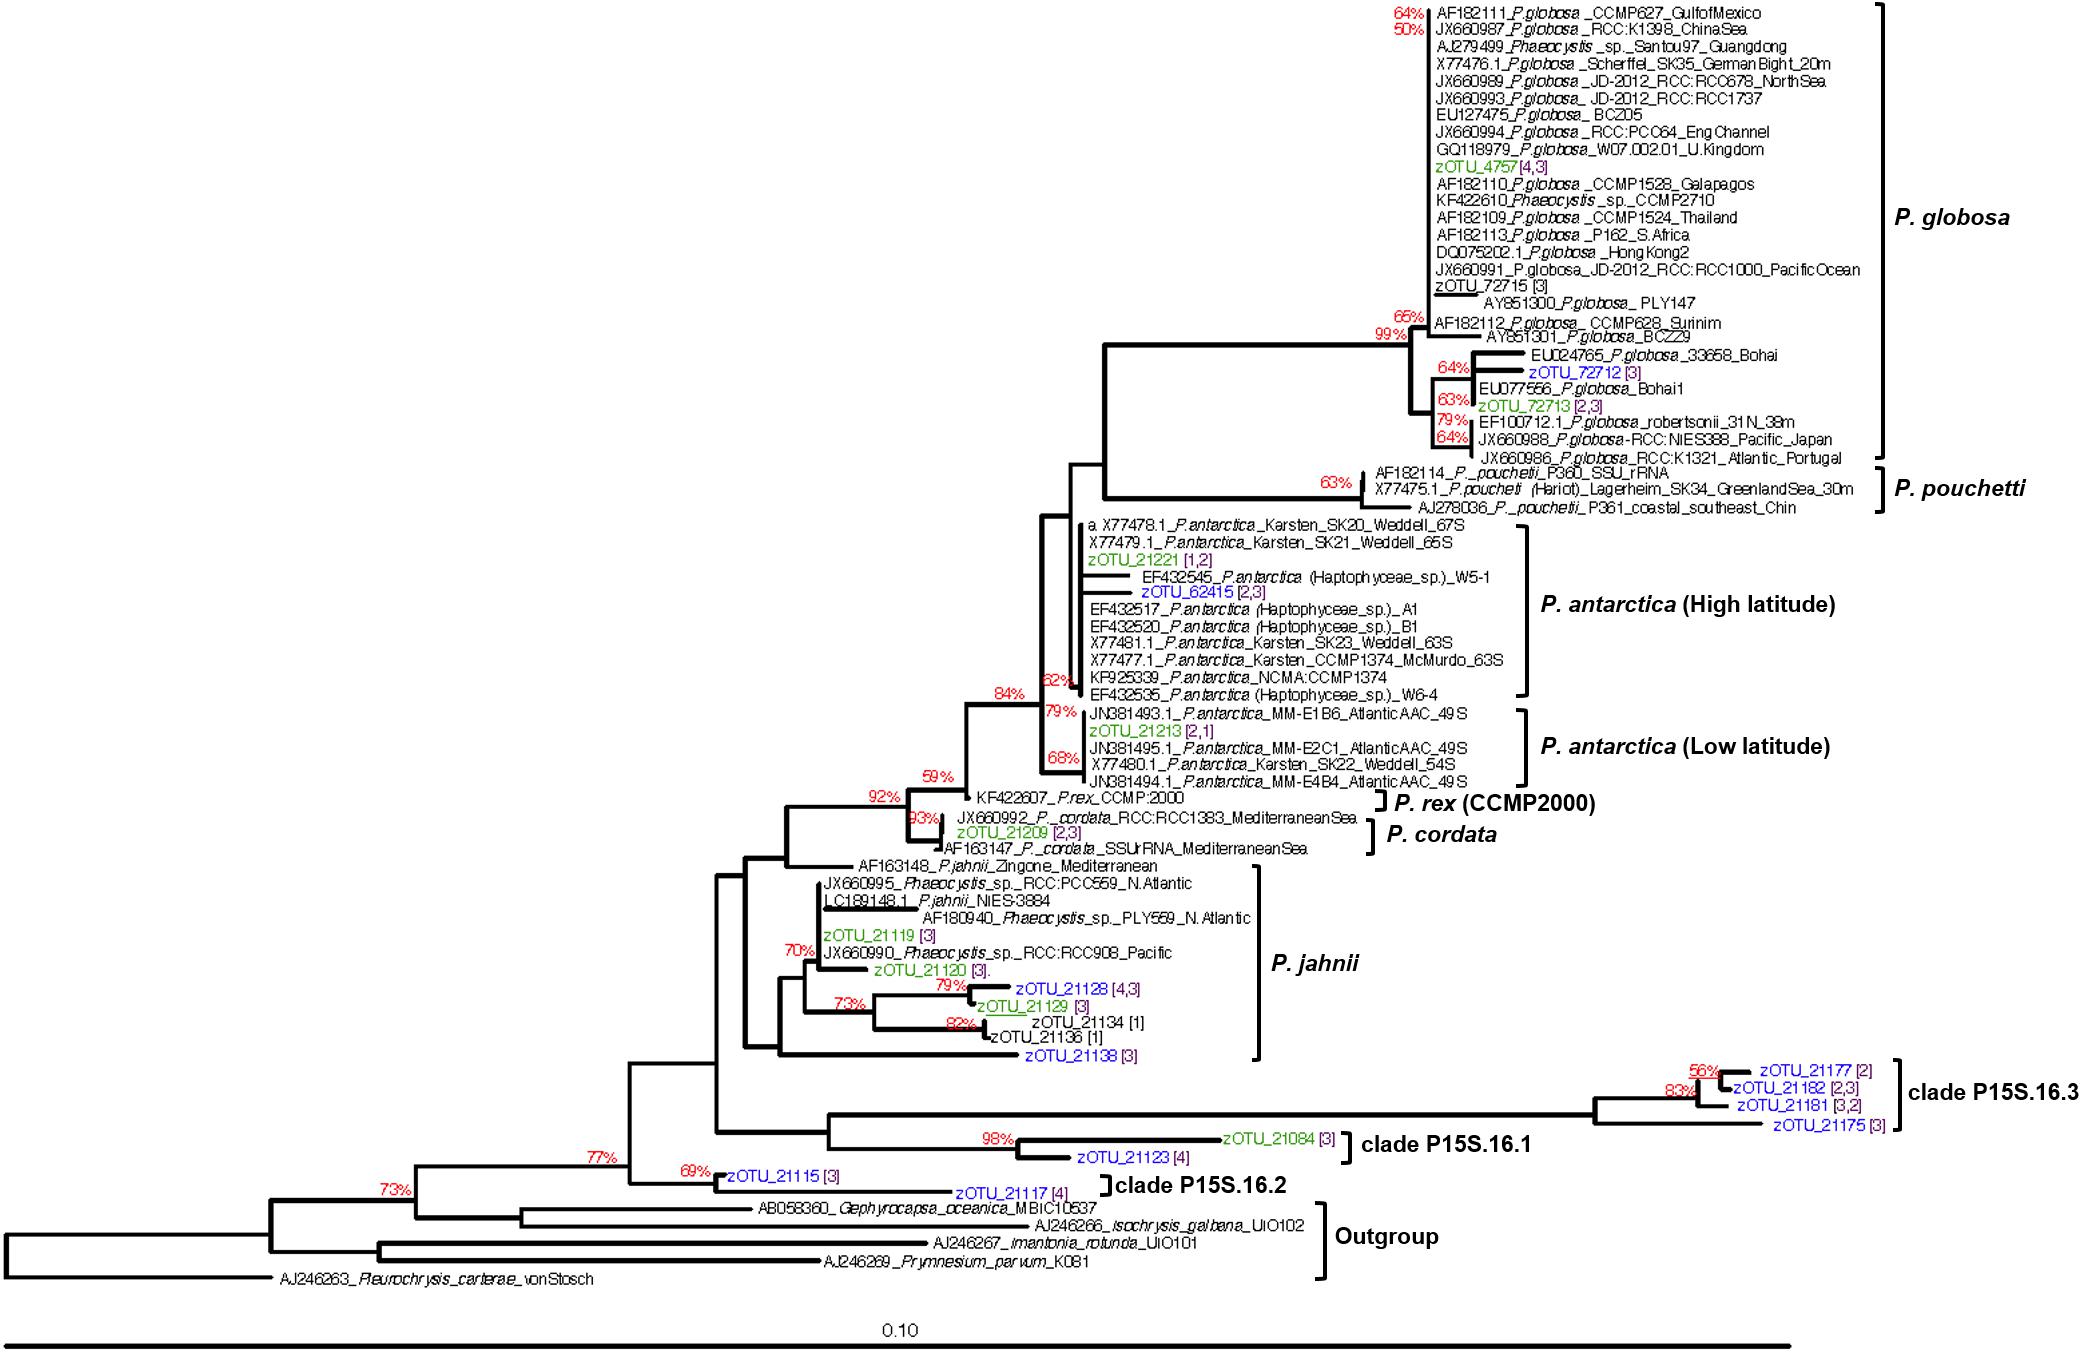
Figure 5. Neighbor-joining tree of abundant Phaeocystis zOTUs clustered against other known Phaeocystis 18S rRNA gene sequences. Sequences in green are high-abundance (>1% relative abundance) zOTUs, while sequences in blue are mid-abundance (0.1–0.99% relative abundance) zOTUs from this study. Bootstrap values above 50% are indicated at the branches in red. To more easily identify the regions where our Phaeocystis zOTUs originated from, we established the following four categories of regions – (1) Antarctic (65–55°S); (2) subantarctic (55–45°S); (3) mid-latitudes (45–15°S); (4) low-latitudes (15°S–0°). Numbers in purple and square parenthesis indicate the region the zOTU was detected. Where more than one number is indicated, the first number indicates the region where higher abundances of that zOTU was detected.
Discussion
While numerous reports have documented Phaeocystis as a ubiquitous phytoplankton within the Southern Ocean and southern hemisphere during its peak blooming seasons (Arrigo et al., 1999; DiTullio et al., 2000, 2003; Smith et al., 2000; Vogt et al., 2012; Eriksen et al., 2018), there is an evident lack of studies dedicated to understanding the ecology and distribution of this prevalent phytoplankton throughout the rest of the year (i.e., austral autumn-winter). Most studies are also localized around small latitudinal ranges and centered around the colonial stages of Phaeocystis, e.g., Arrigo et al. (1999), Alderkamp et al. (2012), Mills et al. (2012), Delmont et al. (2014). There has been an increasing number of studies utilizing various techniques (microscopy, algal pigments, marker genes) to investigate the global marine plankton [e.g., de Vargas et al. (2015), Swan et al. (2016), Carradec et al. (2018), Righetti et al. (2020)] and Phaeocystis (Vogt et al., 2012) distributions. de Vargas et al. (2015) and Carradec et al. (2018) found significant numbers of Phaeocystis through gene analysis in the TARA Oceans Expedition, while Estrada et al. (2016) in the Malaspina Expedition did not identify sufficient numbers of Phaeocystis to be identified by microscopy. While the global CHEMTAX (Mackey et al., 1996) database established by Swan et al. (2016) analyzed phytoplankton seasonal climatologies, the method fell short due to the variable pigment composition of Phaeocystis species (van Leeuwe and Stefels, 1998; van Leeuwe et al., 2014). Despite the advent of global Phaeocystis and phytoplankton distribution reports and databases, Phaeocystis investigations remain under-represented especially in higher latitudes of the Southern Hemisphere [e.g., Vogt et al. (2012), Endo et al. (2018), Righetti et al. (2020)] and were also biased toward the summer in many cases.
Phaeocystis antarctica has previously been shown to harbor physiological adaptations to successfully survive the cold, extreme conditions of austral winters (Tang et al., 2009). Our study corroborates this, as demonstrated by a high proportion of P. antarctica relative to the rest of the eukaryote community (up to ∼ 8.6%) across multiple latitudes, showing Phaeocystis to be a major phytoplankton in high latitudes during the autumn-winter months as well. During the voyage, a Phaeocystis bloom was also opportunistically sighted at approximately 56°S and visually confirmed under the microscope from ship underway samples, suggestive of an active Phaeocystis assemblage (Raes et al., 2018). Blooms were not consistently sighted throughout and south of the subantarctic zone of this transect, but high relative abundance of Phaeocystis 18S rRNA gene sequences (up to 9% of the microbial eukaryotes per sample) within this region suggests dominance in either colonial and/or solitary cell forms that persist during the colder austral months. Furthermore, 18S rRNA gene sequence of the most abundant P. antarctica zOTU (zOTU_21221) showed a 100% sequence identity to an abundant, high-latitude P. antarctica 18S rRNA gene sequence detected during a summer Southern Ocean transect close to the Totten Glacier (Sow et al., unpublished). This suggests that what we are observing is the same summer P. antarctica assemblage harboring cold-adaptation strategies to maintain abundance over the colder months as opposed to succession by a different autumn-winter P. antarctica clade.
Our dataset also clearly demonstrates that oceanographic fronts, particularly the polar front and subantarctic front were strong ecological boundaries that structured the Phaeocystis assemblage composition. Previous studies have reported variable responses amongst P. antarctica clones to iron and light stress (Luxem et al., 2017). As environmental conditions vary substantially between frontal zones (Figure 2), the marked change in the dominant P. antarctica zOTU north of the SAF-M suggests that the concept of varying ecotypes of P. antarctica may exist as previously suggested (Lange et al., 2002; Medlin and Zingone, 2007), with differing nutrient, micronutrient or physicochemical requirements amongst ecotypes. This is supported by the clustering of zOTU_21221 with P. antarctica reference sequences previously isolated from high-latitude environments, while zOTU_21213 clustered with P. antarctica isolated from a lower latitude, subantarctic region (Figure 5). The distinct increase in abundance of P. antarctica zOTU_21213 over P. antarctica zOTU_21221 north of the PF followed by the dominance of P. antarctica zOTU_21213 past SAZ-M (Figure 4A) suggests that the PFZ may be a transition zone with environmental conditions that are in between optimal conditions for the co-existence of the two different P. antarctica zOTUs. This delineation of Phaeocystis by oceanographic features was not limited to its most dominant species, since the mid- to low-abundance assemblage also displayed distinct patterns of frontal delineation (Figure 4B).
Our previous work showed that microbial eukaryote richness peaked at the least productive tropical oligotrophic region and that there was a high presence of Phaeocystis in the Southern Ocean and STF region (Raes et al., 2018). This study showed that Phaeocystis diversity and distribution was in-line with those observed of the overall epipelagic microbial eukaryotes in the P15S line. With several exceptions, the latitudinal diversity gradient (i.e., increased species richness from higher to lower latitude environments) have been thought to apply to most major groups of terrestrial and surface marine taxa (Pianka, 1966; Gaston, 2000; Hillebrand, 2004; Ibarbalz et al., 2019). However, a recent re-evaluation has challenged this (Chaudhary et al., 2016), and there is still debate on whether the theory applies to smaller eukaryotes and prokaryotes (Tittensor et al., 2010). Our findings showed that Phaeocystis species richness did not follow the typical latitudinal diversity gradient – richness increased northwards from the pole up to the STOG zone, but peaked at ∼30°S and decreased after that to its lowest point at ∼5°S within the EQ-U zone. This was similar to the trend reported by Chaudhary et al. (2016), who found a dip in species richness close to the equator for a large majority of the 65,000 marine species they re-examined. On the contrary, Ibarbalz et al. (2019) in their recent study of global marine plankton diversity trends based on the Tara Oceans dataset observed the more classical latitudinal diversity gradient of increased species richness toward the equator (mainly attributed to increasing ocean temperatures). They did not observe the dip in species richness close to the equator, though we note that their study examined haptophytes in general and that the latitudinal diversity gradient trend might have been influenced by significant under-sampling of the mid to high latitudes in the southern hemisphere part of their dataset (Ibarbalz et al., 2019). Endo et al. (2018) reported a relatively constant diversity of haptophytes (with large proportions of Phaeocystis) across high to low latitudes in the Pacific (i.e., a gradual diversity gradient). However, their study examined diversity gradients of haptophytes as a whole (which may not reflect the exact trend of Phaeocystis), and the diversity gradient trends were observed mostly in the northern hemisphere on summer transects.
The increase in richness from polar waters northward to 30°S was completely reversed between 30°S and the equator, but the reversed (decrease) in richness occurred without any change in Phaeocystis proportion within the eukaryote population (Figures 3, 4). This suggests that the latitudinal diversity gradient is not monotonic, in contrast to surface temperature (Figure 2A) and thus other factors such as upwelling of nutrients (e.g., NOx; Figure 2E) are likely to be influential.
We also observed a distinct pattern of few winners (low richness) in regions with a thriving assemblage (i.e., high relative abundance at the higher latitudes) and high diversities (high richness) in regions with a struggling assemblage (low abundance) (Figure 4). This could be explained by several theories. Phaeocystis blooms require the support of nutrients (van Boekel et al., 1992). Nitrate and phosphate are enriched at higher latitudes (Levitus et al., 1993), which could explain the general prevalence of blooms at high latitudes (Long et al., 2007). In contrast, low nitrate levels within mid-low latitude environments do not encourage bloom formation, and it is likely that most Phaeocystis within this region would be free-living. Blooms (colonial forms) of Phaeocystis are less vulnerable to predation and viral lysis (Hamm et al., 1999; Hamm, 2000). This suggests it would be more likely for high-latitude Phaeocystis (e.g., P. antarctica) with adequate nutrient support for bloom formation to be less liable to predation, hence able to proliferate to high relative abundances (note that this interpretation assumes the iron availability is sufficient to allow Phaeocystis bloom formation, even though it is considered to be the limiting nutrient for overall phytoplankton productivity in the Southern Ocean). In contrast, mid to low latitude Phaeocystis, likely in free-living form, are more liable to viral predation. Hence, it is likely that Phaeocystis inhabitants here are prevented from increasing to high abundances even if higher temperatures within the lower latitude regions may suit a wider range of Phaeocystis species (i.e., increased richness). Viral predation also appears to be strain specific, with previously isolated strains found to infect only P. globosa (Schoemann et al., 2005) and P. pouchetti (Bratbak et al., 1998). Interestingly, besides recent reports of a virus predicted to be capable of infecting P. antarctica (Alarcon-Schumacher et al., 2019), no virus confirmed to infect P. antarctica has been isolated thus far. Finally, less species can tolerate the extreme environmental conditions (e.g., low temperatures) or increased variation of climatic conditions at higher latitudes (i.e., climate harshness/stability hypothesis) (Currie et al., 2004). This may translate to reduced competition at higher latitudes (Amend et al., 2013), allowing surviving species (e.g., P. antarctica) to flourish/dominate. The Phaeocystis genus, particularly in its free-living form, is known to have a cosmopolitan distribution but exists as distinct species across diverse marine environments (Baumann et al., 1994; Schoemann et al., 2005). As observed within our study, P. antarctica is the prevailing species within high latitude southern hemisphere waters (Figure 4 and Supplementary Table S3) given it has available adaptation strategies to lower temperatures (Medlin et al., 1994). However, it is interesting that P. globosa, while not dominant, was detected at moderate abundances within the southern SAZ and STF (Figure 4). While P. globosa has been observed in temperate and tropical waters (Chen et al., 2003; Schoemann et al., 2005; Rousseau et al., 2013), its occurrence has, to the best of our knowledge, never been reported within temperate waters of the southern hemisphere. The detection of P. cordata within southern SAZ and STF (Figure 4) is also surprising, as this is a species that has also thus far only been detected within northern hemisphere waters, first in the Mediterranean Sea (Zingone et al., 1999) and later also in parts of the Indian Ocean and Red Sea (Decelle et al., 2012; Figure 5). This observation suggests that Phaeocystis may be more cosmopolitan and diverse than previously thought, and widely dispersed ecotypes of P. globosa and P. cordata may be present that was previously undiscovered due to under-sampling or limited molecular genetics studies of this species.
The GO-SHIP P15S is a decadal repeat hydrography transect that has previously been conducted several times (Talley et al., 2016). Comparing the chlorophyll a profile in this study (Figure 2D) to those from a previous summer occupation of the P15S line (year 1996), peak chlorophyll a values were observed in the STZ in both our study and the summer transect, but in the PFZ peak chlorophyll a values were only observed in the summer (DiTullio et al., 2003). Using CHEMTAX of algal pigments, DiTullio et al. (2003) detected Phaeocystis (as type 4 haptophytes) in the PFZ, STZ and equatorial zone, however, their study did not further differentiate Phaeocystis distribution at the species level. In terms of temporal variability in Phaeocystis species abundance and distribution, a direct comparison between the earlier P15S summer occupation with this autumn/winter transect would be challenging, since the methods used to classify Phaeocystis between the studies were different. The CHEMTAX Phaeocystis classification used by DiTullio et al. (2003) was based on the general assumption that Phaeocystis expressed more equal ratios of fucoxanthin (fuco), 19′-butanoyloxyfucoxanthin (19but) and 19′-hexanoyloxyfucoxanthin (19hex). This method may not have conclusively determined all Phaeocystis since, as mentioned above, Phaeocystis are known to express variable pigment composition due to variations in environmental conditions (van Leeuwe and Stefels, 1998; Swan et al., 2016). The method may also have also accounted for other phytoplankton that shared similar diagnostic pigments or missed species of Phaeocystis that express different ratios of pigments (Schoemann et al., 2005).
Phaeocystis have been previously discovered to form photosymbiotic associations with Acantharia, an abundant open ocean zooplankton, at multiple locations across the global oceans including the Drake Passage sector of the Southern Ocean (Decelle et al., 2012; de Vargas et al., 2015). This has been suggested to be a potentially important ecological adaptation strategy for heterotrophic organisms to maintain their abundance in surface open ocean waters. In our study, Acantharia were only detected at very low relative abundances, ranging between 0.01 and 0.6% of all microbial eukaryotes and were primarily unclassified Acantharia (data not shown). Higher abundances of Acantharia were detected in deeper mesopelagic waters (data not shown). This indicated that Acantharia-Phaeocystis photosymbiosis may be a less important mode of adaptation to oligotrophic surface waters in the Southwest Pacific, or that the photosymbiotic association could be seasonally influenced and less prevalent during the austral autumn-winter.
Conclusion
This high-resolution marker gene survey has shown that Phaeocystis, a key summer bloom-forming phytoplankton species within the Southern Ocean is also highly abundant during the autumn-winter months. The high diversity of the Phaeocystis genus was strongly partitioned at species level by oceanic fronts acting as ecological boundaries, and the study re-confirmed that the polar and subantarctic fronts are major ecological boundaries in microbial distribution and abundance. P. globosa and P. cordata, species previously thought to only prevail in the northern hemisphere were detected within this study, indicating that these organisms are more cosmopolitan than previously understood. Further molecular exploration of this genus, particularly in its non-colonial forms should be a key consideration to better understand its seasonal variability, environmental drivers and ecological interactions with other microbes, in efforts to better understand its potential response to climate change and the cascading effects toward the broader marine ecosystem.
Data Availability Statement
The datasets presented in this study can be found in online repositories. The names of the repository/repositories and accession number(s) can be found in the article/ Supplementary Material.
Author Contributions
SS collected the samples, planned and executed the experiments, analyzed the data, prepared figures and tables, and wrote the manuscript. LB and TT contributed to the planning of the field program, analyzed and interpreted the data, and reviewed and refined the manuscript.
Funding
This work was funded by an OCE Science Leader Fellowship (R-04202) to LB, as well as a Tasmanian Graduate Research Scholarship, CSIRO Postgraduate Scholarship, and University of Tasmania Write-up Scholarship to SS. We would like to acknowledge the contribution of the Marine Microbes consortium in the generation of data used in this publication. The Marine Microbes project was supported by funding from Bioplatforms Australia and the Integrated Marine Observing System (IMOS) through the Australian Government National Collaborative Research Infrastructure Strategy (NCRIS) in partnership with the Australian research community, and the CSIRO.
Conflict of Interest
The authors declare that the research was conducted in the absence of any commercial or financial relationships that could be construed as a potential conflict of interest.
Acknowledgments
We would like to thank members of field teams, shipboard crews, and logistics support personnel from the CSIRO, Australian Marine National Facility and R/V Investigator involved in sample collection. We thank Drs. Bernadette Sloyan and Susan Wijffels for giving us the opportunity to sample on the GO-SHIP P15S voyage; Dr. Eric Raes, Dr. Nicole Hellessey, Gabriela Paniagua Cabarrus, and Dr. Bernhard Tschitschko for their sampling assistance; Bronwyn Holmes for her assistance in the laboratory; and Drs. Andrew Bissett and Jodie van de Kamp for their assistance in bioinformatics analyses. We would also like to thank Drs. Kristen Karsh and Ruth Eriksen for their helpful pointers and suggestions during the initial conception of this manuscript, and Profs. Philip Boyd, Andrew Holmes, and Yin Chen for their constructive feedback on the manuscript.
Supplementary Material
The Supplementary Material for this article can be found online at: https://www.frontiersin.org/articles/10.3389/fmicb.2020.01847/full#supplementary-material
Footnotes
- ^ http://www.go-ship.org
- ^ http://www.teos-10.org/
- ^ https://cchdo.ucsd.edu/cruise/096U20160426
- ^ https://www.ramaciotti.unsw.edu.au/
- ^ https://www.bioplatforms.com/projects/australian-microbiome/
- ^ https://data.bioplatforms.com/organization/pages/australian-microbiome/methods
- ^ https://data.bioplatforms.com/organization/about/australian-microbiome
- ^ https://www.ncbi.nlm.nih.gov/bioproject/PRJNA385736
References
Achterberg, E. P. (2014). Grand challenges in marine biogeochemistry. Front. Mar. Sci. 1:7. doi: 10.3389/fmars.2014.00007
Alarcon-Schumacher, T., Guajardo-Leiva, S., Anton, J., and Diez, B. (2019). Elucidating viral communities during a phytoplankton bloom on the West Antarctic Peninsula. Front. Microbiol. 10:1014. doi: 10.3389/fmicb.2019.01014
Alderkamp, A.-C., Mills, M. M., van Dijken, G. L., Laan, P., Thuróczy, C.-E., Gerringa, L. J. A., et al. (2012). Iron from melting glaciers fuels phytoplankton blooms in the Amundsen Sea (Southern Ocean): phytoplankton characteristics and productivity. Deep Sea Res. II Top. Stud. Oceanogr. 7, 32–48. doi: 10.1016/j.dsr2.2012.03.005
Amend, A. S., Oliver, T. A., Amaral-Zettler, L. A., Boetius, A., Fuhrman, J. A., Horner-Devine, M. C., et al. (2013). Macroecological patterns of marine bacteria on a global scale. J. Biogeogr. 40, 800–811. doi: 10.1111/jbi.12034
Appleyard, S., Abell, G., and Watson, R. (2013). “Tackling microbial related issues in cultured shellfish via integrated molecular and water chemistry approaches,” in Seafood CRC Final Report (2011/729), (Deakin: Australian Seafood Cooperative Research Centre).
Arrigo, K. R., Robinson, D. H., Worthen, D. L., Dunbar, R. B., DiTullio, G. R., VanWoert, M., et al. (1999). Phytoplankton community structure and the drawdown of nutrients and CO2 in the Southern Ocean. Science 283:365. doi: 10.1126/science.283.5400.365
Baumann, M. E. M., Lancelot, C., Brandini, F. P., Sakshaug, E., and John, D. M. (1994). The taxonomic identity of the cosmopolitan prymnesiophyte Phaeocystis: a morphological and ecophysiological approach. J. Mar. Syst. 5, 5–22. doi: 10.1016/0924-7963(94)90013-2
Bratbak, G., Jacobsen, A., and Heldal, M. (1998). Viral lysis of Phaeocystis pouchetii and bacterial secondary production. Aquat. Microb. Ecol. 16, 11–16. doi: 10.3354/ame016011
Brayard, A., Escarguel, G., and Bucher, H. (2005). Latitudinal gradient of taxonomic richness: combined outcome of temperature and geographic mid-domains effects? J. Zool. Syst. Evol. Res. 43, 178–188. doi: 10.1111/j.1439-0469.2005.00311.x
Brown, M. V., Lauro, F. M., DeMaere, M. Z., Muir, L., Wilkins, D., Thomas, T., et al. (2012). Global biogeography of SAR11 marine bacteria. Mol. Syst. Biol. 8:595. doi: 10.1038/msb.2012.28
Brown, M. V., van de Kamp, J., Ostrowski, M., Seymour, J. R., Ingleton, T., Messer, L. F., et al. (2018). Systematic, continental scale temporal monitoring of marine pelagic microbiota by the Australian marine microbial biodiversity initiative. Sci. Data 5:180130. doi: 10.1038/sdata.2018.130
Burrows, M. T., Schoeman, D. S., Buckley, L. B., Moore, P., Poloczanska, E. S., Brander, K. M., et al. (2011). The pace of shifting climate in marine and terrestrial ecosystems. Science 334, 652–655. doi: 10.1126/science.1210288
Carradec, Q., Pelletier, E., Da Silva, C., Alberti, A., Seeleuthner, Y., Blanc-Mathieu, R., et al. (2018). A global ocean atlas of eukaryotic genes. Nat. Commun. 9:373. doi: 10.1038/s41467-017-02342-1
Chaudhary, C., Saeedi, H., and Costello, M. J. (2016). Bimodality of latitudinal gradients in marine species richness. Trends Ecol. Evol. 31, 670–676. doi: 10.1016/j.tree.2016.06.001
Chaudhary, C., Saeedi, H., and Costello, M. J. (2017). Marine species richness is bimodal with latitude: a reply to fernandez and marques. Trends Ecol. Evol. 32, 234–237. doi: 10.1016/j.tree.2017.02.007
Chen, Y., Peng, S., Ning, W., Hui, Z., Lianghu, Q., and Medlin, L. (2003). Molecular identification of a bloom-forming species Phaeocystis globosa (Prymnesiophyta) and its dispersal based on rDNA ITS sequence analysis. Acta Oceanol. Sin. 22, 243–253.
Chiba, S., Ishimaru, T., Hosie, G. W., and Fukuchi, M. (2001). Spatio-temporal variability of zooplankton community structure off east Antarctica (90 to 160°E). Mar. Ecol. Prog. Ser. 216, 95–108. doi: 10.3354/meps216095
Currie, D. J., Mittelbach, G. G., Cornell, H. V., Field, R., Guegan, J.-F., Hawkins, B. A., et al. (2004). Predictions and tests of climate-based hypotheses of broad-scale variation in taxonomic richness. Ecol. Lett. 7, 1121–1134. doi: 10.1111/j.1461-0248.2004.00671.x
de Vargas, C., Audic, S., Henry, N., Decelle, J., Mahé, F., Logares, R., et al. (2015). Eukaryotic plankton diversity in the sunlit ocean. Science 348:1261605. doi: 10.1126/science.1261605
Decelle, J., Probert, I., Bittner, L., Desdevises, Y., Colin, S., de Vargas, C., et al. (2012). An original mode of symbiosis in open ocean plankton. Proc. Natl. Acad. Sci. U.S.A. 109, 18000–18005. doi: 10.1073/pnas.1212303109
Delmont, T. O., Hammar, K. M., Ducklow, H. W., Yager, P. L., and Post, A. F. (2014). Phaeocystis antarctica blooms strongly influence bacterial community structures in the Amundsen Sea polynya. Front. Microbiol. 5:646. doi: 10.3389/fmicb.2014.00646
DiTullio, G. R., Geesey, M. E., Jones, D. R., Daly, K. L., Campbell, L., and Smith, W. O. J. (2003). Phytoplankton assemblage structure and primary productivity along 170°W in the South Pacific Ocean. Mar. Ecol. Prog. Ser. 255, 55–80. doi: 10.3354/meps255055
DiTullio, G. R., Grebmeier, J. M., Arrigo, K. R., Lizotte, M. P., Robinson, D. H., Leventer, A., et al. (2000). Rapid and early export of Phaeocystis antarctica blooms in the Ross Sea, Antarctica. Nature 404, 595–598. doi: 10.1038/35007061
Edgar, R. C. (2004). MUSCLE: multiple sequence alignment with high accuracy and high throughput. Nucleic Acids Res. 32, 1792–1797. doi: 10.1093/nar/gkh340
Edgar, R. C. (2016). UNOISE2: improved error-correction for Illumina 16S and ITS amplicon sequencing. bioRxiv [Preprint]. doi: 10.1101/081257
Edgar, R. C. (2018). Updating the 97% identity threshold for 16S ribosomal RNA OTUs. Bioinformatics 34, 2371–2375. doi: 10.1101/192211
El-Sayed, S. Z., Biggs, D. C., and Holm-Hansen, O. (1983). Phytoplankton standing crop, primary productivity, and near-surface nitrogenous nutrient fields in the Ross Sea, Antarctica. Deep Sea Res. A Oceanogr. Res. Pap. 30, 871–886. doi: 10.1016/0198-0149(83)90005-5
Endo, H., Ogata, H., and Suzuki, K. (2018). Contrasting biogeography and diversity patterns between diatoms and haptophytes in the central Pacific Ocean. Sci. Rep. 8:10916. doi: 10.1038/s41598-018-29039-9
Eriksen, R., Trull, T. W., Davies, D., Jansen, P., Davidson, A. T., Westwood, K., et al. (2018). Seasonal succession of phytoplankton community structure from autonomous sampling at the Australian Southern Ocean Time Series (SOTS) observatory. Mar. Ecol. Prog. Ser. 589, 13–31. doi: 10.3354/meps12420
Esper, O., and Zonneveld, K. A. F. (2002). Distribution of organic-walled dinoflagellate cysts in surface sediments of the Southern Ocean (eastern Atlantic sector) between the Subtropical Front and the Weddell Gyre. Mar. Micropaleontol. 46, 177–208. doi: 10.1016/S0377-8398(02)00041-5
Estrada, M., Delgado, M., Blasco, D., Latasa, M., Cabello, A. M., Benitez-Barrios, V., et al. (2016). Phytoplankton across tropical and subtropical regions of the Atlantic, Indian and Pacific Oceans. PLoS One 11:e0151699. doi: 10.1371/journal.pone.0151699
Finlay, B. J. (2002). Global dispersal of free-living microbial Eukaryote Species. Science 296, 1061–1063. doi: 10.1126/science.1070710
Fuhrman, J. A., Steele, J. A., Hewson, I., Schwalbach, M. S., Brown, M. V., Green, J. L., et al. (2008). A latitudinal diversity gradient in planktonic marine bacteria. Proc. Natl. Acad. Sci. U.S.A. 105, 7774–7778. doi: 10.1073/pnas.0803070105
Gilbert, J. A., Steele, J. A., Caporaso, J. G., Steinbruck, L., Reeder, J., Temperton, B., et al. (2012). Defining seasonal marine microbial community dynamics. ISME J. 6, 298–308. doi: 10.1038/ismej.2011.107
Grzymski, J. J., Riesenfeld, C. S., Williams, T. J., Dussaq, A. M., Ducklow, H., Erickson, M., et al. (2012). A metagenomic assessment of winter and summer bacterioplankton from Antarctica Peninsula coastal surface waters. ISME J. 6, 1901–1915. doi: 10.1038/ismej.2012.31
Guillou, L., Bachar, D., Audic, S., Bass, D., Berney, C., Bittner, L., et al. (2013). The protist ribosomal reference database (PR2): a catalog of unicellular eukaryote small sub-unit rRNA sequences with curated taxonomy. Nucleic Acids Res. 41, D597–D604. doi: 10.1093/nar/gks1160
Hamm, C. E. (2000). Architecture, ecology and biogeochemistry of Phaeocystis colonies. J. Sea Res. 43, 307–315. doi: 10.1016/S1385-1101(00)00014-9
Hamm, C. E., Simson, D. A., Rudolf, M., and Smetacek, V. (1999). Colonies of Phaeocystis globosa are protected by a thin but tough skin. Mar. Ecol. Prog. Ser. 187, 101–111. doi: 10.3354/meps187101
Hermans, S. M., Buckley, H. L., and Lear, G. (2019). Perspectives on the impact of sampling design and intensity on soil microbial diversity estimates. Front. Microbiol. 10:1820. doi: 10.3389/fmicb.2019.01820
Hillebrand, H. (2004). On the generality of the latitudinal diversity gradient. Am. Nat. 163, 192–211. doi: 10.1086/381004
Hunt, B. P. V., Pakhomov, E. A., and McQuaid, C. D. (2001). Short-term variation and long-term changes in the oceanographic environment and zooplankton community in the vicinity of a sub-Antarctic archipelago. Mar. Biol. 138, 369–381. doi: 10.1007/s002270000467
Hutchins, D. A., and Fu, F. (2017). Microorganisms and ocean global change. Nat. Microbiol. 2:17058. doi: 10.1038/nmicrobiol.2017.58
Ibarbalz, F. M., Henry, N., Brandao, M. C., Martini, S., Busseni, G., Byrne, H., et al. (2019). Global trends in marine plankton diversity across kingdoms of life. Cell 179:e1021. doi: 10.1016/j.cell.2019.10.008
Ladau, J., Sharpton, T. J., Finucane, M. M., Jospin, G., Kembel, S. W., O’Dwyer, J., et al. (2013). Global marine bacterial diversity peaks at high latitudes in winter. ISME J. 7, 1669–1677. doi: 10.1038/ismej.2013.37
Lange, M., Chen, Y.-Q., and Medlin, L. K. (2002). Molecular genetic delineation of Phaeocystis species (Prymnesiophyceae) using coding and non-coding regions of nuclear and plastid genomes. Eur. J. Phycol. 37, 77–92. doi: 10.1017/S0967026201003481
Lemoine, N. (2015). EcoPy – Ecological Data Analysis in Python. 0.1.3. Available online at: https://ecopy.readthedocs.io/en/latest/index.html# (accessed February 13, 2019).
Levitus, S., Conkright, M. E., Reid, J. L., Najjar, R. G., and Mantyla, A. (1993). Distribution of nitrate, phosphate and silicate in the world oceans. Prog. Oceanogr. 31, 245–273. doi: 10.1016/0079-6611(93)90003-V
Li, K., Bihan, M., and Methe, B. A. (2013). Analyses of the stability and core taxonomic memberships of the human microbiome. PLoS One 8:e63139. doi: 10.1371/journal.pone.0063139
Long, J. D., Frischer, M. E., and Robertson, C. Y. (2007). A Phaeocystis globosa bloom associated with upwelling in the subtropical South Atlantic Bight. J. Plankton Res. 29, 769–774. doi: 10.1093/plankt/fbm058
Ludwig, W., Strunk, O., Westram, R., Richter, L., Meier, H., Yadhukumar, A. B., et al. (2004). ARB: a software environment for sequence data. Nucleic Acids Res. 32, 1363–1371. doi: 10.1093/nar/gkh293
Luxem, K. E., Ellwood, M. J., and Strzepek, R. F. (2017). Intraspecific variability in Phaeocystis antarctica’s response to iron and light stress. PLoS One 12:e0179751. doi: 10.1371/journal.pone.0179751
Mackey, M. D., Mackey, D. J., Higgins, H. W., and Wright, S. W. (1996). CHEMTAX – a program for estimating class abundances from chemical markers: application to HPLC measurements of phytoplankton. Mar. Ecol. Prog. Ser. 144, 265–283. doi: 10.3354/meps144265
Medlin, L., and Zingone, A. (2007). A taxonomic review of the genus Phaeocystis. Biogeochemistry 83, 3–18. doi: 10.1007/s10533-007-9087-1
Medlin, L. K., Lange, M., and Baumann, M. E. M. (1994). Genetic differentiation among three colony-forming species of Phaeocystis: further evidence for the phylogeny of the Prymnesiophyta. Phycologia 33, 199–212. doi: 10.2216/i0031-8884-33-3-199.1
Meyer, K. M., Memiaghe, H., Korte, L., Kenfack, D., Alonso, A., and Bohannan, B. J. M. (2018). Why do microbes exhibit weak biogeographic patterns? ISME J. 12, 1404–1413. doi: 10.1038/s41396-018-0103-3
Mills, M. M., Alderkamp, A.-C., Thuróczy, C.-E., van Dijken, G. L., Laan, P., de Baar, H. J. W., et al. (2012). Phytoplankton biomass and pigment responses to Fe amendments in the Pine Island and Amundsen polynyas. Deep Sea Res. II Top. Stud. Oceanogr. 7, 61–76. doi: 10.1016/j.dsr2.2012.03.008
Oksanen, J., Blanchet, F. G., Friendly, M., Kindt, R., Legendre, P., McGlinn, D., et al. (2018). vegan: Community Ecology R package. 2.5-2. Available online at: https://CRAN.R-project.org/package=vegan (accessed September 1, 2019).
Orsi, A. H., Whitworth, T., and Nowlin, W. D. (1995). On the meridional extent and fronts of the Antarctic circumpolar current. Deep Sea Res. I Oceanogr. Res. Pap. 42, 641–673. doi: 10.1016/0967-0637(95)00021-W
Parada, A. E., and Fuhrman, J. A. (2017). Marine archaeal dynamics and interactions with the microbial community over 5 years from surface to seafloor. ISME J. 11, 2510–2525. doi: 10.1038/ismej.2017.104
Pianka, E. R. (1966). Latitudinal gradients in species diversity: a review of concepts. Am. Nat 100, 33–46. doi: 10.1086/282398
Pommier, T., Canback, B., Riemann, L., Bostrom, K. H., Simu, K., Lundberg, P., et al. (2007). Global patterns of diversity and community structure in marine bacterioplankton. Mol. Ecol. 16, 867–880. doi: 10.1111/j.1365-294X.2006.03189.x
Powell, M. G., Beresford, V. P., and Colaianne, B. A. (2012). The latitudinal position of peak marine diversity in living and fossil biotas. J. Biogeogr. 39, 1687–1694. doi: 10.1111/j.1365-2699.2012.02719.x
R Core Team (2018). R: A Language and Environment for Statistical Computing. Available online at: https://www.R-project.org/ (accessed June 22, 2020).
Raes, E. J., Bodrossy, L., van de Kamp, J., Bissett, A., Ostrowski, M., Brown, M. V., et al. (2018). Oceanographic boundaries constrain microbial diversity gradients in the South Pacific Ocean. Proc. Natl. Acad. Sci. U.S.A. 115, E8266–E8275. doi: 10.1073/pnas.1719335115
Raes, E. J., Clementson, L., Bodrossy, L., Strutton, P., and Waite, A. M. (2017). Data from: physical and biochemical data and C-fixation rates in surface waters along 170°W (South Pacific Ocean) in 2016. PANGAEA doi: 10.1594/PANGAEA.884007
Righetti, D., Vogt, M., Zimmermann, N. E., Guiry, M. D., and Gruber, N. (2020). PhytoBase: a global synthesis of open-ocean phytoplankton occurrences. Earth Syst. Sci. Data 12, 907–933. doi: 10.5194/essd-12-907-2020
Rousseau, V., Lantoine, F., Rodriguez, F., LeGall, F., Chrétiennot-Dinet, M.-J., and Lancelot, C. (2013). Characterization of Phaeocystis globosa (Prymnesiophyceae), the blooming species in the Southern North Sea. J. Sea Res. 76, 105–113. doi: 10.1016/j.seares.2012.07.011
Salter, I., Galand, P. E., Fagervold, S. K., Lebaron, P., Obernosterer, I., Oliver, M. J., et al. (2015). Seasonal dynamics of active SAR11 ecotypes in the oligotrophic Northwest Mediterranean Sea. ISME J. 9, 347–360. doi: 10.1038/ismej.2014.129
Sarmiento, J. L., Gruber, N., Brzezinski, M. A., and Dunne, J. P. (2004). High-latitude controls of thermocline nutrients and low latitude biological productivity. Nature 427:56. doi: 10.1038/nature02127
Schlitzer, R. (2019). Ocean Data View. v5.1.7. Available online at: https://odv.awi.de (accessed June 3, 2020).
Schloss, P. D., Westcott, S. L., Ryabin, T., Hall, J. R., Hartmann, M., Hollister, E. B., et al. (2009). Introducing mothur: open-source, platform-independent, community-supported software for describing and comparing microbial communities. Appl. Environ. Microbiol. 75, 7537–7541. doi: 10.1128/aem.01541-09
Schoemann, V., Becquevort, S., Stefels, J., Rousseau, V., and Lancelot, C. (2005). Phaeocystis blooms in the global ocean and their controlling mechanisms: a review. J. Sea Res. 53, 43–66. doi: 10.1016/j.seares.2004.01.008
Smith, W. O., Marra, J., Hiscock, M. R., and Barber, R. T. (2000). The seasonal cycle of phytoplankton biomass and primary productivity in the Ross Sea, Antarctica. Deep Sea Res. II Top. Stud. Oceanogr. 47, 3119–3140. doi: 10.1016/S0967-0645(00)00061-8
Sokolov, S., and Rintoul, S. R. (2002). Structure of Southern Ocean fronts at 140°E. J. Mar. Syst. 37, 151–184. doi: 10.1016/s0924-7963(02)00200-2
Stefels, J., and van Leeuwe, M. A. (1998). Effects of iron and light stress on the biochemical composition of Antarctic Phaeocystis sp. (Prymnesiophyceae). I. Intracellular DMSP concentrations. J. Phycol. 34, 486–495. doi: 10.1046/j.1529-8817.1998.340486.x
Stoeck, T., Bass, D., Nebel, M., Christen, R., Jones, M. D. M., Breiner, H.-W., et al. (2010). Multiple marker parallel tag environmental DNA sequencing reveals a highly complex eukaryotic community in marine anoxic water. Mol. Ecol. 19, 21–31. doi: 10.1111/j.1365-294X.2009.04480.x
Swan, C. M., Vogt, M., Gruber, N., and Laufkoetter, C. (2016). A global seasonal surface ocean climatology of phytoplankton types based on CHEMTAX analysis of HPLC pigments. Deep Sea Res. I Oceanogr. Res. Pap. 109, 137–156. doi: 10.1016/j.dsr.2015.12.002
Talley, L. D., Feely, R. A., Sloyan, B. M., Wanninkhof, R., Baringer, M. O., Bullister, J. L., et al. (2016). Changes in ocean heat, carbon content, and ventilation: a review of the first decade of GO-SHIP global repeat hydrography. Ann. Rev. Mar. Sci. 8, 185–215. doi: 10.1146/annurev-marine-052915-100829
Talley, L. D., Pickard, G. L., Emery, W. J., and Swift, J. H. (2011). Descriptive Physical Oceanography. Boston: Elsevier.
Tang, K. W., Smith, W. O. Jr., Shields, A. R., and Elliott, D. T. (2009). Survival and recovery of Phaeocystis antarctica (Prymnesiophyceae) from prolonged darkness and freezing. Proc. Biol. Sci. 276, 81–90. doi: 10.1098/rspb.2008.0598
Tittensor, D. P., Mora, C., Jetz, W., Lotze, H. K., Ricard, D., Berghe, E. V., et al. (2010). Global patterns and predictors of marine biodiversity across taxa. Nature 466, 1098–1101. doi: 10.1038/nature09329
van Boekel, W. H. M., Hansen, F. C., and Bak, R. P. M. (1992). Lysis-induced decline of a Phaeocystis spring bloom and coupling with the microbial foodweb. Mar. Ecol. Prog. Ser. 81, 269–276. doi: 10.3354/meps081269
van Leeuwe, M. A., and Stefels, J. (1998). Effects of iron and light stress on the biochemical composition of Antarctic Phaeocystis sp. (Prymnesiophyceae). II. Pigment Composition. J. Phycol. 34, 496–503. doi: 10.1046/j.1529-8817.1998.340496.x
van Leeuwe, M. A., and Stefels, J. (2007). Photosynthetic responses in Phaeocystis antarctica towards varying light and iron conditions. Biogeochemistry 83, 61–70. doi: 10.1007/s10533-007-9083-5
van Leeuwe, M. A., Visser, R. J., and Stefels, J. (2014). The pigment composition of Phaeocystis antarctica (Haptophyceae) under various conditions of light, temperature, salinity, and iron. J. Phycol. 50, 1070–1080. doi: 10.1111/jpy.12238
Verity, P. G., Brussaard, C. P., Nejstgaard, J. C., van Leeuwe, M. A., Lancelot, C., and Medlin, L. K. (2007). Current understanding of Phaeocystis ecology and biogeochemistry, and perspectives for future research. Biogeochemistry 83, 311–330. doi: 10.1007/s10533-007-9090-6
Vogt, M., O’Brien, C., Peloquin, J., Schoemann, V., Breton, E., Estrada, M., et al. (2012). Global marine plankton functional type biomass distributions: Phaeocystis spp. Earth Syst. Sci. Data 4, 107–120. doi: 10.5194/essd-4-107-2012
Ward, P., Whitehouse, M., Brandon, M., Shreeve, R., and Woodd-Walker, R. (2003). Mesozooplankton community structure across the Antarctic Circumpolar Current to the north of South Georgia: southern ocean. Mar. Biol. 143, 121–130. doi: 10.1007/s00227-003-1019-6
Wilkins, D., Lauro, F. M., Williams, T. J., Demaere, M. Z., Brown, M. V., Hoffman, J. M., et al. (2013). Biogeographic partitioning of southern ocean microorganisms revealed by metagenomics. Environ. Microbiol. 15, 1318–1333. doi: 10.1111/1462-2920.12035
Winter, C., Kerros, M.-E., and Weinbauer, M. G. (2009). Seasonal changes of bacterial and archaeal communities in the dark ocean: evidence from the Mediterranean Sea. Limnol. Oceanogr. 54, 160–170. doi: 10.4319/lo.2009.54.1.0160
Woolley, S. N., Tittensor, D. P., Dunstan, P. K., Guillera-Arroita, G., Lahoz-Monfort, J. J., Wintle, B. A., et al. (2016). Deep-sea diversity patterns are shaped by energy availability. Nature 533, 393–396. doi: 10.1038/nature17937
Zingone, A., Chrétiennot-Dinet, M.-J., Lange, M., and Medlin, L. (1999). Morphological and genetic characterization of Phaeocystis Cordata and P. Jahnii (Prymnesiophyceae), two new species from the Mediterranean Sea. J. Phycol. 35, 1322–1337. doi: 10.1046/j.1529-8817.1999.3561322.x
Keywords: haptophytes, Phaeocystis, Southern Ocean, oceanographic fronts, winter distribution, 18S (SSU) rRNA gene, latitudinal diversity gradient, amplicon sequence variants
Citation: Sow SLS, Trull TW and Bodrossy L (2020) Oceanographic Fronts Shape Phaeocystis Assemblages: A High-Resolution 18S rRNA Gene Survey From the Ice-Edge to the Equator of the South Pacific. Front. Microbiol. 11:1847. doi: 10.3389/fmicb.2020.01847
Received: 11 May 2020; Accepted: 15 July 2020;
Published: 06 August 2020.
Edited by:
Connie Lovejoy, Laval University, CanadaReviewed by:
Peter Croot, National University of Ireland Galway, IrelandKui Wang, University of Maryland, Baltimore County, United States
Copyright © 2020 Sow, Trull and Bodrossy. This is an open-access article distributed under the terms of the Creative Commons Attribution License (CC BY). The use, distribution or reproduction in other forums is permitted, provided the original author(s) and the copyright owner(s) are credited and that the original publication in this journal is cited, in accordance with accepted academic practice. No use, distribution or reproduction is permitted which does not comply with these terms.
*Correspondence: Swan L. S. Sow, c3dhbi5saXNhbkBnbWFpbC5jb20=; c3dhbmxpc2FuLnNvd0B1dGFzLmVkdS5hdQ==; Levente Bodrossy, bGV2LmJvZHJvc3N5QGNzaXJvLmF1