- 1State Key Laboratory of Ecological Pest Control for Fujian and Taiwan Crops, Fujian Agriculture and Forestry University, Fuzhou, China
- 2Fujian Key Laboratory for Monitoring and Integrated Management of Crop Pests, Institute of Plant Protection, Fujian Academy of Agricultural Sciences, Fuzhou, China
Phytophthora infestans is a widespread destructive plant pathogen that causes economic losses worldwide to potato production. In this study, we sequenced four mitochondrial DNA gene sequences of 101 P. infestans isolates from five potato-growing regions in China to investigate the population structure and dispersal pattern of this pathogen. The concatenated mtDNA sequences in the populations showed high haplotype diversity, but low nucleotide diversity. Although there was a degree of spatial structure, our phylogeographic analyses support frequent gene flow between populations and the direction of gene flow, primarily from north to south, corresponds to the route of seed potato transportation, suggesting a role of human activities in the dispersal of P. infestans in China.
Introduction
Gene flow, or migration, refers to the movement of alleles among spatially or temporally separated populations and is a major driving force in the evolution of populations. Gene flow may increase the genetic variation of local pathogen populations but decrease the genetic difference between populations, which can slow or limit population differentiation (Endler, 1973; Zhan, 2016). Population genetics studies have contributed to our understanding of the evolutionary history of plant pathogens, as well as to the development of strategies to prevent their spread in major crops (Mcdonald and Linde, 2002). For example, some soil-borne or seedborne plant pathogens, such as the fungal Cryphonectria parasitica, are spatially structured and quarantine procedures can be effective in preventing the invasion of plant diseases caused by the pathogens (Gilbert, 2002; Horton, 2010).
Phytophthora infestans, the causal agent of the Great Irish Famine, is a highly destructive plant pathogen, causing worldwide losses in potato production of $6.7 billion annually (Haverkort et al., 2008). Knowledge of population genetics and the evolutionary biology of P. infestans are important for developing sustainable, effective strategies for controlling potato late blight. In population genetics, selectively neutral loci, such as microsatellites (simple sequence repeats, SSRs), are the most frequently used genetic markers (Kirk and Freeland, 2011) and have been employed to investigate the evolutionary dynamics and population structure of P. infestans (Goodwin, 1997; Lebreton et al., 1998; Li et al., 2012). However, SSRs are often expensive and time-consuming (Vieira et al., 2016). Mitochondrial DNA (mtDNA) is now a popular marker because of its utility in investigating evolutionary processes, such as migration or dispersal (Holderegger et al., 2006; Wang et al., 2020). Cardenas et al. (2011) conducted a population genetics analysis of P. infestans in Colombia and Venezuela using four nuclear (ITS, Ras, β-tubulin, and Avr3a) and one mitochondrial (Cox1) gene, and revealed the low genetic diversity and low frequency of heterozygotes in P. infestans.
Potato (Solanum tuberosum L.) is the fourth most important staple food crop worldwide. China is the world’s largest producer of potatoes, producing ∼99.21 million tonnes on ∼5.76 million ha in 20171. With government support and shifts in dietary habits, potato production in China is expected to increase substantially in the coming decades (Kearney, 2010). Potato planting in China can be roughly divided into four producing regions according to climate conditions and management practices: the northern single-cropping, central double-cropping, winter-cropping, and southern mixed-cropping zones (Jansky et al., 2009). Of these, the northern single-cropping zone, including Heilongjiang Province, is the major producer of potatoes and accounts for 50% of China’s total potato yield.
The existence of P. infestans in Kunming and Chongqing of China was noted in as early as 1938 and 1940, respectively (Ristaino and Hu, 2009). Molecular population genetics approaches have been used to investigate the genetic diversity of P. infestans in China, and to identify the evolutionary forces responsible for its diversity. For example, based on SSRs and amplified fragment length polymorphisms (AFLPs), Guo et al. (2009) found low genotypic diversity of P. infestans in Northern China. Subsequently, a population analysis of P. infestans inferred from mtDNA haplotypes and restriction fragment length polymorphism (RFLP) data suggested multiple migrations of this pathogen into China (Guo et al., 2010). In addition, Tian et al. (2016) investigated the genetic structure of P. infestans populations in northwestern China using SSR markers and found that migration and selection might be important in shaping the genetic structure and diversity of regional populations. However, the population structure of P. infestans and the migration dynamics of this pathogen in China remain poorly understood.
This study analyzed the concatenated mtDNA sequences of the partial cytochrome c oxidase subunit 1 (cox1), NADH dehydrogenase subunit 9 (nad9), NADH dehydrogenase subunit 4 (nad4), and ATP synthase subunit alpha (atp1) genes from 101 P. infestans isolates collected in China. The objectives of this study were to: (i) characterize the genetic structure of P. infestans in China; (ii) investigate the geographic and host-origin effects on the population structure; and (iii) determine gene flow among populations, particularly in terms of the source–sink dynamics of the populations.
Materials and Methods
Sampling P. infestans and DNA Extraction
A total of 101 P. infestans infected potato (Solanum tuberosum) and tomato (S. lycopersicum) leaves, stems and tubers exhibiting typical late blight symptoms were collected from 34 sampling sites in Fujian, Hebei, Beijing, Heilongjiang, Inner Mongolia, and Jiangsu, China (Supplementary Table S1 and Figure 1). These isolates were grouped into five populations based on their geographical origin: Fujian (FuJ, n = 36), Hebei and Beijing (HeB, n = 11), Heilongjiang (HLJ, n = 20), Jiangsu (JSu, n = 21), and Inner Mongolia (NMG, n = 13). The pure culture of each isolate was preserved on antibiotic-free rye agar slants covered with mineral oil (Sigma Diagnostics Inc, St Louis, MO, United States) at 15°C in the dark and transferred to new slants at 6-month intervals. P. infestans genomic DNA was extracted using a modified cetyl trimethylammounium bromide (CTAB) method, as described previously (Li et al., 2009; Chen et al., 2012). The genomic DNA was eluted with 200 mL ultrapure water and stored in TE (10 mM Tris-HCl, 0.1 mM EDTA, pH8.0) at –20°C.
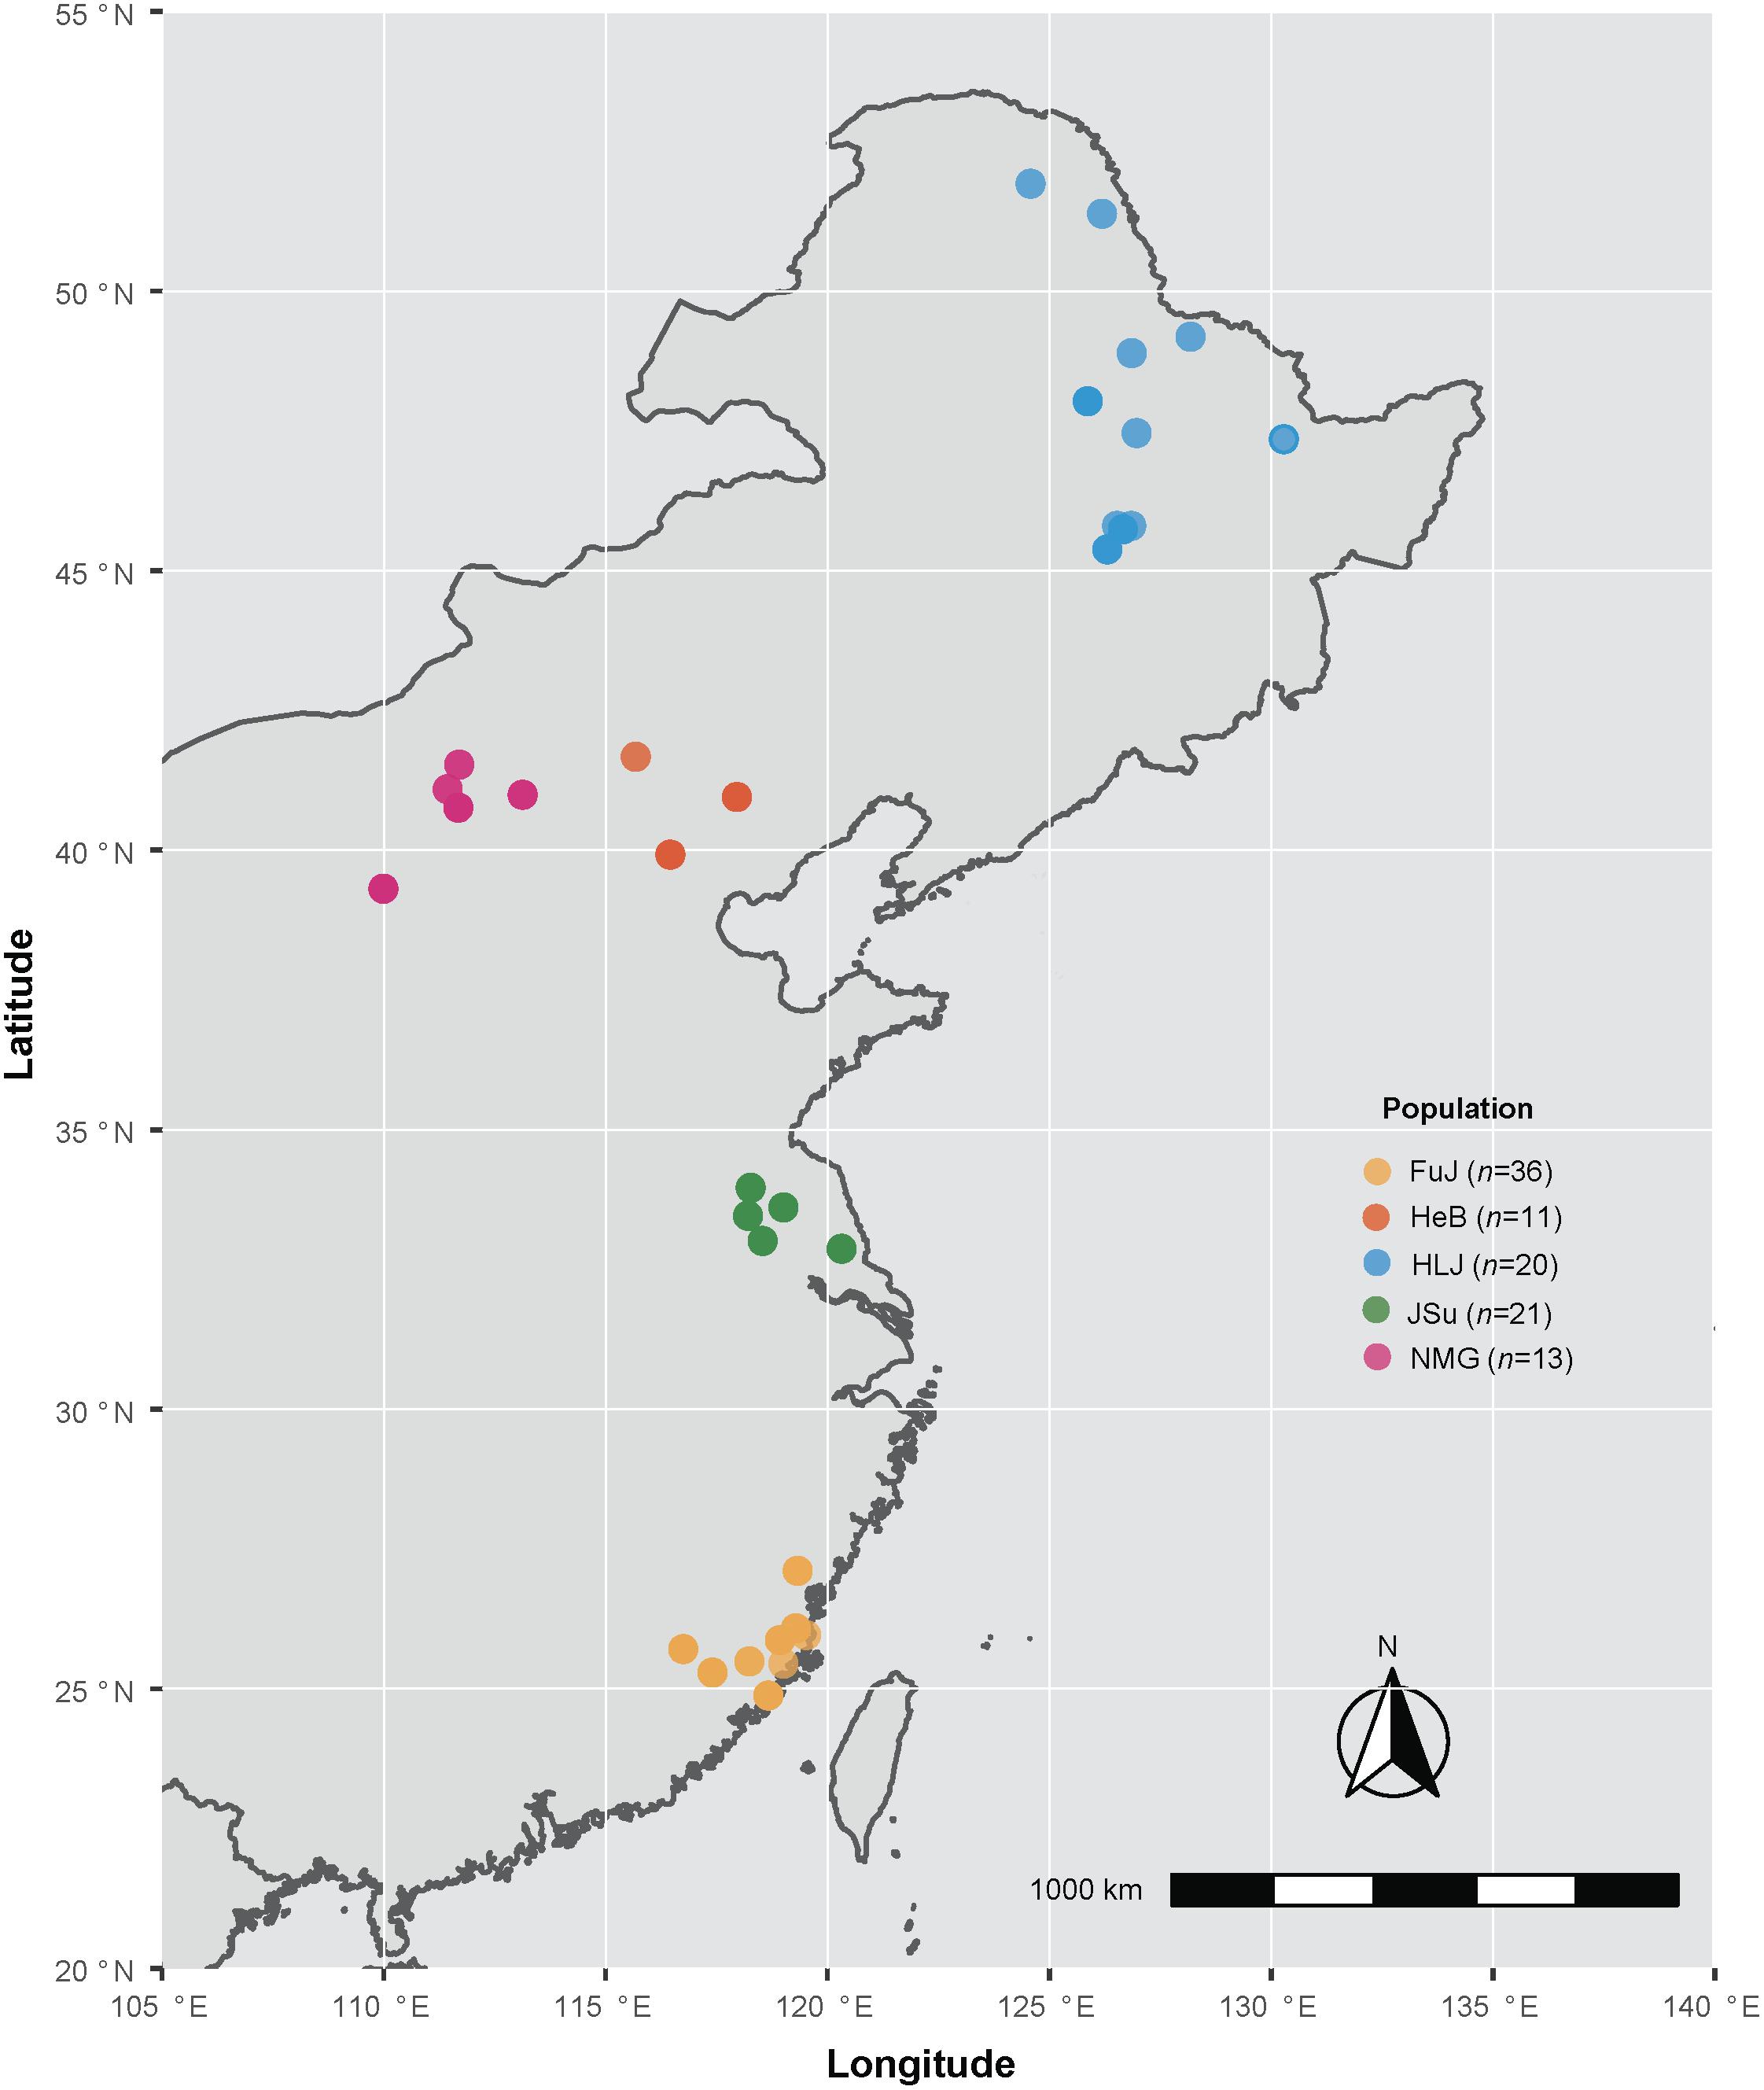
Figure 1. Map of the locations from which the Phytophthora infestans isolates were collected in this study. Colors indicate sampling locations, as shown in the key. Detailed information on the samples is given in Supplementary Table S1.
PCR Amplification and Sequencing of the mtDNA Genes
Supplementary Table S2 lists the PCR primers and cycling parameters. PCR amplification was performed in a total volume of 25 μL, comprising 5 μL of TransTaq reaction buffer (5×), 2 μL of dNTPs (2.5 mM each), 1 μL each of forward and reverse primers (10 μmol/L), 14.25 μL of ddH2O,0.25 μL of TaKaRa Ex Taq DNA polymerase with the proofreading activity (5 U/μL), and 1 μL of template cDNA. The PCR program comprised an initial denaturation at 95°C for 2 min, followed by 30 cycles of 90°C for 20 s, 57°C for 25 s (for cox1; 41°C for nad9 and 63°C for nad4 and atp1; Supplementary Table S2), 72°C for 5 min; and a final 5 min extension at 72°C. The amplification products were separated by electrophoresis on 1% agarose gels, visualized by UV transillumination, and cleaned using an EasyPure Quick Gel Extraction Kit (TransGen, Beijing, China). The amplicons were ligated to pMD18-T Simple Vector (Takara, Beijing, China) and sequenced by Sangon Biological (Shanghai, China) using an ABI3730 automated DNA sequencer (Applied Biosystems, Foster City, CA, United States). At least three positive clones from each transformation were sequenced to obtain a consensus sequence.
Sequence Dataset
The resulting sequences were assembled using DNAMAN 6.0 (Lynnon, Quebec, Canada) and deposited in GenBank under accession numbers MN458052 to MN45815 for cox1, MN458254 to MN458354 for nad9, MN458153 to MN458253 for nad4, and MN457951 to MN458051 for atp1. The four gene sequences were aligned by codons using TranslatorX (Abascal et al., 2010). A recent study found evidence for intragenic recombination in an effector gene of P. infestans (Yang et al., 2018). To test recombination signals in our data set, we conducted recombination analysis using the RDP 4.95 software package (Martin et al., 2015). No recombination signals were identified; therefore, we combined the four gene sequences for subsequent analyses.
Genetic Diversity and Population Differentiation
To assess how genetic diversity varied across geographical and host populations, we calculated the two summary statistics, nucleotide diversity (π) and haplotype diversity (Hd), using DnaSP 5.10 (Librado and Rozas, 2009). The nucleotide diversity was also calculated according to a sliding-window (100 bp) analysis, with a 30 bp step size estimate the step-wise diversity across the sequence. A minimum spanning haplotype network was built using PopART (Leigh and Bryant, 2015).
Genetic differentiation among populations was evaluated using KST, Z, and Snn using DnaSP 5.10 (Hudson et al., 1992; Hudson, 2000; Librado and Rozas, 2009). The level of genetic differentiation among P. infestans was also quantified using FST (Weir and Cockerham, 1984). We calculated pairwise FST values using noncorrected pairwise differences and obtained p-values after a randomization test with 10,000 permutations using Arlequin 3.5 (Excoffier and Lischer, 2010). Default values were used for the remaining parameters. The degree of differentiation (given by the FST values) was classified as low (<0.05), moderate (0.05–0.15), large (0.15–0.25); or great (> 0.25) (Balloux and Lugon-Moulin, 2002). We also applied discriminant analysis of principal components (DAPC), a multivariate method designed to identify clusters of genetically related individuals, to allow investigation of the genetic structure of P. infestans populations (Jombart et al., 2010). This method has the advantage of not assuming panmixia. We performed the DAPC analysis based on pre-defined groups, using the adegenet package (Jombart, 2008) implemented in R software (ver. 3.5.1; R Development Core Team, Vienna, Austria).
To test the effects of geography and host on the genetic diversity of P. infestans, we conducted analysis of molecular variance (AMOVA) using Arlequin 3.5 (Excoffier and Lischer, 2010). The statistical significance of the φ-statistics was tested based on 1,023 permutations (default). To determine the potential geographic and host-origin effects on P. infestans populations, the isolates were divided into five populations based on geographic origin, as described above. They were also divided into two populations based on host origin, i.e., S. tuberosum (potato, n = 70) and S. lycopersicum (tomato, n = 31). Pairwise population differentiation was also estimated based on GST using the PopGenome 2.16 R package (Pfeifer et al., 2014).
Phylogeographic Analysis of P. infestans
To explore the spatial diffusion patterns of P. infestans across regions in China, we used Bayesian stochastic search variable selection (Lemey et al., 2009) to reconstruct the spatial pathway of this pathogen in BEAST 1.10.4 (Suchard et al., 2018). The five geographic locations in China were coded as discrete states. Before the analysis, we performed a date-randomization test (Ramsden et al., 2008) to analyze the temporal signal in the dataset using the TipDatingBeast package (Rieux and Khatchikian, 2017). However, we found no evidence of temporal structure in our dataset, so we applied a previous informative prior distribution of 1.5 × 10⁻⁶ to 3.3 × 10⁻⁶ substitutions/site/year on the clock rate (Yoshida et al., 2013). The best nucleotide substitution model, GTR+F+I, was identified by ModelFinder (Kalyaanamoorthy et al., 2017) with the Bayesian information criterion and used for analyzing the combined mtDNA gene sequences.
We calculated the marginal likelihoods using path sampling (Baele et al., 2012) and analyzed them in terms of Bayesian skyline, constant-size coalescent, and exponential-growth coalescent tree priors, as well as the strict clock and uncorrelated lognormal relaxed clock (Drummond et al., 2006). An exponential growth tree prior and uncorrelated lognormal relaxed clock gave the best fit to the data (Supplementary Table S3). The collection dates for all P. infestans samples were used as calibration points. Two independent Markov chain Monte Carlo (MCMC) runs were performed to estimate the posterior distributions of the parameters, with samples taken every 10,000 steps over 50,000,000 steps. After discarding the first 10% of the samples as burn-in, all parameters showed sufficient sampling, as confirmed by Tracer 1.7 (Rambaut et al., 2018), which showed that the effective sample size was above 200.
Population Historic Dynamics of P. infestans
As neutrality indices, Tajima’s D and Fu’s FS statistics were calculated using Arlequin 3.5 (Excoffier and Lischer, 2010). Tajima’s D test is based on comparison of the estimated number of segregating sites with a mean pairwise difference among sequences (Tajima, 1989). A negative Tajima’s D indicates bias toward rare alleles, which is indicative of recent population expansion. Fu’s FS statistic is based on the allele or haplotype distribution and usually has a negative value, which is also indicative of a recent population expansion (Fu, 1997). We also used the exponential growth model implemented in BEAST to analyze the population demographic history of P. infestans.
Results
Genetic Diversity of P. infestans and Haplotype Network
We obtained 1,968 bp of mitochondrial genes in P. infestans in China, including cox1 (735 bp), nad9 (348 bp), nad4 (396 bp), and atp1 (489 bp). No indels were detected in our dataset. In the entire mtDNA, 141 polymorphic sites were identified, representing 7.16% of all sites analyzed, including 100 single variable sites and 41 parsimony-informative sites. The transition/transversion ratio (R) was 0.702, indicating a strong transversion bias during the mitochondrial evolution of P. infestans.
In total, 62 haplotypes were identified from the 101 P. infestans isolates studied, with a haplotype diversity of 0.920 (Table 1). The overall nucleotide sequence diversity of these isolates was 0.0023 (Table 1). When the P. infestans isolates were categorized according to geographic origin, the highest nucleotide diversity (0.00920 ± 0.00025) was observed in the FuJ population and the lowest (0.00153 ± 0.00033) was found in the HLJ population. Greater variation in the concatenated mtDNA sequences was observed in P. infestans isolates isolated from potato compared with those isolated from tomato, when the isolates were categorized according to host origin (Table 1).
Figure 2 shows the minimum spanning haplotype network of the P. infestans population. There were 58 low-frequency haplotypes, each found in a single P. infestans isolate. Four haplotypes were shared by two or more isolates. Hap_2 and Hap_4 were commonly shared haplotypes, being present in 26 and 13 isolates, respectively. Of all the identified haplotypes, 11 private haplotypes were found in the isolates from tomato, of which 10 were from the FuJ population and one was from the JSu population. The population network showed low levels of sequence divergence and a high frequency of unique mutations, which is a signature of rapid population expansion. The step-wise diversity across the sequence indicated two highly variable regions at sites 1111–1270 and 1681–1870 (Figure 3), which were located within the nad4 and atp1 genes, respectively.
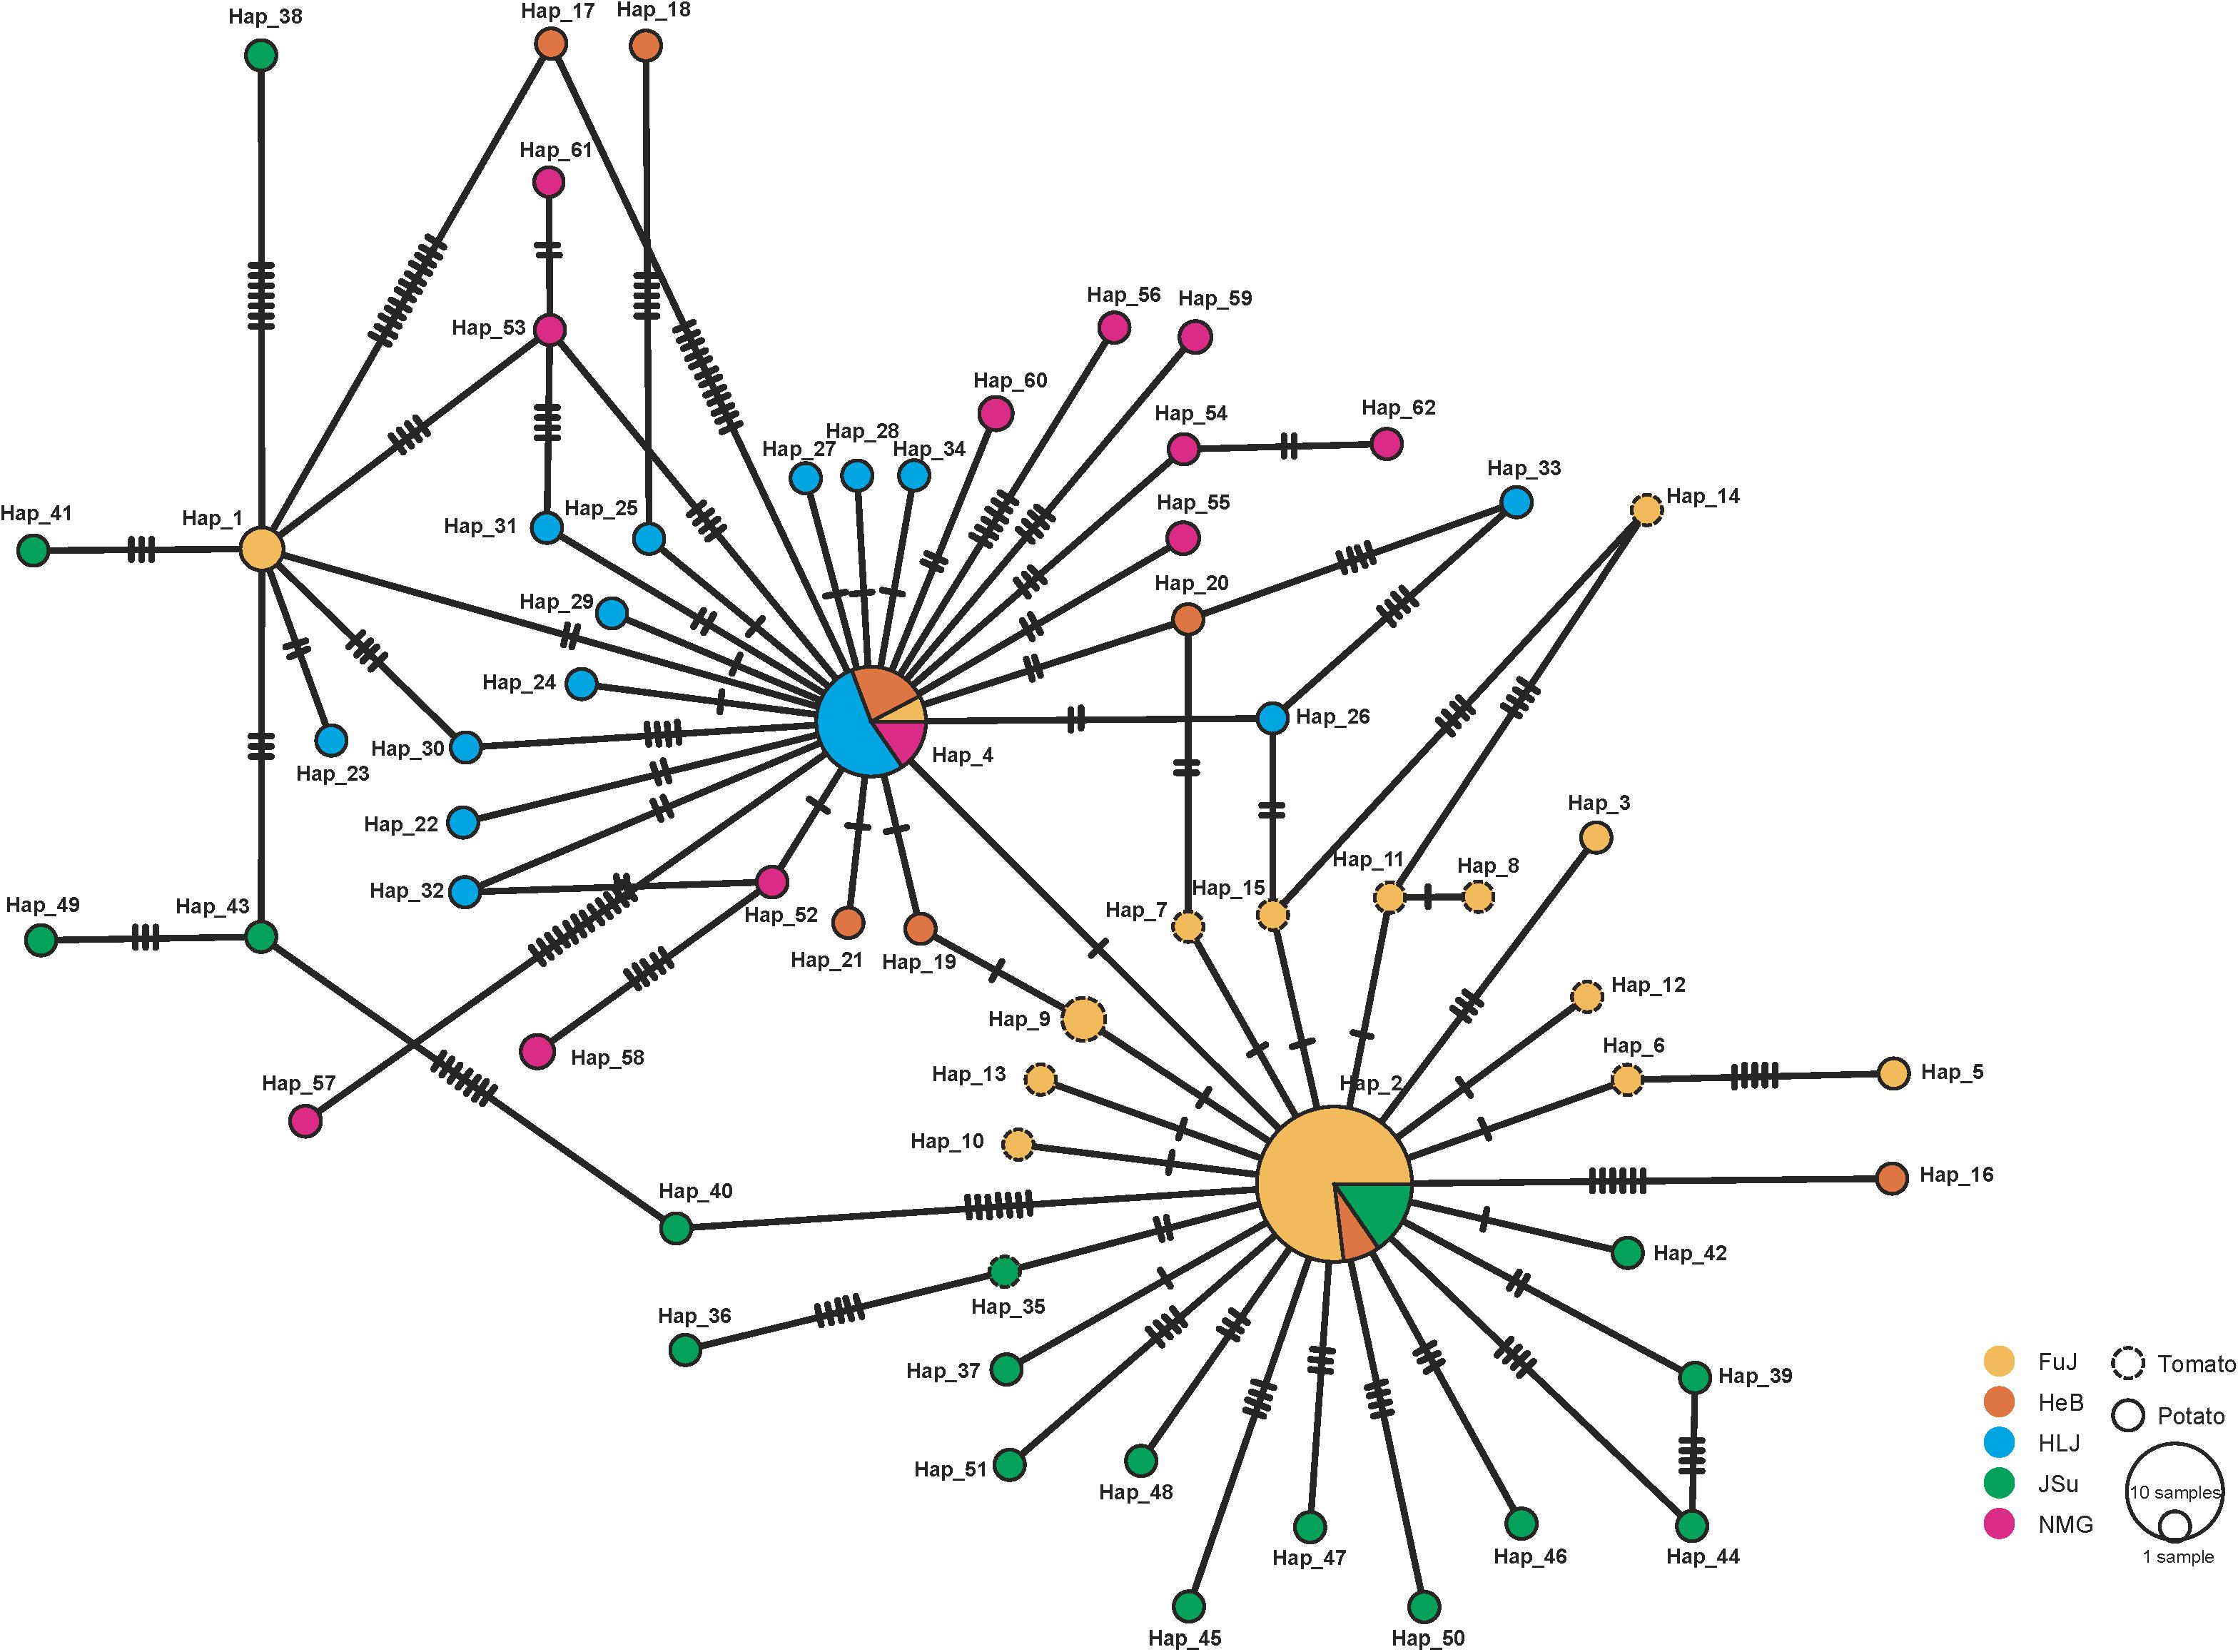
Figure 2. Minimum spanning haplotype network inferred from the concatenated mitochondrial DNA (mtDNA) sequences of Phytophthora infestans in China. Sequences from different sampling locations are indicated in unique colors and the sizes of the circles represent the haplotype frequencies in populations.
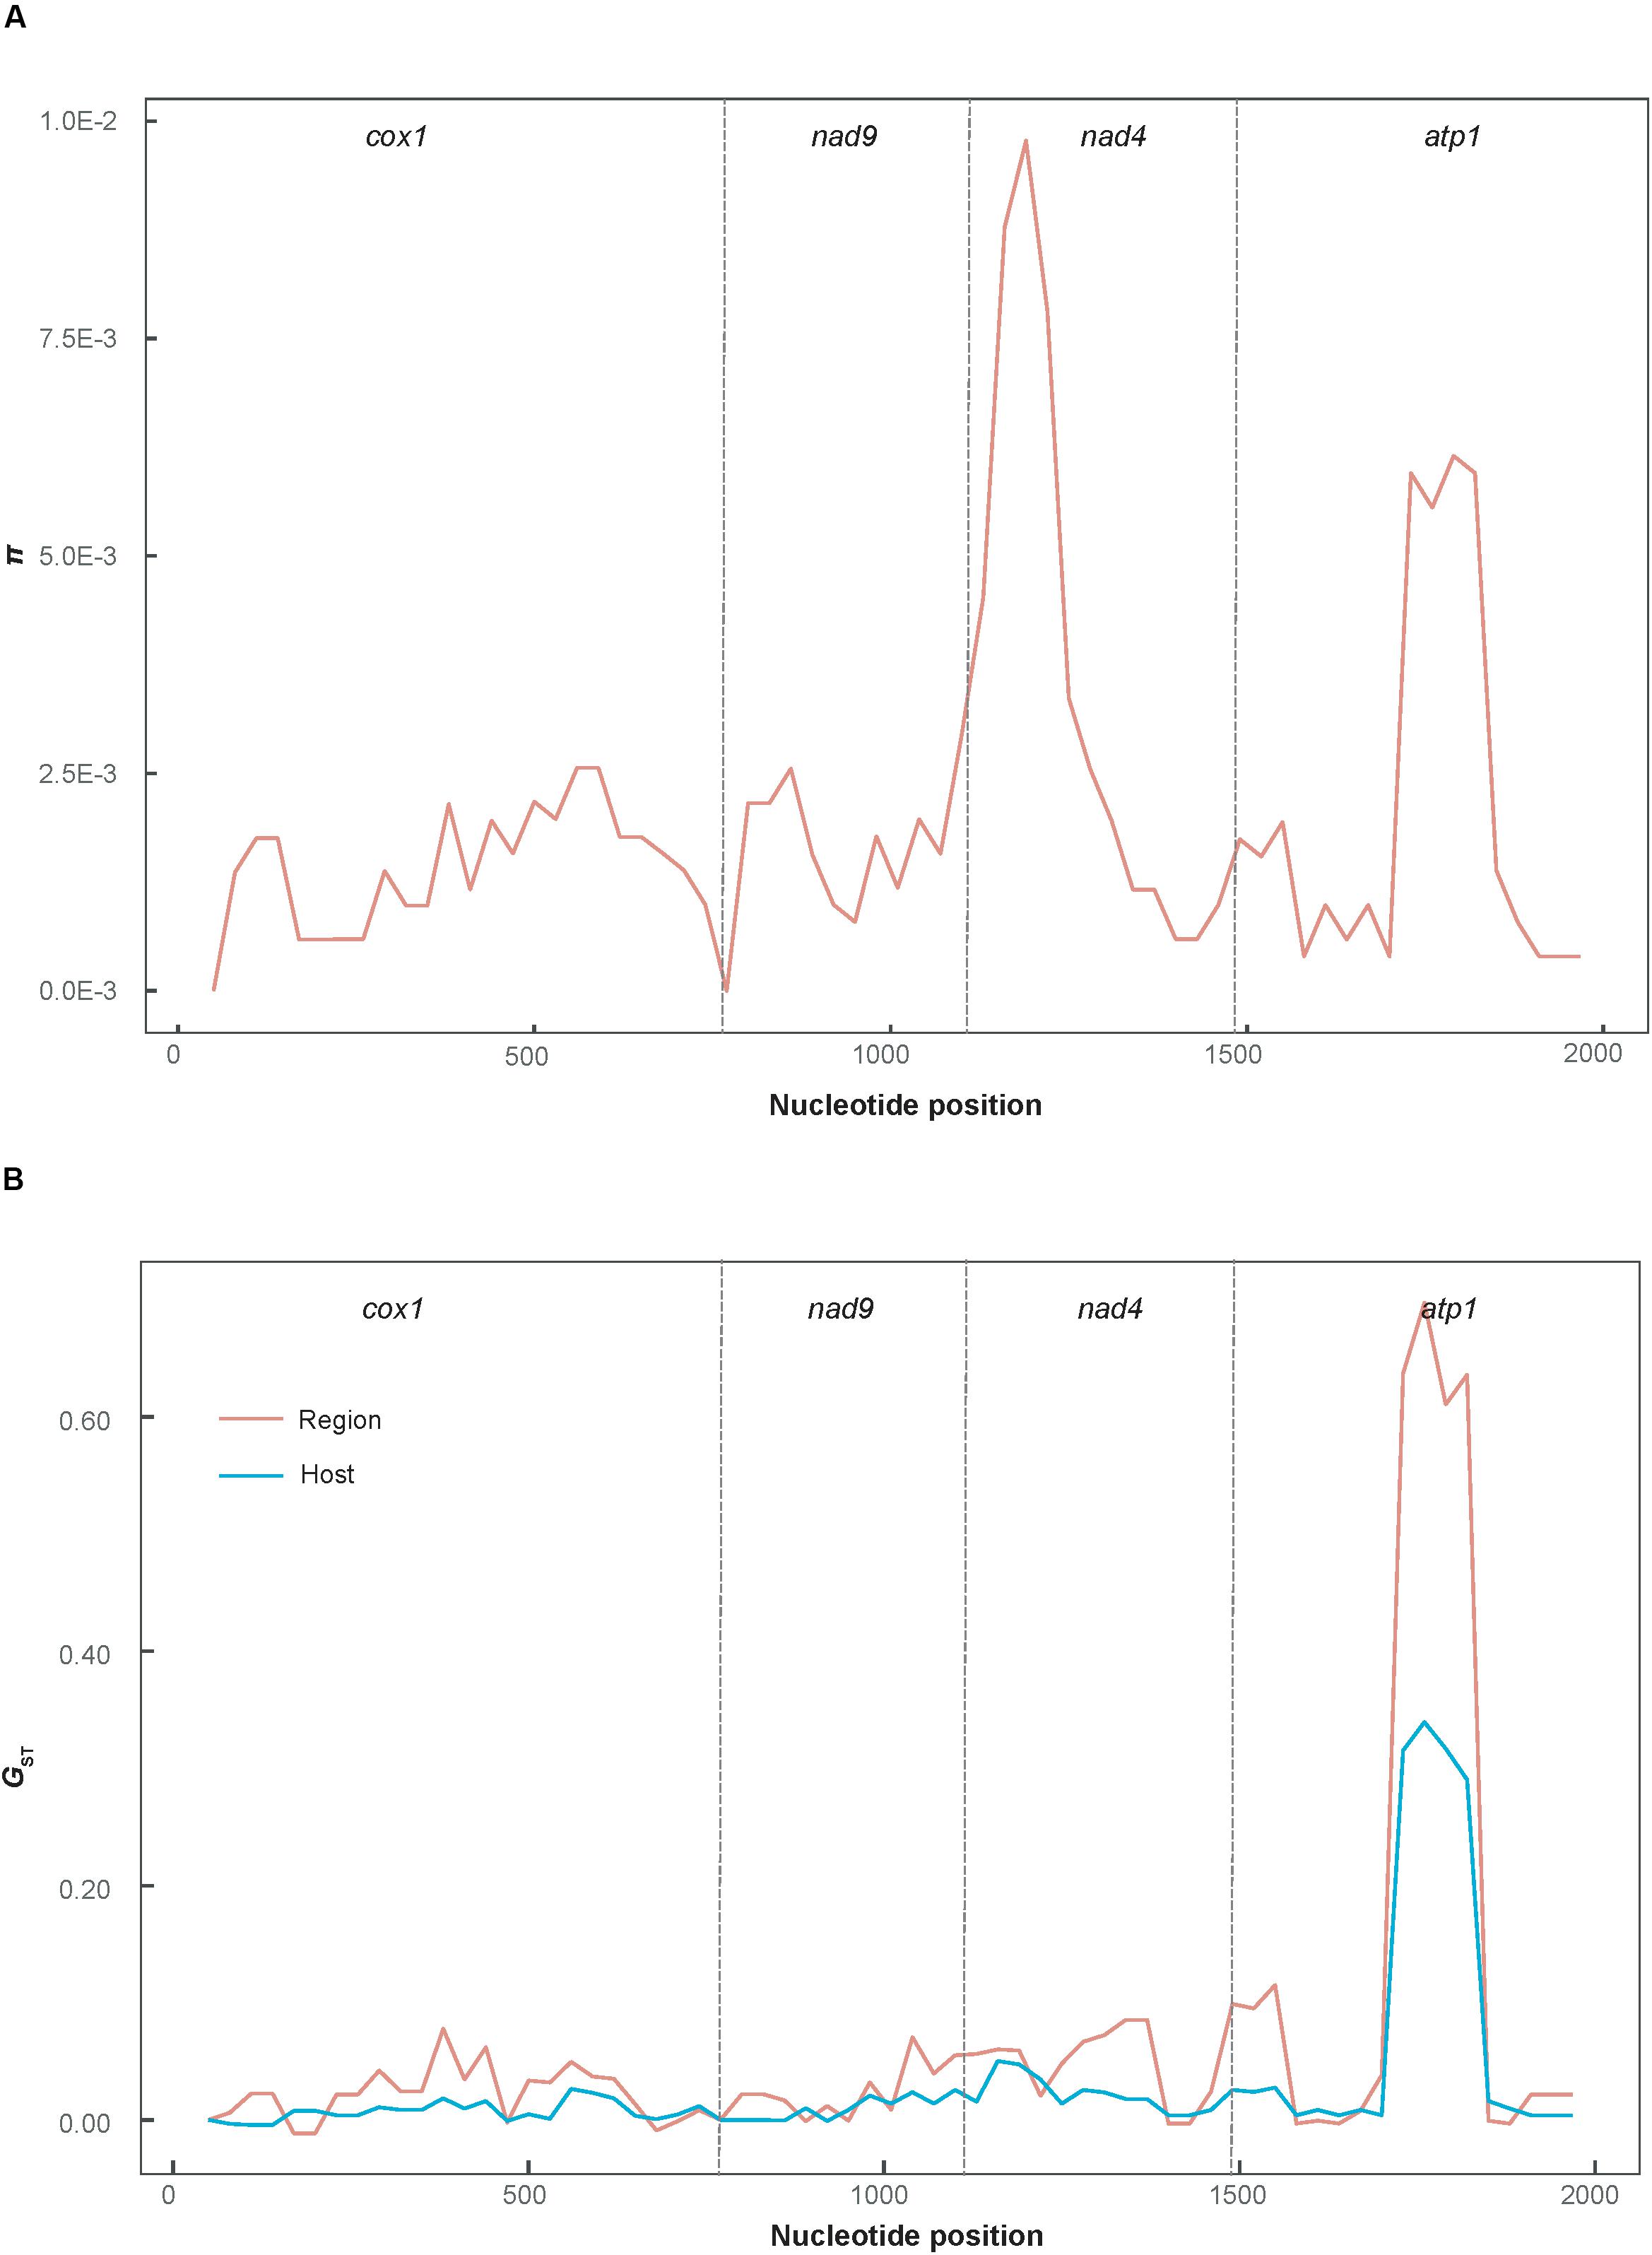
Figure 3. Sliding-window plot of nucleotide diversity (A) and population differentiation (B) for the concatenated mtDNA sequences. π was calculated using DnaSP 5.10 and GST was plotted using the PopGenome 2.16 R package (sliding-window analysis; length, 100 bp; step size, 30 bp).
Differentiation Between P. infestans Populations
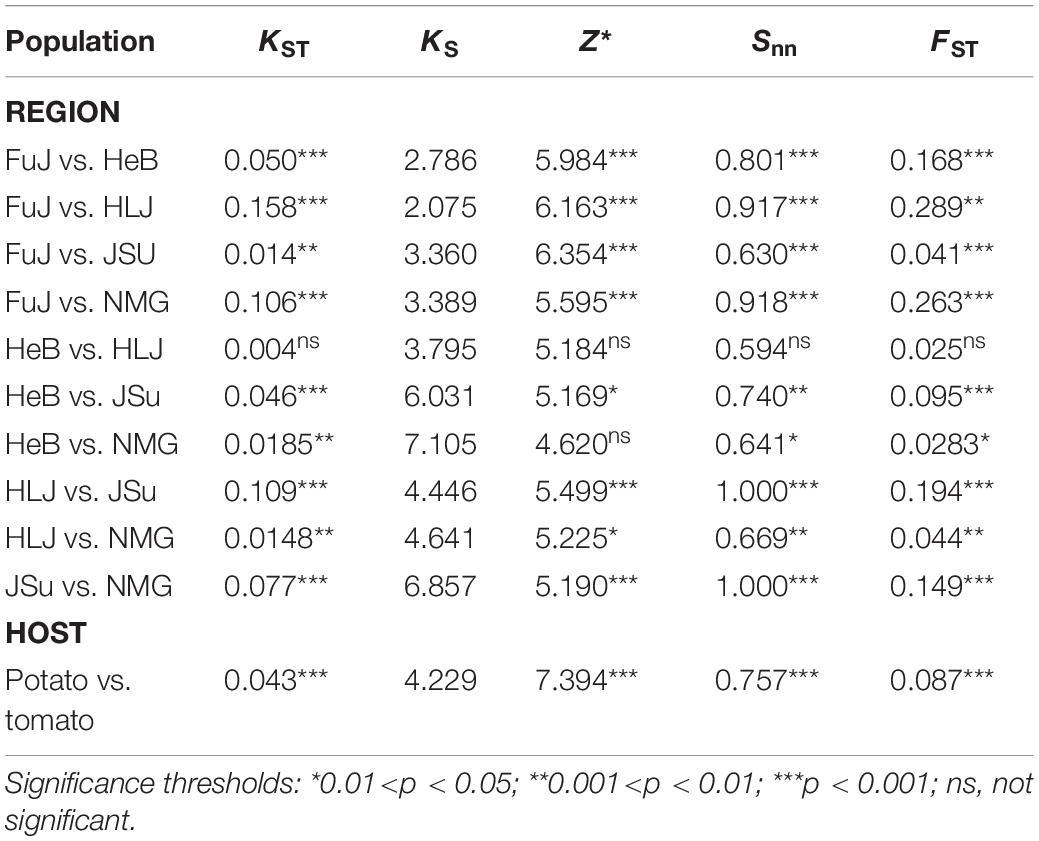
With the exception of the comparison between HLJ and HeB, three independent tests of population differentiation for all populations, grouped by geography or host-species, were significant (Table 2); the FST values ranged from 0.028 to 0.289. The highest FST value was between the HLJ and FuJ populations and the lowest was between NMG and HeB (Table 2). More than half of the 10 FST values were higher than 0.05, suggesting a degree of spatial structure of the P. infestans populations in China. Our investigation of FST also showed significant genetic differentiation between P. infestans from tomato versus potato.
The DAPC analysis revealed patterns of genetic differentiation that were similar to those of the FST analysis. DAPC scatterplots also indicated that the NMG population was relatively distinct from the other populations along the second discriminant function axis, while the JSu population had a more subtle structural difference along the third discriminant function axis (Figure 4). This suggests that geography contributes to the differentiation of P. infestans populations.
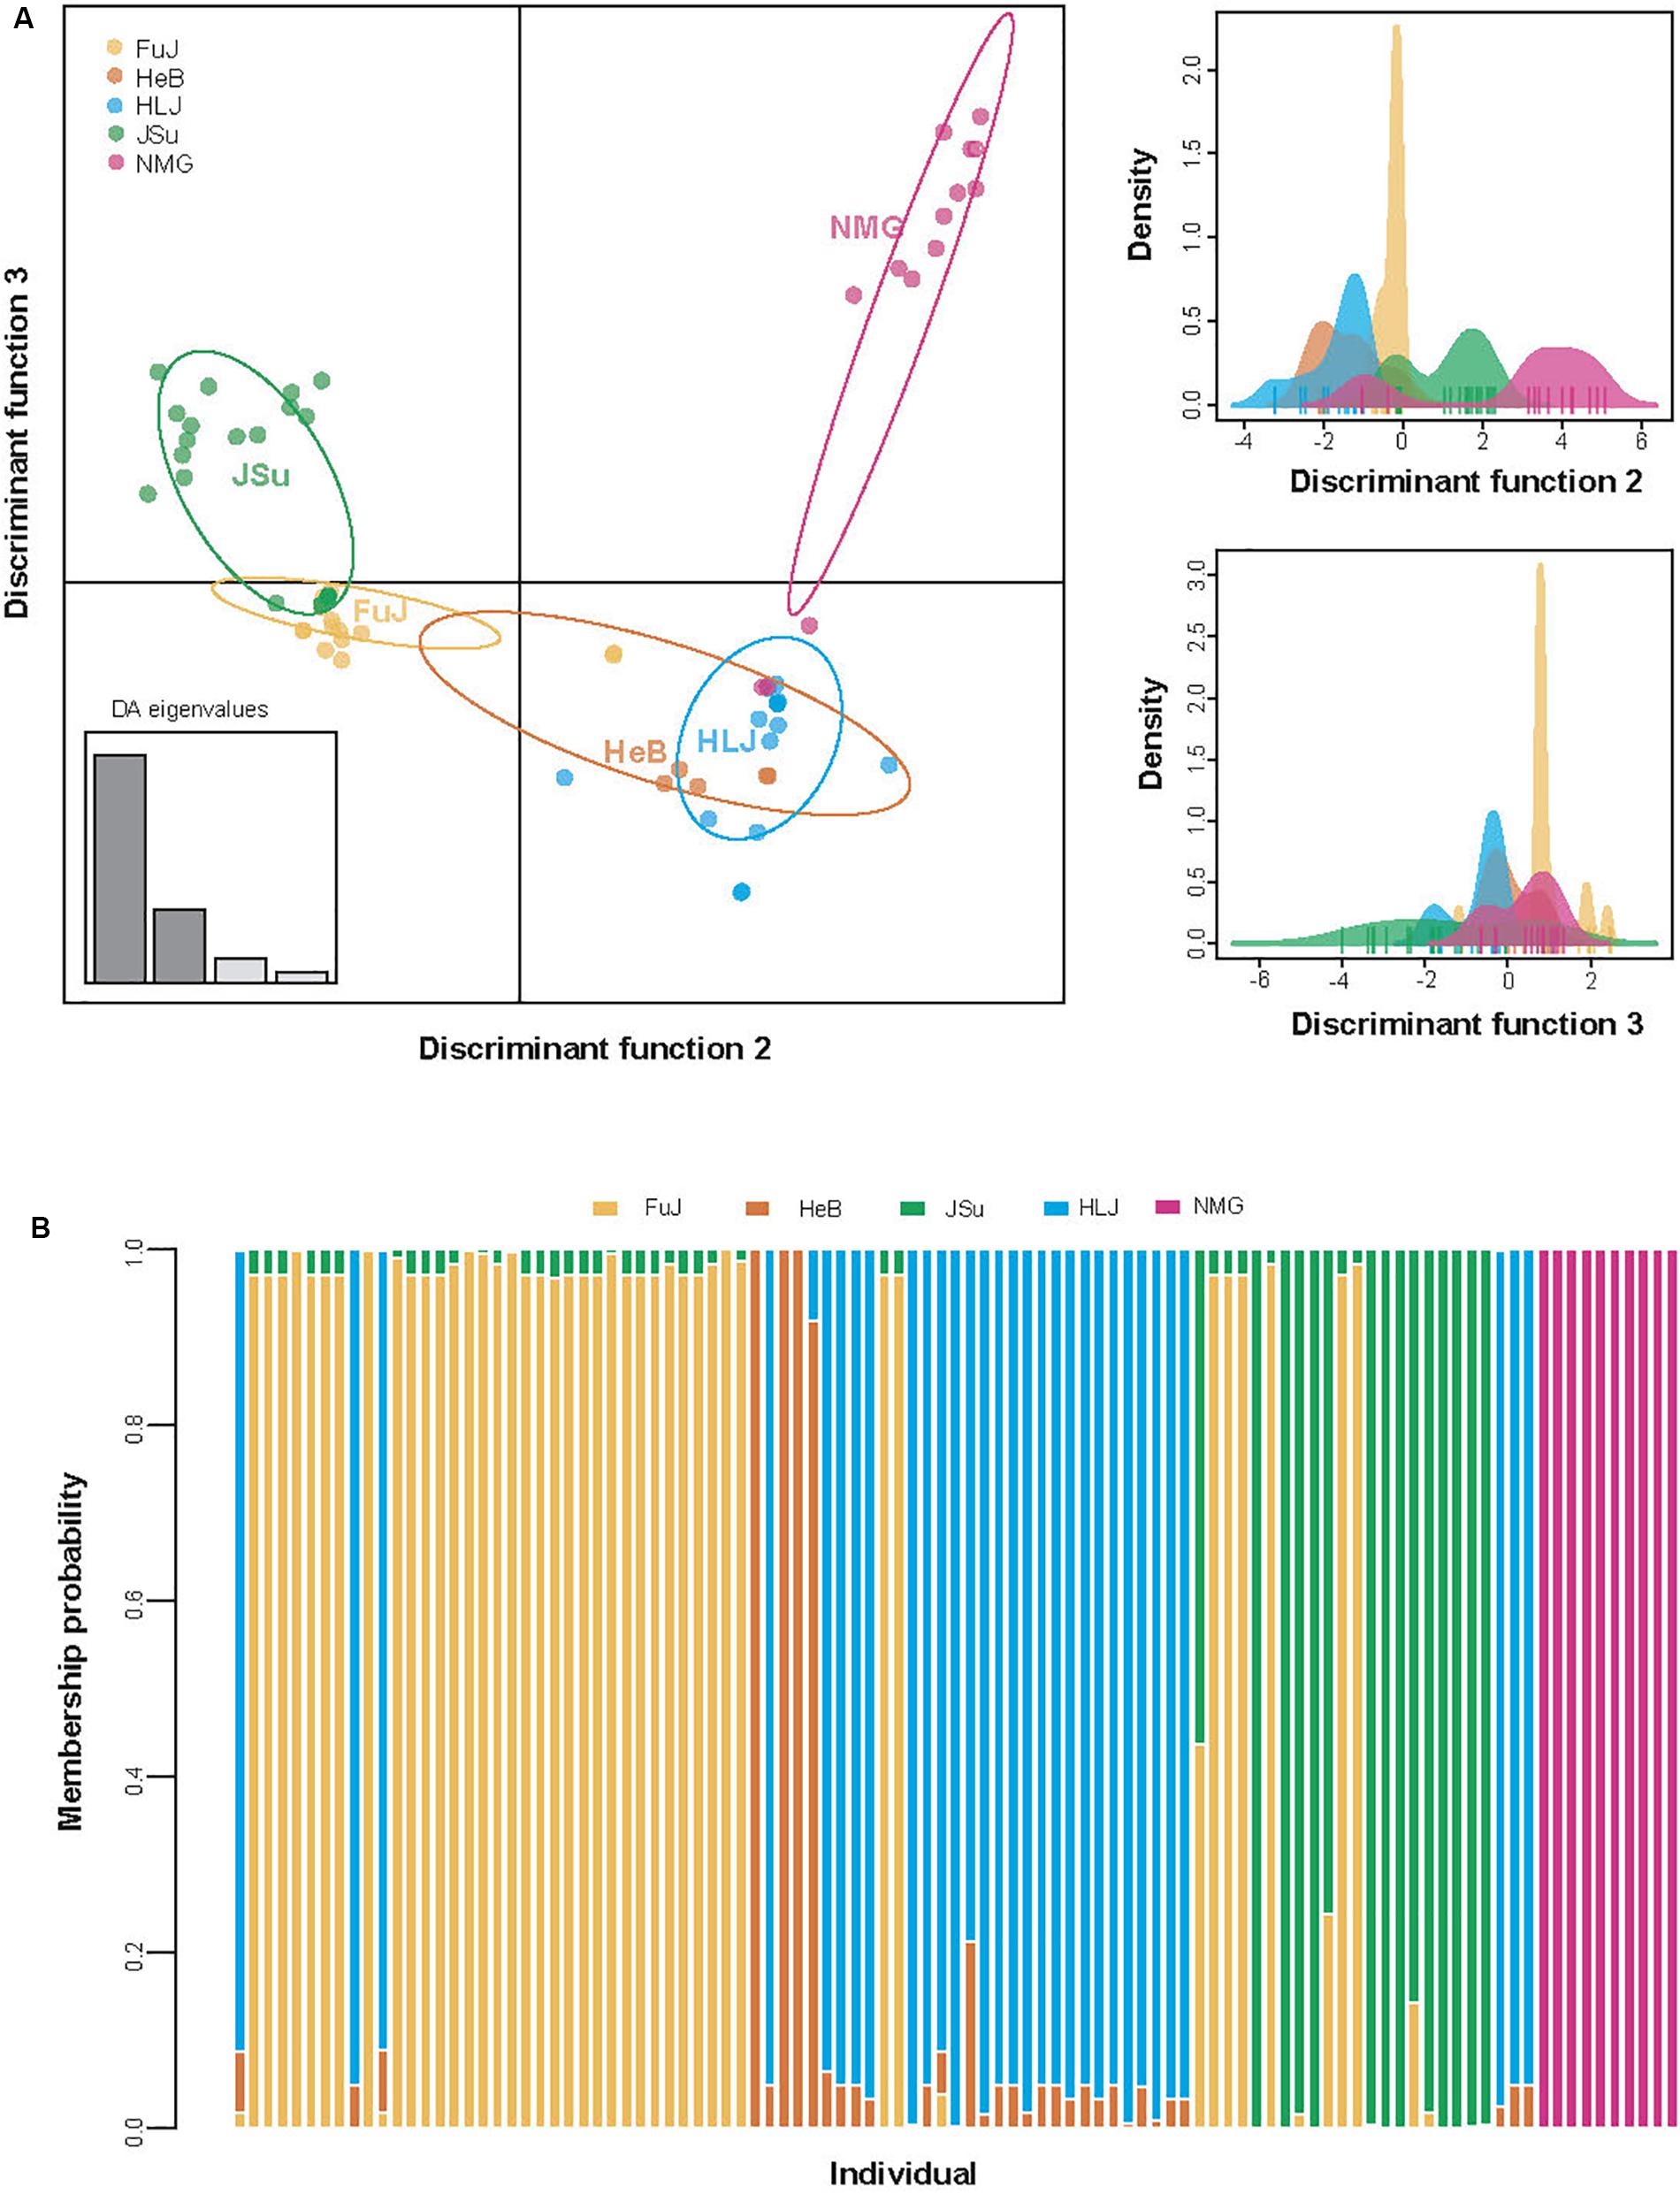
Figure 4. Population structure of Phytophthora infestans according to the discriminant analysis of principal components (DAPC). (A) Scatterplots for individual isolates. Unique colors indicate geographic regions, as shown in the insert. The x- and y-axes, respectively, indicate the second and third discriminant principal components, which best summarize the differences between clusters while neglecting within-cluster variation. The discriminant functions used for separating the clusters are shown in the right panels. (B) Membership probability of individual isolates.
AMOVA also revealed significant variation among geographic groups, accounting for 13.87% of the total variation in P. infestans (ΦST = 0.139, p < 0.001; Table 3). When host species was used a grouping factor, similar results were observed, i.e., there was significant population differentiation among groups (ΦST = 0.087, p < 0.001), accounting for nearly 8.66% of the total variation in P. infestans (Table 3). These results suggest that the effect of geography on the genetic variance of P. infestans is greater than that of host species, although both contributed to the genetic variance in P. infestans.
The results of sliding-window analysis of the pairwise GST values of population differentiation are plotted in Figure 3B. The pairwise GST values estimated based on the geographic groupings were slightly higher than those based on the host species groupings, across the sequence regions located in the cox1, nad9, and nad4 genes. However, the former values were significantly higher than the latter in the highly variable region in the atp1 gene (alignment sites 1681–1870).
The Dispersal Pattern of P. infestans Populations in China
All FST values were lower than 0.33 (Table 2), indicating a degree of gene flow between these populations. To gain insight into the circulation of P. infestans across China, we reconstructed the migration pathway of this pathogen. Our Bayesian phylogeographic analysis suggested that there were six major migration events in the diffusion process of P. infestans, with mean migration rates ranging from 0.922 to 1.323; four of the migrations were from HLJ to HeB, NMG, JSu, and FuJ, and the remaining two were from FuJ to HeB and NMG (Figure 5 and Supplementary Table S4). The observed state changes (MCMC jumps) also suggest that HLJ has acted as the seeding population for P. infestans in China (Figure 5). The Markov rewards for FuJ (14,748; 95% credibility interval, 7,756–50,530) were higher than those for other regions, suggesting that Fujian played a major role in the evolution and persistence of P. infestans.
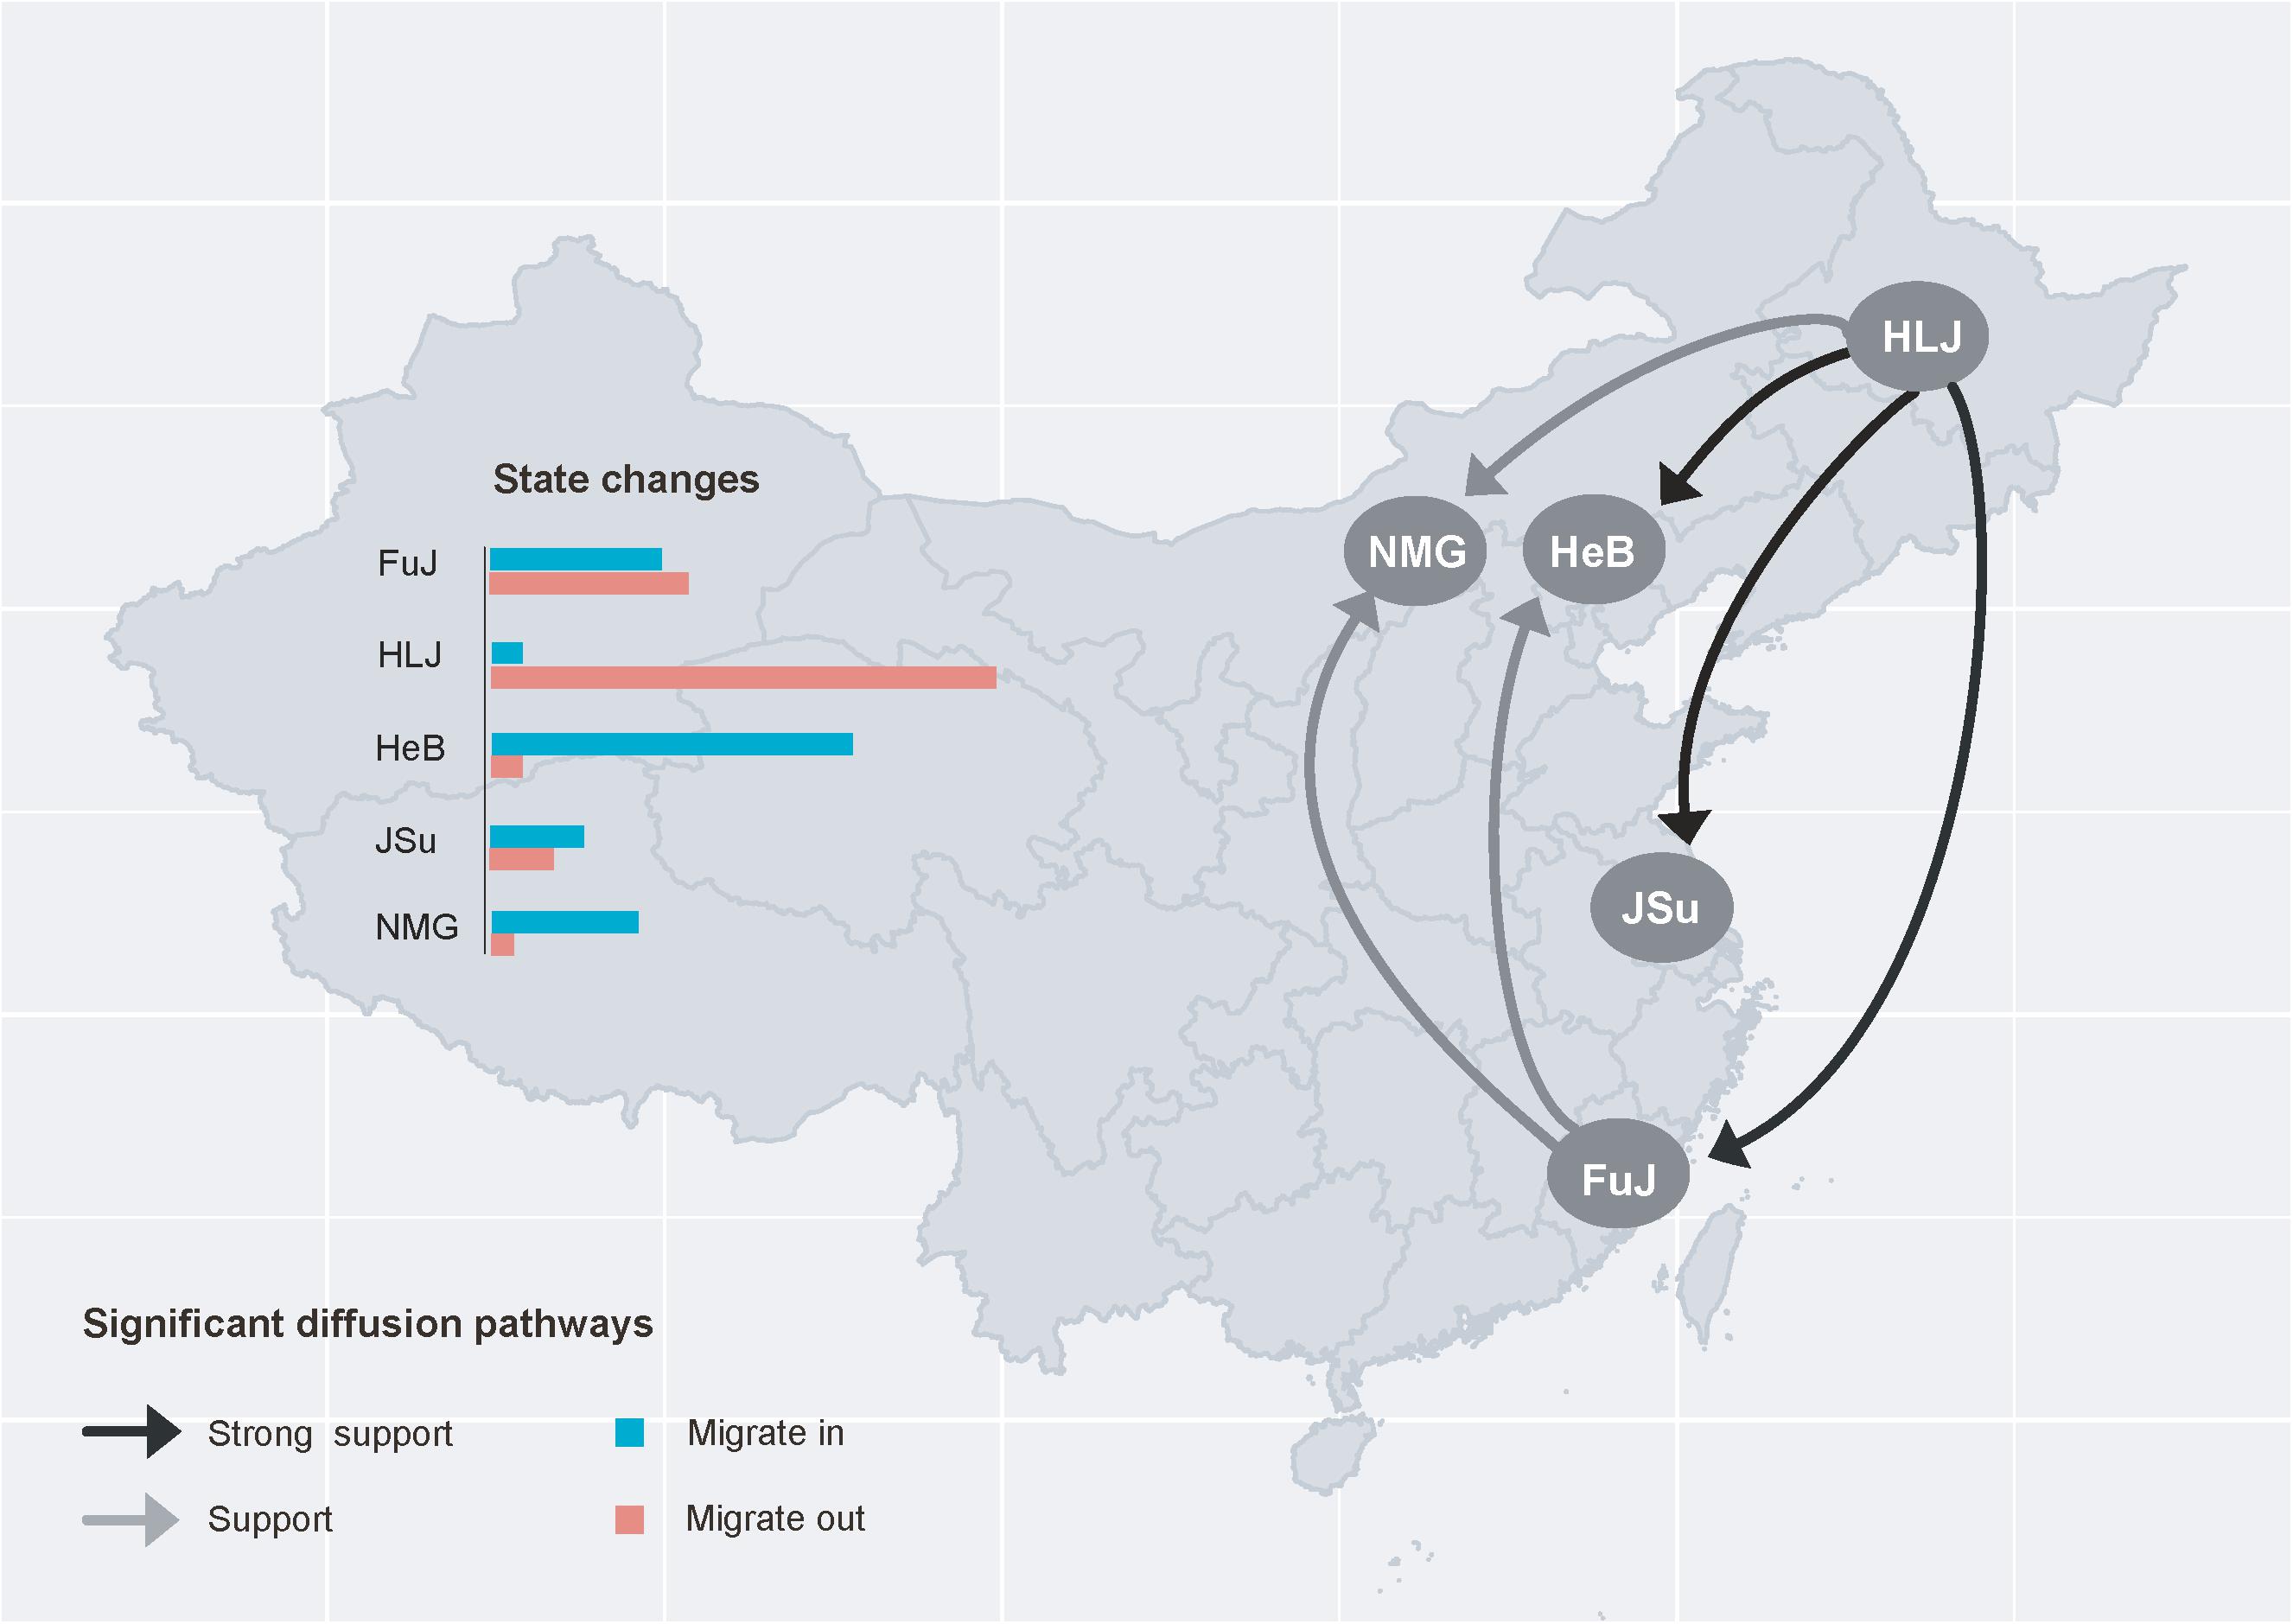
Figure 5. Spatial diffusion pathway of Phytophthora infestans inferred from 101 isolates collected from five geographic regions. Histograms of the total number of location-state transitions are shown in the insert panel. FuJ, Fujian; HLJ, Heilongjiang; HeB, Hebei; JSu, Jiangsu; NMG, Inner Mongolia.
Demographic History of the P. infestans Population in China
Tajima’s D test was significantly negative for all populations. Fu’s FS test was also significantly negative for all populations, except the HeB population (Table 1). The negative values of both neutrality tests indicate an excess of rare mutations, suggesting recent population expansion. This is also indicated by the results of the coalescence-based demographic analysis, which showed that P. infestans had experienced substantial population expansion until the last sampling year (Figure 6A). Interestingly, the demographic expansion of P. infestans correlates with the increase of potato production in China over the past decades (r = 0.95, DF = 23, p = 0.000, Figure 6B).
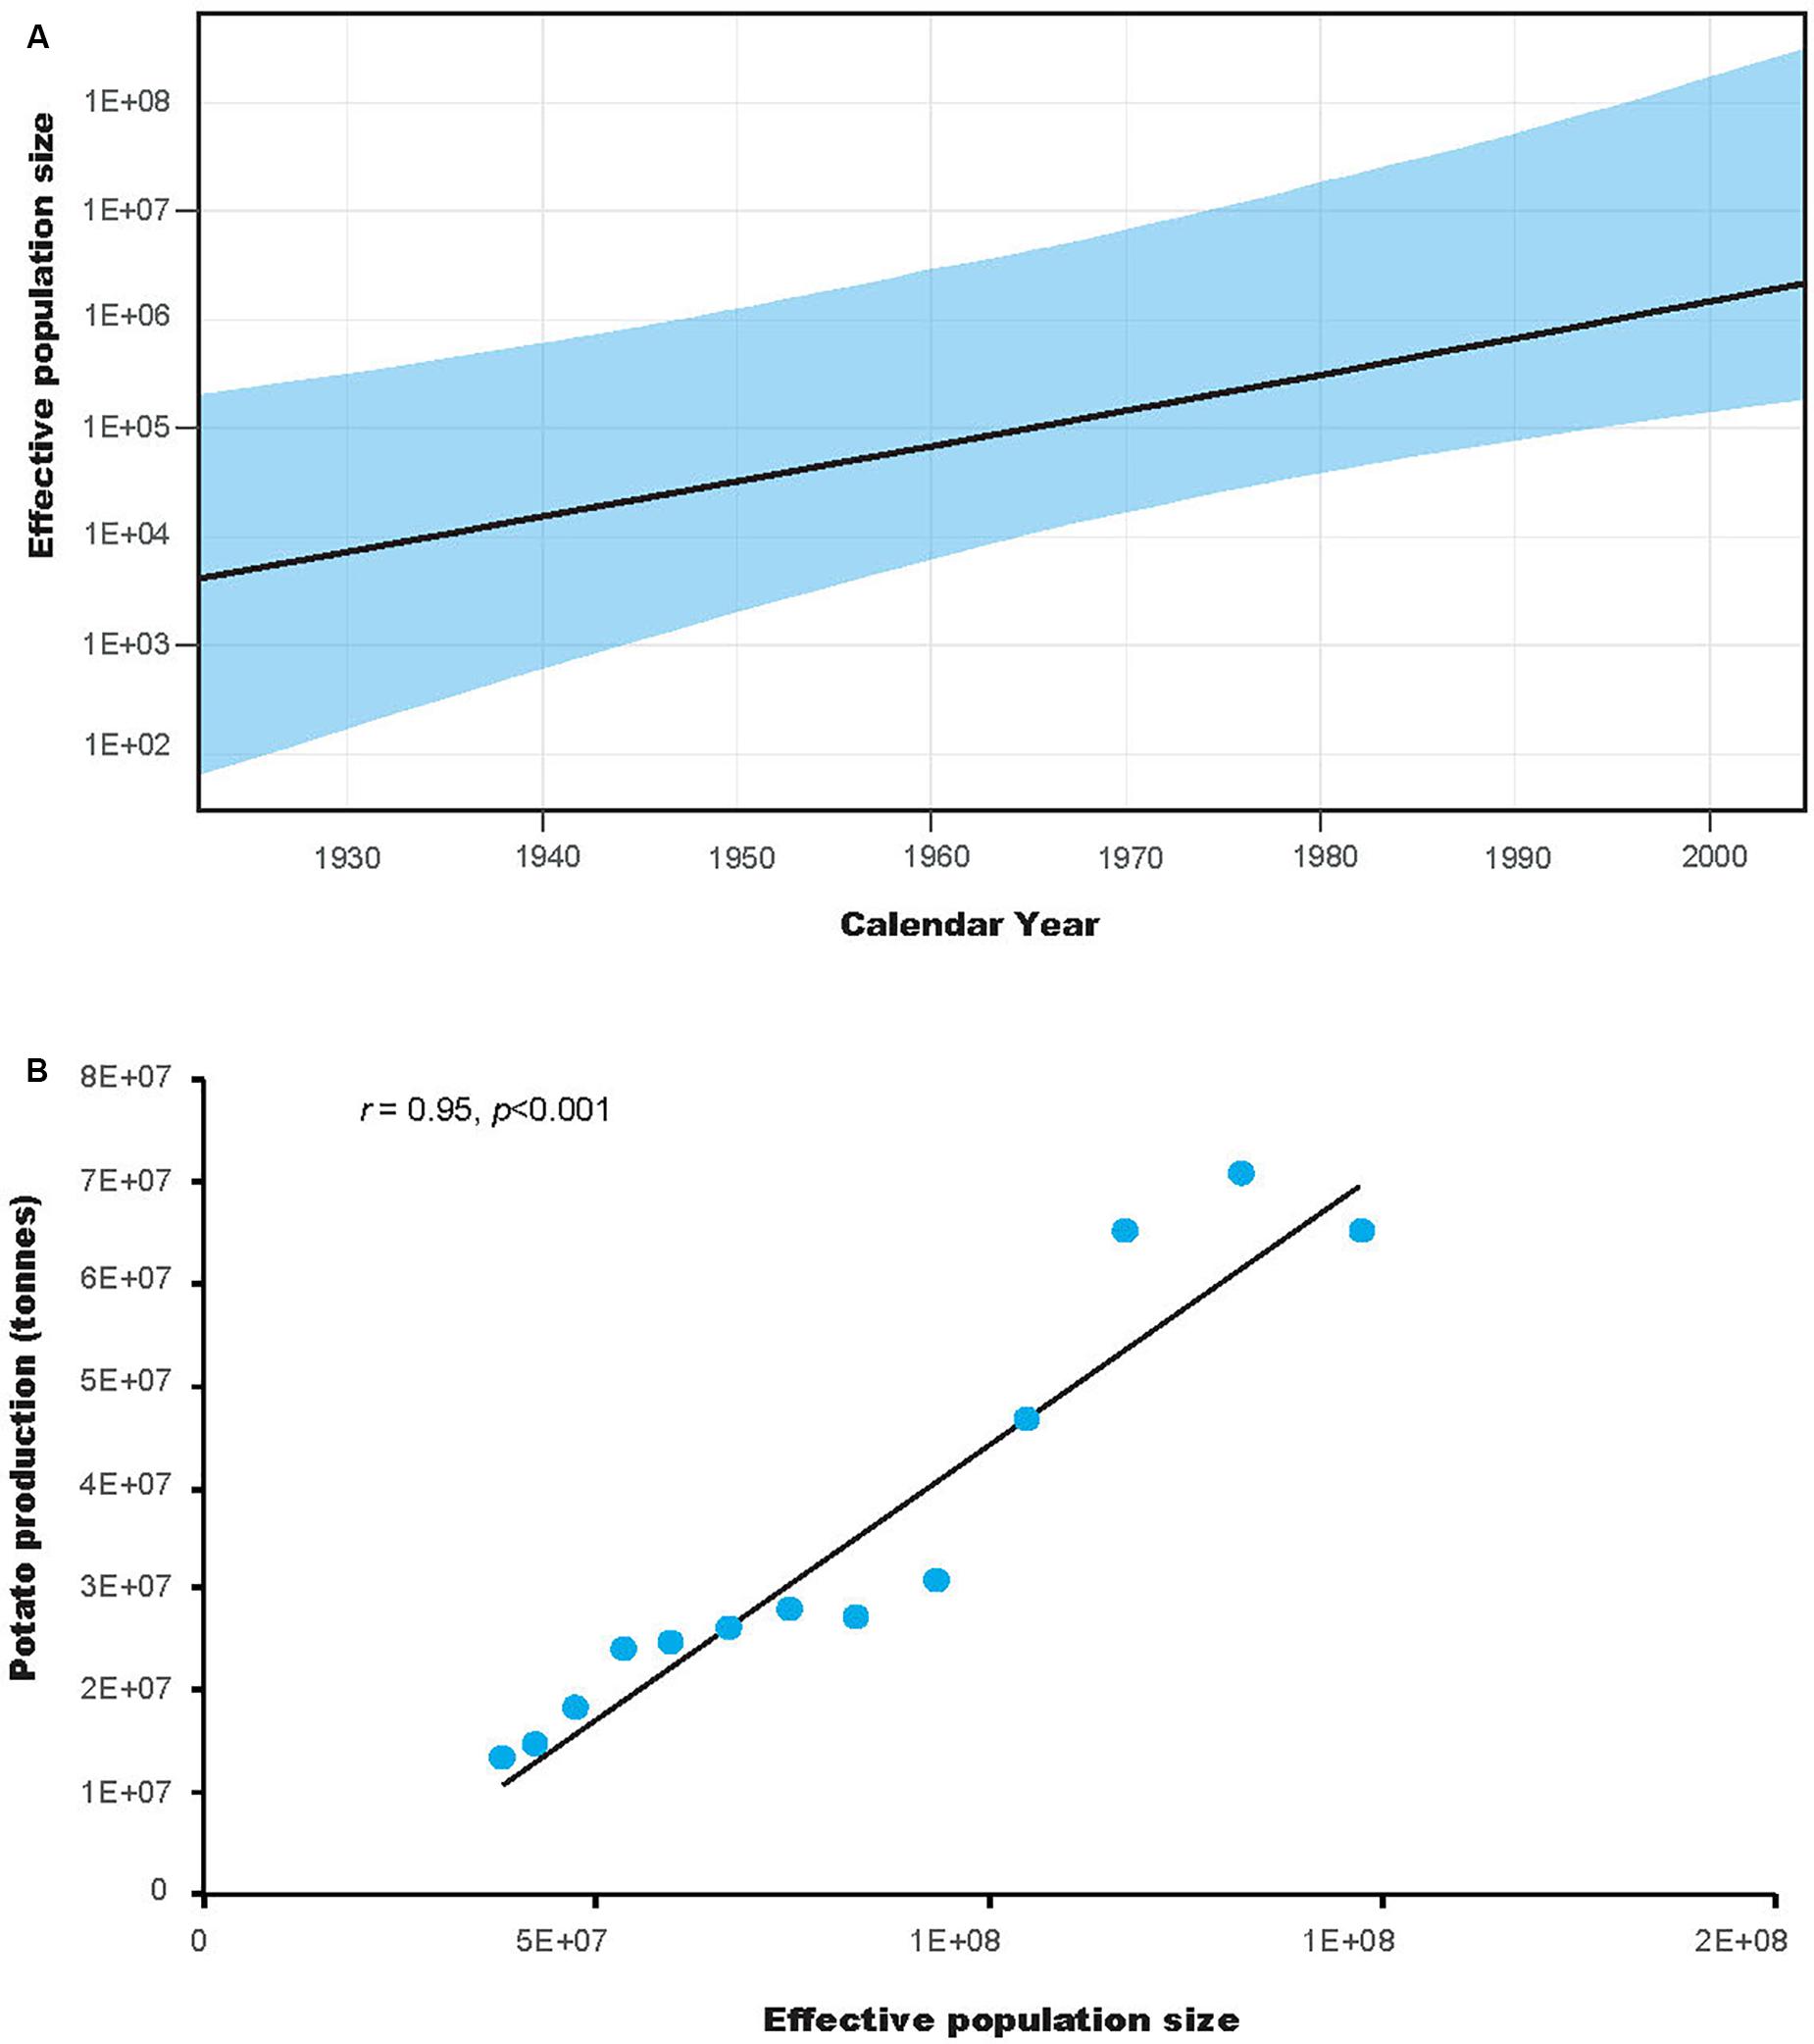
Figure 6. The demographic history of Phytophthora infestans and its correlation with the production of potato in China (A) Population dynamics of P. infestans. The x-axis units are years, and the y-axis is the effective population size, which provides a measure of relative genetic diversity. The areas in light blue are within the 95% highest posterior density interval. (B) Correlation between the effective population size and potato production in China. The y-axis units are tons.
Discussion
We obtained new sequence data for four mtDNA genes from 101 isolates of P. infestans in China. Using these data, we first investigated the genetic diversity of this pathogen. High haplotype diversity and low π was found. This differs from a recent study, which reported high genetic diversity in the effector gene Avr3a of 96 P. infestans isolates collected from six potato-planting regions in China (Yang et al., 2018). In addition to genetic markers, the major difference between the two studies was that only isolates with distinct genotypes were chosen in the previous, but not the current study (Yang et al., 2018). However, high genetic variation was also found in the mtDNA genes in the current study. In total, 62 nucleotide haplotypes (Table 1) and 70 isoforms (data not shown) were detected in the 101 sequences. The genetic variation is comparable to that of P. infestans nuclear genes (Yang et al., 2018).
Despite the high haplotype diversity of the P. infestans population, the low π suggests only small differences between haplotypes. This was also observed in the minimum spanning haplotype network (Figure 2). The high haplotype and low π observed in this study indicates rapid population expansion from a small effective population size (Grant and Bowen, 1998). Based on FAO data2, the production of potato in China increased from ∼12.91 million tons in 1961 to 6.45 million tons in 2006. This coincidence suggested a link between potato cultivation area and the population size of P. infestans. Indeed, our results supported this with a positive correlation between the demographic history and the production of potato in China (Figure 6B). Further studies aiming to understand how human activities influences the demographic expansion of the P. infestans population will be interesting.
Among the five geographic populations of P. infestans, the FuJ population had the highest genetic diversity. One potential reason for this is that the FuJ population may have acted as an important hub for the spread of P. infestans in China, because Fujian Province, a winter potato-cropping zone, imports seed tubers extensively from other cropping zones. This is also supported by the results regarding the MCMC jumps (Figure 5). Comparatively, the genetic variation was higher in P. infestans from potato than from tomato (Table 1). This might be due to the larger sample size of potato sequences compared to tomato sequences (70 vs. 31 isolates). When we recomputed the haplotype diversity after standardizing sample sizes with the smaller population (tomato in this case) using a bootstrapping approach, the difference in genetic variation between the two populations disappeared (p> 0.5, data not shown).
Current studies usually use the relatively short, reasonably variable gene fragments flanked by highly conserved sequences as mtDNA markers, such as the cox1 gene, which was used for DNA barcoding to identify plants and fungi (Robba et al., 2006; Stockinger et al., 2010). For intraspecific studies, slow mtDNA evolution generally results in low levels of polymorphism in mtDNA genome. A similar observation has been made for the eEF-1α gene of P. infestans (Wang et al., 2020). The atp1 gene is a rotary enzyme that exploits the proton gradient across the inner membrane, generated by the electron transport chain, to synthesize ATP (Song et al., 2018), however, it had the highest variability among the four mtDNA genes examined in this study, as indicated in Figure 3. This gene can distinguish closely related P. infestans populations between different geographic regions or host species; therefore, it could be an ideal genetic marker for population genetic analysis.
Our phylogeographic analysis revealed multiple north-to-south dispersal events in P. infestans in China (Figure 5 and Supplementary Table S4). This accords with the fact that seed potatoes are normally produced in northern China, suggesting that the pattern of P. infestans dispersal is associated with human-mediated activities. In China, the majority of potatoes in the winter-cropping and central double-cropping zones in southern China are intended for export, and not for planting, while seed potatoes are supplied from the northern single-cropping zone. Further studies to understand how human-mediated activities influence the migration of P. infestans should be informative.
Conclusion
In conclusion, this study examined the population genetic structure and phylogeography of P. infestans. The results showed high haplotype diversity, but low nucleotide diversity, of P. infestans in China. The diversification patterns are likely shaped by gene flow. We also found multiple north-to-south migration pathways of P. infestans in China, suggesting that the movement of seed potato tubers through the country has played a major role in the dispersal of P. infestans in China. This information is potentially valuable for the development of more effective strategies to control this pathogen. Further analyses of larger datasets with P. infestans outside of China will lead to a more comprehensive view of the evolutionary history of this pathogen.
Data Availability Statement
The datasets generated for this study can be found in the GenBank database under accession numbers MN458052 to MN45815 for cox1, MN458254 to MN458354 for nad9, MN458153 to MN458253 for nad4, and MN457951 to MN458051 for atp1.
Author Contributions
QC and FG conceived and designed the experiments and analyzed the data. CC, FG, BL, and QW performed the experiments. QC and FG wrote the manuscript. All the authors reviewed the manuscript.
Funding
This work was supported by grants from the National Natural Science Foundation of China (Grant No. 31772141), Science and Technology Major Project of Fujian Province (Grant No. 2017NZ0003-1) and The Provincial Public Welfare Project in Fujian Province (Grant No. 2019R1024-4).
Conflict of Interest
The authors declare that the research was conducted in the absence of any commercial or financial relationships that could be construed as a potential conflict of interest.
Acknowledgments
We thank Dr. Zhenguo Du and Dr. Fengping Chen (Fujian Agriculture and Forestry University) for their comments and suggestions on the manuscript and Dr. Yingbo Zhang (Chinese Academy of Tropical Agricultural Science) for his assistance during Figure 3’s preparation.
Supplementary Material
The Supplementary Material for this article can be found online at: https://www.frontiersin.org/articles/10.3389/fmicb.2020.01077/full#supplementary-material
Footnotes
References
Abascal, F., Zardoya, R., and Telford, M. J. (2010). TranslatorX: multiple alignment of nucleotide sequences guided by amino acid translations. Nucleic Acids Res. 38, W7–W13. doi: 10.1093/nar/gkq291
Baele, G., Lemey, P., Bedford, T., Rambaut, A., Suchard, M. A., and Alekseyenko, A. V. (2012). Improving the accuracy of demographic and molecular clock model comparison while accommodating phylogenetic uncertainty. Mol. Biol. Evol. 29, 2157–2167. doi: 10.1093/molbev/mss084
Balloux, F., and Lugon-Moulin, N. (2002). The estimation of population differentiation with microsatellite markers. Mol. Ecol. 11, 155–165. doi: 10.1046/j.0962-1083.2001.01436.x
Cardenas, M., Grajales, A., Sierra, R., Rojas, A., Gonzalez-Almario, A., Vargas, A., et al. (2011). Genetic diversity of Phytophthora infestans in the Northern Andean region. BMC Genet. 12:23. doi: 10.1186/1471-2156-12-23
Chen, F. P., Fan, J. R., Zho, T., Liu, X., Liu, J. L., and Schnabel, G. (2012). Baseline sensitivity of Monilinia fructicola from China to the DMI fungicide SYP-Z048 and analysis of DMI-resistant mutants. Plant Disease 96, 416–422. doi: 10.1094/PDIS-06-11-0495
Drummond, A. J., Ho, S. Y. W., Phillips, M. J., and Rambaut, A. (2006). Relaxed phylogenetics and dating with confidence. PLoS Biol. 4:e88. doi: 10.1371/journal.pbio.0040088
Excoffier, L., and Lischer, H. E. (2010). Arlequin suite ver 3.5: a new series of programs to perform population genetics analyses under Linux and Windows. Mol. Ecol. Resour. 10, 564–567. doi: 10.1111/j.1755-0998.2010.02847.x
Fu, Y.-X. (1997). Statistical tests of neutrality of mutations against population growth, hitchhiking and background selection. Genetics 147, 915–925.
Gilbert, G. S. (2002). Evolutionary ecology of plant diseases in natural ecosystems. Annu. Rev. Phytopathol. 40, 13–43. doi: 10.1146/annurev.phyto.40.021202.110417
Grant, W., and Bowen, B. (1998). Shallow population histories in deep evolutionary lineages of marine fishes: insights from sardines and anchovies and lessons for conservation. J. Heredity 89, 415–426.
Guo, J., Van Der Lee, T., Qu, D. Y., Yao, Y. Q., Gong, X. F., Liang, D. L., et al. (2009). Phytophthora infestans isolates from Northern China show high virulence diversity but low genotypic diversity. Plant Biol. 11, 57–67. doi: 10.1111/j.1438-8677.2008.00159.x
Guo, L., Zhu, X.-Q., Hu, C.-H., and Ristaino, J. B. (2010). Genetic structure of Phytophthora infestan populations in China indicates multiple migration events. Phytopathology 100, 997–1006. doi: 10.1094/PHYTO-05-09-0126
Haverkort, A. J., Boonekamp, P. M., Hutten, R., Jacobsen, E., Lotz, L. A. P., Kessel, G. J. T., et al. (2008). Societal costs of late blight in potato and prospects of durable resistance through cisgenic modification. Potato Res. 51, 47–57.
Holderegger, R., Kamm, U., and Gugerli, F. (2006). Adaptive vs. neutral genetic diversity: implications for landscape genetics. Landsc. Ecol. 21, 797–807.
Hudson, R. R. (2000). A new statistic for detecting genetic differentiation. Genetics 155, 2011–2014.
Hudson, R. R., Boos, D. D., and Kaplan, N. L. (1992). A statistical test for detecting geographic subdivision. Mol. Biol. Evol. 9, 138–151. doi: 10.1093/oxfordjournals.molbev.a040703
Jansky, S. H., Jin, L. P., Xie, K. Y., Xie, C. H., and Spooner, D. M. (2009). Potato production and breeding in China. Potato Res. 52, 57–65.
Jombart, T. (2008). adegenet: a R package for the multivariate analysis of genetic markers. Bioinformatics 24, 1403–1405. doi: 10.1093/bioinformatics/btn129
Jombart, T., Devillard, S., and Balloux, F. (2010). Discriminant analysis of principal components: a new method for the analysis of genetically structured populations. BMC Genet. 11:94. doi: 10.1186/1471-2156-11-94
Kalyaanamoorthy, S., Minh, B. Q., Wong, T. K. F., Von Haeseler, A., and Jermiin, L. S. (2017). ModelFinder: fast model selection for accurate phylogenetic estimates. Nat. Methods 14, 587–589. doi: 10.1038/nmeth.4285
Kirk, H., and Freeland, J. R. (2011). Applications and implications of neutral versus non-neutral markers in molecular ecology. Int. J. Mol. Sci. 12, 3966–3988. doi: 10.3390/ijms12063966
Lebreton, L., Laurent, C., and Andrivon, D. (1998). Evolution of Phytophthora infestans populations in the two most important potato production areas of France during 1992–96. Plant Pathol. 47, 427–439.
Leigh, J. W., and Bryant, D. (2015). popart: full-feature software for haplotype network construction. Methods Ecol. Evol. 6, 1110–1116.
Lemey, P., Rambaut, A., Drummond, A. J., and Suchard, M. A. (2009). Bayesian phylogeography finds its roots. PLoS Comput. Biol. 5:e1000520. doi: 10.1371/journal.pcbi.1000520
Li, B., Chen, Q., Lv, X., Lan, C., Zhao, J., Qiu, R., et al. (2009). Phenotypic and genotypic characterization of Phytophthora infestans isolates from China. J. Phytopathol. 157, 558–567.
Li, Y., Van Der Lee, T. A., Evenhuis, A., Van Den Bosch, G. B., Van Bekkum, P. J., Forch, M. G., et al. (2012). Population dynamics of Phytophthora infestans in the Netherlands reveals expansion and spread of dominant clonal lineages and virulence in sexual offspring. G3 2, 1529–1540. doi: 10.1534/g3.112.004150
Librado, P., and Rozas, J. (2009). DnaSP v5: a software for comprehensive analysis of DNA polymorphism data. Bioinformatics 25, 1451–1452. doi: 10.1093/bioinformatics/btp187
Martin, D. P., Murrell, B., Golden, M., Khoosal, A., and Muhire, B. (2015). RDP4: Detection and analysis of recombination patterns in virus genomes. Virus Evol. 1:vev003. doi: 10.1093/ve/vev003
Mcdonald, B. A., and Linde, C. (2002). Pathogen population genetics, evolutionary potential, and durable resistance. Annu. Rev. Phytopathol. 40, 349–379. doi: 10.1146/annurev.phyto.40.120501.101443
Pfeifer, B., Wittelsbürger, U., Ramos-Onsins, S. E., and Lercher, M. J. (2014). PopGenome: an efficient Swiss army knife for population genomic analyses in R. Mol. Biol. Evol. 31, 1929–1936. doi: 10.1093/molbev/msu136
Rambaut, A., Drummond, A. J., Xie, D., Baele, G., and Suchard, M. A. (2018). Posterior summarisation in Bayesian phylogenetics using Tracer 1.7. Syst. Biol. 67, 901–904. doi: 10.1093/sysbio/syy032
Ramsden, C., Melo, F. L., Figueiredo, L. M., Holmes, E. C., and Zanotto, P. M. (2008). High rates of molecular evolution in hantaviruses. Mol. Biol. Evol. 25, 1488–1492. doi: 10.1093/molbev/msn093
Rieux, A., and Khatchikian, C. E. (2017). TipDatingBeast: an R package to assist the implementation of phylogenetic tip-dating tests using BEAST. Mol. Ecol. Resour. 17, 608–613. doi: 10.1111/1755-0998.12603
Ristaino, J. B., and Hu, C. H. (2009). DNA sequence analysis of the late-blight pathogen gives clues to the world-wide migration. Acta Horticult. 834, 27–40.
Robba, L., Russell, S. J., Barker, G. L., and Brodie, J. (2006). Assessing the use of the mitochondrial cox1 marker for use in DNA barcoding of red algae (Rhodophyta). Am. J. Bot. 93, 1101–1118. doi: 10.3732/ajb.93.8.1101
Song, J., Pfanner, N., and Becker, T. (2018). Assembling the mitochondrial ATP synthase. Proc. Natl. Acad. Sci. U.S.A. 115:2850. doi: 10.1073/pnas.1801697115
Stockinger, H., Krüger, M., and Schüßler, A. (2010). DNA barcoding of arbuscular mycorrhizal fungi. New Phytol. 187, 461–474. doi: 10.1111/j.1469-8137.2010.03262.x
Suchard, M. A., Lemey, P., Baele, G., Ayres, D. L., Drummond, A. J., and Rambaut, A. (2018). Bayesian phylogenetic and phylodynamic data integration using BEAST 1.10. Virus Evol. 4:vey016. doi: 10.1093/ve/vey016
Tajima, F. (1989). Statistical method for testing the neutral mutation hypothesis by DNA polymorphism. Genetics 123, 585–595.
Tian, Y. E., Yin, J. L., Sun, J. P., Ma, Y. F., Wang, Q. H., Quan, J. L., et al. (2016). Population genetic analysis of Phytophthora infestans in northwestern China. Plant Pathol. 65, 17–25. doi: 10.1094/PHYTO-03-14-0073-R
Vieira, M. L., Santini, L., Diniz, A. L., and Munhoz, C. (2016). Microsatellite markers: what they mean and why they are so useful. Genet. Mol. Biol. 39, 312–328. doi: 10.1590/1678-4685-GMB-2016-0027
Wang, Y. P., Xie, J. H., Wu, E. J., Yahuza, L., Duan, G. H., and Shen, L. L. (2020). Lack of gene flow between Phytophthora infestans populations of two neighboring countries with the largest potato production. Evol. Appl. 13, 318–329. doi: 10.1111/eva.12870
Weir, B. S., and Cockerham, C. C. (1984). Estimating F-statistics for the analysis of population structure. Evolution 38, 1358–1370.
Yang, L., Ouyang, H. B., Fang, Z. G., Zhu, W., Wu, E. J., Luo, G. H., et al. (2018). Evidence for intragenic recombination and selective sweep in an effector gene of Phytophthora infestans. Evol. Appl. 11, 1342–1353. doi: 10.1111/eva.12629
Yoshida, K., Schuenemann, V. J., Cano, L. M., Pais, M., Mishra, B., and Sharma, R. (2013). The rise and fall of the Phytophthora infestans lineage that triggered the Irish potato famine. eLife 2:e00731. doi: 10.7554/eLife.00731
Keywords: Phytophthora infestans, mitochondrial DNA, genetic diversity, population structure, migration pattern
Citation: Gao F, Chen C, Li B, Weng Q and Chen Q (2020) The Gene Flow Direction of Geographically Distinct Phytophthora infestans Populations in China Corresponds With the Route of Seed Potato Exchange. Front. Microbiol. 11:1077. doi: 10.3389/fmicb.2020.01077
Received: 24 September 2019; Accepted: 30 April 2020;
Published: 26 May 2020.
Edited by:
John R. Battista, Louisiana State University, United StatesReviewed by:
Camilo E. Khatchikian, Dartmouth College, United StatesJadwiga Śliwka, Plant Breeding and Acclimatization Institute, Poland
Kentaro Yoshida, Kobe University, Japan
Copyright © 2020 Gao, Chen, Li, Weng and Chen. This is an open-access article distributed under the terms of the Creative Commons Attribution License (CC BY). The use, distribution or reproduction in other forums is permitted, provided the original author(s) and the copyright owner(s) are credited and that the original publication in this journal is cited, in accordance with accepted academic practice. No use, distribution or reproduction is permitted which does not comply with these terms.
*Correspondence: Qinghe Chen, Y2hlbnFoQGZhYXMuY24=
 Fangluan Gao
 Changsheng Chen2
 Benjin Li
 Qiyong Weng
 Qinghe Chen
