 Jhonatan A. Hernandez-Valdes
 Ana Solopova2
 Oscar P. Kuipers
- 1Department of Molecular Genetics, Groningen Biomolecular Sciences and Biotechnology Institute, University of Groningen, Groningen, Netherlands
- 2School of Microbiology, APC Microbiome, University College Cork, Cork, Ireland
Some secondary metabolites of fermentative bacteria are desired compounds for the food industry. Examples of these compounds are diacetyl and acetaldehyde, which are produced by species of the lactic acid bacteria (LAB) family. Diacetyl is an aromatic compound, giving the buttery flavor associated with dairy products, and acetaldehyde is the compound responsible for the yogurt flavor and aroma. The quantification of these compounds in food matrices is a laborious task that involves sample preparation and specific analytical methods. The ability of bacteria to naturally sense metabolites has successfully been exploited to develop biosensors that facilitate the identification and quantification of certain metabolites (Mahr and Frunzke, 2016). The presence of a specific metabolite is sensed by the biosensors, and it is subsequently translated into the expression of one or more reporter genes. In this study we aimed to develop fluorescence-based biosensors to detect diacetyl and acetaldehyde. Since the metabolic pathways for production and degradation of these compounds are present in Lactococcus lactis, the sensing mechanisms in this bacterium are expected. Thus, we identified diacetyl and acetaldehyde responsive promoters by performing transcriptome analyses in L. lactis. The characterization of the biosensors showed their response to the presence of these compounds, and a further analysis of the diacetyl-biosensors (its dynamics and orthogonality) was performed. Moreover, we attempted to produce natural diacetyl from producer strains, namely L. lactis subsp. lactis biovar diacetylactis, to benchmark the performance of our biosensors. The diacetyl-biosensors responded linearly to the amounts of diacetyl obtained in the bacterial supernatants, i.e., the increases in GFP expression were proportional to the amounts of diacetyl present in the supernatants of L. lactis subsp. lactis biovar diacetylactis MR3-T7 strain. The biosensors developed in this study may eventually be used to engineer strains or pathways for increased diacetyl and acetaldehyde production, and may facilitate the detection of these metabolites in complex food matrices.
Introduction
Lactic acid bacteria (LAB) have been used in the production of fermented foods for decades (Song et al., 2017). In the dairy industry, these bacteria utilize lactose as the major carbon source (Neves et al., 2005). Although lactic acid is the major product of lactose fermentation and has a preservative role, LAB metabolism creates other end-products with organoleptic properties like improved flavor or texture, and/or extended shelf-life (Kleerebezemab et al., 2000). Some LAB under different physiological conditions are able to produce acetate, acetaldehyde, acetoin, diacetyl and 2,3-butanediol (Hugenholtz and Starrenburg, 1992; Bintsis, 2018). These minor products are relevant in fermentations. In particular, diacetyl and acetaldehyde are desired flavor compounds in dairy products.
Diacetyl is an aromatic compound known for its buttery aroma and taste. It is found in several dairy products, mainly butter, margarine, sour cream and some cheeses (Rincon-Delgadillo et al., 2012; Clark and Winter, 2015). The amounts of diacetyl reported for dairy products such as margarine, yogurt and Goat milk Jack cheese are 27 ppm (0.31 mM), 200–3000 μg/g (2.1–31.4 mM), and 5.97–13.69 μg/g (0.06–0.14 mM), respectively (Attaie, 2009; Rincon-Delgadillo et al., 2012; Shibamoto, 2014). In addition, diacetyl is naturally present in other products, yet in lower amounts, such as wine and coffee (Clark and Winter, 2015). For instance, the amounts of diacetyl reported for wine and coffee are 0.5–10 mg/L (0.006–0.116 mM) and 2.72 μg/g (0.028 mM), respectively (De Revel et al., 2000; Daglia et al., 2007). Besides its natural appearance in dairy products, diacetyl has a high commercial value and it is manufactured for use as a food additive. Starter distillates (SDs) are also relevant in the formulation of many food products such as cottage cheese and sour cream. The amount of diacetyl in SD ranges from 1.2 to 22,000 μg/g (0.00001–0.22 M). Likewise, acetaldehyde is the major component of the yogurt flavor, which is a mixture of several compounds such as acetone, diacetyl and acetaldehyde (Chaves et al., 2002). Acetaldehyde is present in dairy foods such as yogurt and cheeses in very low amounts, in a range from 73 to 7,000 ng/g (0.002–0.159 M) (Jeong et al., 2015).
A lot of research has focused on the sugar metabolism in Lactococcus lactis, the model LAB, which is used as a starter culture for cheese making (Smit et al., 2005). Several engineering strategies using the L. lactis MG1363 strain have resulted in the re-routing of carbon metabolism to increase the production of a specific end product such as diacetyl or acetaldehyde (Hugenholtz et al., 2000; Bongers et al., 2005). However, besides the low amounts of the desired compound obtained, and the requirements of strain-engineering methods, their quantification and screening of strains is a laborious work. Biosensors can be utilized as a semi-quantitative tool to facilitate the detection a quantification of these compounds in complex food matrices, which is currently a difficult task that depends on tedious sample preparation methods and analytical methods (Bertels et al., 2012). In essence, genetically encoded biosensors are molecular tools that enable the detection of metabolites in certain matrices in combination with high-throughput screening approaches (Lim et al., 2015).
A biosensor consists of a metabolite-sensing element and a reporting element. In this respect, transcription-based biosensors are metabolite-responsive transcription factors coupled to reporter genes like the genes encoding fluorescent proteins (Fernandez-López et al., 2015; Mahr and Frunzke, 2016). Bacteria are able to respond to many chemical compounds via transcription factors, and the engineering of these sensing systems is achieved by using molecular biology techniques (Zhang and Keasling, 2011). With regard to the utility of the green fluorescent protein (GFP) as a reporting element, a bacterial promoter drives the expression of the GFP, and enables the application of fluorescence activated cell sorting (FACS) as a suitable high-throughput technique. A plethora of biosensors have been developed over the past decades for biotechnological and medical applications (Close et al., 2009; Zhang and Keasling, 2011; Brutesco et al., 2017). One example of transcription-based biosensors is an E. coli acetoacetate sensor based on the GFP expression driven by the promoter of the atoSC genes encoding a two-component system, which is activated by acetoacetate (Gonzales et al., 2016).
In the present study, we employed transcriptome analysis to identify L. lactis genes selectively up-regulated in the presence of diacetyl and acetaldehyde. The candidate promoters that regulate these genes were used to construct fluorescence-based biosensors. The functionality of the biosensors to respond to the presence of the compounds of interest was confirmed by GFP expression. A further characterization of the diacetyl-biosensors was performed to understand the range of diacetyl concentrations to observe response and whether cross-induction by other metabolites is present. Furthermore, we aimed to obtain diacetyl from several producer L. lactis subsp. lactis biovar diacetylactis strains. To this end, we applied the biosensors to correlate the diacetyl concentration in bacterial supernatants with the fluorescence signals from the biosensors. A concentration of up to 0.42 mM diacetyl resulted in a proportional increase in the GFP measurements. Therefore, we suggest that the biosensors obtained in this work can find application in the quantification of extracellular production of diacetyl and acetaldehyde.
Materials and Methods
Chemical Compounds
The chemicals diacetyl 97%, acetaldehyde >= 99.5%, acetoin >= 96%, and 2,3-butanediol 98%, used in this study were purchased from Sigma-Aldrich, St. Louis, MO, United States.
Bacterial Strains and Growth Conditions
The bacterial strains used in this study are listed in Table 1. L. lactis cells were routinely grown as standing cultures at 30°C in M17 broth (DifcoTM BD, Franklin Lakes, NJ, United States) or in chemically defined medium (CDM) (Goel et al., 2012), supplemented with glucose (GM17) or lactose (LM17; Sigma-Aldrich, St. Louis, MO, United States) at a concentration of 0.5% (w/v). When appropriate, the culture medium was supplemented with 5 μg mL–1 erythromycin.
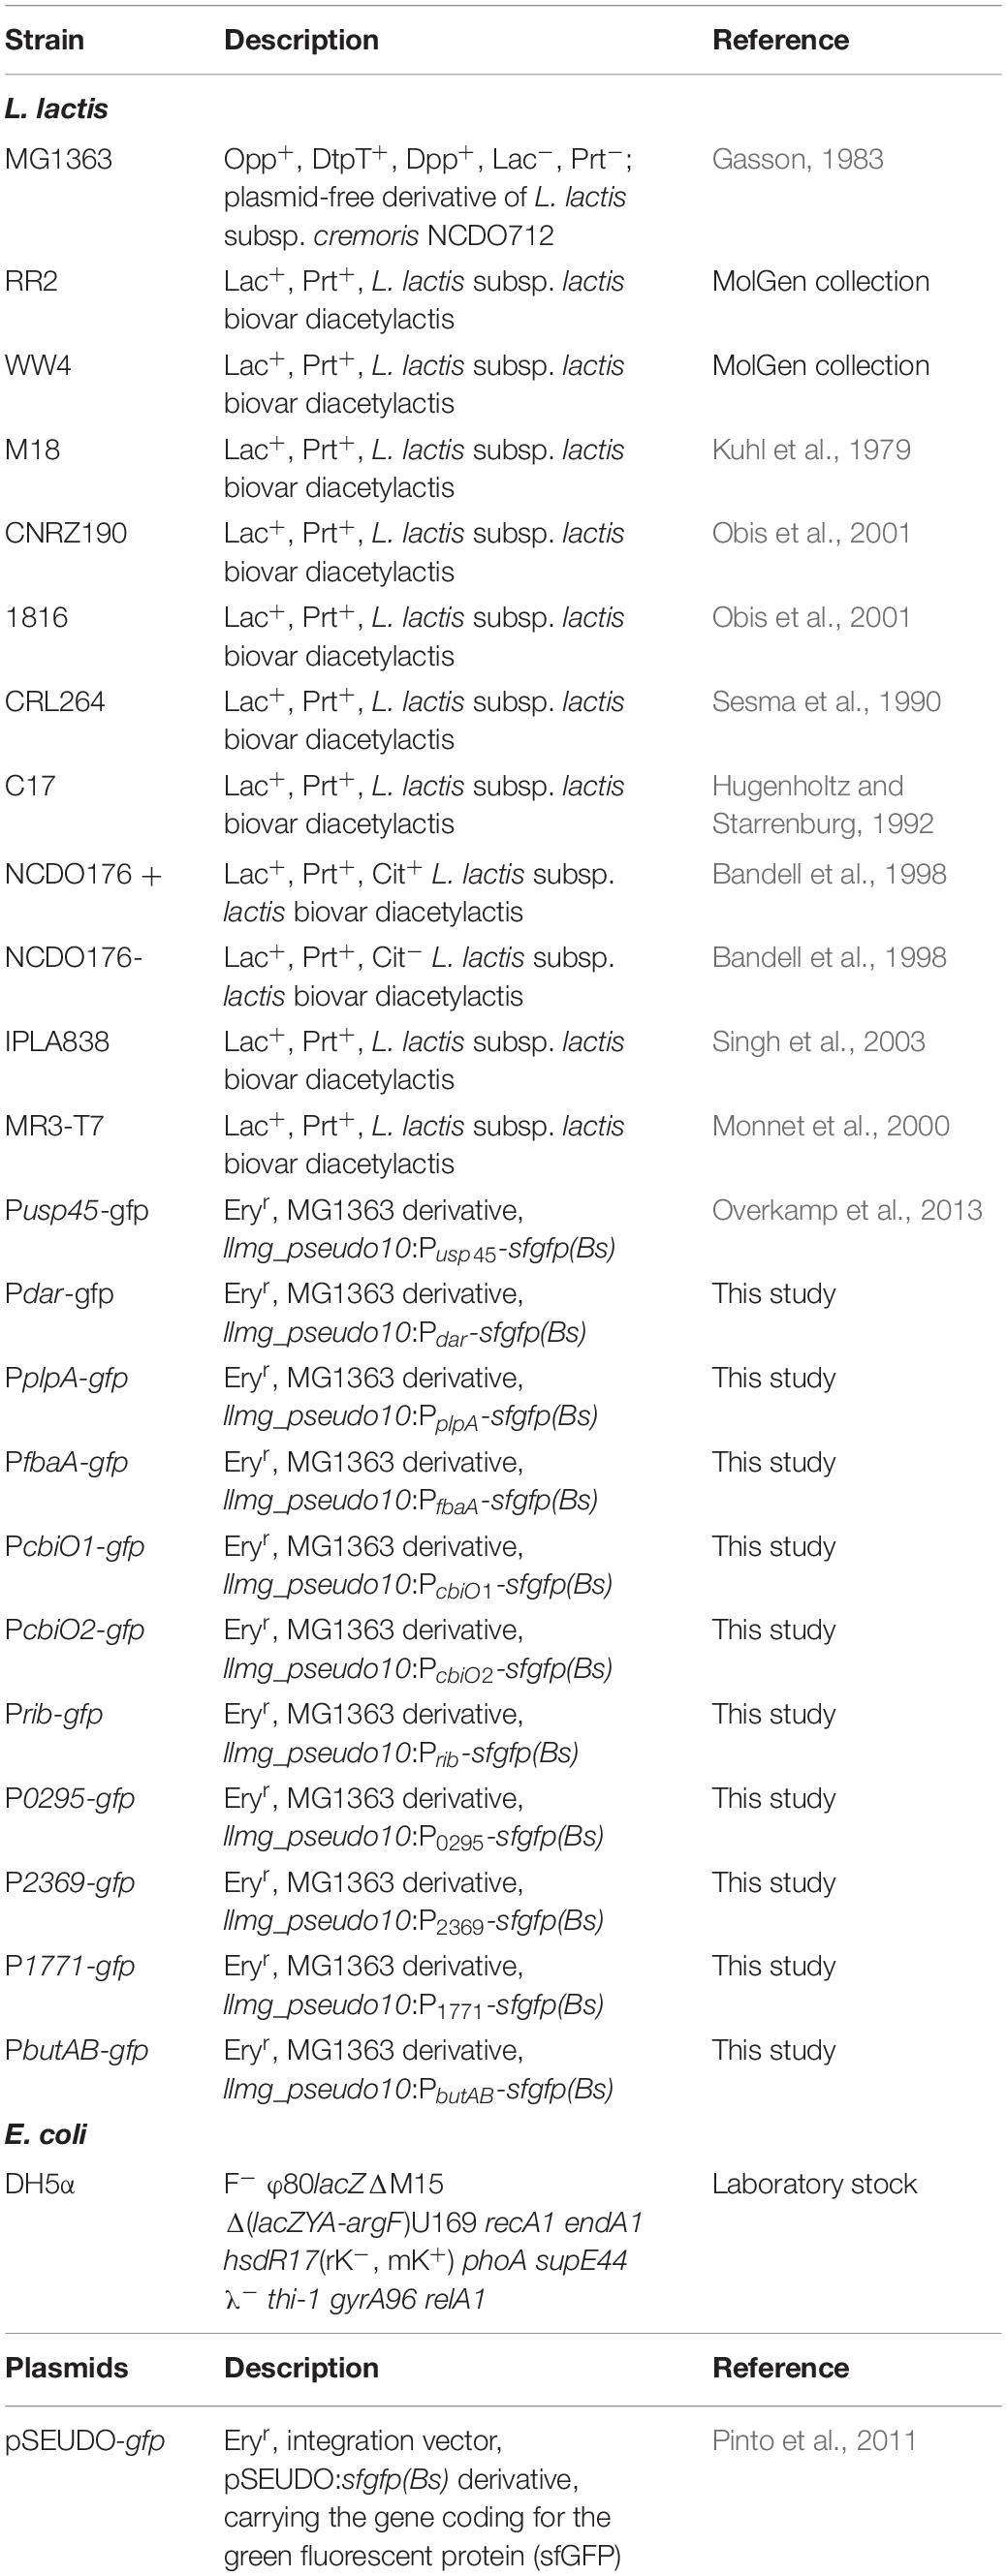
Table 1. Strains and plasmids used in this study.
Escherichia coli DH5α strain (Life Technologies, Gaithersburg, MD, United States) was used as the host for cloning and it was grown at 37°C in Luria-Bertani broth or Luria-Bertani agar 1.5% (w/v) (DifcoTM BD, Franklin Lakes, NJ, United States). When appropriate, the culture medium was supplemented with 250 μg mL–1 erythromycin.
To promote diacetyl production, the L. lactis subsp. lactis biovar diacetylactis strains (Table 1) were grown in skim milk 10% (w/v) or M17 medium, supplemented with citrate 2% (w/v), and catalase 70 U. Bacterial cultures were grown at 200 rpm in a shaker incubator at 30°C.
M17 and LB-agar plates were prepared by adding agar 1.5% (w/v), and glucose (GM17) or lactose (LM17) to M17. When appropriate, the culture medium was supplemented with 250 μg mL–1 erythromycin for E. coli and with 5 μg mL–1 erythromycin for L. lactis.
To corroborate the low lactate dehydrogenase activity in the MR3-T7 strain, bacterial cells were plated on LDAH-20-agar plates. The LDAH-20 was prepared as described previously (El Attar et al., 2000). Briefly, LADH medium is a M17- derived medium containing 2.5 g tryptone, 5 g papain digest of soy beans, 2.5 g peptic digest of meat, 5 g meat extract, 2.5 g yeast extract, 0.5 g L-ascorbic acid, 0.25 g MgSO4, 0.5 g K2HPO4, 10 g glucose. All chemical compounds were dissolved in 1 L distilled water, and the pH was adjusted to 7 with HCl. The medium was autoclaved at 115°C for 15 min, after which its temperature was held at 50°C and 10 ml filter-sterilized 2,3,5-triphenyl tetrazolium (TTC; Sigma-Aldrich, St. Louis, MO, United States) solution (10 g L–1) was added. LDAH medium was supplemented with 20 g glycerophosphate, resulting in LAHD-20 medium. LDAH-20-agar plates were prepared by adding agar 1.5% (w/v).
For overnight cultures, flow cytometry analysis and plate-reader assays, L. lactis cells were grown in CDM with glucose 0.5% (w/v) and collected by centrifugation from exponential growth cultures (optical density of 0.4 at 600 nm) and washed three times with phosphate-buffered saline (PBS) solution (pH 7.2) containing: KH2PO4 15.44 μM, NaCl 1.55 mM and Na2HPO4 27.09 μM.
Recombinant DNA Techniques and Oligonucleotides
Procedures for DNA manipulations (gel electrophoresis and transformation) were performed as described by Sambrook et al. (1989). PCRs were performed in an Eppendorf thermal cycler (Eppendorf, Hamburg, Germany) with L. lactis chromosomal DNA as template, using Phusion polymerase (Thermo Fisher Scientific, Inc., Waltham, MA, United States). Oligonucleotides (Table 2) were purchased from Biolegio (Nijmegen, Netherlands). Plasmid DNA and PCR products were isolated and cleaned-up with a High-Pure plasmid isolation kit (Roche Applied Science, Mannheim, Germany), according to the protocol of the manufacturer. Colony PCR and subsequent sequencing (Macrogen, Amsterdam, Netherlands) was used to verify the constructs.
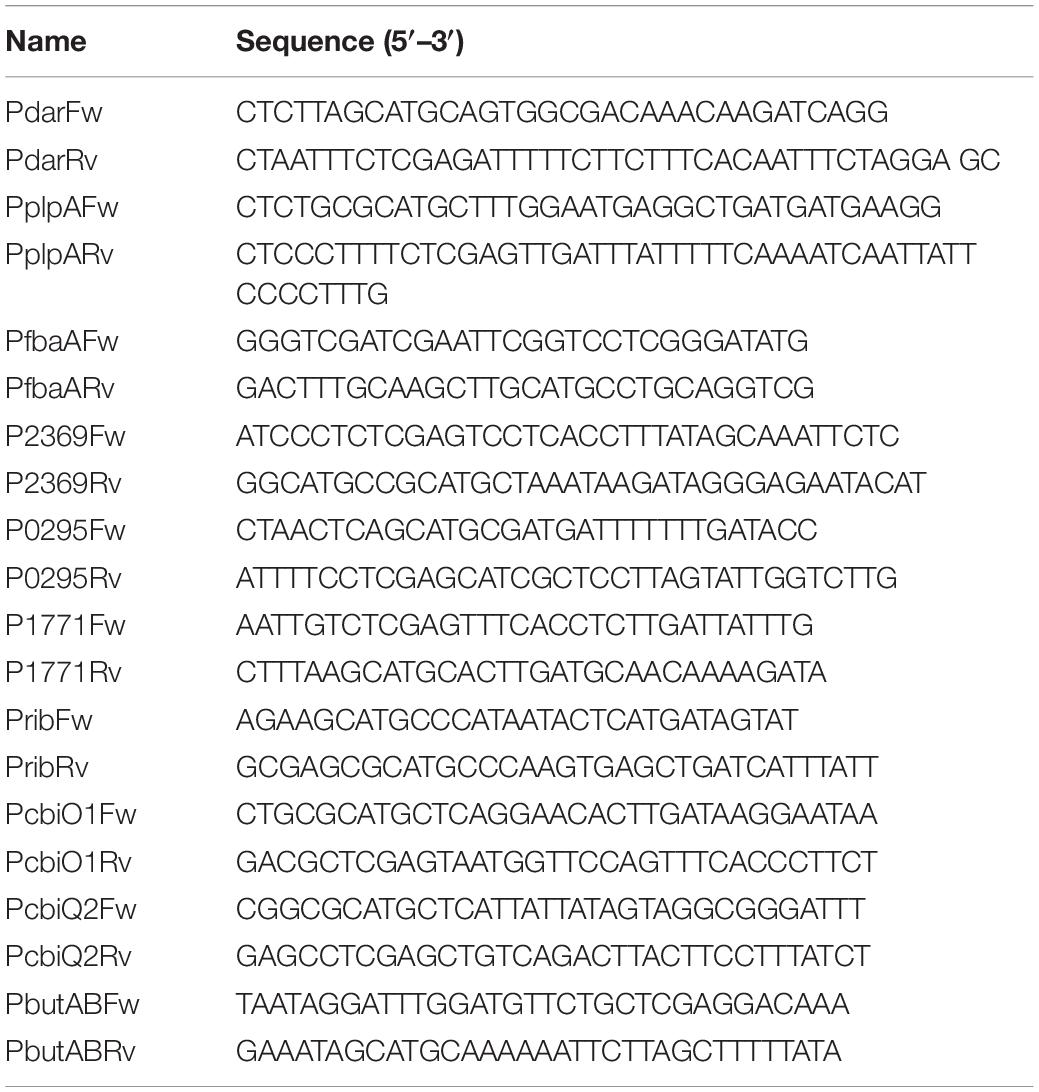
Table 2. Oligonucleotides used in this study.
Construction of Biosensor Strains
We used the L. lactis MG1363 strain. All constructed strains are described in Table 1. Candidate promoter regions of the selected up-regulated genes (predicted to be located within the first 300 bp of the non-coding region preceding the open reading frame of the candidate up-regulated gene/transcriptional unit) were selected. To construct the vector pSEUDO:Pr-gfp, carrying one of the L. lactis MG1363 candidate promoters, the promoter region was amplified by PCR using the Pr_Fw and Pr_Rv, using chromosomal DNA as template. The PCR fragment was cleaved with PaeI/XhoI enzymes and ligated to pSEUDO-gfp (Pinto et al., 2011). The vector pSEUDO:Pr-gfp was integrated into the silent llmg_pseudo10 locus of L. lactis MG1363 by a single-crossover integration as described previously (Overkamp et al., 2013). Transformants were selected on M17-agar plates supplemented with sucrose, glucose and erythromycin 5 ug mL–1, yielding the L. lactis Pr-gfp strains.
Growth Curves
The L. lactis MG1363 strain was grown in the presence of diacetyl or acetaldehyde in GM17 broth. L. lactis cells were grown overnight at 30°C in GM17. Overnight cultures were diluted 1:20 in 10 mL of fresh GM17 and grown at 30°C until exponential growth phase (optical density of 0.4 at 600 nm). The chemical compounds were added at the following concentrations: diacetyl at 1, 5, 10, 30 mM, and acetaldehyde at 0.005, 0.02, 0.1, 0.2, 0.7, 1, 2, and 2.5 M. Acetaldehyde is extremely volatile. Therefore, the tubes were closed tightly after the compound was added (see Supplementary Figure 1). Growth curves for diacetyl-treated cultures were obtained by measuring the optical density at 600 nm (OD600) every 30 or 60 min. Final cell densities in acetaldehyde-treated cultures were obtained by measuring the optical density at 600 nm of the bacterial cultures after 5.5 h of incubation.
Sampling and RNA Isolation
Cultures of L. lactis were grown and prepared as described above. At exponential growth phase (OD600 = 0.4) diacetyl was added at a concentration of 5 mM, and acetaldehyde at a concentration of 0.7 M. After 30 min, the equivalent of 10 OD600 units of volume (volume in mL multiplied by OD600) was taken. Cells were collected by centrifugation in 50 mL Greiner tubes in an Eppendorf 5810R centrifuge (Eppendorf AG, Hamburg, Germany), during 10 min centrifugation, speed 10,000 rpm, at 4°C. Cells were resuspended in 0.5 mL of TE buffer (10 mM Tris-HCl, 1 mM Na2-EDTA, pH 8.0), prepared with diethylpyrocarbonate (DEPC)-treated deionized water. Cells were transferred to a 2 mL screw cap tube, immediately frozen in liquid nitrogen and then kept at −80°C.
For RNA isolation, 0.5 g of glass beads (∼100 μm in diameter), 50 μL of 10% sodium dodecylsulfate (SDS; Sigma-Aldrich, St. Louis, MO, United States), 500 μL of premixed phenol:chloroform:isoamylalcohol (25:24:1) and 175 μL of macaloid suspension were added to the thawed cells in the screw cap tube. Cells were disrupted using 2 cycles of 45 s of bead beating with a 1 min interval on ice. The cell lysate was cleared by centrifugation in an Eppendorf 5417R centrifuge (Eppendorf AG, Hamburg, Germany) during 10 min centrifugation, speed 10000 rpm, at 4°C. Next, the upper phase was extracted with 500 μL of chloroform: isoamylalcohol (24:1). The two phases were resolved by centrifugation (10 min, 10000 rpm, 4°C) and total RNA was isolated from the aqueous phase using the High Pure RNA Isolation Kit (Roche Molecular Biochemicals, Mannheim, Germany), according the manufacturer’s instructions. RNA concentration was determined with a NanoDrop ND-1000 spectrophotometer (NanoDrop Technologies, Wilmington, DE, United States); RNA quality was assessed using an Agilent Bioanalyzer 2100 with RNA 6000 LabChips (Agilent Technologies Netherlands BV, Amstelveen, Netherlands).
DNA Microarray Procedure
Synthesis of copy DNA (cDNA) was performed using the Superscript III Reverse Transcriptase kit (Invitrogen, Carlsbad, CA, United States). Incorporation of amino allyl-modified dUTPs during cDNA synthesis allowed Cy3/Cy5 labeling with the CyScribe Post labeling Kit (Amersham Biosciences, Piscataway, NJ, United States), according to the supplier’s instructions. All intermediate and final purifications of either labeled or unlabeled cDNA were performed with a NucleoSpin Extract II Kit (Clontech Laboratories, Mountain View, CA, United States), according to manufacturer’s instructions except when purifying unlabeled cDNA, where 80% ethanol was used in a second washing step and 0.1M sodium bicarbonate, pH 9.0, was used as the elution buffer.
Hybridization to the probes spotted on the L. lactis MG1363 mixed amplicon and oligonucleotide DNA microarray slides, covering 2308 of the 2435 predicted ORF’s, was done using the Slidehyb 1 hybridization buffer (Ambion Biosystems, Foster City, CA, United States), during 16 h at 45°C. After hybridization, slides were washed for 5 min in 2X SSC (150 mM NaCl and 15 mM trisodium citrate) with 0.5% SDS, 2 times for 5 min in 1X SSC with 0.25% SDS and 5 min in 1X SSC with 0.1% SDS. All washing steps were performed at 30°C with preheated buffers. The washing buffers were removed via centrifugation (Eppendorf 5810R, 2 min, 2000 rpm). The DNA microarray slides were scanned using a GenePix Autoloader 4200AL confocal laser scanner (Molecular Devices Corporation, Sunnyvale, CA, United States). The resulting images were analyzed using the ArrayPro Analyzer 4.5 software (Media Cybernetics, Silver Spring, MD, United States). Signal intensities were quantified for each spot on the DNA microarray slides after subtracting the background intensities, which were determined for each spot by reading the signals in the regions that separated diagonal spots. Signals were initially normalized and scaled via LOWESS using the MicroPrep software (van Hijum et al., 2003), after which a Dimensioning-Noise-Amplitude (D-N-A) scaling was performed.
Flow Cytometry
Lactococcus lactis cultures were grown overnight in CDM as described above, washed three times in PBS and transferred to fresh CDM supplemented with diacetyl (3.5 mM) or acetaldehyde (0.5M). The cultures were incubated at 30°C and samples were taken at beginning of the stationary growth phase. The GFP-signal in all samples was recorded in 10,000 events (cells) and used for downstream analysis (named ungated events in the corresponding figures). GFP-signal measurements were obtained with a FACS Canto flow cytometer (BD Biosciences, San Jose, CA, United States) using a 488 nm argon laser. A threshold for the FSC and SCC parameters was set (200 in both) in the FACS Canto flow cytometer (BD Biosciences, San Jose, CA, United States) to remove all the events that do not correspond to cells. Raw data was collected using the FACSDiva Software 5.0.3 (BD Biosciences). And the FlowJo software was used for data analysis1.
To benchmark the performance of the biosensor to detect diacetyl in bacterial supernatants, 700 μL of filtered L. lactis subsp. lactis biovar diacetylactis supernatant were used for induction, or 700 μL of a diacetyl solution (0.42 mM) as control. 500 μL of fresh CDM were added to grow the biosensor cells. The cultures were incubated at 30°C and samples were taken at beginning of the stationary growth phase. The GFP-signal at single-cell level was recorded in 10,000 ungated events as described above.
Plate Reader Assays
Cultures of L. lactis were grown and prepared as described above. For fluorescence intensity measurements, L. lactis cells were diluted 1:20 in CDM. When testing the effect of varying concentrations of diacetyl, acetoin or 2,3-butanediol, CDM was used and supplemented with different compound concentrations (diacetyl 1.2, 1.7, 2.3, 2.9, 3.5, 4.1, 4.6 mM; acetoin 0.11, 0.17, 0.23, 0.28, 0.34, 0.4, 0.45 M; and 2,3-butanediol 0.22, 0.33, 0.44, 0.55, 0.67, 0.78, 0.89 M). The growth and fluorescence signal were recorded in 0.2 mL cultures in 96-well micro-titer plates and monitored by using a micro-titer plate reader VarioSkan (Thermo Fisher Scientific, Inc., Waltham, MA, United States). Growth was recorded with measurements of the optical density at 600 nm (OD600) and the GFP-signal was recorded with excitation at 485 nm and emission at 535 nm every 10 min for 24 h. Both signals were corrected for the background value of the corresponding growth medium. The highest GFP-signals in relative fluorescence units (RFUs) were normalized by the corresponding OD600 measurements, yielding RFU/OD600 values.
Voges-Proskauer (VP) Test
Lactococcus. lactis cells were grown as standing cultures at 30°C in peptone-glucose broth (MR-VP broth) for 28 h. This medium was prepared with pancreatic digest of casein 7.0 g, dipotassium phosphate 5.0 g, and dextrose 5.0 g. The components were dissolved in 1 L deionized water, and pH adjusted to 6.9. The medium was autoclaved at 115°C for 15 min.
The Voges-Proskauer reagents were freshly prepared, Barritt’s reagent A: 5% (w/v) 1-naphtol (Sigma-Aldrich, St. Louis, MO, United States) in absolute ethanol. Barritt’s B: 40% (w/v) KOH in deionized water. The VP test was performed as reported previously (Mcdevitt, 2009). Briefly, 0.6 mL of Barritt’s reagent A were added to 2.5 mL of the bacterial cultures, then 0.2 mL of Barritt’s reagent B were added. The tubes were shaken for 30 s to expose the culture to atmospheric oxygen, and allowed to stand for 30 min. Within 1 h the tubes were compared. A yellowish color indicates VP-negative and a red color indicates VP-positive.
Quantification of Pyruvate Metabolites
Acetoin and 2-acetolactate concentrations were obtained colorimetrically using the method developed by Westerfeld (1945). The diacetyl concentration was obtained using the method developed by Elliker (1945) and Westerfeld (1945). Acetoin and 2-acetolactate concentrations were determined as follows. 200 μL of each filtered bacterial supernatant were used. 400 μL of NaOH 1 M (for acetoin quantification) or HCl 0.5 M (for 2-acetolactate quantification) were added to the supernatant. Samples were incubated at 44°C for 30 min. 400 μL of deionized water, 1 mL of creatine 0.5% (w/v) and 1 mL of 1-naphtol 5% (w/v) were added. The reactions were incubated at 20°C for 60 min and absorbance was measured at 525 nm using a plate reader. The 2-acetolactate (α-acetolactate) concentration is obtained with the formula HCl treated sample = [decarboxylated α − acetolactate] + [acetoin]. And the results were multiplied by the factor 100/62 (a 62% of 2-acetolactate standard is transformed to acetoin under the assay conditions). A standard curve was measured using acetoin (0.1–2.4 mM). To quantify diacetyl, 680 μL of filtered supernatant were used. Next, 20 μL of 3,3- diamino benzidine tetrahydrochloride 0.5% (w/v) were added. After incubation for 1 min at room temperature, 200 μL of H2SO4 3M and 100 μL of water were added. Samples were incubated for 10 min at room temperature, and absorbance was measured at 366 nm using a plate reader. A standard curve was measured using diacetyl (0.01–1 mM).
Statistics and Reproducibility
Statistical analyses were performed using Prism 6.01 (GraphPad software2) and R v3.3.0. All experiments were repeated independently at least three times.
Bioinformatics
Promoters were identified in the met promoter region were analyzed with PePPER (de Jong et al., 2012). Output Visualization of the gene expression profiles was studied and depicted using R 2.15.1 software packages3.
Accession Numbers
Gene expression data were deposited in the GEO database under accession numbers: GSE147695 and GSE147696.
Results
L. lactis Growth in the Presence of Diacetyl and Acetaldehyde
To determine the effect of diacetyl and acetaldehyde on cell growth of our model strain L. lactis MG1363, we measured the optical density at 600 nm (OD600) of bacterial cultures in the presence of different concentrations of diacetyl and acetaldehyde (see section “Materials and Methods”). Figure 1A shows the L. lactis growth curves in the presence of diacetyl. At a concentration of 5 mM (blue line), the bacterial culture is able to grow, but reaches a lower final cell density compared to the untreated culture. In contrast to concentrations above 10 mM, where the growth curves of bacterial cultures show a decline phase and a low final cell density. These results are in agreement with a previous study of the antimicrobial properties of diacetyl, where LAB were unaffected by the presence of diacetyl at a maximum concentration of 4 mM (Jay, 1982). Figure 1B shows the final cell density of L. lactis cultures in the presence of acetaldehyde. This compound is extremely volatile (boiling point approximately 21°C; Supplementary Figure 1) (Osborne et al., 2000), and thus, single measurements of the final cell densities of bacterial cultures in the presence of acetaldehyde were measured. At a concentration of 0.7M (blue dots), the bacterial culture is able to grow, but reaches a lower final cell density compared to the untreated culture. In contrast, the bacterial cultures with acetaldehyde at concentrations above 2M show very low final cell densities. Although the antimicrobial properties of acetaldehyde have been reported against Escherichia coli (1 mM) (Vandenbergh, 1993), the inhibitory concentration has not been calculated for Gram-positive bacteria.
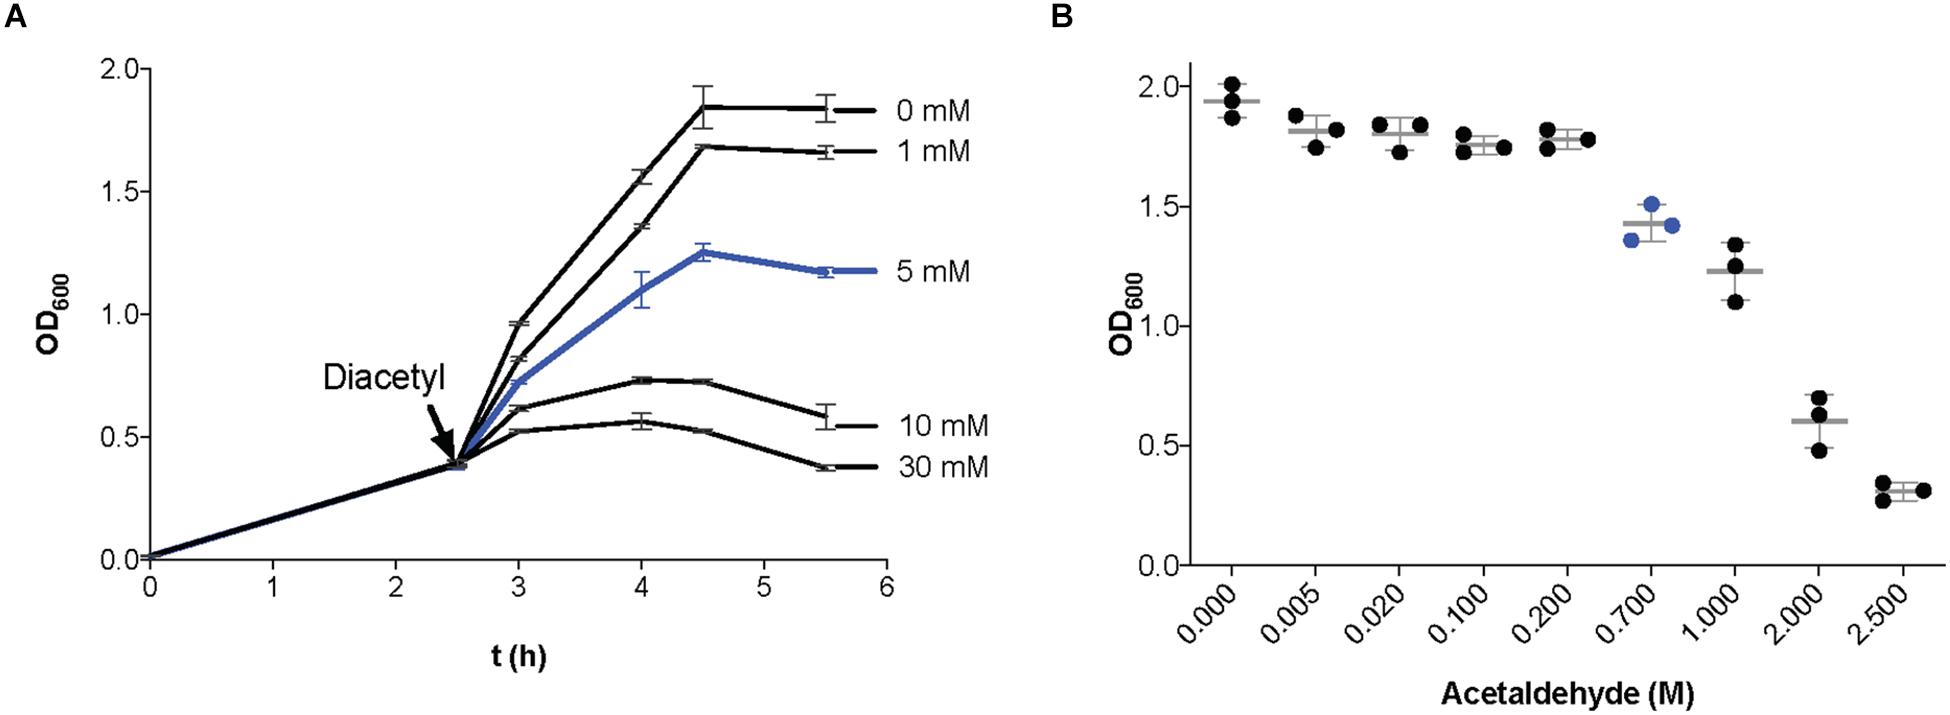
Figure 1. Effect of the presence of diacetyl and acetaldehyde on Lactococcus lactis growth. (A) Growth curves (optical density at 600 nm; OD600) of bacterial cultures in GM17. When the cultures reached an OD600 = 0.4 (black arrow), incubation continued in the presence of different concentrations of diacetyl (1–30 mM). A concentration of 5 mM diacetyl (line in blue) was used for transcriptome analysis. (B) Final optical density at 600 nm of L. lactis cultures incubated in GM17 in the presence of different concentrations of acetaldehyde (0.005–2.5 M). A concentration of 0.7 M acetaldehyde (blue dots) was used for transcriptome analysis. Data are presented as mean ± SD. Error bars represent standard deviation (SD) of the mean values of three independent experiments.
Identification of Diacetyl- and Acetaldehyde-Responsive Genes by Transcriptome Analysis
We performed a transcriptome analysis of L. lactis cells treated with either diacetyl or acetaldehyde in order to study gene expression changes upon exposure to these compounds. The transcriptome analysis was performed after 30 min exposure to the compounds. Notable differences in global gene expression profiles between treated and untreated samples were observed (see Supplementary Figure 2 and Data File). A differential expression analysis of all the genes is shown in the Supplementary Material. Next, we selected genes up-regulated in the presence of diacetyl or acetaldehyde, and identified the promoters controlling the expression of these genes (Tables 3, 4). The selection of these candidate responsive promoters is primarily based on the genes with a high fold change value, and secondly whether the up-regulated genes belong to single transcriptional units, except for the gene llmg_025, which is a single gene but showed a high level of up-regulation (25-fold; see Table 3). With regard to the latter criteria, the selection of promoters controlling transcriptional units composed of more than one gene minimizes type I errors (minimizing false positives) (Junier and Rivoire, 2016), i.e., the selection of one promoter that regulates the expression of a set of up-regulated genes because these genes belong to a single transcriptional unit. Importantly, Table 3 shows two possible promoters in the predicted transcriptional units, i.e., dar-plpD and cbiOQ (see Supplementary Figure 3A), and both promoters were considered for further analysis.
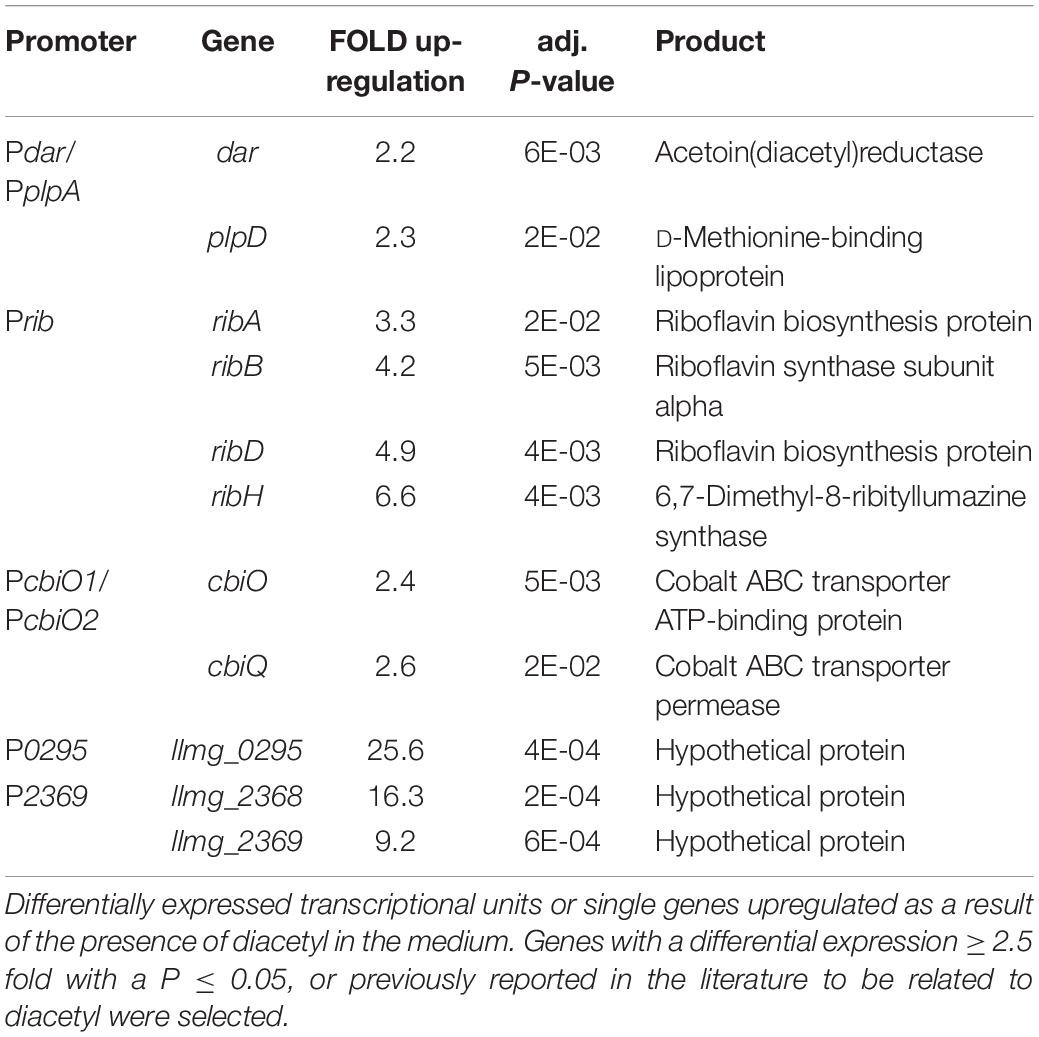
Table 3. Candidate responsive promoters to diacetyl.
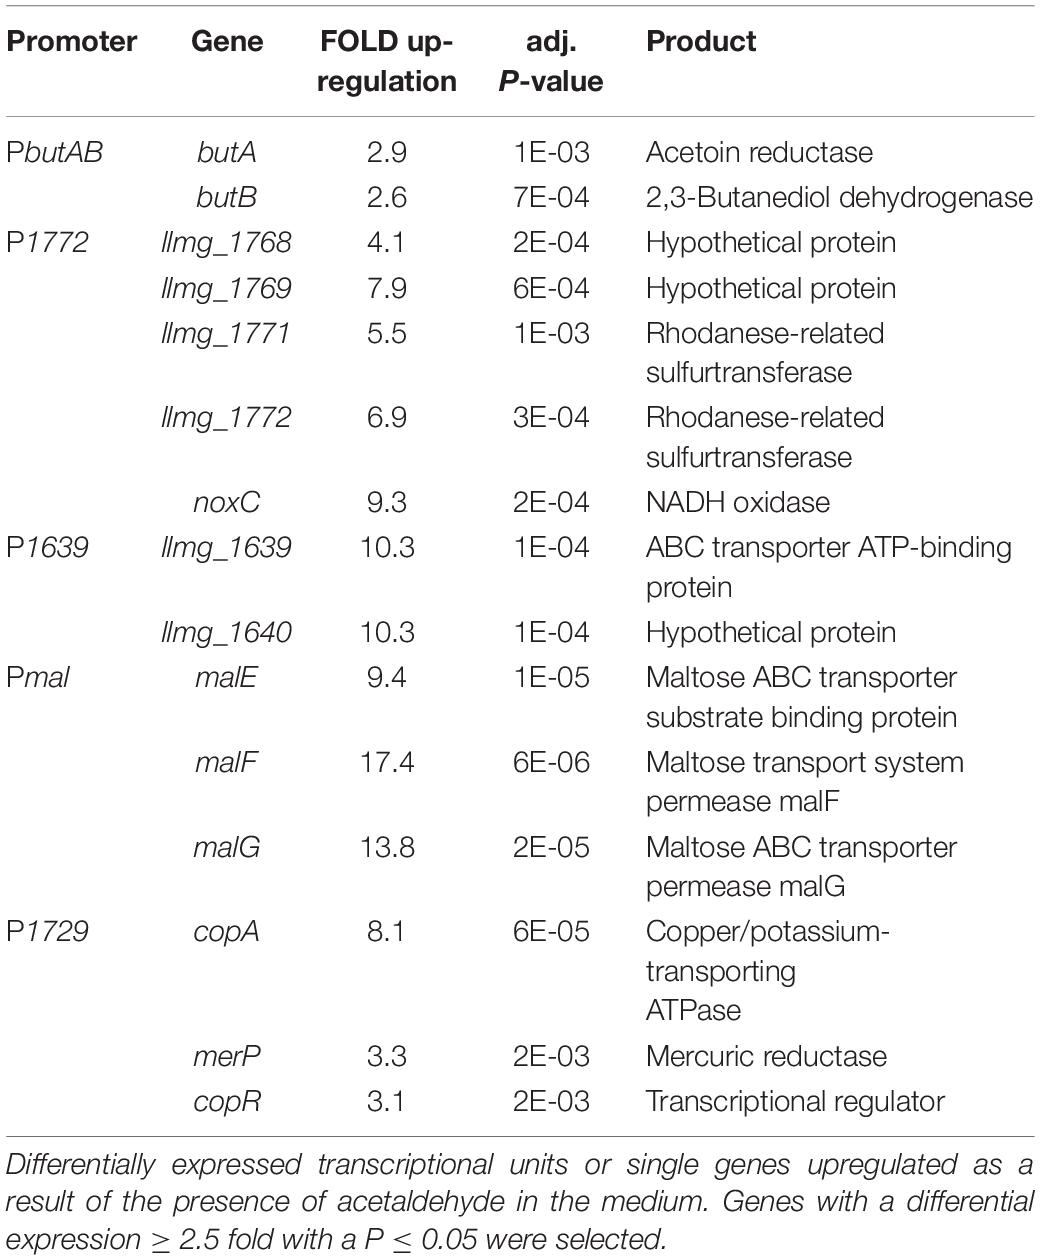
Table 4. Candidate responsive promoters to acetaldehyde.
Development of Biosensors
The DNA sequences of the candidate promoters were cloned upstream the gene encoding the GFP. Competent cells of L. lactis were transformed with the vectors bearing the transcriptional fusions to obtain the fluorescent-based biosensors (Supplementary Figure 3B). Figure 2 shows the response of the constructed biosensors to diacetyl. The Pdar-gfp strain shows higher fluorescence levels in the presence of diacetyl, in contrast to the PplpA-gfp strain, which shows the same fluorescence levels in the treated and untreated sample. The response of these two candidate promoters for the transcriptional unit dar-plpD (PplpA-gfp and Pdar-gfp) confirms that only Pdar-gfp is induced with diacetyl. The response of the selected promoters for the transcriptional unit cbiOQ (PcbiO1-gfp and PcbiO2-gfp) shows induction in both, although PcbiQ2 is more sensitive to diacetyl as it reaches higher fluorescence intensity in the presence of diacetyl than PcbiO1-gfp. Moreover, higher GFP expression levels are also observed in Prib-gfp, P0295-gfp, and P2369-gfp when the strains are exposed to diacetyl.
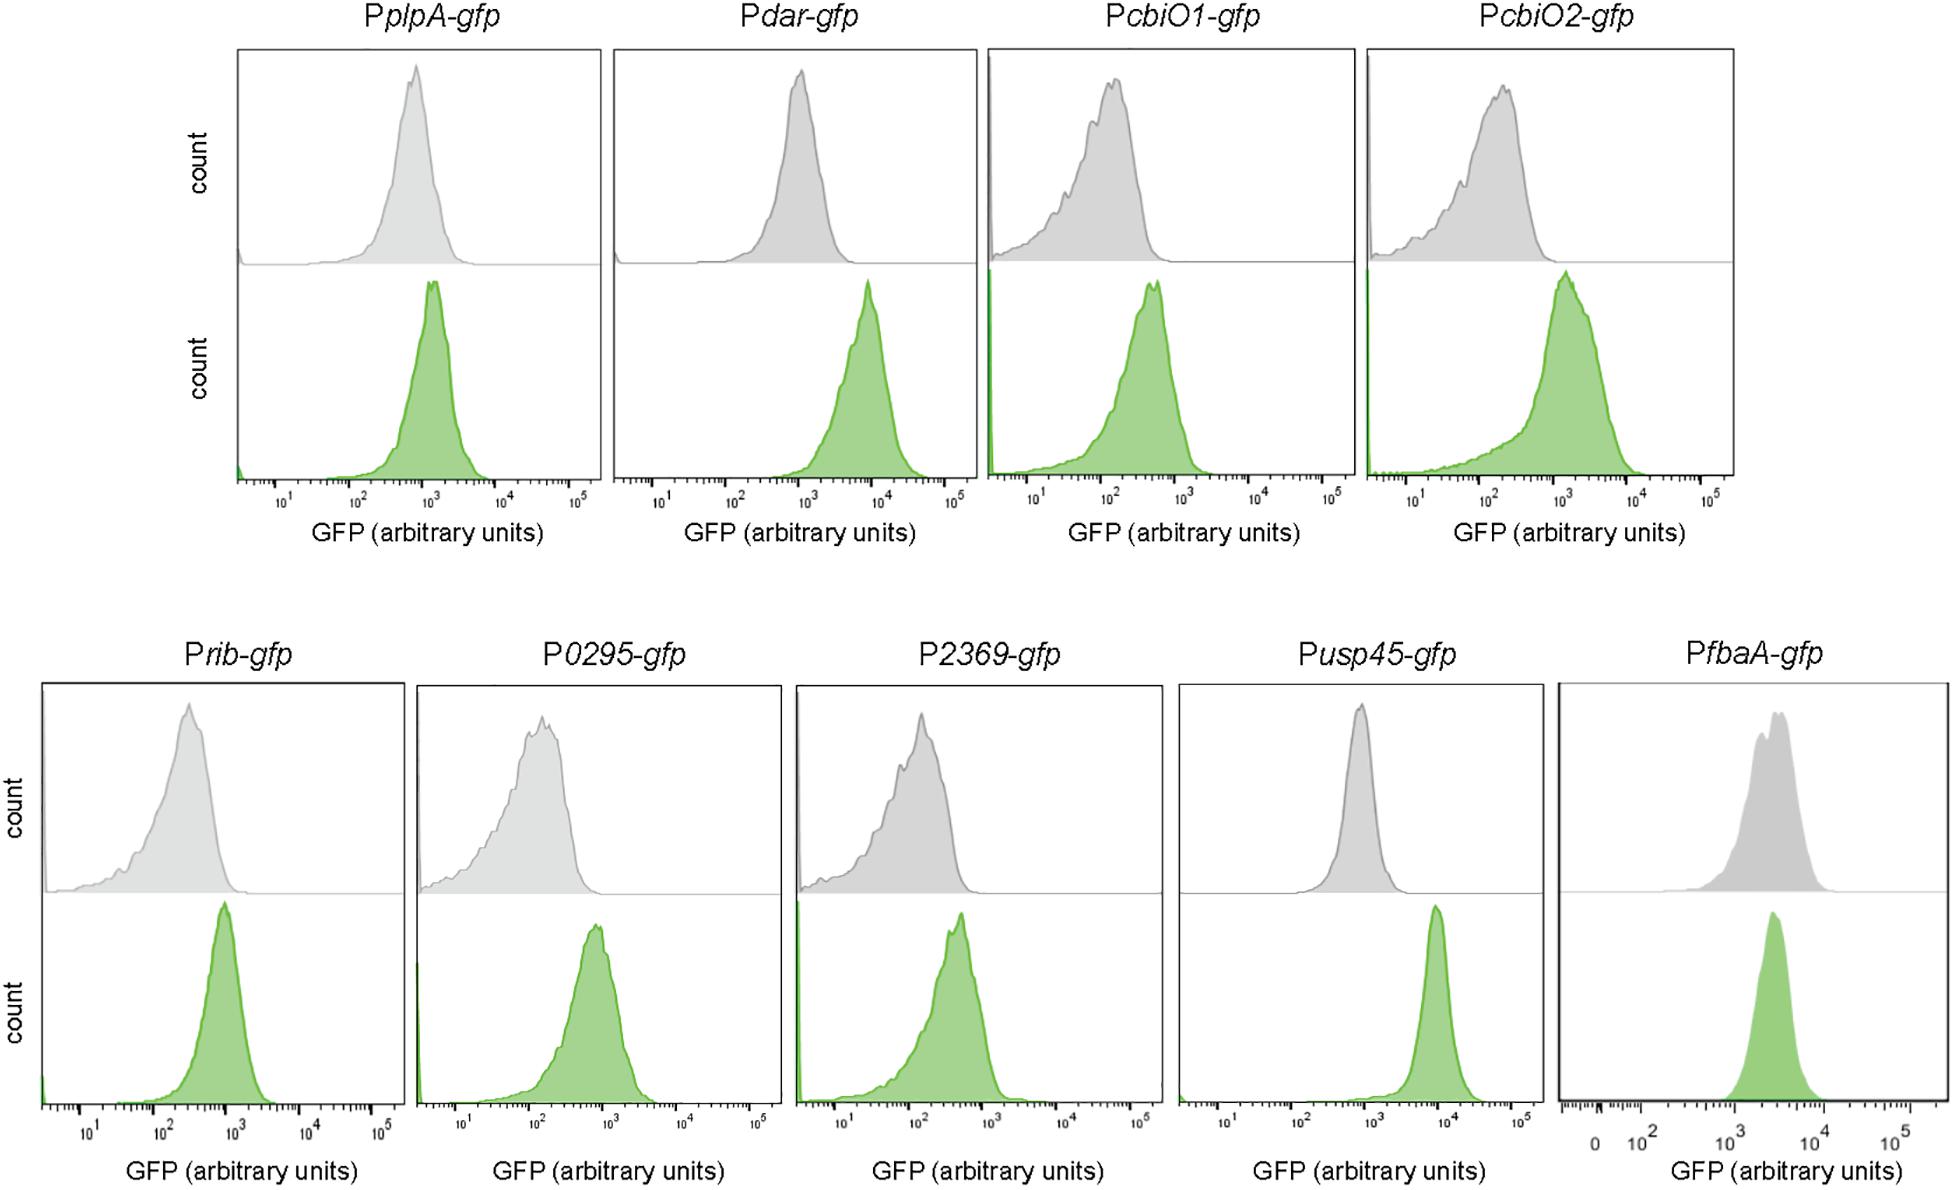
Figure 2. Diacetyl-inducible biosensors. Single-cell fluorescence measurements by flow cytometry, in the absence (gray) and presence of 3.5 mM diacetyl (green). Fluorescence measurements were taken at the beginning of stationary growth phase. 10,000 ungated events for each sample are shown.
To validate our results, we aimed to test the response of a constitutive promoter to the presence of diacetyl. The usp45 promoter has been previously described as a strong promoter in L. lactis (Li et al., 2011). A strain bearing a transcriptional fusion with the usp45 promoter was constructed as described above. In an unexpected way, the Pusp45-gfp strain responds to diacetyl as well, and a clear separation of treated and untreated cells is observed. However, our transcriptome analysis shows only a 1.02 fold-change value for the usp45 gene. It is important to mention that microarrays tend to have a low dynamic range, which results in under-representations of fold changes in gene expression (Mutch et al., 2001). For instance, highly expressed genes, such as usp45, tend to have little variance, and a small fold change for these genes might be relevant. To validate our observations, we constructed another transcriptional fusion with the promoter PfbaA. The fbaA gene encodes the fructose-bisphosphate aldolase, a key enzyme in the glycolysis pathway, i.e., it has a housekeeping role in metabolism (Shams et al., 2014). The PfbaA-gfp strain does not respond to diacetyl and, just as the non-inducible PplpA-gfp strain, is a suitable control to validate our results.
Two transcriptional fusions were tested for acetaldehyde. Figure 3 shows that the PbutAB-gfp and P1771-gfp strains respond to acetaldehyde. Moreover, in both strains a clear separation between the treated and untreated samples is observed. To validate these findings, the strains Pusp45-gfp and PfbaA-gfp were also exposed to acetaldehyde. Certainly, both strains Pusp45 and PfbaA do not respond to acetaldehyde and are suitable controls.
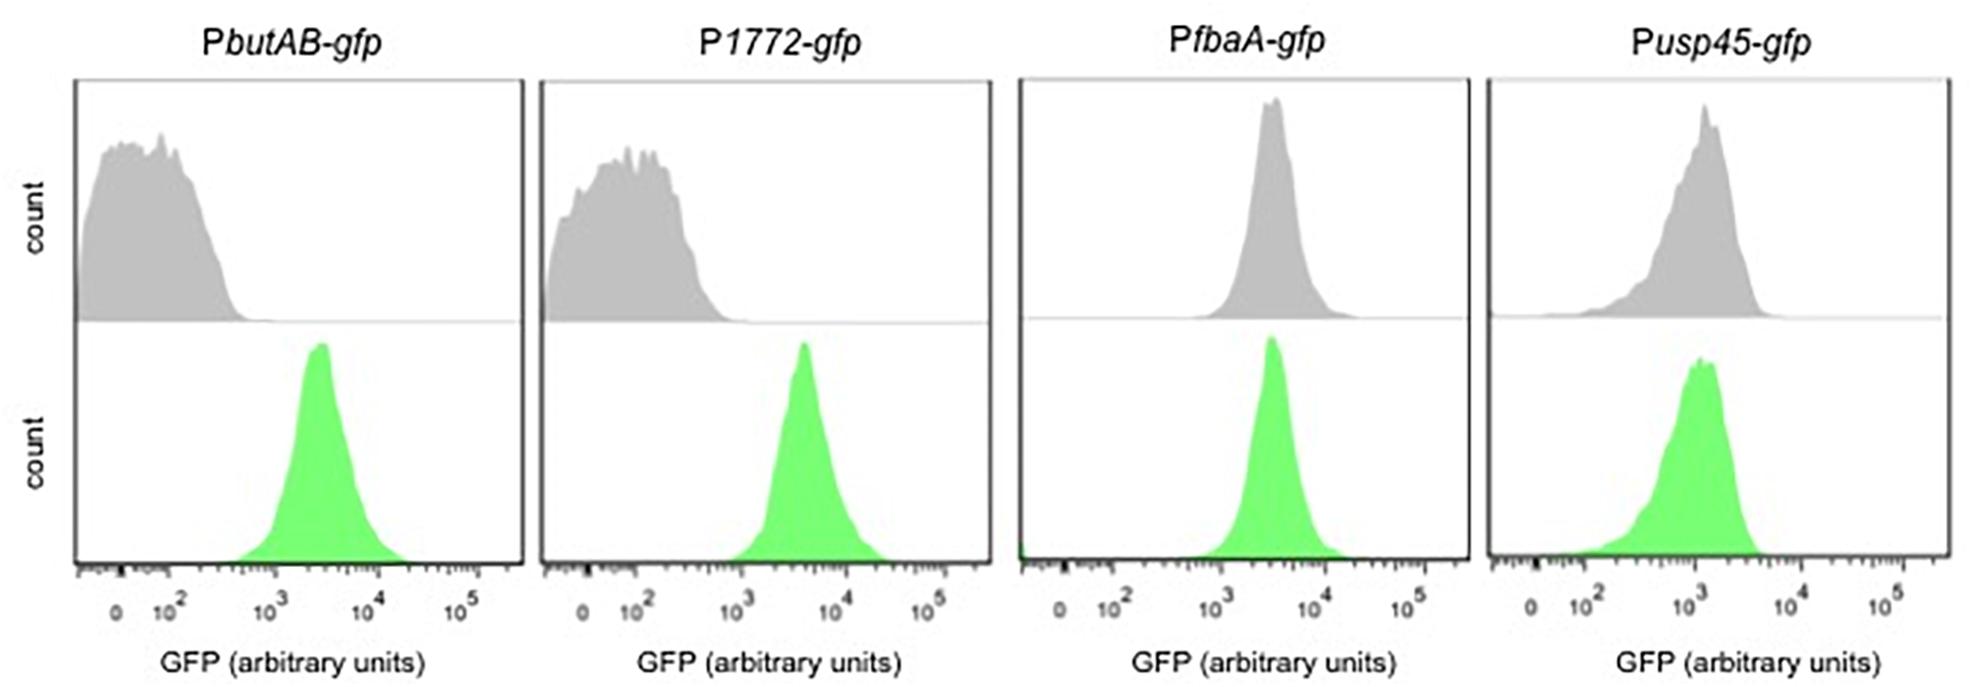
Figure 3. Acetaldehyde-inducible biosensors. Single-cell fluorescence measurements by flow cytometry, in the absence (gray) and presence of 0.5 M acetaldehyde (green). Fluorescence measurements were taken at the beginning of stationary growth phase. 10,000 ungated events for each sample are shown.
Specificity and Sensitivity of Diacetyl Biosensors
In view of the extreme volatility of acetaldehyde, the dose-dependent fluoresce readouts with this compound are likely to be inaccurate. Therefore, we further characterized only the diacetyl biosensors. Diacetyl is produced as a secondary metabolite during fermentation by some species of the LAB family (Figure 4). The condensation of two pyruvate molecules by the enzyme 2-acetolactate (2-AL) synthase produces 2-AL (Aymes et al., 1999). Then, two alternative paths for conversion of 2-AL to acetoin are possible. The first path is the non-enzymatic oxidative decarboxylation (ODC), which yields diacetyl. Subsequently, diacetyl can be converted to acetoin by a diacetyl-acetoin reductase (Dar) (Rattray et al., 2000). The second path is via the 2-AL decarboxylase (AldB), which yields acetoin. And last, ButA can reduce acetoin to 2,3-butanediol.
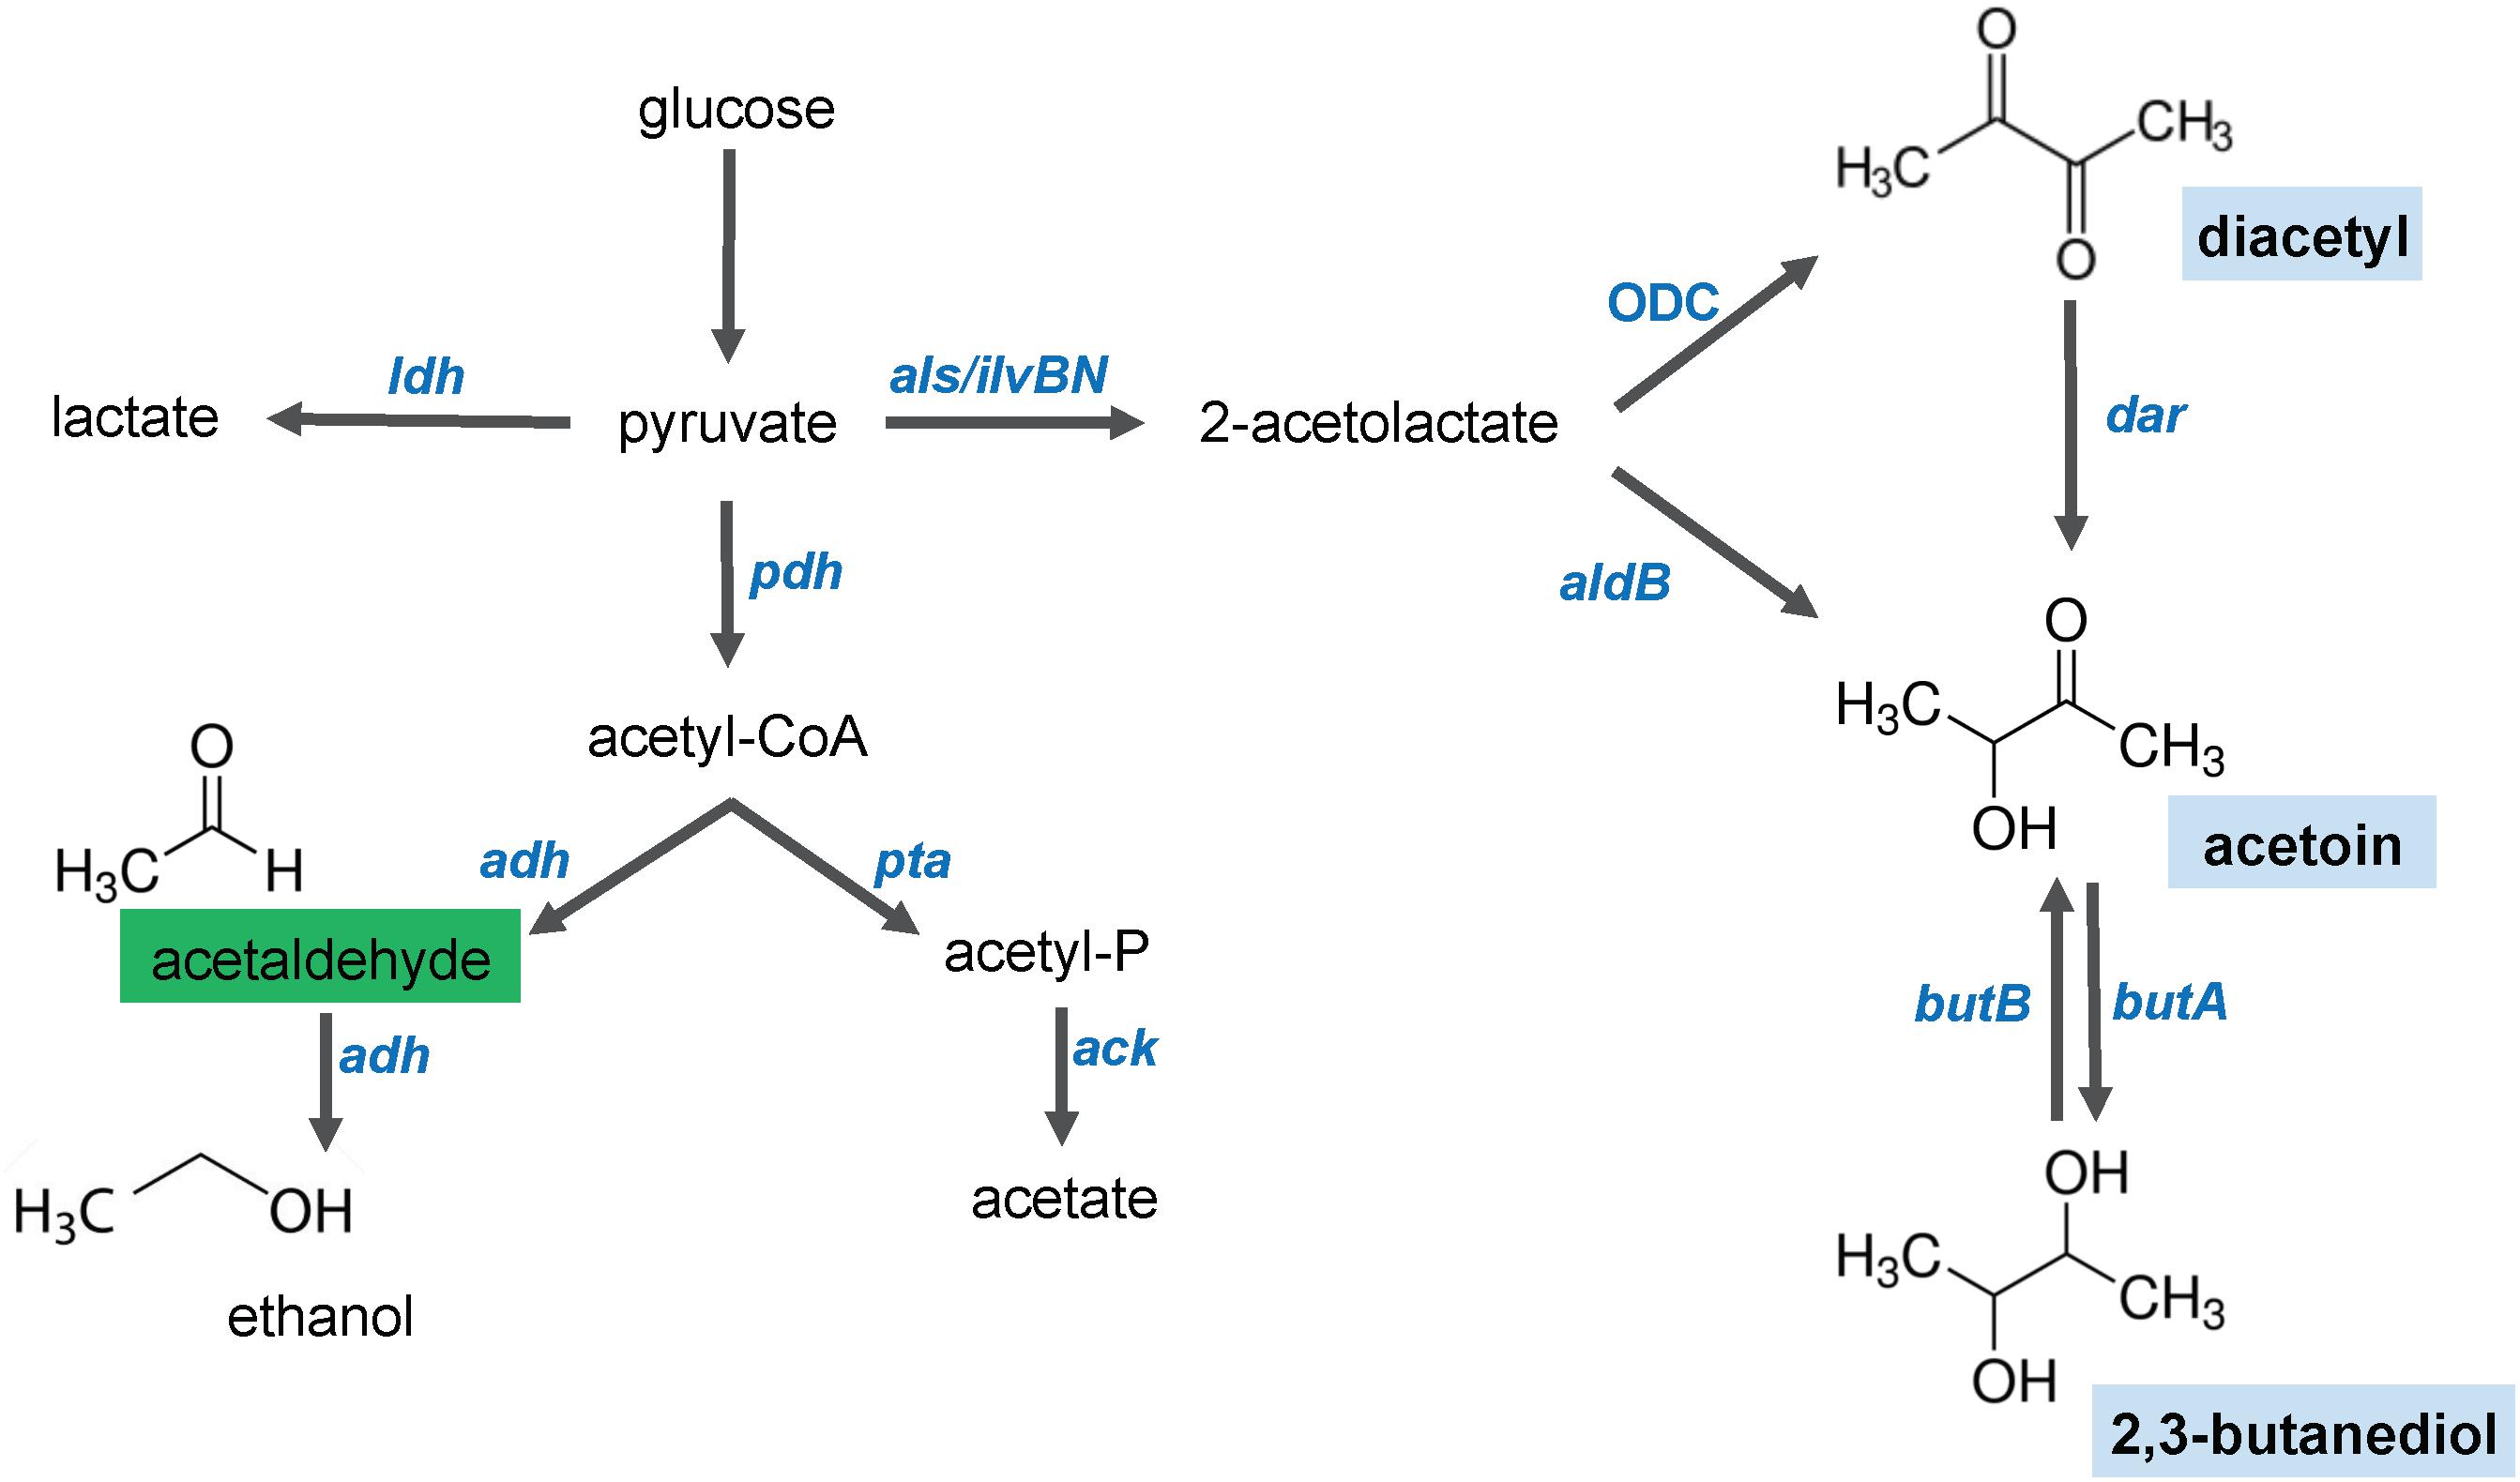
Figure 4. Schematic illustration of the glucose fermentation end products by Lactococcus lactis. After glucose is internalized in the cell, its breakdown results in pyruvate. The pyruvate molecules can be converted to several end products. Lactate is the main product of lactate dehydrogenase (ldh). Under aerobic conditions, pyruvate is decarboxylaxed by the pyruvate dehydrogenase (pdh) complex to produce acetyl-CoA. Acetaldehyde (indicated in a green box), ethanol and acetate are products of the activity of phosphotransacetylase (pta), aldehyde/alcohol dehydrogenases (adh) and acetate kinase (ack), respectively. Under aerobic and acidic conditions, a shift toward the 4-carbon compounds (indicated in blue boxes, diacetyl, acetoin and 2,3-butanediol) occurs. Diacetyl is produced by oxidative decarboxylation (ODC). Acetoin can be produced by activity of a 2-acetolactate dehydrogenase (aldB) or by diacetyl reduction by the diacetyl reductase (dar). 2,3-butanediol is produced by the acetoin dehydrogenase (butA), but this reaction is reversible and 2,3-butanediol can be converted into acetoin by the 2,3-butanediol dehydrogenase (butB).
To evaluate the specificity and sensitivity of the diacetyl biosensors, we selected the strains Pdar-gfp and Pusp45-gfp based on the clear separation obtained between the treated and untreated samples by flow cytometry analysis. The correlation between inducer concentration and fluorescence output is illustrated in the dose-response curves in Figures 5B,C. The diacetyl curves show that Pdar-gfp responds to diacetyl in the range of approximately 1.2 to 4.6 mM for a linear fluorescence output. The minimum concentration of diacetyl to activate this biosensor is approximately 1 mM. The dynamic range of Pusp45-gfp is shorter and thus, its dose-response curve shows its response to the compound in the range of approximately 1.2 to 3.5 mM for a linear fluorescence output. Since usp45 is a highly expressed gene, we speculate that higher induction levels result in a toxic concentration of GFP.
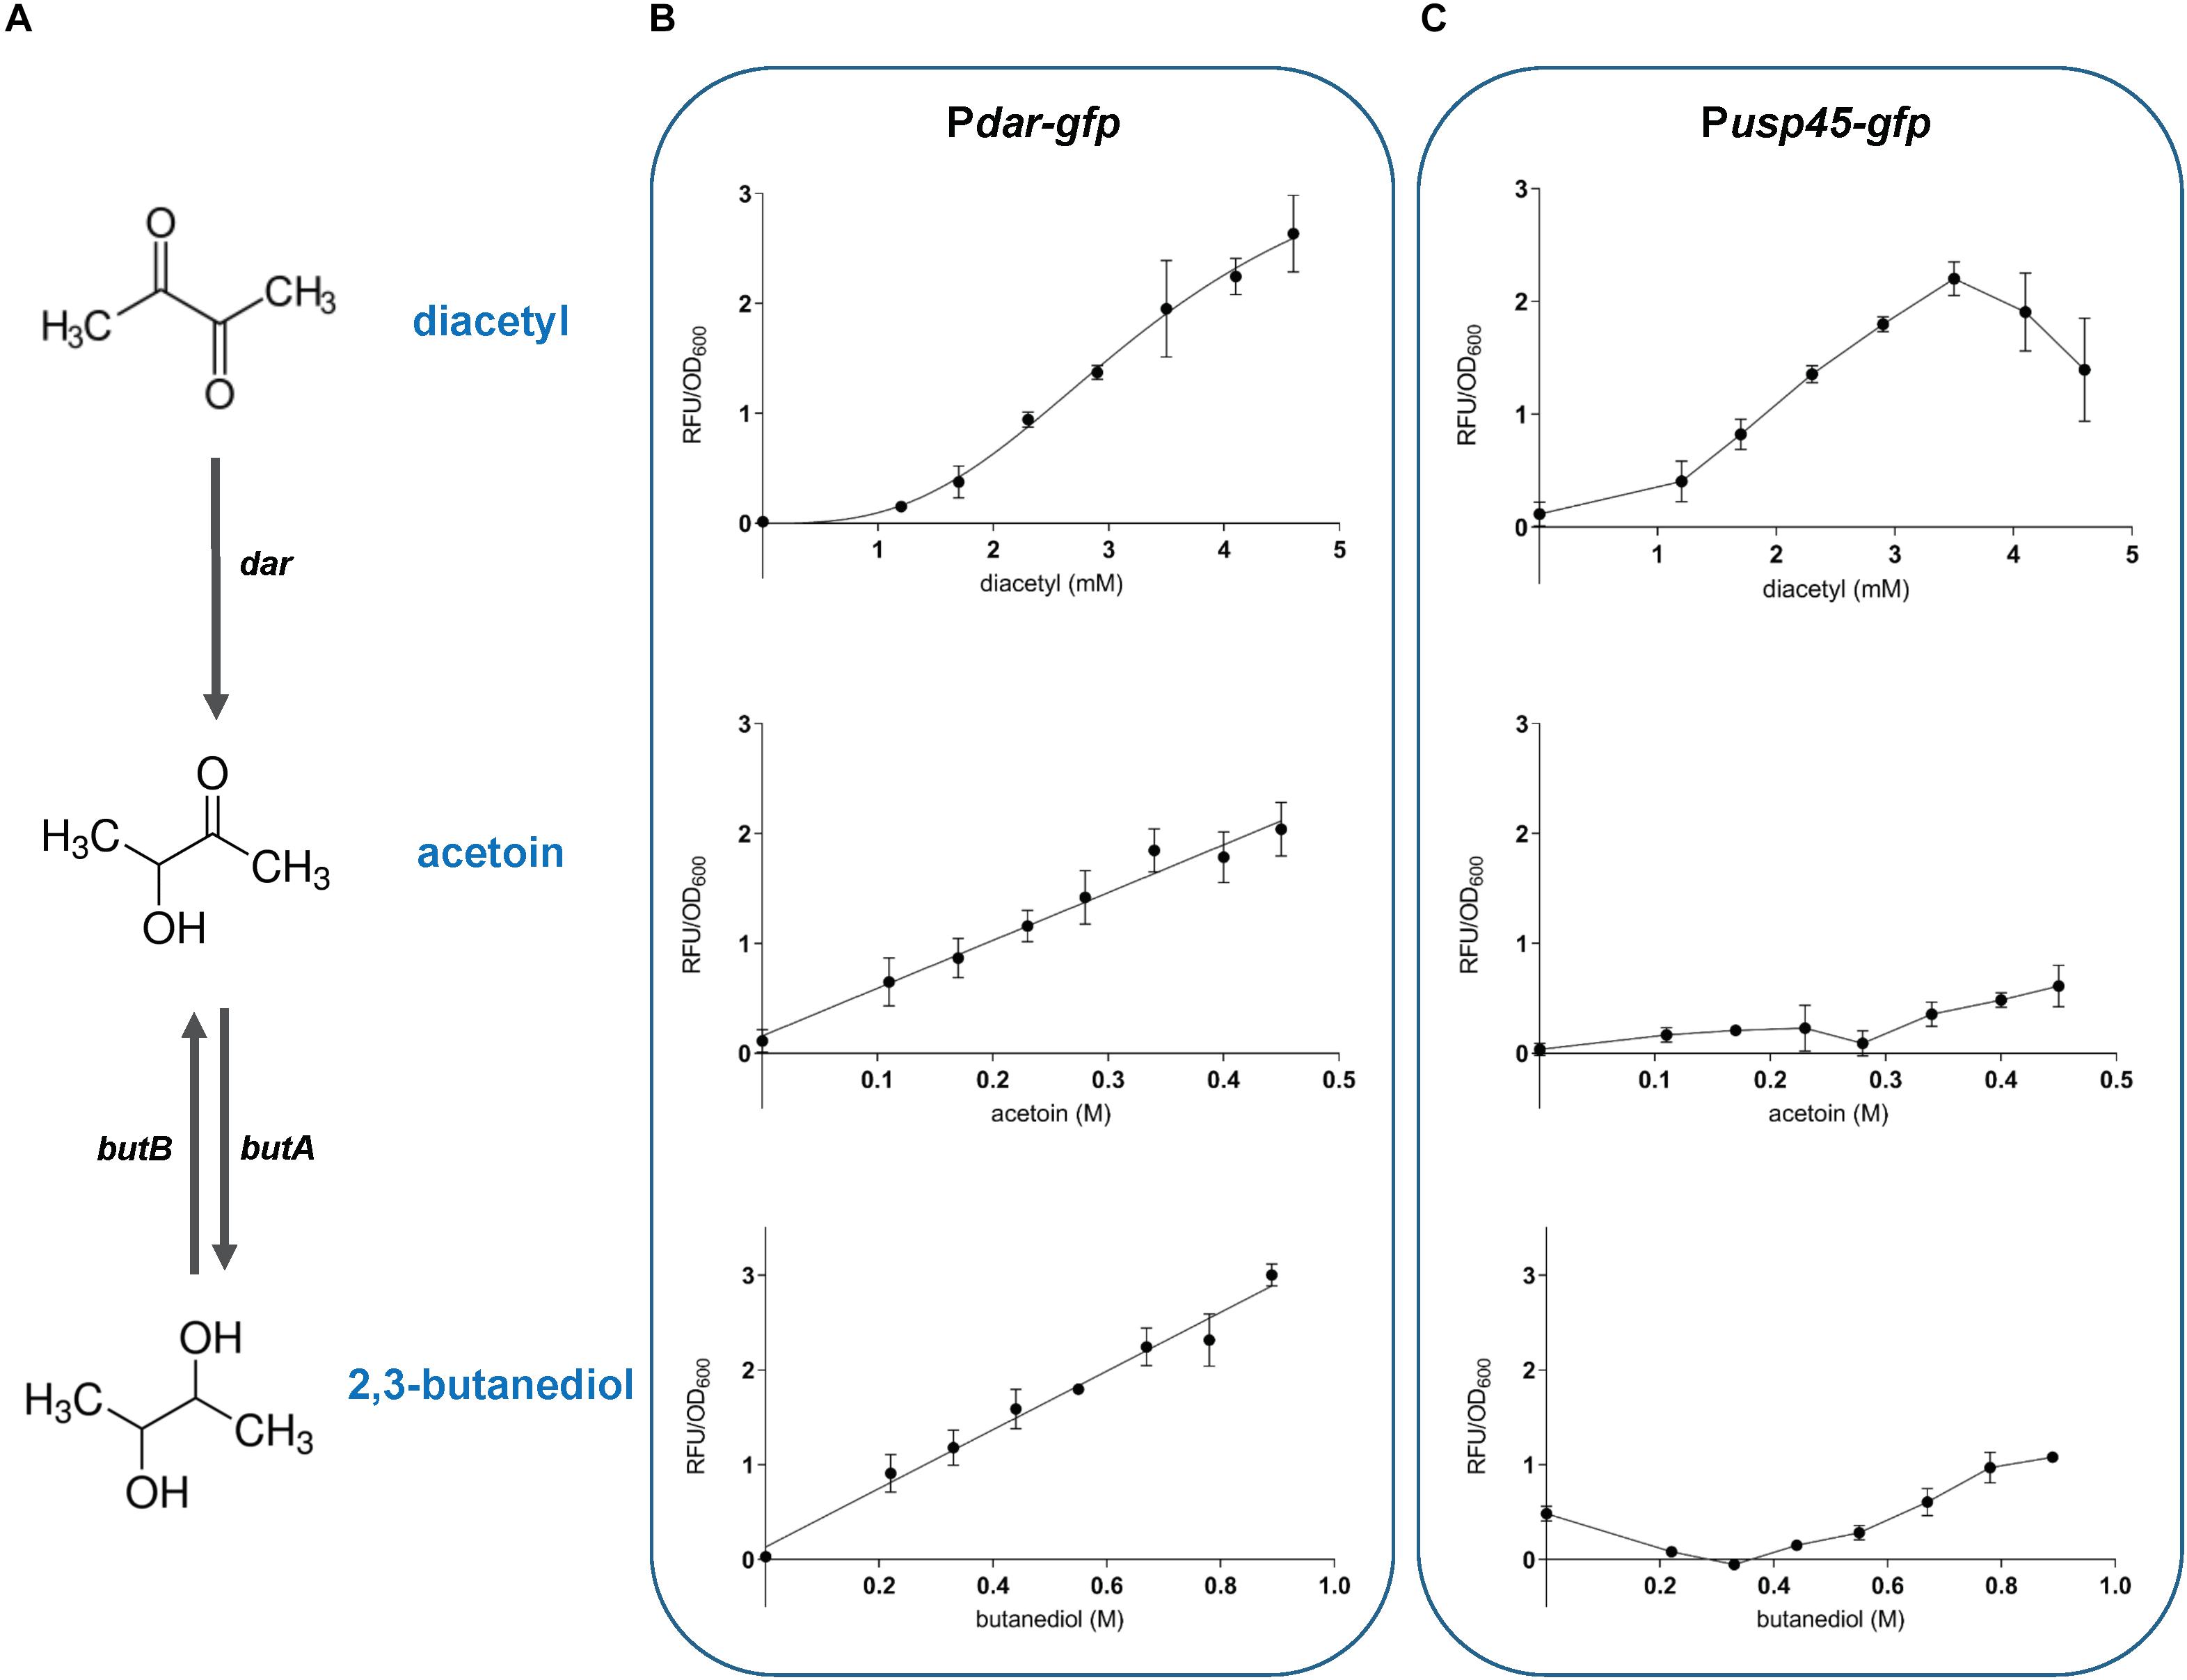
Figure 5. Inducer-dependent orthogonality of the diacetyl-inducible sensors. The response of L. lactis sensor strains Pdar-gfp and Pusp45-gfp to diacetyl, acetoin and 2,3-butanediol (A), diacetyl degradation pathway in L. lactis. The enzymes involved in diacetyl degradation include acetoin (diacetyl) reductase (dar), acetoin reductase (butA) and 2,3-butanediol dehydrogenase (butB) (B,C), Dose response curves of the sensor strains, illustrating the correlation between inducer concentration and fluorescence output. Population-level normalized GFP expression (RFU/OD600) of bacterial cultures, Pdar-gfp (B), and Pusp45-gfp (C) strains, in CDM with increasing concentration of diacetyl (1.2 to 4.6 mM; plots at the top), acetoin (0.1 to 0.45 M; plots in the middle), and 2,3 -butanediol (0.2 to 0.9 mM; plots at the bottom). The compounds were added at time zero. Dots represent the average values of independent experiments (n = 3). Error bars represent standard deviation (SD) of the mean values of the three independent experiments.
To evaluate the inducer-dependent orthogonality, we tested the response of our biosensors to acetoin and 2,3-butanediol. As mentioned above, these molecules are degradation products of diacetyl, and may activate the diacetyl-induced promoters. The dose-response curves of Pdar-gfp show cross-induction by acetoin and 2,3-butanediol, with a remarkably concentration-fluorescence linear response in the range of 0.1 to 0.45 M and 0.2 to 0.9 mM of acetoin and 2,3-butanediol, respectively. This is in contrast to Pusp45-gfp, which shows no cross-induction to these compounds. We observed that acetoin and 2,3-butanediol that cause the same inhibitory effect on L. lactis growth. To discard the possibility that the inhibitory effect on growth affects the GFP expression, the fluorescence readout was evaluated at the concentrations of diacetyl, acetoin and 2,3-butanediol that originate the same inhibitory effect (cultures reached the same final OD600; see Supplementary Figure 4). The same cross-induction differences between Pdar-gfp and Pusp45-gfp are observed when the strains are subjected to identical growth inhibition. These results are in agreement with our previous findings, and since the Dar enzyme is directly involved in the degradation pathway of diacetyl to produce acetoin and 2,3-butanediol (Figure 5A), the cross-reaction of the promoter controlling dar expression to these molecules can be explained.
Diacetyl Producer Strains
We aimed to benchmark the performance of our biosensors to diacetyl produced by wild-type LAB strains. Certain dairy strains, such as L. lactis subsp. lactis biovar diacetylactis and Leuconostoc sp., produce large amounts of 2-AL from citrate metabolism (Laëtitia et al., 2014). Previous studies have reported that LAB produce small quantities of diacetyl and have attempted to increase its production (Boumerdassi et al., 1997; Aymes et al., 1999). Several factors such as pH, temperature, citrate concentration and oxygen are known to affect the diacetyl production yields (Hugenholtz et al., 2000). A total of 10 L. lactis subsp. lactis biovar diacetylactis strains from different sources were collected (see Table 1). These strains were grown aerobically in M17 medium supplemented with citrate (see section “Materials and Methods”). Initially, we used the classic colorimetric Voges-Proskauer (VP) test to demonstrate acetoin synthesis (Xiao and Xu, 2007; Mcdevitt, 2009). This qualitative method shows that several strains (C17, CRL264, IPLA838, NCDO176+, RR2, and 1816) are able to produce acetoin, and potentially produce diacetyl (Supplementary Figure 5). These results are in agreement with previous studies of the metabolic pathways for flavor formation in these strains. For instance, a previous study of the CRL264 strain identified promoters involved in the biosynthetic pathway of the aroma compounds in this strain (García-Quintáns et al., 2008).
To obtain quantitative data of the production of diacetyl, we quantified the pyruvate metabolites 2-acetolactate, diacetyl and acetoin. To this end, we collected and filtered the supernatants of the bacterial cultures at different incubation times (9, 20, and 28 h). The concentrations of the compounds were calculated by the extrapolation method using standard curves (see section “Materials and Methods” and Supplementary Figure 6) (Westerfeld, 1945; Benson et al., 1996). Figure 6 shows that L. lactis subsp. lactis biovar diacetylactis strains C17, CRL264 and IPLA838 are able to produce high amounts of 2-acetolactate, which might be further converted into acetoin and diacetyl. In contrast to the VP test, by using the quantitative methods we observed that the strains RR2, 1826 and NCDO176 + secrete only small amounts of these compounds. The concentrations of diacetyl in the bacterial samples are below the detection limit (∼0.01 mM).
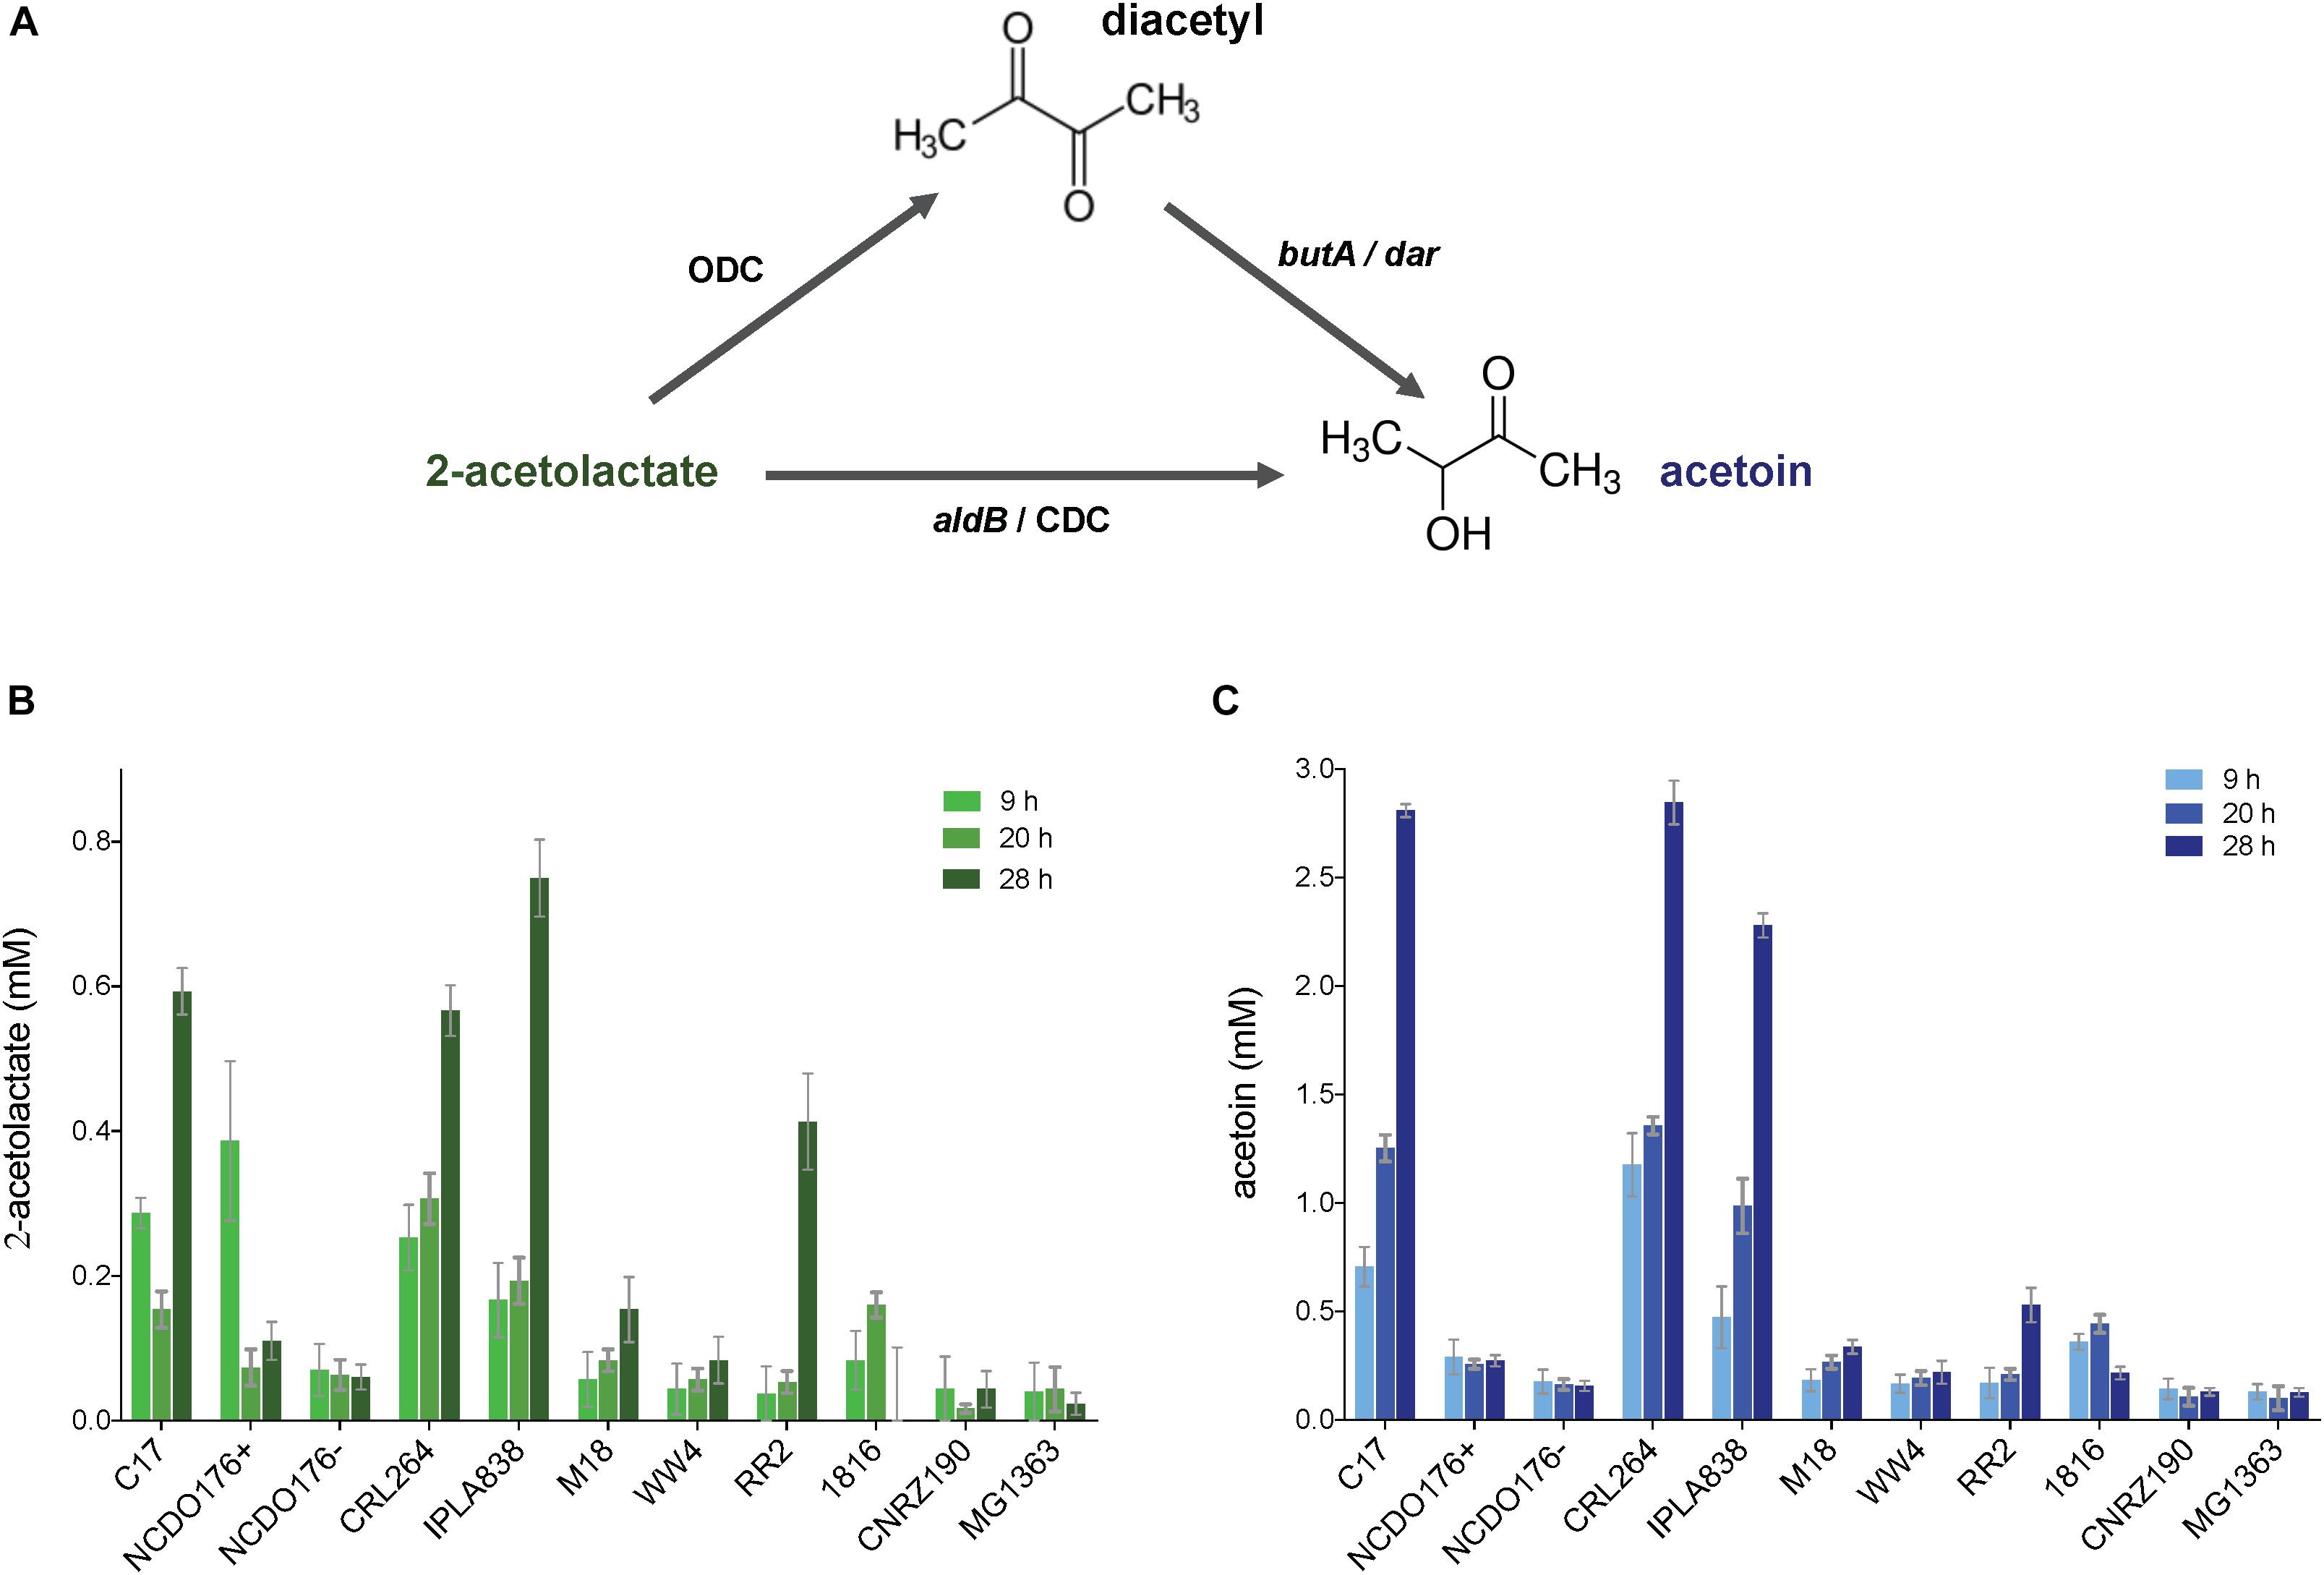
Figure 6. Quantification of pyruvate metabolites (2-acetolactate and acetoin) in L. lactis subsp. lactis biovar diacetylactis strains. (A) 2-acetolactate can be converted into diacetyl and acetoin; diacetyl can be reduced into acetoin. (B,C) concentration of 2-acetolactate (plot with bars in green) and acetoin (plot with bars in blue) in bacterial supernatants, respectively. Concentrations of the compounds were obtained at three different incubation times (light color to dark color; 9, 20, and 28 h). The L. lactis subsp. cremoris MG1363 was included in this analysis as a control strains. Data are presented as mean ± SD. Error bars represent standard deviation (SD) of the mean values of three independent experiments (see section “Materials and Methods”).
A previous work on diacetyl overproduction reported that L. lactis MR3-T7, a 2-acetolactate decarboxylase mutant with low activity of the lactate dehydrogenase enzyme (LDH), is able to produce up to 6 mM diacetyl (Monnet et al., 2000). Consequently, MR3-T7 was grown as described above, and the diacetyl content in the bacterial supernatant was quantified after 28 h incubation in skim milk and rich medium M17. Diacetyl was present in the M17 supernatant at a concentration of 0.42 mM, whereas the concentration in skim milk was lower than the detection limit. The instability of the LDH activity in this strain that that the authors reported was corroborated by single-colony isolation on LDAH-20-agar plates (see section “Materials and Methods”). A brown color in colonies grown on LDAH-20 indicates low lactate dehydrogenase activity (El Attar et al., 2000). However, this colony selection method has a low reliability and the instability of the LDH activity might explain the differences between the diacetyl concentrations reported for this strain and the diacetyl concentrations obtained in this study.
Correlation Between Diacetyl Concentration and Biosensor Output
The supernatants (M17 and skim milk) of the MR3-T7 strain were used to test the diacetyl-induction of the Pdar-gfp and Pusp45-gfp biosensors. The biosensors were grown in the presence of the bacterial supernatants (M17 and skim milk) and the GFP expression was measured by flow cytometry. Figure 7 shows a shift in the GFP expression levels of the supernatant (M17)-treated cultures of Pdar-gfp and Pusp45-gfp, compared to the PplpA-gfp strain. Although minor diacetyl inductions are observed, these increases in GFP expression are not observed when the biosensors are grown with the skim milk supernatants, which showed very low levels of diacetyl. Moreover, we tested the GFP expression of the biosensors by induction with a diacetyl solution as a control (0.42 mM), using the same experimental conditions. Remarkably minor shifts in the GFP expression are also observed in the Pdar-gfp and Pusp45-gfp, compared to the PplpA-gfp strain. Altogether, these results suggest that the small amounts of diacetyl (0.42 mM) in the M17 bacterial supernatant are responsible for the increase in GFP expression levels by the diacetyl-biosensors Pdar-gfp and Pusp45-gfp.
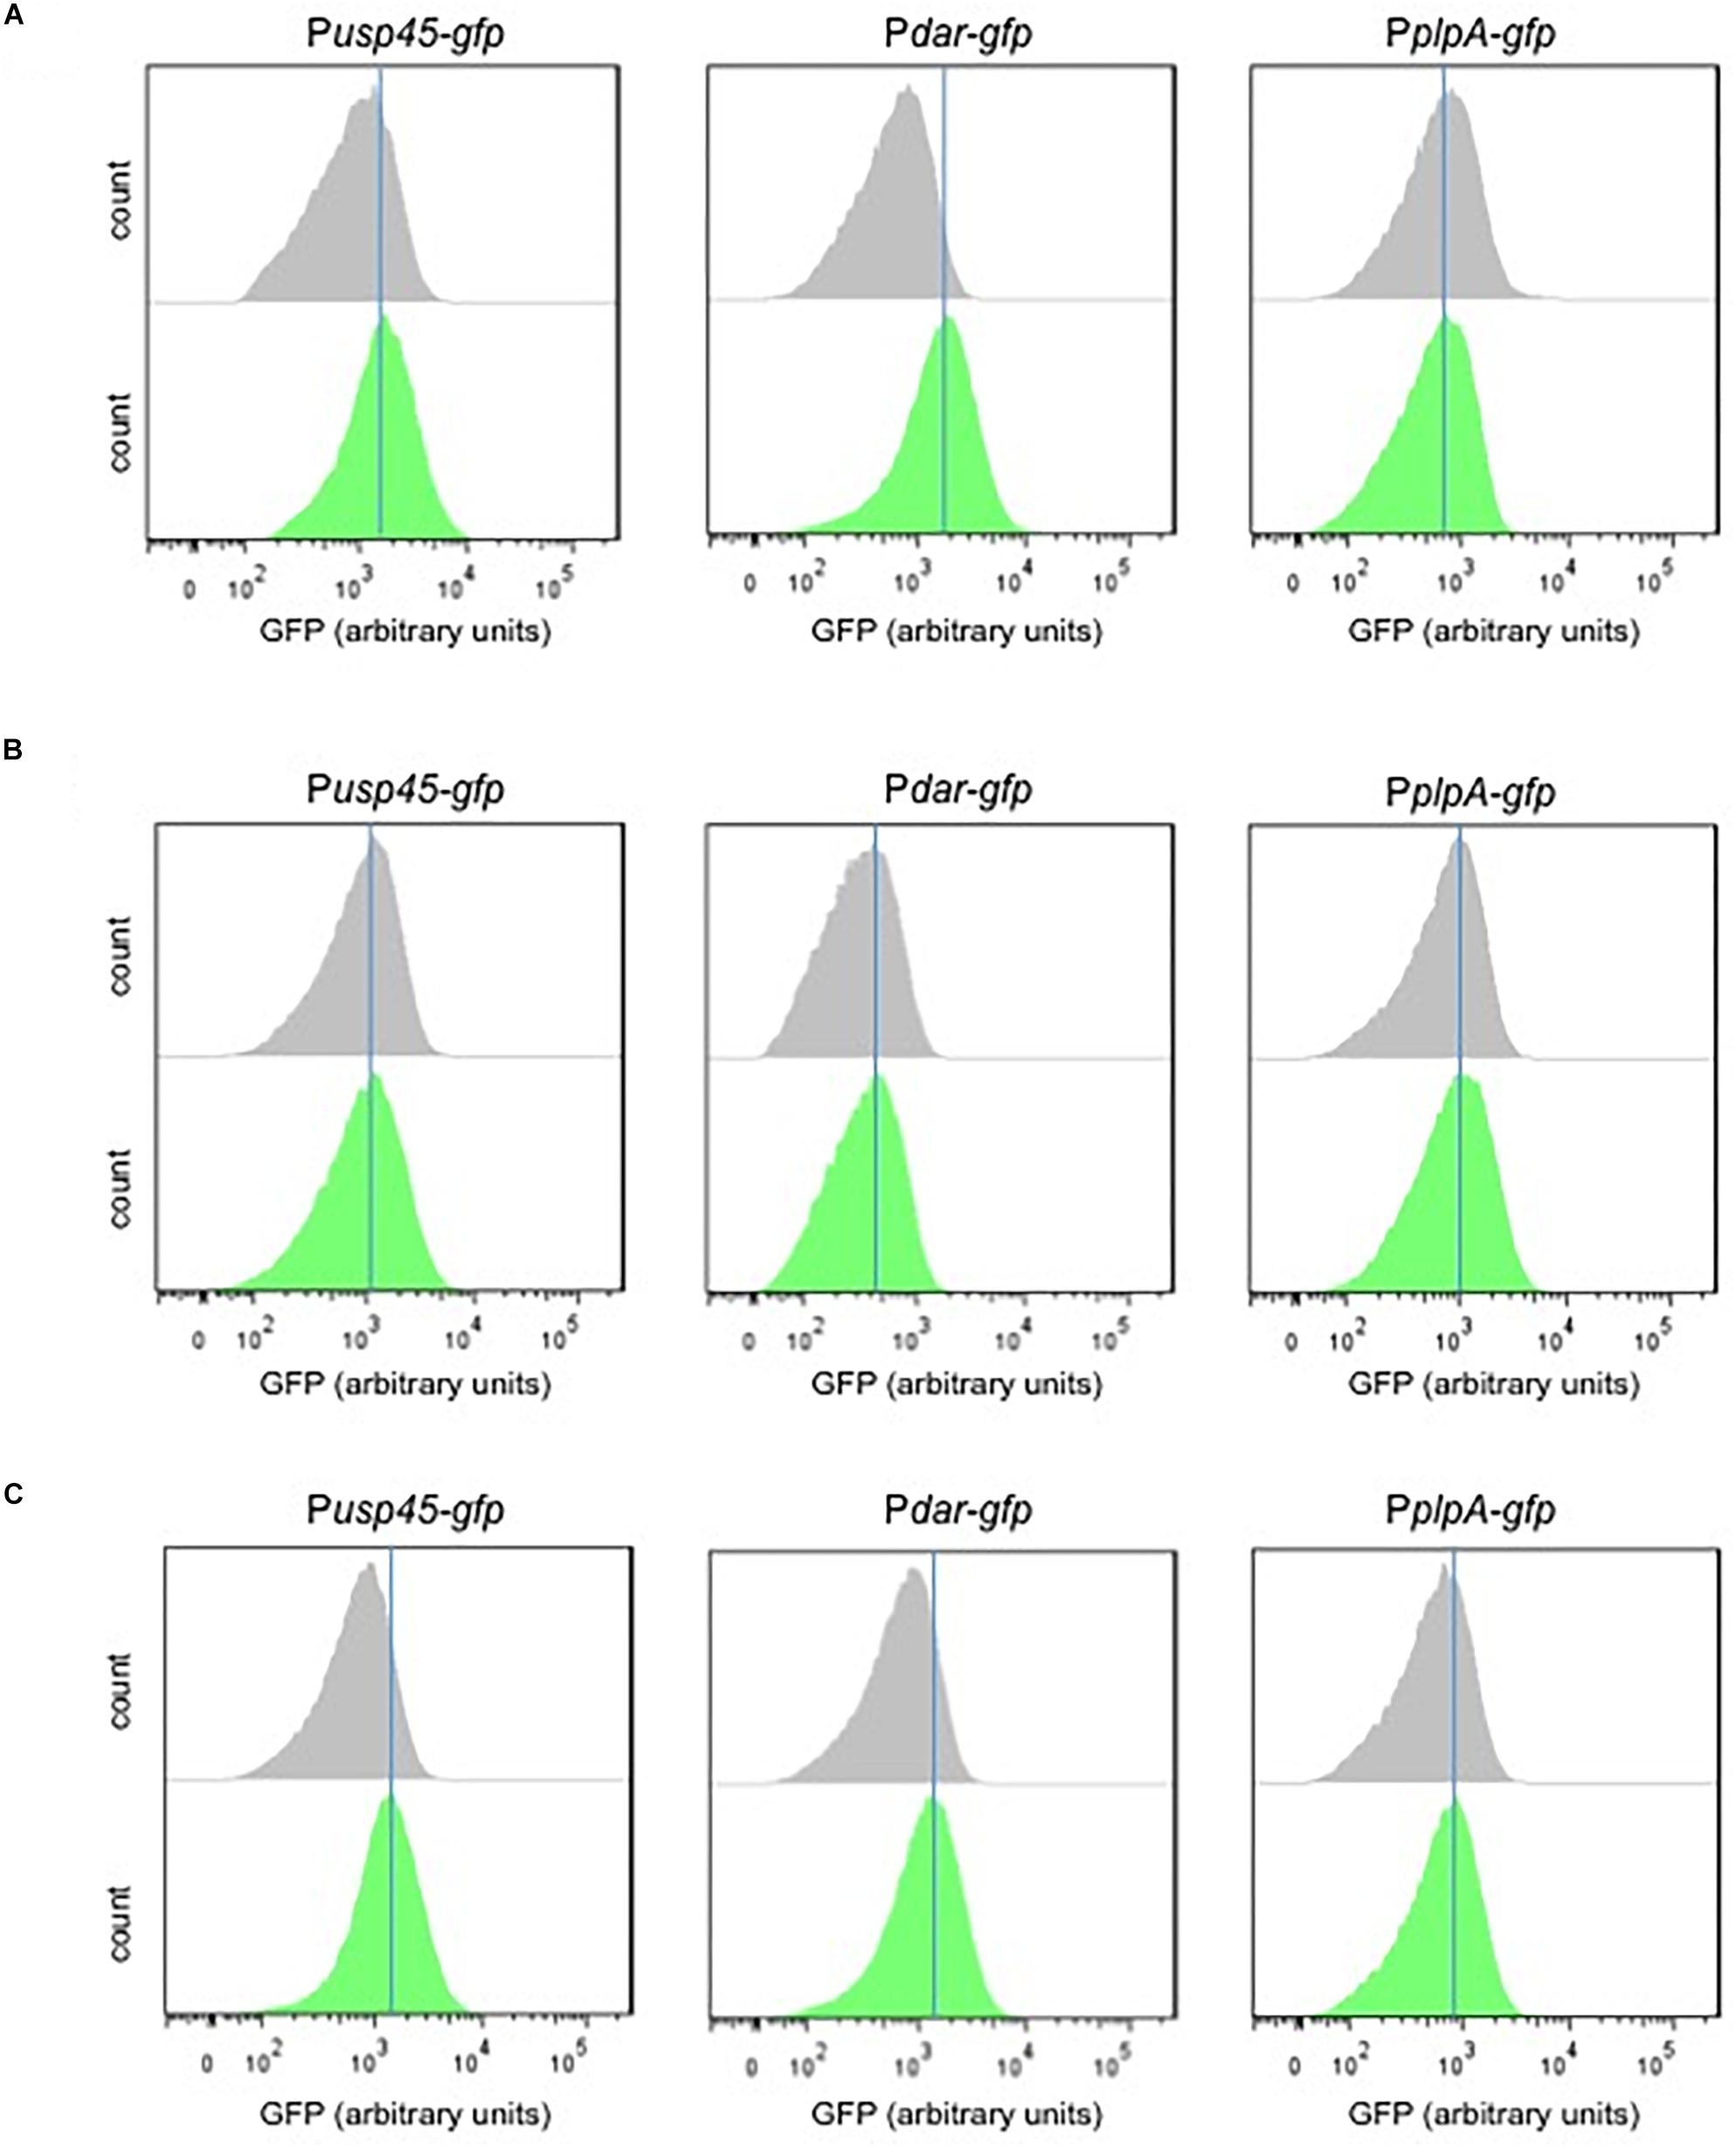
Figure 7. Response of the diacetyl-biosensors to diacetyl-producer supernantants. (A,B) Single-cell fluorescence measurements by flow cytometry, in the absence (gray) and presence (green) of supernatant L. lactis subsp. lactis biovar diacetylactis MR3-T7 grown in M17 or skim milk, respectively. (C) Single-cell fluorescence measurements by flow cytometry, in the absence (gray) and presence of diacetyl solution 0.42 mM (green). Note that diacetyl at a concentration 0.42 is used because the M17 supernatant contains diacetyl at the same concentration. Fluorescence measurements were taken at the beginning of stationary growth phase. 10,000 ungated events for each sample are shown.
Discussion
Besides production of lactic acid, LAB produce organic acids, acetaldehyde diacetyl, acetoin, hydrogen peroxide, and bacteriocins (Todorov, 2009). Under certain growth conditions LAB convert pyruvate to several flavor compounds such as acetaldehyde and diacetyl. These flavor compounds are relevant in food industry and its quantification in complex food matrices is a difficult task. On one hand, the classic Voges-Proskauer test is a qualitative method to indicate the presence of acetoin and the potential production of diacetyl in bacterial supernatants. Diacetyl can be converted into acetoin by activity of a diacetyl reductase (Dar). Moreover, a limitation of the VP test is that several factors (experimental conditions such as the incubation time) can affect the results interpretation. On the other hand, the existing quantitative methods require tedious sample preparation protocols and their combination with analytical methods (for instance high-performance liquid chromatography). In this respect, biosensors are molecular tools that can be applied to detect and quantify the presence of metabolites in complex (food) matrices.
Diacetyl is produced as a secondary metabolite during fermentation by some species of the LAB family. While the production of this compound is thought to be a strategy to store energy after carbohydrate depletion (Thomas et al., 1979) or under aerobic conditions (Thomas et al., 1979), diacetyl has previously been shown to be toxic to bacteria. Although its antimicrobial activity may confer competitive advantages over other bacteria to colonize certain habitats (Hugenholtz et al., 2000), this property may explain why only low levels of diacetyl are produced by the cells. Some dairy strains with high diacetyl production have been reported, for instance strains that lack the enzyme ALDC (Kleerebezemab et al., 2000) or strains that have been engineered to combine NADH oxidase (NOX) overexpression and ALDC inactivation (Hugenholtz and Starrenburg, 1992; Curic et al., 1999). Furthermore, other strains have been produced by random selection of L. lactis subsp. lactis biovar diacetylactis mutants, which showed overproduction of 2-AL and diacetyl (3 mM) due to ALDC deficiency and low lactate dehydrogenase activity (Monnet et al., 2000). To date, the highest titer of diacetyl (95 mM) has been obtained by a combination of engineering strategies and biocompatible chemistry L. lactis using bioreactors (Liu et al., 2016).
In this work, we have developed and applied transcriptional biosensors to facilitate the detection of diacetyl and acetaldehyde. The construction of the biosensors is based on the identification of up-regulated transcriptional units by a transcriptome analysis of L. lactis exposed to the compounds of interest. Two biosensors consisting in transcriptional fusions (Pr-gfp) were obtained and tested for their response to diacetyl (Pdar-gfp and Pusp45-gfp) and acetaldehyde (PbutAB-gfp and P1772-gfp). Due to the high volatility of acetaldehyde, we further characterized the diacetyl biosensors for their kinetics (required time to respond to a change in the concentration of the compound), dynamics (range of compound concentration that results in a linear fluorescence readouts) and orthogonality (specificity to the compounds of interest). We evaluated the production of acetoin and diacetyl by L. lactis subsp. lactis biovar diacetylactis strains. However, only low levels of diacetyl were obtained in standing L. lactis cultures under the growth conditions tested in our study. Nonetheless, we benchmarked the performance of the biosensors to respond to a L. lactis supernatant with a diacetyl concentration of 0.42 mM. Our results suggest that the biosensors can be applied to quickly detect semi-quantitatively the presence of diacetyl.
The presence of diacetyl is commonly associated with dairy products because it is an important aroma compound found in cheeses, butter, and yogurt. Nonetheless, it is present at variable concentrations in dairy products. For instance, the amounts of diacetyl reported for yogurt range from 200 to 3000 μg/g (2.1–31.4 mM) (Shibamoto, 2014). Likewise, diacetyl is present in starter distillates (SD) at a concentration range from 1.2 to 22,000 μg/g (0.00001–0.22 M). In this study we report that the L. lactis Pdar-gfp strain responds to diacetyl in the range of approximately 1.2 to 4.6 mM. Therefore, a limitation of our biosensors is that they are suitable for foods containing diacetyl at concentrations within the biosensor response range. Recent studies in biosensors engineering demonstrate that biosensors based on transcription factors can be improved in their sensing properties (e.g., sensitivity, specificity, dynamic range) (Mahr and Frunzke, 2016). Further work is required to optimize the functionality of our biosensors for aroma compounds according to a wider concentration range in the target sample.
With regard to diacetyl production using microorganisms, we propose to produce diacetyl by fermentations in bioreactors in order to obtain higher diacetyl yields. Our biosensors are tools with potential application in both development and optimization of LAB strains capable of producing the flavor molecules diacetyl and acetaldehyde.
Data Availability Statement
All datasets presented in this study are included in the article/Supplementary Material.
Author Contributions
JH-V and OK conceived the study and wrote the manuscript. JH-V and AS designed the experiments. JH-V carried out the experiments and analyzed the data. AS and OK provided supervision. All authors discussed the results and commented on the manuscript.
Funding
JH-V and OK were financed by the Netherlands Organization for Scientific Research (NWO), research program TTW (13858).
Conflict of Interest
The authors declare that the research was conducted in the absence of any commercial or financial relationships that could be construed as a potential conflict of interest.
Acknowledgments
We thank Prof. Cristophe Monnet (INRA), Prof. Beatriz Martinez (CSIC-IPLA), and Prof. Juke Lolkema (University of Groningen) for providing the L. lactis subsp. lactis biovar diacetylactis strains MR3-T7 (CM), NCDO176 + (BM), IPLA838 (BM), CRL264 (JL), NCDO176- (BM), and C17 (JL). We thank Peter Huizenga for his help with the transcriptome analysis.
Supplementary Material
The Supplementary Material for this article can be found online at: https://www.frontiersin.org/articles/10.3389/fmicb.2020.01032/full#supplementary-material
Footnotes
References
Attaie, R. (2009). Quantification of volatile compounds in goat milk Jack cheese using static headspace gas chromatography. J. Dairy Sci. 92, 2435–2443. doi: 10.3168/jds.2008-1732
Aymes, F., Monnet, C., and Corrieu, G. (1999). Effect of α-acetolactate decarboxylase inactivation on α-acetolactate and diacetyl production by Lactococcus lactis subsp. lactis biovar diacetylactis. J. Biosci. Bioeng. 87, 87–92. doi: 10.1016/S1389-1723(99)80013-9
Bandell, M., Lhotte, M. E., Marty-Teysset, C., Veyrat, A., Prévost, H., Dartois, V., et al. (1998). Mechanism of the citrate transporters in carbohydrate and citrate cometabolism in Lactococcus and Leuconostoc species. Appl. Environ. Microbiol. 64, 1594–1600. doi: 10.1128/aem.64.5.1594-1600.1998
Benson, K. H., Godon, J. J., Renault, P., Griffin, H. G., and Gasson, M. J. (1996). Effect of ilvBN-encoded α-acetolactate synthase expression on diacetyl production in Lactococcus lactis. Appl. Microbiol. Biotechnol. 45:107. doi: 10.1007/s002530050656
Bertels, F., Merker, H., and Kost, C. (2012). Design and characterization of auxotrophy-based amino acid biosensors. PLoS One 7:e41349. doi: 10.1371/journal.pone.0041349
Bintsis, T. (2018). Lactic acid bacteria as starter cultures: an update in their metabolism and genetics. AIMS Microbiol. 4, 665–684. doi: 10.3934/microbiol.2018.4.665
Bongers, R. S., Hoefnagel, M. H. N., and Kleerebezem, M. (2005). High-level acetaldehyde production in Lactococcus lactis by metabolic engineering. Appl. Environ. Microbiol. 71, 1109–1113. doi: 10.1128/AEM.71.2.1109-1113.2005
Boumerdassi, H., Monnet, C., Desmazeaud, M., and Corrieu, G. (1997). Isolation and properties of Lactococcus lactis subsp. lactis biovar diacetylactis CNRZ 483 mutants producing diacetyl and acetoin from glucose. Appl. Environ. Microbiol. 63, 2293–2299. doi: 10.1128/aem.63.6.2293-2299.1997
Brutesco, C., Prévéral, S., Escoffier, C., Descamps, E. C. T., Prudent, E., Cayron, J., et al. (2017). Bacterial host and reporter gene optimization for genetically encoded whole cell biosensors. Environ. Sci. Pollut. Res. 24, 52–65. doi: 10.1007/s11356-016-6952-2
Chaves, A. C. S. D., Fernandez, M., Lerayer, A. L. S., Mierau, I., Kleerebezem, M., and Hugenholtz, J. (2002). Metabolic engineering of acetaldehyde production by Streptococcus thermophilus. Appl. Environ. Microbiol. 68, 5656–5662. doi: 10.1128/AEM.68.11.5656-5662.2002
Clark, S., and Winter, C. K. (2015). Diacetyl in foods: a review of safety and sensory characteristics. Compr. Rev. Food Sci. Food Saf. 14, 634–643. doi: 10.1111/1541-4337.12150
Close, D. M., Ripp, S., and Sayler, G. S. (2009). Reporter proteins in whole-cell optical bioreporter detection systems, biosensor integrations, and biosensing applications. Sensors 9, 9147–9174. doi: 10.3390/s91109147
Curic, M., Stuer-Lauridsen, B., Renault, P., and Nilsson, D. (1999). A general method for selection of alpha-acetolactate decarboxylase-deficient Lactococcus lactis mutants to improve diacetyl formation. Appl. Environ. Microbiol. 65, 1202–1206. doi: 10.1128/aem.65.3.1202-1206.1999
Daglia, M., Papetti, A., Aceti, C., Sordelli, B., Spini, V., and Gazzani, G. (2007). Isolation and determination of α-dicarbonyl compounds by RP-HPLC-DAD in green and roasted coffee. J. Agric. Food Chem. 55, 8877–8882. doi: 10.1021/jf071917l
de Jong, A., Pietersma, H., Cordes, M., Kuipers, O. P., and Kok, J. (2012). PePPER: a webserver for prediction of prokaryote promoter elements and regulons. BMC Genomics 13:299. doi: 10.1186/1471-2164-13-299
De Revel, G., Pripis-Nicolau, L., Barbe, J. C., and Bertrand, A. (2000). The detection of α-dicarbonyl compounds in wine by formation of quinoxaline derivatives. J. Sci. Food Agricult. 80, 102–108. doi: 10.1002/(SICI)1097-0010(20000101)80:1<102::AID-JSFA493<3.0.CO;2-Y
El Attar, A., Monnet, C., Aymes, F., and Corrieu, G. (2000). Method for the selection of Lactococcus lactis mutants producing excess carbon dioxide. J. Dairy Res. 67, 641–646. doi: 10.1017/S0022029900004490
Elliker, P. R. (1945). Effect of various bacteria on diacetyl content and flavor of butter. J. Dairy Sci. 28, 93–102. doi: 10.3168/jds.S0022-0302(45)95149-6
Fernandez-López, R., Ruiz, R., de la Cruz, F., and Moncalián, G. (2015). Transcription factor-based biosensors enlightened by the analyte. Front. Microbiol. 6:648. doi: 10.3389/fmicb.2015.00648
García-Quintáns, N., Repizo, G., Martín, M., Magni, C., and López, P. (2008). Activation of the diacetyl/acetoin pathway in Lactococcus lactis subsp. lactis bv. diacetylactis CRL264 by acidic growth. Appl. Environ. Microbiol. 74, 1988–1996. doi: 10.1128/AEM.01851-07
Gasson, M. J. (1983). Plasmid complements of Streptococcus lactis NCDO 712 and other lactic streptococci after protoplast-induced curing. J. Bacteriol. 154, 1–9. doi: 10.1128/jb.154.1.1-9.1983
Goel, A., Santos, F., de Vos, W. M., Teusink, B., and Molenaar, D. (2012). Standardized assay medium to measure Lactococcus lactis enzyme activities while mimicking intracellular conditions. Appl. Environ. Microbiol. 78, 134–143. doi: 10.1128/aem.05276-11
Gonzales, D. T., Ozdemir, T., Thomas, G. M., and Barnes, C. P. (2016). An acetoacetate-inducible bacterial sensor. bioRxiv [Preprint]
Hugenholtz, J., Kleerebezem, M., Starrenburg, M., Delcour, J., De Vos, W., and Hols, P. (2000). Lactococcus lactis as a cell factory for high-level diacetyl production. Appl. Environ. Microbiol. 66, 4112–4114. doi: 10.1128/AEM.66.9.4112-4114.2000
Hugenholtz, J., and Starrenburg, M. J. C. (1992). Diacetyl production by different strains of Lactococcus lactis subsp. lactis var. diacetylactis and Leuconostoc spp. Appl. Microbiol. Biotechnol. 38, 17–22.
Jay, J. M. (1982). Antimicrobial properties of diacetyl. Appl. Environ. Microbiol. 44, 525–532. doi: 10.1128/aem.44.3.525-532.1982
Jeong, H. S., Chung, H., Song, S. H., Kim, C. II, Lee, J. G., and Kim, Y. S. (2015). Validation and determination of the contents of acetaldehyde and formaldehyde in foods. Toxicol. Res. 31, 273–278. doi: 10.5487/TR.2015.31.3.273
Junier, I., and Rivoire, O. (2016). Conserved units of co-expression in bacterial genomes: an evolutionary insight into transcriptional regulation. PLoS One 11:e0155740. doi: 10.1371/journal.pone.0155740
Kleerebezemab, M., Hols, P., and Hugenholtz, J. (2000). Lactic acid bacteria as a cell factory: rerouting of carbon metabolism in Lactococcus lactis by metabolic engineering. Enzyme Microb. Technol. 26, 840–848. doi: 10.1016/S0141-0229(00)00180-0
Kuhl, S. A., Larsen, L. D., and McKay, L. L. (1979). Plasmid profiles of lactose-negative and proteinase-deficient mutants of Streptococcus lactis C10. ML3, and M18. Appl. Environ. Microbiol. 37, 1193–1195. doi: 10.1128/aem.37.6.1193-1195.1979
Laëtitia, G., Pascal, D., and Yann, D. (2014). The citrate metabolism in Homo- and Heterofermentative LAB: a selective means of becoming dominant over other microorganisms in complex ecosystems. Food Nutr. Sci. 5, 953–969. doi: 10.4236/fns.2014.510106
Li, R., Takala, T. M., Qiao, M., Xu, H., and Saris, P. E. J. (2011). Nisin-selectable food-grade secretion vector for Lactococcus lactis. Biotechnol. Lett. 33, 797–803. doi: 10.1007/s10529-010-0503-6
Lim, J. W., Ha, D., Lee, J., Lee, S. K., and Kim, T. (2015). Review of Micro/Nanotechnologies for microbial biosensors. Front. Bioeng. Biotechnol. 3:61. doi: 10.3389/fbioe.2015.00061
Liu, J., Chan, S. H. J., Brock-Nannestad, T., Chen, J., Lee, S. Y., Solem, C., et al. (2016). Combining metabolic engineering and biocompatible chemistry for high-yield production of homo-diacetyl and homo-(S,S)-2,3-butanediol. Metab. Eng. 36, 57–67. doi: 10.1016/j.ymben.2016.02.008
Mahr, R., and Frunzke, J. (2016). Transcription factor-based biosensors in biotechnology: current state and future prospects. Appl. Microbiol. Biotechnol. 100, 79–90. doi: 10.1007/s00253-015-7090-3
Mcdevitt, S. (2009). Methyl Red and Voges-Proskauer Test Protocols. ASM Microbe Library. Available online at: https://www.asmscience.org/content/education/protocol/protocol.3204 (accessed March 22, 2020).
Monnet, C., Aymes, F., and Corrieu, G. (2000). Diacetyl and α-acetolactate overproduction by Lactococcus lactis subsp. lactis biovar diacetylactis mutants that are deficient in α-acetolactate decarboxylase and have a low lactate dehydrogenase activity. Appl. Environ. Microbiol. 66, 5518–5520. doi: 10.1128/AEM.66.12.5518-5520.2000
Mutch, D. M., Berger, A., Mansourian, R., Rytz, A., and Roberts, M. A. (2001). Microarray data analysis: a practical approach for selecting differentially expressed genes. Genome Biol. [Preprint]
Neves, A. R., Pool, W. A., Kok, J., Kuipers, O. P., and Santos, H. (2005). Overview on sugar metabolism and its control in Lactococcus lactis - The input from in vivo NMR. FEMS Microbiol. Rev. 29, 532–554. doi: 10.1016/j.femsre.2005.04.005
Obis, D., Guillot, A., and Mistou, M. Y. (2001). Tolerance to high osmolality of Lactococcus lactis subsp. lactis and cremoris is related to the activity of a betaine transport system. FEMS Microbiol. Lett. 202, 39–44. doi: 10.1016/S0378-1097(01)00293-2
Osborne, J. P., Mira De Orduña, R., Pilone, G. J., and Liu, S. Q. (2000). Acetaldehyde metabolism by wine lactic acid bacteria. FEMS Microbiol. Lett. 91, 51–55. doi: 10.1016/S0378-1097(00)00369-4
Overkamp, W., Beilharz, K., Weme, R. D. O., Solopova, A., Karsens, H., Kovács, A. T., et al. (2013). Benchmarking various green fluorescent protein variants in Bacillus subtilis, Streptococcus pneumoniae, and Lactococcus lactis for live cell imaging. Appl. Environ. Microbiol. 79, 6481–6490. doi: 10.1128/AEM.02033-13
Pinto, J. P. C., Zeyniyev, A., Karsens, H., Trip, H., Lolkema, J. S., Kuipers, O. P., et al. (2011). pSEUDO, a genetic integration standard for Lactococcus lactis. Appl. Environ. Microbiol. 77, 6687–6690. doi: 10.1128/AEM.05196-11
Rattray, F. P., Walfridsson, M., and Nilsson, D. (2000). Purification and characterization of a diacetyl reductase from Leuconostoc pseudomesenteroides. Int. Dairy J. 10, 781–789. doi: 10.1016/S0958-6946(00)00103-5
Rincon-Delgadillo, M. I., Lopez-Hernandez, A., Wijaya, I., and Rankin, S. A. (2012). Diacetyl levels and volatile profiles of commercial starter distillates and selected dairy foods. J. Dairy Sci. 95, 1128–1139. doi: 10.3168/jds.2011-4834
Sambrook, J., Fritsch, E. F., and Maniatis, T. (1989). Molecular Cloning: A Laboratory Manual, 2nd ed., Vols. 1, 2 and 3. Cold Spring Harbor, N.Y: Cold Spring Harbor Laboratory Press.
Sesma, F., Gardiol, D., De Ruiz Holgado, A. P., and De Mendoza, D. (1990). Cloning of the citrate permease gene of Lactococcus lactis subsp. lactis biovar diacetylactis and expression in Escherichia coli. Appl. Environ. Microbiol. 56, 2099–2103. doi: 10.1128/aem.56.7.2099-2103.1990
Shams, F., Oldfield, N. J., Wooldridge, K. G., and Turner, D. P. J. (2014). Fructose-1,6-bisphosphate aldolase (FBA)-A conserved glycolytic enzyme with virulence functions in bacteria: “Ill met by moonlight.”. Biochem. Soc. Trans. 42, 1792–1795. doi: 10.1042/BST20140203
Shibamoto, T. (2014). Diacetyl: occurrence, analysis, and toxicity. J. Agric. Food Chem. 62, 4048–4053. doi: 10.1021/jf500615u
Singh, T. K., Drake, M. A., and Cadwallader, K. R. (2003). Flavor of cheddar cheese: a chemical and sensory perspective. Compr. Rev. Food Sci. Food Saf. 2, 166–189. doi: 10.1111/j.1541-4337.2003.tb00021.x
Smit, G., Smit, B. A., and Engels, W. J. M. (2005). Flavour formation by lactic acid bacteria and biochemical flavour profiling of cheese products. FEMS Microbiol. Rev. 29, 591–610. doi: 10.1016/j.femsre.2005.04.002
Song, A. A. L., In, L. L. A., Lim, S. H. E., and Rahim, R. A. (2017). A review on Lactococcus lactis: from food to factory. Microb. Cell Fact. 16:55. doi: 10.1186/s12934-017-0669-x
Thomas, T. D., Ellwood, D. C., and Longyear, V. M. C. (1979). Change from homo- to heterolactic fermentation by Streptococcus lactis resulting from glucose limitation in anaerobic chemostat cultures. J. Bacteriol. 138, 109–117. doi: 10.1128/jb.138.1.109-117.1979
Todorov, S. D. (2009). Bacteriocins from Lactobacillus plantarum - production, genetic organization and mode of action. Braz. J. Microbiol. 40, 209–221. doi: 10.1590/S1517-83822009000200001
van Hijum, S. A. F. T., García de la Nava, J., Trelles, O., Kok, J., and Kuipers, O. P. (2003). MicroPreP: a cDNA microarray data pre-processing framework. Appl. Bioinform. 2, 241–244.
Vandenbergh, P. A. (1993). Lactic acid bacteria, their metabolic products and interference with microbial growth. FEMS Microbiol. Rev. 12, 221–238. doi: 10.1016/0168-6445(93)90065-H
Westerfeld, W. W. (1945). A colorimetric determination of paraldehyde. J. Lab. Clin. Med. 30:1076. doi: 10.5555/uri:pii:0022214345903052
Xiao, Z., and Xu, P. (2007). Acetoin metabolism in bacteria. Crit. Rev. Microbiol. 33, 127–140. doi: 10.1080/10408410701364604
Keywords: Lactococcus lactis, diacetyl, acetaldehyde, biosensor, fluorescence, transcriptional sensor
Citation: Hernandez-Valdes JA, Solopova A and Kuipers OP (2020) Development of Lactococcus lactis Biosensors for Detection of Diacetyl. Front. Microbiol. 11:1032. doi: 10.3389/fmicb.2020.01032
Received: 25 March 2020; Accepted: 27 April 2020;
Published: 25 May 2020.
Edited by:
Paloma López, Margarita Salas Center for Biological Research (CSIC), SpainReviewed by:
Christian Magni, CONICET Instituto de Biología Molecular y Celular de Rosario (IBR), ArgentinaMaria Fernandez, Consejo Superior de Investigaciones Científicas (CSIC), Spain
Copyright © 2020 Hernandez-Valdes, Solopova and Kuipers. This is an open-access article distributed under the terms of the Creative Commons Attribution License (CC BY). The use, distribution or reproduction in other forums is permitted, provided the original author(s) and the copyright owner(s) are credited and that the original publication in this journal is cited, in accordance with accepted academic practice. No use, distribution or reproduction is permitted which does not comply with these terms.
*Correspondence: Oscar P. Kuipers, by5wLmt1aXBlcnNAcnVnLm5s