- 1Sustainable Agro-Ecosystems and Bioresources Department, Research and Innovation Centre, Fondazione Edmund Mach, San Michele all'Adige, Italy
- 2Energy Resources Engineering, Stanford University, Stanford, CA, United States
- 3Department of Civil, Environmental and Mechanical Engineering, University of Trento, Trento, Italy
- 4Agriculture, Food and Environment Centre (C3A), University of Trento, San Michele all'Adige, Italy
- 5Department of Agricultural, Forest and Food Sciences, University of Turin, Turin, Italy
Fusarium wilt, caused by the fungus Fusarium oxysporum f. sp. lycopersici (Fol), is one of the most destructive soil-borne diseases of tomatoes. Infection takes place on the roots and the process starts with contact between the fungus and the roots hairs. To date, no detailed studies are available on metabolic activity in the early stages of the Fol and tomato root interaction. Spatial and temporal patterns of oxygen consumption could provide new insights into the dynamics of early colonization. Here, we combined planar optodes and spatial analysis to assess how tomato roots influence the metabolic activity and growth patterns of Fol. The results shows that the fungal metabolism, measured as oxygen consumption, increases within a few hours after the inoculation. Statistical analysis revealed that the fungus tends to growth toward the root, whereas, when the root is not present, the single elements of the fungus move with a Brownian motion (random). The combination of planar optodes and spatial analysis is a powerful new tool for assessing temporal and spatial dynamics in the early stages of root-pathogen interaction.
Introduction
Fusarium wilt, caused by the soil-borne fungus Fusarium oxysporum f.sp. lycopersici (Sacc.) W.C. Snyder & H.N. Hans (Fol), is one of the most devastating diseases of the tomato. It is indeed responsible for severe losses in the greenhouse, open field crops and hydroponic cultures. Fusarium oxysporum f.sp. lycopersici infects tomato roots, starting from a contact with the root hairs and ending with the colonization and necrosis of the root tissue and wilting of the plant (Lagopodi et al., 2002; Mandal et al., 2009). Root colonization by Fol is, therefore, a crucial aspect in a successful pathogenesis (Lagopodi et al., 2002). Because of its economic importance, Fol has received considerable attention from researchers, especially in terms of root colonization patterns by pathogenic and non-pathogenic strains (Bao and Lazarovits, 2001; Lagopodi et al., 2002; Olivain et al., 2006), with and without the presence of microbial biocontrol agents (Bolwerk et al., 2003, 2005).
Fungal growth has traditionally been studied under the microscope, e.g., by measuring spore germ tube elongation during spore germination, by monitoring radial growth on jellified growth media in Petri dishes or by determining variations in fungal biomass (Cole, 1994; Dhingra and Sinclair, 1995). Moreover, colorimetric and spectrometric methods and microtitre plate assays have also been utilized (Hadacek and Greger, 2000). Oxygen consumption in three fungal species was recently studied with an indirect fluorimetric method, that was found to be highly sensitive and reliable in quantifying fungal activity (Nell et al., 2006). However, these studies did not visualize and quantify the early-stage interaction between the Fol mycelium and the tomato roots, especially in terms of spatial and temporal oxygen consumption patterns (i.e., oxidative metabolic activity, Novodvorska et al., 2016; Veillet et al., 2017).
Many biogeochemical processes occur in the roots. As an example, the roots influence the surrounding soil environment by releasing a blend of exudate compounds, which act as signals in plant-pathogen interaction (both for defense and/or pathogen stimulation) and can stimulate, for example, the germination of Fol microconidia (Bais et al., 2006; Steinkellner et al., 2009; Baetz and Martinoia, 2014). Besides consuming O2 for respiratory activities, root O2 emissions have been observed in plants inhabiting freshwater biomes, such as wetlands or flood-prone environments (McNamara and Mitchell, 1990; Colmer, 2003; Xu et al., 2013; Rudolph-Mohr et al., 2017).
Traditionally, root metabolic activity has been quantified by changes in oxygen concentration using microsensors, which provide local pointwise information, but are invasive. Thus this approach does not make it possible to study biological samples over a large area, or during prolonged periods of time (Tschiersch et al., 2011). Recent advances in imaging methodologies including cameras, scanners, fluorescence, and radiation-based techniques have enabled non-destructive exploration of root growth, including root interaction with soil-borne pathogens (Downie et al., 2015). Fluorescence-based optical sensors, such as non-invasive planar optodes, allow real time measurements of physiological processes offering manifold advantages over other methods including: spatial coverage (from mm2 to cm2), micrometric level of resolution and an extended period of measurement (from a few seconds to several days) (Tschiersch et al., 2012). Optodes have been successfully employed to quantify biological O2 exchange in seagrasses and other aquatic plants (Jovanovic et al., 2015; Larsen et al., 2015; Han et al., 2016), in the roots of terrestrial living plants (Blossfeld et al., 2011; Tschiersch et al., 2011; Rudolph et al., 2012; Rudolph-Mohr et al., 2015), in photosynthetically active leaves (Tschiersch et al., 2011; Ulqodry et al., 2016) and in the sapwood of woody trees (Gansert et al., 2001), as well as to assess oxidative metabolism in soils (Rubol et al., 2016) and biofilm (Rubol et al., 2018). Despite these research efforts, no planar optode studies have assessed soil-borne microorganism activity, either considering the pathogen alone or the pathogen interacting with plant roots. To fill this gap in research and explore the early stages of root-fungus interaction, we combined the use of non-invasive planar optode technology and geostatistical spatial analysis. We investigated how the temporal and spatial dynamics of Fol growth (assumed to be proportional to O2 consumption) are altered by the presence of tomato roots, and, vice-versa, how root physiology is affected by fungus colonization. The interaction was further examined using spatial analysis, to describe the dynamics of the fungus colony during root colonization and to quantify the nature of this interaction.
Materials and Methods
Experimental Setup
Seeds of Lycopersicum esculentum Mill. var. Marmande were surface disinfected in a 70% ethanol (30 s) and 1% sodium hydrochloride solution (1 min) (both from Sigma Aldrich, USA), carefully rinsed twice in sterile distilled water, and placed in a Petri dish (Ø = 90 mm) on 1/2-strength Murashige and Skoog medium (Murashige and Skoog, 1962). The seeds were then kept in a climate chamber at 23°C, with a day:night cycle of 14:10 h until the plant was at least 90 mm long (25 mm shoot and 65 mm root; reached in approximately 3–5 days).
The fungal material (Fol strain FGSC 9935) was acquired from Fungal Genetics Stock Center (US) and stored long-term at −80°C in glycerol (Sigma Aldrich). A conidial suspension obtained from the stock solution was transferred onto 1/4-strength potato dextrose agar (PDA; Oxoid, Italy), incubated for seven days at 25°C and the resulting colonies were used in the experiments. A square Petri dish (10 × 10 × 2 cm; L × W × H) was prepared the day before each measurement session, according to the following procedure. A 2 × 2 cm O2 sensor foil (SF-RPSu4 Oxygen sensor foil for imaging; Presens, 2013b) was glued to the inside of the Petri dish in the position where the root was supposed to grow and elongate during the experiment. The sensor foil was calibrated according to the Presens instruction manual (Presens, 2013a,b): a droplet of oxygen-free water obtained from a water solution of sodium sulfite (Na2SO3; Sigma Aldrich) and cobalt nitrate [Co(NO3)2; Sigma Aldrich] in nitric acid (HNO3; Sigma Aldrich) was used as the 0 point, whereas air saturated O2 (ambient air) was the reference for 100% O2. Then, a 0.3% agar (Sigma-Aldrich) solution, cooled to 55°C in order to avoid damages to the optode, was poured on the dish until it reached a thickness of 5 mm. Before pouring the medium into the Petri dish, the surface of the sensor foil was gently disinfected with 70% ethanol. Once the agar solution had cooled down to room temperature, a single tomato plant was carefully positioned inside the Petri dish, under the agar layer, so that the root adhered to the sensor foil whilst the stem and leaves were left to protrude outside, through a small hole made in the plastic (Figure 1). Similarly, at the same time, a 6 mm plug of fungal mycelium was placed under the agar layer in the upper right corner of the sensor foil (opposite to the aerial part of the plant). This root-fungus interaction experiment was repeated twice (on March 14 and May 21, 2014). Two controls were also performed: on the plant root without the fungus (on April 4, 2014) and on the fungus alone (on April 7, 2014), utilizing a 6 mm mycelium plug positioned in the center of the optode.
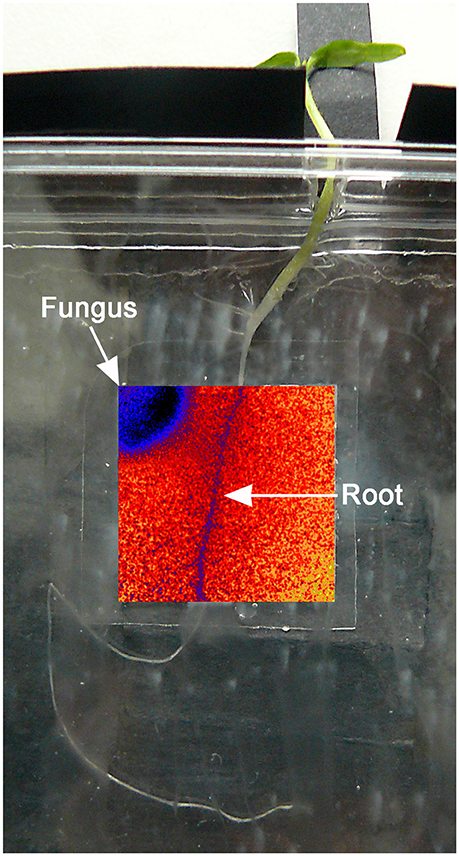
Figure 1. Testing system: the tomato plant was positioned with the root adherening to the optode and the aerial part protruding from the Petri dish through a small hole. The inserted overlay false color image shows the O2 distribution and position of the fungus.
The Petri dish was sealed with Parafilm (Sigma Aldrich) along the perimeter and enclosed in a black cardboard to avoid light interference during measurement and at the same time, to protect the sensor foil from light. The shoot of the plant remained outside the black box to allow normal photosynthesis. A removable window the same size of the sensor foil was cut into the bottom side of the black box and covered with a removable cardboard flap, in order to allow the Vivisens detector unit to face the sensor foil. All the above mentioned operations were carried out in the dark and under sterile laminar flow to prevent any alteration of the sensor foil and/or biological contamination of the substrate.
Image Acquisition
The Vivisens detector unit (DU01 detector unit for spectral 2D read-out of fluorescent oxygen sensor foils; Presens, 2013b) was mounted on a microscope stand modified for the purpose: with this device the distance between the sample and the detector unit lenses was easily adjustable by turning a knob. A foam gasket was positioned between the detector unit and the Petri dish, in order to shield the system from interfering light sources (sunlight and or lab lamps). The distance between the microscope and the sample was set at about 5 cm, which was shown to be optimal in preliminary tests, to acquire images of the entire sensor foil. The detector unit was connected to a laptop, where VA1.12 VisiSens Analytical 1 software (Presens, 2013c) was programmed to measure and record images at 5 min intervals (See also Supplementary Video 1). During the experiment the air temperature in the laboratory was continuously recorded at 5 min intervals in close proximity to the Petri dish, with a temperature probe (thermocouple) connected to a CR23X data-logger (Campbell Scientific, USA).
Images Post-processing
Oxygen measurements were expressed as the percentage of O2 saturation in freshwater at atmospheric equilibrium (% air saturation). Oxygen images were first analyzed with image processing software (VisiSens Analytical 1 VA1.12-RC05; Presens, 2013c), which calculates the ratio of red to green in the emitted fluorescence response (the so-called R-value) provided by the color channels of the CMOS (complementary metal-oxide-semiconductor) chip (Presens, 2013c). The RGB images were calibrated by using the reference images obtained as described above and transformed into a 8-bit gray scale (256 levels of luminance). In the resulting figures white and black correspond to 0 and 100% O2 saturation, respectively. Subsequently, the images were cropped to remove the crown external to the sensor foil and transformed into a matrix of O2% air saturation using the Matlab function imread (MathWorks, 2012).
Determination of O2 Consumption Rates
The O2 consumption rates were calculated based on the decline of O2% air saturation over time (i.e., the slope of the interpolating regression line) as reported by Tschiersch et al. (2011). We selected only specific time intervals where the regression line between O2% air saturation and time was highly significant (p < 0.01; R2 > 0.90). The slope (σ) was then used to calculate the O2 content in air-saturated water at temperature (θ) and pressure (patm) according to the following equation (Presens, 2009):
where: cS is the water O2 content in mg l−1; pw is the water vapor pressure at the temperature θ; pN is the standard pressure (1013.26 mbar); σ is the slope of the regression line; 0.2095 is the volume of O2 content in air; α (θ) is the Bunsen absorption coefficient (Benson and Krause, 1980) i.e., the volume of gas dissolved in a unit volume of solvent at standard partial pressure of the gas (1013.26 mbar) at the temperature θ; MO2 is the molecular mass of O2 and VM is the molar volume of O2. The atmospheric pressure values (patm) was recorded at the nearby weather station (San Michele all'Adige; 46.183498–11.120220) with a PTB220 digital barometer (Vaisala, Finland) whereas temperature (θ) was monitored close to the Petri dish (as explained above). Knowing the time step of image acquisition (5 min) and the surface area (selected for the root and fungus), we could then transform cS from mg O2 l−1 into g O2 m−2 d−1. Since our agar medium was 0.3%, we performed the above calculations treating the medium as pure water: indeed, according to Van der Meeren et al. (2001), the diffusion coefficient of O2 in a 0.7–2.0% agar solution only decreases by 1.7 and 2.8%, respectively.
Statistical Analysis
The collected images were transformed into a matrix of oxygen concentration, with each value attributed to the center of the corresponding pixel. The position of each pixel is therefore identified by two indexes (i,j), referring respectively to the row and the column of the matrix (Figure 2) whereas N1 and N2 are the number of pixels along the horizontal and vertical directions, Δx1 and Δx2 are the respective dimensions of the pixels. The origin of the reference system was fixed in the upper left corner of the cropped image, with the x1 axis going from left to right and the x2 axis from top to bottom (Figure 3).
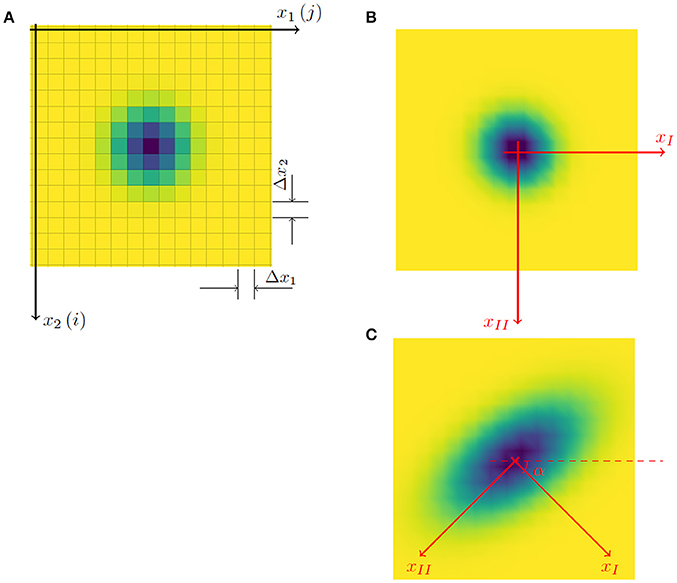
Figure 2. The reference system used to calculate the temporal dynamics of O2 concentration (A) was constituted by a computational grid with Δx1, Δx2 mesh coinciding with the pixel dimensions in the horizontal and vertical directions respectively (the color of the pixel represents the saturation deficit). (B) If the spatial growth of the fungus colony is uniform, the principal directions xI and xII coincide with x1 and x2 respectively, and angle α is 0 compared to the reference axis x1. (C) If the growth of the colony has a preferential direction (e.g., along axis xII) the principal directions are rotated clockwise by an angle α ≠ 0 (e.g., α = π/4). In all cases, the tensor of second moments is diagonal when evaluated in relation to axes xI and xII instead of x1 and x2, (i.e., XI,II = 0 and XII,II > XI,I).
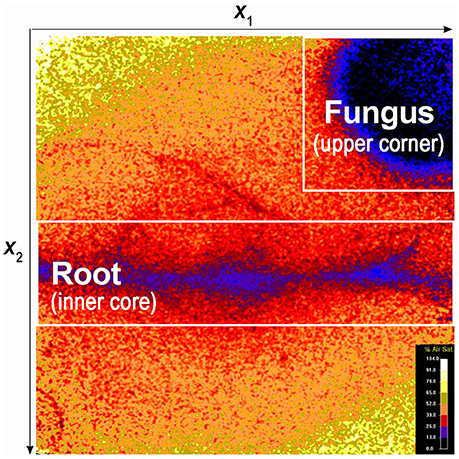
Figure 3. False color image showing O2 spatial distribution and the position of the root and fungus. The dynamics of O2 concentration were investigated in targeted portions of the sensor foil: i.e., the area surrounding the root (inner core) and the area surrounding the fungus (upper right corner).
Temporal Dynamics of Oxygen Concentration
To quantify the dynamics of fungus and root O2 concentration, we selected targeted portions of the sensor foil: i.e., the area including the root and its adjacent surroundings (defined as the inner core) and the area including the fungus and its surroundings (upper corner or central part of the optode; Figure 3). We than assumed that the density of the fungus, was linearly proportional to the deficit in the O2 concentration:
where ρi,j is the O2 deficit compared to saturation and Ci,j is the concentration of O2 expressed as a percentage of air saturation [the two indexes identify the position within the sensor foil, with jΔx1 and iΔx2 being the coordinates of the pixel center (i,j), having an O2 concentration Cj,i. We also assumed that the mass of the fungus was proportional to its O2 consumption. Given the above assumptions, we characterized the fungus dynamics by computing the spatial moments of the oxygen deficit ρ.
Spatial Moments
Spatial moments were chosen because they are useful indicators for describing (i) in which direction the fungus is propagating, (ii) how the fungus grows (as expressed by second moments), and (iii) how the fungus is propagating (e.g., whether it is following a diffusive process or not). The first spatial moment illustrates the evolution in time of the center of mass of the fungus of coordinates and , which is also described by the spatial distribution of the O2 deficit:
where is proportional to the total mass of the fungus. Similarly, the 2 s order moments X11, X12, and X22, which are descriptors of colony spatial distribution (i.e., spreading around the central mass) compared to the two reference axes x1 and x2, are given by:
X11, X22, X12, represent respectively longitudinal, transversal, and cross-directional spreading around the central mass of the fungus.
Results
O2 Dynamics During Root-Fungus Interaction
In the first experimental run, the O2% air saturation in the upper right corner of the sensor foil decreased for about 12 h, from 37.1 to 19.7% (Δ = 17.4%; Figure 4A). This was the consequence of an initially high fungal respiration rate (e.g., O2 consumption), which was quantified in 18.2 g O2 m−2 d−1, reaching a minimum and then recovering to the initial value (Figure 4A). The O2 level in the inner root core peaked at 38.2% at 5.5 h (i.e., t = 5.5 h) then decreased due to a high consumption rate, quantified as 19.9 g O2 m−2 d−1 (Figure 4A). Through visual inspection of the image sequence, we observed that the fungus colonized the root between 15 and 20 h from the beginning of the test; subsequently, changes in O2% air saturation were the result of the combined oxidative metabolic activity of two overlapping organisms, quantified as 0.5–1.2 g O2 m−2 d−1. When the root-fungus interaction experiment was repeated, similar behavior was observed (Figure 4B): fungal respiration increased, with O2 falling from 36.7% at the beginning of the experiment to 24.1% at t = 12 h (Δ = 12.6%) and recovered afterwards. The O2 concentration in the inner core (root) peaked at t = 8.5 h (37.9%) and then decreased (Figure 4B). The fungal and root respiration rates were 18.1 and 4.5 g O2 m−2 d−1, respectively.
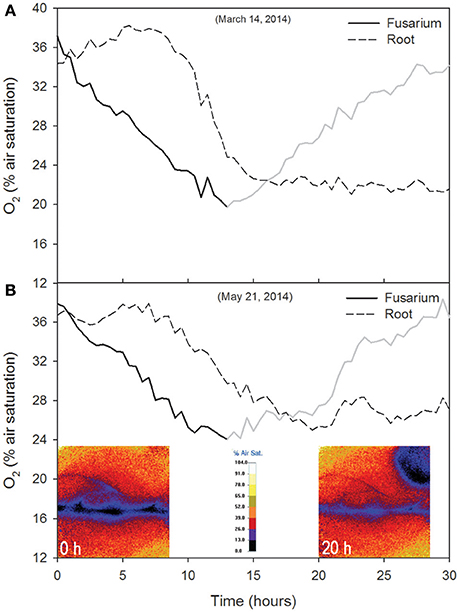
Figure 4. Time course of O2 (% air saturation) in the first (A) and second (B) root-fungus interaction tests. O2 data were averaged over 30 min and considered as a proxy for the oxidative metabolic activity of the fungus (Fusarium oxysporum) and the plant (Licopersicum esculentum). The gray part of the fusarium O2 line refers to the recovery phase. The false color images showing O2 spatial distribution and the position of the root and fungus over the optode are also reported (B). These images were taken 0 and 20 h after the beginning of the experiment.
In the control with the plant alone, the root O2% air saturation varied between 27.9 and 32.2% (Δ = 4.3%; Figure 5A). The O2 peaks were in phase with temperature peaks (temperature ranged from 20 to 25.4°C; Δ = 5.4; correlation analysis: Pearson r2 = 0.44, p < 0.01, N = 141; from t = 0 to t = 70 h), whereas the concentration fluctuated breafly around 13.5% O2 for about 15 h (Figure 5B). A release phase followed, coinciding with a decrease in temperature. From t = 16 h to t = 70, the oxygen trend largely reflected the temperature trend (i.e., O2 concentration decreased with increasing temperature; correlation analysis: Pearson r2 = −0.05, p < 0.01, N = 141) with O2% air saturation ranging from 13.0 to 21.6% (Δ = 8.6%) and temperature ranging between 19.2 and 24.9°C (Δ = 5.7°C). Respiration rates varied between 37.4 and 101.0 g O2 m−2 d−1.
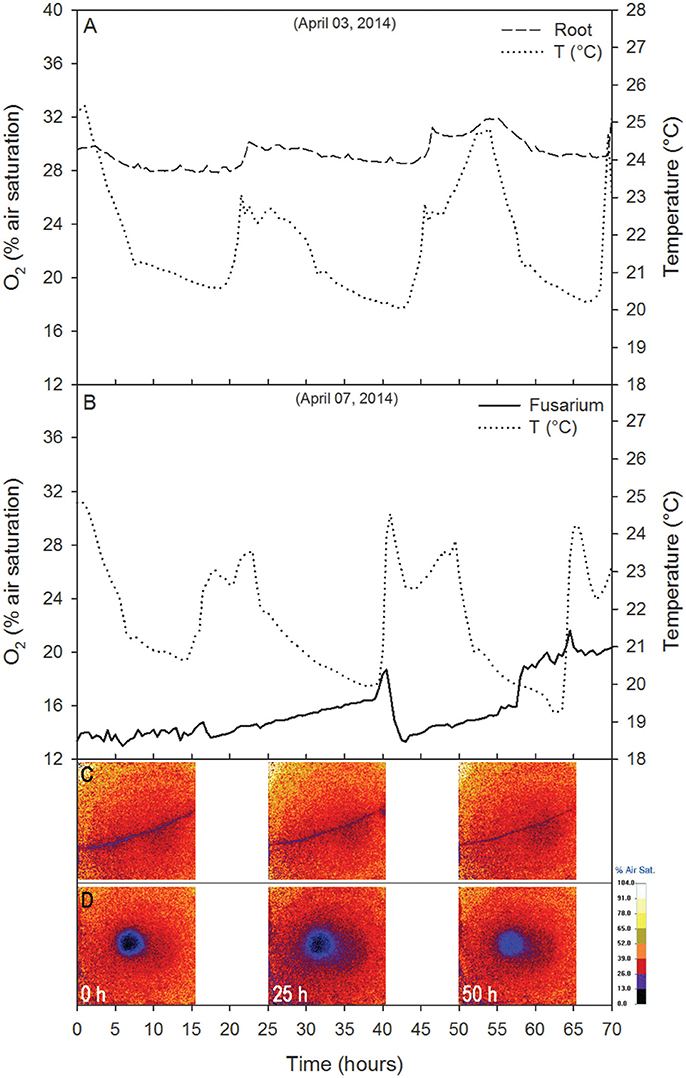
Figure 5. Control tests showing the time course of O2 (% air saturation) for the root alone (A) and the fungus alone (B). The temperature recorded near the Petri dish is reported. Data are 30 min averages.
Temporal and Spatial Activity of the Fungus
In the presence of the root, the trajectory of the fungus' center of mass rotated counter-clockwise with the maximum distance from the original position recorded 18 h after inoculation (Figure 6A). During this period the barycenter of the colony moved slightly away from the root (from left to right and upwards), the mass grew almost uniformly in the upper corner of the sensor foil. Initially the movement of the center of mass was very fast (after 12 h the distance traveled by the barycenter was about 0.8 mm), while it took about 60 h to return to its original position. At each time step the second moments were computed in the reference system (xI, xII) rotated by the angle α the reference system (x1, x2) (Figures 2B,C). Angle α was such as to make the tensor diagonal, with maximum second moment XII,II, oriented in direction xII and minimum second moment XI,I in direction xI. These two moments were obtained by making the matrix of second order moments diagonal. The second moment XII,II first increased, reaching a peak 12 h after inoculation, then decreasing to a minimum at t = 22 h, and finally increasing again, reaching a stable value slightly lower than the initial one at t = 40 h. The second moment XI,I was specular to XII,II (increasing when XII,II reduced and reducing when it increased) and reached a stable value after 25 h, well before the other moment (see Figure 7A). Angle α was first reduced by counterclockwise rotation, reaching a minimum after 12 h, when XII,II was at its maximum, then increased with clockwise rotation to a maximum of about 15° at t = 30 h to finally stabilize at a value of 10° after 40 h by counterclockwise rotation.
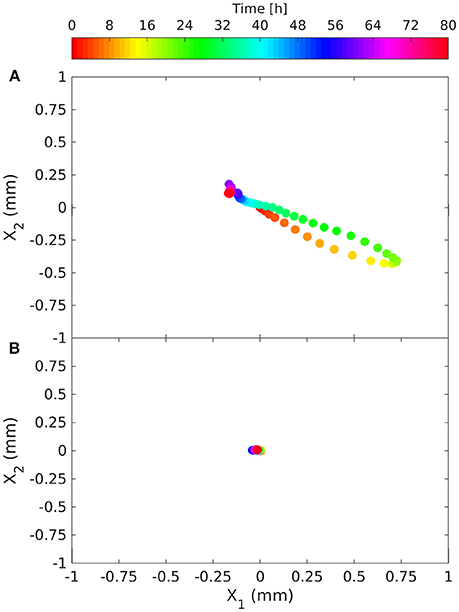
Figure 6. Time evolution of the barycenter (center of mass) of the fungus' O2 deficit relative to its initial position, in the presence of the root [(A); March 14, 2014] and without the root (B). The deficit is considered to be proportional to the mass of the fungus and provides information on fungal growth.
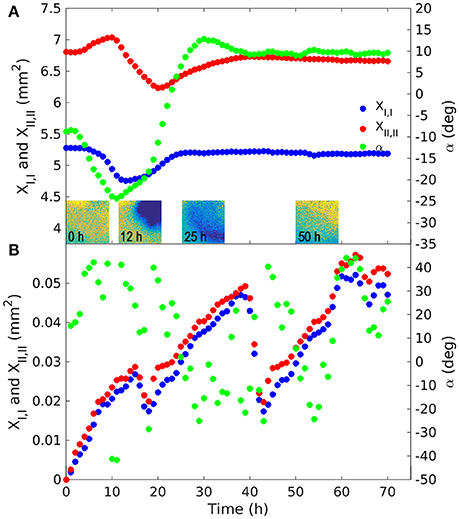
Figure 7. Principal second moments of the fungus body in the experiment with the root [(A); March 14, 2014] and with the fungus alone (B). The maximum principal second moment (XII,II) was computed with reference to axis xII, forming the α angle with the direction x1 of the reference system. The minimum principal moment (XI,I) was computed with reference to axis xI orthogonal to xII, forming with it a local rotating orthogonal reference system. The tensor of moments of inertia is diagonal in relation to this reference system. These moments provide an indication of the dispersion around the centroid. The color figures in A are snapshots of the O2 deficit in the upper corner where the fungus was inoculated. Spatial density was assumed to be proportional to the oxygen deficit in comparison with saturation. The color of the pixels goes from yellow to blue representing low and high oxygen deficit (and fungus density) respectively. The secondary y axis indicates rotation angle α, expressed in degrees, of the principal axes compared to the x1 direction.
In the control with the fungus alone, the dynamics were completely different. The center of mass was stationary (Figure 6B) and the second order moments grew linearly with time experiencing two sudden drops at 18 and 40 h (Figure 7B). These drops, in particular the second, indicated a contraction of the fungus metabolism caused by the decrease in temperature (see the Figure 5B). The linear increase in second order moments suggests that the fungus moved randomly with Brownian type movement leading to Fickian diffusion.
Discussion
The comparable results obtained in the two root-fungus interaction experiments demonstrate the consistency and related reliability of the planar optode technique in monitoring O2 continuously, over a prolonged period of time and without perturbing the system. In both tests, an initially high level of fungal respiration (e.g., O2 consumption), peaking after 12 h was seen. The respiration rates were almost identical in the two control tests (18.2 and 18.1 g O2 m−2 d−1 respectively). A similar trend in Fol O2 consumption was reported by Nell et al. (2006). However, direct comparison with the values recorded by Nell et al. (2006) is not possible, since their data are expressed in terms of relative fluorescence units and the rates measured in our work are the result of different factors, such as root stimulation and presumably root exudates (Bais et al., 2006). Root exudates can indeed stimulate the germination of Fol microconidia (Steinkellner et al., 2005, 2009). The peak in fungal respiration was followed by a phase of lower respiration caused by a decrease in fungal metabolic activity present in the reference area (upper corner) due to the fact that the fungus moved out of the investigated area and colonized the root.
Root O2 consumption at the beginning of the first experiment (19.9 g O2 m−2 d−1) was similar to that of the fungus alone, whereas, in the second root-fungus experiment it was lower (4.5 g O2 m−2 d−1), probably due to lower physiological activity of the plant (Lai et al., 2016). The measured root respiration rates were of the same order of magnitude as those observed by Dong et al. (2011), in a wetland mesocosm for the aquatic plant Acorus calamus L. (14.4–30.3 g O2 m−2 d−1). The small number of available studies and the lack of experimental details (e.g., area, temperature, pressure) (Hadas and Okon, 1987; Tschiersch et al., 2012; Han et al., 2016; Rudolph-Mohr et al., 2017; Lenzewski et al., 2018) does not allow additional comparison with in vitro respiration rates. The change in O2% air saturation for the fungus alone (Δ = 8.6) was lower than that measured in the fungus during root-fungus interaction (12.6 < Δ < 17.4). This difference can be explained by the sudden peaks in air temperature recorded during the experiment with the fungus alone. The increase in temperature indeed promoted an increase in respiration rates (up to 101.0 g O2 m−2 d−1). The variation in O2% air saturation of the root alone was even lower (Δ = 4.3) than that measured during interaction. The low rates of O2 consumption can be related to potential root O2 emissions. Several studies have shown aerenchyma tissue development and O2 emissions from tomato roots and for other cultures as well, as a consequence of waterlogging (Kawase and Whitmoyer, 1980; McNamara and Mitchell, 1990; Xu et al., 2013; Vidoz et al., 2016).
Statistical analysis of the data allowed quantification of the aforementioned observations, making it possible to distinguish three distinct phases in particular: (i) a peak in oxygen consumption reached at 12 h occupying about 50% of the upper corner area; (ii) occupation of the whole area between 22 h (minimum of XII,II) and 25 h (maximum of XI,I); (iii) root colonization (Figure 7A). We cannot define the precise moment of contact between the fungus and root, because this would have required microscope investigation at a higher magnification, however we can say that this happened between 12 and 22 h (i.e., the fungus started to move after reaching peak activity). This behavior of Fol in colonizing tomato roots is in line with that observed by Lagopodi et al. (2002), although they used a destructive method, using a new biological sample for each subsequent observation and not showing the dynamics of metabolic activity for the two organisms. These complex dynamics ended at about 40 h, when both moments stabilized. From this time on the colony reduced its density uniformly in space. This behavior demonstrates that growth is stimulated by perception of the root and presumably by the diffusion of root exudates through the medium (Bécard and Piché, 1989).
In the experiment with the fungus alone, the barycenter of the object did not move, while second order moments along the principal directions grew linearly with time (Figures 6B, 7B respectively), apart from two sudden drops at 18 and 40 h due to abrupt changes in temperature (data not shown). Angle α oscillated between −40° and +40°. The linear, in time, growth of the second moments is indicative of a Brownian motion which is characterized by random movement of a population of particles (Einstein, 1956). This behavior was expected, since fungus has been shown to grow radially on jellified nutritional medium (Trinci, 1969).
Conclusions
Overall, the planar optode technique proved to be a useful tool for investigating the O2 dynamics of root-fungus interaction, due to the flexibility of the system, which technically allows testing of the effect of virtually infinite perturbing factors in interaction and the possibility of studying other plant and fungal species. However, one limitation of the approach presented is the need to work in dark conditions to protect the sensor foil from light interference. This aspect, together with the need for a layer of water between the sample and the optode, make the approach unsuitable for open field studies at the moment. For the first time our work visualizes and quantifies the dynamics of O2 consumption and related metabolic activity characterizing root-fungus interaction, with the considerable advantage, as compared to standard methods, of not being destructive. Geostatistical analysis made it possible to describe and quantify the spatial motion of the fungus, which was stimulated by the presence of the root and oriented its growth. This situation was completely different in the experiment with the fungus alone, which was characterized by random Brownian motion.
We conclude that combining optodes and geostatistical analysis is a powerful tool for understanding the temporal and fine scale root-fungus interaction, especially to complement functional studies carried out with other approaches. Translation to real soils needs caution, given the significant effect of heterogeneity in soil and nutrient distribution, which affects the magnitude and direction of fungal growth.
Author Contributions
MR, SR, DG, and ET planned and designed the research. MR and ET performed experiments and conducted fieldwork. MR, SR, AB, and IP analyzed and interpreted the data. MR, SR, AB, ET, IP wrote the paper. MR, SR, AB, ET, GM, and IP revised the paper.
Conflict of Interest Statement
The authors declare that the research was conducted in the absence of any commercial or financial relationships that could be construed as a potential conflict of interest.
Acknowledgments
SR acknowledges the support of the Autonomous Province of Trento and the European Commission within the 7th Framework Programme Marie Curie Actions—COFUND. We thank Ilaria Rado for helping with laboratory measurements. AB acknowledges funding by the Italian Ministry of Education, University and Research (MIUR) under the Departments of Excellence, grant L.232/2016.
Supplementary Material
The Supplementary Material for this article can be found online at: https://www.frontiersin.org/articles/10.3389/fmicb.2018.01491/full#supplementary-material
Supplementary Video 1. False color image video showing the O2 spatial distribution during the interaction between 652 the root and the fungus from time t = 0 to t = 40 h. The O2 % air saturation decreases going 653 from light color (90–100% O2) to dark (0–13% O2).
References
Baetz, U., and Martinoia, E. (2014). Root exudates: the hidden part of plant defense. Trends Plant Sci. 19, 90–98. doi: 10.1016/j.tplants.2013.11.006
Bais, H. P., Weir, T. L., Perry, L. G., Gilroy, S., and Vivanco, J. M. (2006). The role of root exudates in rhizosphere interactions wiith plants and other organisms. Annu. Rev. Plant Biol. 57, 233–266. doi: 10.1146/annurev.arplant.57.032905.105159
Bao, J. R., and Lazarovits, G. (2001). Differential colonization of tomato roots by nonpathogenic and pathogenic Fusarium oxysporum strains may influence fusarium wilt control. Phytopathology 91, 449–456. doi: 10.1094/PHYTO.2001.91.5.449
Bécard, G., and Piché, Y. (1989). Fungal growth stimulation by Co2 and root exudates in vesicular-arbuscular mycorrhizal symbiosis. Appl. Environ. Microbiol. 55, 2320–2325.
Benson, B. B., and Krause, D. (1980). The concentration and isotopic fractionation of gases dissolved in freshwater in equilibrium with the atmosphere. 1. Oxygen. Limnol. Oceanogr. 25, 662–671. doi: 10.4319/lo.1980.25.4.0662
Blossfeld, S., Gansert, D., Thiele, B., Kuhn, A. J., and Lösch, R. (2011). The dynamics of oxygen concentration, pH value, and organic acids in the rhizosphere of Juncus spp. Soil Biol. Biochem. 43, 1186–1197. doi: 10.1016/j.soilbio.2011.02.007
Bolwerk, A., Lagopodi, A. L., Lugtenberg, B. J. J., and Bloemberg, G. V. (2005). Visualization of interactions between a pathogenic and a beneficial fusarium strain during biocontrol of tomato foot and root rot. Mol. Plant Microbe Interact. 18, 710–721. doi: 10.1094/MPMI-18-0710
Bolwerk, A., Lagopodi, A. L., Wijfjes, A. H., Lamers, G. E. M., Chin-A-Woeng, T. F. C., Lugtenberg, B. J., et al. (2003). Interactions in the tomato rhizosphere of two pseudomonas biocontrol strains with the phytopathogenic fungus Fusarium oxysporum f. sp. radicis-lycopersici. Mol. Plant Microbe Interact. 16, 983–993. doi: 10.1094/MPMI.2003.16.11.983
Cole, M. D. (1994). Key antifungal, antibacterial and anti-insect assays—a critical review. Biochem. Syst. Ecol. 22, 837–856. doi: 10.1016/0305-1978(94)90089-2
Colmer, T. D. (2003). Long-distance transport of gases in plants: a perspective on internal aeration and radial oxygen loss from roots. Plant Cell Environ. 26, 17–36. doi: 10.1046/j.1365-3040.2003.00846.x
Dhingra, O. D., and Sinclair, J. B. (1995). Basic Plant Pathology Methods, 2nd Edn. Boca Raton, FL: CRC Press.
Dong, C., Zhu, W., Zhao, Y. Q., and Gao, M. (2011). Diurnal fluctuations in root oxygen release rate and dissolved oxygen budget in wetland mesocosm. Desalination 272, 254–258. doi: 10.1016/j.desal.2011.01.030
Downie, H. F., Adu, M. O., Schmidt, S., Otten, W., Dupuy, L. X., White, P. J., et al. (2015). Challenges and opportunities for quantifying roots and rhizosphere interactions through imaging and image analysis. Plant. Cell Environ. 38, 1213–1232. doi: 10.1111/pce.12448
Gansert, D., Burgdorf, M., and Lösch, R. (2001). A novel approach to the in situ measurement of oxygen concentrations in the sapwood of woody plants. Plant. Cell Environ. 24, 1055–1064. doi: 10.1046/j.1365-3040.2001.00751.x
Hadacek, F., and Greger, H. (2000). Testing of antifungal natural products: methodologies, comparability of results and assay choice. Phytochem. Anal. 11, 137–147. doi: 10.1002/(SICI)1099-1565(200005/06)11:3<137::AID-PCA514>3.0.CO;2-I
Hadas, R., and Okon, Y. (1987). Effect of Azospirillum brasilense inoculation on root morphology and respiration in tomato seedlings. Biol. Fertil. Soils 5, 241–247. doi: 10.1007/BF00256908
Han, C., Ren, J., Tang, H., Xu, D., and Xie, X. (2016). Quantitative imaging of radial oxygen loss from Valisneria spiralis roots with a fluorescent planar optode. Sci. Total Environ. 569–570, 1232–1240. doi: 10.1016/j.scitotenv.2016.06.198
Jovanovic, Z., Pedersen, M., Larsen, M., Kristensen, E., and Glud, R. (2015). Rhizosphere O2 dynamics in young Zostera marina and Ruppia maritima. Mar. Ecol. Prog. Ser. 518, 95–105. doi: 10.3354/meps11041
Kawase, M., and Whitmoyer, R. E. (1980). Aerenchyma development in waterlogged plants. Am. J. Bot. 67, 18–22.
Lagopodi, A. L., Ram, A. F., Lamers, G. E., Punt, P. J., Van den Hondel, C. A., Lugtenberg, B. J., et al. (2002). Novel aspects of tomato root colonization and infection by Fusarium oxysporum f. sp. radicis-lycopersici revealed by confocal laser scanning microscopic analysis using the green fluorescent protein as a marker. Mol. Plant Microbe Interact. 15, 172–179. doi: 10.1094/MPMI.2002.15.2.172
Lai, Z., Lu, S., Zhang, Y., Wu, B., Qin, S., Feng, W., et al. (2016). Diel patterns of fine root respiration in a dryland shrub, measured in situ over different phenological stages. J. For. Res. 21, 31–42. doi: 10.1007/s10310-015-0511-4
Larsen, M., Santner, J., Oburger, E., Wenzel, W. W., and Glud, R. N. (2015). O2 dynamics in the rhizosphere of young rice plants (Oryza sativa L.) as studied by planar optodes. Plant Soil 390, 279–292. doi: 10.1007/s11104-015-2382-z
Lenzewski, N., Mueller, P., Meier, R. J., Liebsch, G., Jensen, K., and Koop-Jakobsen, K. (2018). Dynamics of oxygen and carbon dioxide in rhizospheres of Lobelia dortmanna- a planar optode study of belowground gas exchange between plants and sediment. New Phytol. 281, 131–141. doi: 10.1111/nph.14973
Mandal, S., Mallick, N., and Mitra, A. (2009). Salicylic acid-induced resistance to Fusarium oxysporum f. sp. lycopersici in tomato. Plant Physiol. Biochem. 47, 642–649. doi: 10.1016/j.plaphy.2009.03.001
McNamara, S. T., and Mitchell, C. A. (1990). Adaptative stem and adventitious root responses of two tomato genotypes to flooding. HortScience 25, 100–103.
Murashige, T., and Skoog, F. (1962). A revised medium for rapid growth and bio assays with tobacco tissue cultures. Physiol. Plant. 15, 473–497. doi: 10.1111/j.1399-3054.1962.tb08052.x
Nell, M., Mammerler, R., and Steinkellner, S. (2006). Oxygen consumption-based evaluation of fungal activity. Mycol. Res. 110, 760–764. doi: 10.1016/j.mycres.2006.03.012
Novodvorska, M., Stratford, M., Blythe, M. J., Wilson, R., Beniston, R. G., and Archer, D. B. (2016). Metabolic activity in dormant conidia of Aspergillus niger and developmental changes during conidial outgrowth. Fungal Genet. Biol. 94, 23–31. doi: 10.1016/j.fgb.2016.07.002
Olivain, C., Humbert, C., Nahalkova, J., Fatehi, J., L'Haridon, F., and Alabouvette, C. (2006). Colonization of tomato root by pathogenic and nonpathogenic Fusarium oxysporum strains inoculated together and separately into the soil. Appl. Environ. Microbiol. 72, 1523–1531. doi: 10.1128/AEM.72.2.1523-1531.2006
Presens (2013a). Detector Unit DU01/02/03 for Vivisens A1/A2/A3 (Instruction Manual) (Regensburg), 1–18.
Presens (2013c). VisiSens AnalytiCal 1: Software for the VisiSens Imaging System, Version VA1.12 (Instruction Manual) (Regensburg), 1–49.
Rubol, S., Dutta, T., and Rocchini, D. (2016). 2D visualization captures the local heterogeneity of oxidative metabolism across soils from diverse land-use. Sci. Total Environ. 572, 713–723. doi: 10.1016/j.scitotenv.2016.06.252
Rubol, S., Freixa, A., Sanchez-Vila, X., and Romaní, A. M. (2018). Linking biofilm spatial structure to real-time microscopic oxygen decay imaging. Biofouling 34, 200–211. doi: 10.1080/08927014.2017.1423474
Rudolph, N., Esser, H. G., Carminati, A., Moradi, A. B., Hilger, A., Kardjilov, N., et al. (2012). Dynamic oxygen mapping in the root zone by fluorescence dye imaging combined with neutron radiography. J. Soils Sediments 12, 63–74. doi: 10.1007/s11368-011-0407-7
Rudolph-Mohr, N., Gottfried, S., Lamshöft, M., Zühlke, S., Oswald, S. E., and Spiteller, M. (2015). Non-invasive imaging techniques to study O2 micro-patterns around pesticide treated lupine roots. Geoderma 239–240, 257–264. doi: 10.1016/j.geoderma.2014.10.022
Rudolph-Mohr, N., Tötzke, C., Kardjilov, N., and Oswald, S. E. (2017). Mapping water, oxygen, and pH dynamics in the rhizosphere of young maize roots. J. Plant Nutr. Soil Sci. 180, 336–346. doi: 10.1002/jpln.201600120
Steinkellner, S., Mammerler, R., and Vierheilig, H. (2005). Microconidia germination of the tomato pathogen Fusarium oxysporum in the presence of root exudates. J. Plant Interact. 1, 23–30. doi: 10.1080/17429140500134334
Steinkellner, S., Mammerler, R., and Vierheilig, H. (2009). Root Exudates as Important Factor in the Fusarium – Host Plant Interaction. Mutitrophic Interaction Soil IOBC/WPRS Bulletins. 42, 165–168.
Trinci, A. P. J. (1969). A kinetic study of the growth of Aspergillus nidulans and other fungi. J. Gen. Microbiol. 57, 11–24. doi: 10.1099/00221287-57-1-11
Tschiersch, H., Liebsch, G., Borisjuk, L., Stangelmayer, A., and Rolletschek, H. (2012). An imaging method for oxygen distribution, respiration and photosynthesis at a microscopic level of resolution. New Phytol. 196, 926–936. doi: 10.1111/j.1469-8137.2012.04295.x
Tschiersch, H., Liebsch, G., Stangelmayer, A., Borisjuk, L., and Rolletschek, H. (2011). “Planar oxygen sensors for non invasive imaging in experimental biology,” in Microsensors (Rijeka: InTech), 281–294.
Ulqodry, T. Z., Nose, A., and Zheng, S.-H. (2016). An improved method for the simultaneous determination of photosynthetic O2 evolution and CO2 consumption in Rhizophora mucronata leaves. Photosynthetica 54, 152–157. doi: 10.1007/s11099-015-0166-6
Van der Meeren, P., De Vleeschauwer, D., and Debergh, P. (2001). Determination of oxygen profiles in agar-based gelled in vitro plant tissue culture media. Plant Cell Tissue Organ Cult. 65, 239–245. doi: 10.1023/A:1010698225362
Veillet, F., Gaillard, C., Lemonnier, P., Coutos-Thévenot, P., and La Camera, S. (2017). The molecular dialogue between Arabidopsis thaliana and the necrotrophic fungus Botrytis cinerea leads to major changes in host carbon metabolism. Sci. Rep. 7:17121. doi: 10.1038/s41598-017-17413-y
Vidoz, M. L., Mignolli, F., Aispuru, H. T., and Mroginski, L. A. (2016). Rapid formation of adventitious roots and partial ethylene sensitivity result in faster adaptation to flooding in the aerial roots (aer) mutant of tomato. Sci. Hortic. 201, 130–139. doi: 10.1016/j.scienta.2016.01.032
Keywords: fusarium, tomato, soil-borne pathogen, root respiration, planar optodes, spatial moments
Citation: Rodeghiero M, Rubol S, Bellin A, Turco E, Molinatto G, Gianelle D and Pertot I (2018) High Resolution Assessment of Spatio-Temporal Changes in O2 Concentration in Root-Pathogen Interaction. Front. Microbiol. 9:1491. doi: 10.3389/fmicb.2018.01491
Received: 05 March 2018; Accepted: 15 June 2018;
Published: 05 July 2018.
Edited by:
Philippe C. Baveye, AgroParisTech Institut des Sciences et Industries du Vivant et de L'environnement, FranceReviewed by:
Philippe Constant, Institut National de la Recherche Scientifique (INRS), CanadaKemal Kazan, Commonwealth Scientific and Industrial Research Organisation (CSIRO), Australia
Copyright © 2018 Rodeghiero, Rubol, Bellin, Turco, Molinatto, Gianelle and Pertot. This is an open-access article distributed under the terms of the Creative Commons Attribution License (CC BY). The use, distribution or reproduction in other forums is permitted, provided the original author(s) and the copyright owner(s) are credited and that the original publication in this journal is cited, in accordance with accepted academic practice. No use, distribution or reproduction is permitted which does not comply with these terms.
*Correspondence: Mirco Rodeghiero, bWlyY28ucm9kZWdoaWVyb0BmbWFjaC5pdA==
Simonetta Rubol, cnVib2xAc3RhbmZvcmQuZWR1
 Mirco Rodeghiero
 Simonetta Rubol2*
 Alberto Bellin
 Giulia Molinatto
 Damiano Gianelle
 Ilaria Pertot