 Stanca M. Ciupe
 Christopher J. Miller2
 Jonathan E. Forde
- 1Department of Mathematics, Virginia Tech, Blacksburg, VA, United States
- 2Department of Pathology, Microbiology, and Immunology, School of Veterinary Medicine, Center for Comparative Medicine and California National Primate Research Center, University of California, Davis, Davis, CA, United States
- 3Department of Mathematics and Computer Science, Hobart and Williams Smith Colleges, Geneva, NY, United States
Experimental studies have shown that the size and infectious-stage of viral inoculum influence disease outcomes in rhesus macaques infected with simian immunodeficiency virus. The possible contribution to disease outcome of antibody developed after transmission and/or present in the inoculum in free or bound form is not understood. In this study, we develop a mathematical model of virus-antibody immune complex formation and use it to predict their role in transmission and protection. The model exhibits a bistable switch between clearance and persistence states. We fitted it to temporal virus data and estimated the parameter values for free virus infectivity rate and antibody carrying capacity for which the model transitions between virus clearance and persistence when the initial conditions (in particular the ratio of immune complexes to free virus) vary. We used these results to quantify the minimum virus amount in the inoculum needed to establish persistent infections in the presence and absence of protective antibodies.
Introduction
The humoral immune response is one of the first barriers against infecting pathogens and forms the basis for most vaccines that are currently in use (Plotkin, 2008; Deal and Balazs, 2015). The rapidly mutating human immunodeficiency virus (HIV), however, evades humoral immune responses in most human infections due to difficulties in eliciting neutralizing antibodies that are effective against the enormous diversity of virus strains (Haynes, 2015). In a few cases broadly neutralizing antibodies (bnAbs) are produced, but they appear 2–4 years following infection (Gray et al., 2011; Tomaras et al., 2011), are ineffective against co-circulating virus strains, and have unusual traits such as autoreactivity and high levels of somatic hypermutations (Mascola and Haynes, 2013). Inducing protective antibodies in vivo is challenging (Mascola and Haynes, 2013; Haynes, 2015), with the partially successful RV144 vaccine clinical trial offering a 31.2% decrease in transmission through non-neutralizing antibody dependent cellular toxicity-mediated responses (ADCC) (Rerks-Ngarm et al., 2009; Tomaras et al., 2013; Pollara et al., 2014).
Animal models have proven useful in examining the mechanisms of virus-antibody interactions that lead to protection against HIV infections. Studies using the chimeric simian-human rhesus macaque model (SHIV) have shown that passive transfer of broadly neutralizing monoclonal antibodies (bnMAbs) can induce protection against mucosal challenge (Moldt et al., 2012). The protection is dependent on the ratio between the challenge dose and the concentration of broadly neutralizing antibodies in the serum (Mascola et al., 1999), the breadth and potency of bnMAbs (Walker et al., 2011; Moldt et al., 2012), as well as the timing of antibody infusion (Nishimura et al., 2003). The potential for inducing neutralizing antibodies that correlate with protection in vivo has been shown during simian immunodeficiency virus (SIV) infections of ENV-vaccinated rhesus macaques (Letvin et al., 2011), suggesting that it may be possible to elicit antibody-mediated protection through vaccination. Understanding the properties of antibodies, such as concentration and avidity needed for protection based on known virus count in the inoculum, is important information that can guide vaccine design.
In 2009, Ma et al. used SIV infection in rhesus macaques to examine the connection between infection outcome, the size of the challenge inoculum and the disease stage in the SIV infected animals used as donors (Ma et al., 2009). They found that ~20 viral RNA (vRNA) copies titrated from a plasma pool containing virus collected during the ramp-up-stage of infection in donor animals are needed to successfully infect recipient animals. By contrast, ~1,500 vRNA copies titrated from a plasma pool containing virus collected during the set-point-stage of infection in donor animals are needed to establish infection in recipient animals. This led to the conclusion that the virus infectivity decreases over time due to a combination of virological and immunological factors. In Vaidya et al. (2010) used mathematical models to quantify the decrease in infectivity during the ramp-up and set-point infection and found that the decrease happens during both acute and chronic stages with a sharper decrease during acute infections. They did not, however, examine the mechanisms underlying the decrease.
In this study we investigate whether antiviral factors can explain the change in virus infectivity observed in experiments. Briefly, we hypothesize that donor's ramp-up-stage plasma transferred into the recipient animal contains mostly free virus. By contrast, donor's set-point-stage plasma transferred into the recipient animal contain a large amount of antibody-virus immune complexes in addition to free virus. If such immune complexes can still infect, then their infectivity rate is reduced compared to that of the free virus. To test this hypothesis, we develop a mathematical model of antibody-virus dynamics that assumes interaction between virus, recipient and donor antibody, and the corresponding immune complexes. We fit the model to viral load data from two recipient animals challenged with donor's ramp-up-stage plasma, three challenged with donor's set-point-stage plasma, and one infused with donor's set-point antibody and challenged with donor's ramp-up-stage plasma. The fits give us parameter estimates for long-run antibody concentration, free virus infectivity rates, and the relation between protection and free virus - immune complex ratio in the inoculum.
Methods
Data
We are using published data from the Ma et al. (2009) (all information regarding approvals by IRB can be found in the original study). Briefly, plasma samples from seven SIV infected rhesus macaques were collected during the ramp-up and set-point-stages of infections. Various amounts of vRNA were titrated from the two plasma pools and used for intravenous infection of SIV naive rhesus macaques (see Ma et al., 2009 for additional details). Animals 35036, 33815, and 3297 were challenged with virus from ramp-up-stage plasma and animals 33952, 34846, and 34373 were challenged virus from set-point-stage plasma. Lastly, animals 33681, 32350, 32970, and 36068 were challenged with virus from an aliquot of ramp-up-stage plasma containing heat inactivated set-point-stage plasma. Longitudinal virus load data (vRNA copies per ml) was collected for all recipient animals that became viremic.
Model of Recipient-Virus Interaction
We develop a mathematical model of virus-antibody interaction that investigates the connection between inoculum size and disease outcome. We start with the basic SIV model (Perelson et al., 1996; Bonhoeffer et al., 1997) which considers the interaction between activated uninfected CD4 T cells T, infected CD4 T cells I, and free virus V, as follows
Uninfected cells are produced at rate s, die at per capita rate d, and become infected upon encountering virus at rate β. Infected cells die at per capita rate δ and produce N virions throughout their average lifespan. Free virus is eliminated at per capita rate c.
During challenge with donor's plasma, we assume that donor's antibody AD and donor's virus-antibody immune complexes XD are transferred into the recipient animals. AD decays exponentially at rate dA. We assume that donor's immune complexes XD can still infect target cells at rate β1. Their infectivity rate, however, is smaller than that of free virus, β1 < β. XD unbind to give rise to free virus
where kp and km are binding and unbinding rates. Lastly, XD are cleared faster than free virus. We model this in a density dependent manner, with cAV being the maximum removal rate and M the complexes at which the removal is half-maximal.
We next assume that a de novo antibody response to the SIV infection occurs in recipients. Recipient antibody, AR, binds free virus, V, and forms antibody-virus immune complexes, XR
with the same binding and unbinding rates as the those of the donor antibody. Recipient antibody expands in an antigen dependent manner at rate α. We account for immunological memory by assuming that recipient antibodies persist in an antigen independent manner with maximum proliferation r and carrying capacity K. Recipient immune complexes have the same infectivity rate, β1 < β, and the same removal rate, cAV>c, as the donor's immune complexes.
The model becomes
with initial values T(0) = s/d, I(0) = 0, V(0) = V0>0, AR(0) = A0, XR(0) = 0, AD(0)≥A0 and XD(0)≥0.
Parameter Values and Initial Conditions
We assume that we have T(0) = 106 per ml and I(0) = 0 per ml at the beginning of infection. Uninfected CD4 T cells are produced at rate s = 104 per ml per day (Sachsenberg et al., 1998) and die at rate d = 0.01 per day (Stafford et al., 2000). We use previous estimates for the infected cells death rate, δ = 0.39 per day (Markowitz et al., 2003), virus clearance rate, c = 23 per day (Ramratnam et al., 1999), and virus production by an infected cells, N = 2, 000 per day (Ciupe, 2015). We fix the immune complexes infectivity rate ml per day per virion.
Since all donor and recipient animals were negative for anti-SIV antibodies, we assume the antibodies are below their limit of detection of 3.8 × 10⁸ molecules per ml (0.1 ng/ml1). Without loss of generality, molecules per ml. The recipient immune complexes are absent at the time of infection, XR(0) = 0 molecules per ml. Donor antibodies decay at rate dA = 0.07 per day (Zalevsky et al., 2010). Once infection occurs, recipient antibodies are produced and expand in both virus-dependent and virus-independent manners, at rates α and r, respectively. Since α and r have complementary functions (see Supplementary Material), we can ignore one of them. For simplicity, we set α = 0. Immune complexes dissociate at rate km = 100 per day (Schwesinger et al., 2000; Zhou et al., 2007; Tabei et al., 2012). The IgG affinity KA = kp/km in a humoral response frequently starts at 105 M−1 (Gopalakrishnan and Karush, 1975). For SIV, each virion can have ten to hundreds of potential antibody binding sites and affinity maturation may occur. Taking both effects into account can increase the functional affinity KA to 108 M−1. Therefore, we consider a binding rate /day = 1.6 × 10⁻¹¹ ml per molecule per day, higher than in Tabei et al. (2012), Ciupe (2015) and a carrying capacity K = 5 × 10¹³ molecules per ml. We assume that a maximum of immune complexes are removed per day, and that the removal rate is half-maximal for M = 500 immune complexes.
When an animal is challenged with SIV, the inoculum plasma may contain both free virus or donor's immune complexes. As in Vaidya et al. (2010), we assume that the initial virus distributes throughout the entire plasma volume of a 7 kg macaque, approximately 300 ml. Therefore, our initial conditions are XD(0)+V(0) = D(0)/300 copies per ml, where D(0) is the inoculum vRNA (Ma et al., 2009), and V(0) and XD(0) vary.
We assume that the free virus infectivity rate β(>β1) ml per day per virion, antibody carrying capacity K molecules per ml, and antibody independent expansion rate r per day are unknown and we estimate them through data fitting. All fixed parameters and initial conditions are presented in Table 1.
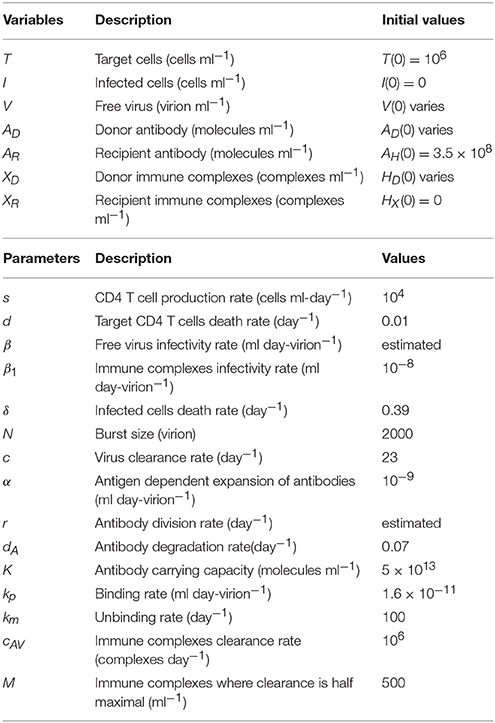
Table 1. Parameter values and initial conditions used in model (6).
Data Fitting
We estimate parameters β and r by simultaneously fitting VT(t) = V(t)+XD(t)+XR(t) given by model (6) with known total virus initial conditions to both chronic and no-infection virus data. Two monkeys (35036 and 33815) were protected when challenged with 2 ramp-up vRNA and chronically infected when challenged with 20 ramp-up vRNA. We use these to get initial concentrations of VT(0) = 2/300 and VT(0) = 20/300 copies per ml, respectively. When a monkey is protected, no vRNA data is collected. We create an artificial data set VTiterlow = {2/300, 1/300} copies per ml at times τj∈{0, 30} days in each animal that did not get infected. When a monkey gets infected, total virus concentrations VTiterhigh(ti) above the limit of detection were collected at ti∈{2, 5, 7, 9, 12, 14, 21, 28} days post infection for each subject.
Similarly, three monkeys (33952, 34846, and 34373) were protected when challenged with 1.5, 15, and 150 set-point vRNA and chronically infected when challenged with 1500 set-point vRNA. We therefore use initial concentrations VT(0) = 150/300 and VT(0) = 1, 500/300 copies per ml for VT(0) in model (6). When a monkey is protected, no vRNA data is collected. We create an artificial data set VTiterlow = {150/300, 1/300} copies per ml at times τj∈{0, 30} days in each animal that did not get infected. When a monkey gets infected, total virus concentrations VTiterhigh(ti) above the limit of detection were collected at ti∈{5, 7, 9, 12, 14, 21, 28} days post infection for subjects 33952 and 34373, and days post infection for subject 34846.
We use the “fminsearch” algorithm in MATLAB R2016b [The MathWorks Inc., Natick, MA] to minimize the functional
where n is the number of data points. Finally, VT(ti) and VT(τj) are the theoretical predictions for the total viral concentration as given by model (6) at times ti and τj.
Results
Antibody-Dependent Basic Reproduction Number
The model exhibits bistable switch between a clearance state S0 = (s/d, 0, 0, K, 0, 0, 0) and a positive chronic state S1 = (T1, I1, V1, AR1, XR1, 0, 0). We can show analytically that steady state S0 is locally asymptotically stable when (see Supplementary Material), where
Inequality (8) shows that even if viremia occurs in the absence of antibodies, , viral clearance can be reached when the combined contribution of the protective and/or infused antibodies make . We name , the antibody-dependent basic reproduction number, which represents the number of virion produced in average by an infected cell in an otherwise infection-free population throughout its lifetime when antibodies are present.
is a necessary but not sufficient condition for virus clearance. Indeed, numerical results show that for , the chronic state S1 is asymptotically stable as well. That means that given and appropriate initial conditions the chronic steady state S1 can be reached. We numerically investigate the relationship between the model's initial conditions, animal data and the model's long-term behavior.
Infection With Ramp-Up-Stage Virus
Animals 35036 and 33815 were challenged with 20 vRNA copies that were titrated from a plasma pool containing virus collected from seven monkeys during the ramp-up-stage of infection (defined as approximately 7 days after challenge). Following challenge they became viremic. In contrast, animal 32970, who was challenged 2 vRNA copies from the same plasma pool, did not develop a persistent infection (Ma et al., 2009). Since immune complexes are detected around 21 days post infection (Tomaras et al., 2008; Liu et al., 2011), we assume that the ramp-up inoculum contains only free virus. Therefore, our initial concentrations are XD(0) = 0 and V(0) = 20/300 copies per ml in animals 35036 and 33815; V(0) = 2/300 copies per ml in animal 32970. The best estimates for β and r were obtained by minimizing J given by (7) for the above initial conditions (see Table 2).
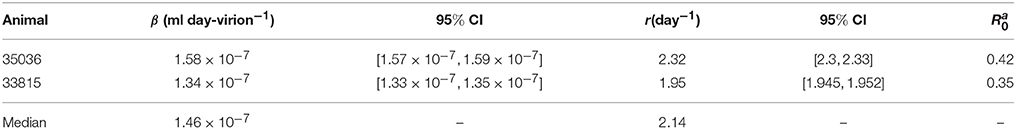
Table 2. Parameter estimates and 95% confidence intervals from minimizing the likelihood function J given by (7) for the ramp-up data.
Our model predicts a bistable switch in the virus dynamics between persistence and clearance when the free virus initial concentration changes from 20/300 to 2/300 copies per ml (see Figure 1, left panels). For median estimates among the two animals, we predict that for V(0) = 20/300 copies per ml, the total virus load increases to a maximum of 2 × 10⁸ copies per ml, before decreasing to equilibrium levels of 9 × 10⁶ copies per ml, three months after infection. By contrast, when V(0) = 2/300 copies per ml, the total virus concentration grows to 850 copies per ml four days following infection, before it decays below the limit of detection of 50 vRNA copies per ml.
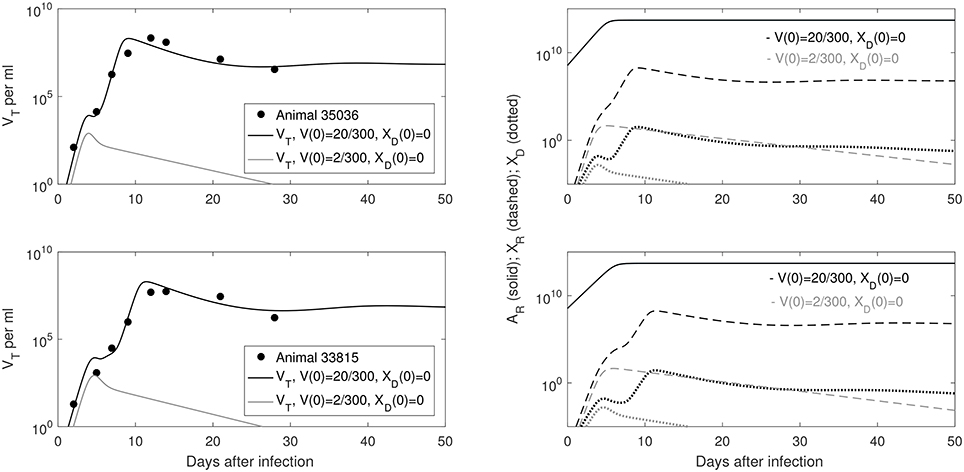
Figure 1. (Left) Basin of attraction for VT given by (6) vs. data; (Right) Free antibody (solid lines); recipient immune complexes (dashed lines) and donor immune complexes (dotted lines) for V(0) = 20/300 vRNA copies per ml, XD(0) = 0 vRNA copies per ml (black) and V(0) = 2/300 vRNA copies per ml, XD(0) = 0 vRNA copies per ml (gray). Note that antibody populations are identical regardless of initial conditions (solid black and gray lines overlap).
The antibody populations do not depend of the initial viral inoculum (see Figure 1, right panels). They reach maximum carrying capacity 5 × 10¹³ molecules per ml (0.0125 mg per ml) seven days after infection. When V(0) = 20/300 vRNA copies per ml, free virions bind recipient antibodies to form recipient immune complexes which, at equilibrium, exceed the free virus concentration 7.8 times. When V(0) = 2/300 copies per ml, immune complexes are formed, but they decay below limit of detection 7 days after inoculation. Model (6) assumed that B-cell priming by the virus is followed by an antigen-independent antibody expansion with a maximum per capita growth rate r. We estimated a median per capita growth rate r = 2.14 per day, corresponding to the doubling time of antibody population of 7.8 h.
We are interested in determining the largest initial virus inoculum that allows for viral clearance under the ramp-up-stage modeling assumptions. For the median r parameter in Table 2 we derived a bifurcation diagram showing the asymptotic free virus concentrations three months following infection when the infectivity rate β is varied (see Figure S1). The system is displaying hysteresis. For the median infectivity rate β in Table 2, we plotted the basins of attractions for the total virus concentration VT when the inoculum concentration varies (see Figure 2, left panel). We predict that VT is cleared for V(0) < 17.5/300 copies per ml and persists otherwise.
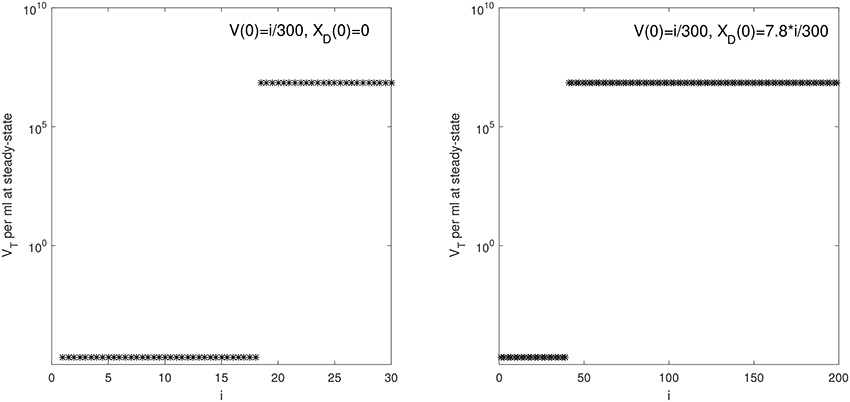
Figure 2. VT given by (6) at steady state vs. i for: (Left) V(0) = i/300 vRNA copies per ml, XD(0) = 0 vRNA copies per ml and median parameters in Table 2; (Right) V(0) = i/300 vRNA copies per ml, XD(0) = 7.8 × i/300 vRNA copies per ml and median parameters in Table 3.
Infection With Set-Point-Stage Virus
Animals 33952, 34846, and 34373, were challenged with vRNA copies titrated from a plasma pool containing virus collected during the set-point-stage of infection (defined as the time several months after the peak when plasma vRNA levels were relatively stable, and antibody responses were well developed) of the seven donor monkeys (Ma et al., 2009). The animals were protected when challenged with set-point-stage plasma titrated to contain 1.5, 15, and 150 vRNA and became viremic when challenged with set-point-stage plasma containing 1500 vRNA. We aim to determine the parameter sets for which model (6) predicts a switch between viral persistence for V(0)+XD(0) = 1500/300 copies per ml and clearance for V(0)+XD(0) = 150/300 copies per ml (and consequently for 1.5/300 and 15/300 vRNA copies per ml).
As before, we assume that the donor's antibody concentration is below the limit of detection. However, there are 7.8 times more immune complexes than free virus in the inoculum plasma, XD(0)/V(0) = 7.8, as predicted by the model (6) fitted to ramp-up data and run to equilibrium values. We minimize functional J given by (7) with XD(0)/V(0) = 7.8. The estimated parameters are presented in Table 3.
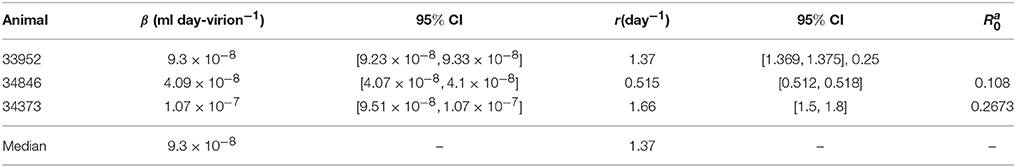
Table 3. Parameter estimates and 95% confidence intervals from minimizing the likelihood function J given by (7) for the set-point data.
We predict a bistable switch between persistent and cleared virus populations based on initial conditions (see Figure 3, left panels). The median set-point virus infectivity rate is 1.5 times smaller than the median infectivity rate of the animals infected with the ramp-up-stage plasma. Moreover, the median set-point antibody antigen-dependent growth rate, r is 1.55 times smaller, corresponding to a median antibody population's doubling time of 12 h. We decided to compare median values, rather than averages, since the set-point plasma results are biased by the estimates in animal 34846 whose virus growth is delayed.
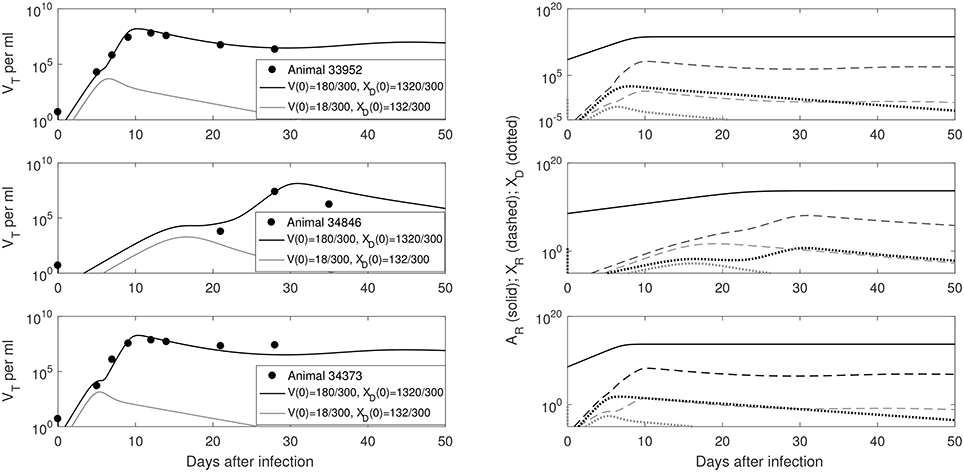
Figure 3. (Left) VT given by (6) vs. data; (Right) Free antibody (solid lines), recipient immune complexes (dashed lines) and donor immune complexes (dotted lines): for V(0)+XD(0) = 1500/300 vRNA copies per ml, XD(0)/V(0) = 7.8 (black) and V(0)+XD(0) = 150/300 vRNA copies per ml, XD(0)/V(0) = 7.8 (gray). Note that antibody populations are identical regardless of initial conditions (solid black and gray lines overlap) but the immune complexes differ.
We next quantified the largest initial virus inoculum that allows for viral clearance when the initial inoculum is comprised of 7.8 times more immune complexes than free virion. We set all parameters at the median values in Table 3 and plotted the basins of attractions for the total virus concentration three months following infection as the inoculum concentration varies (see Figure 2, right panel). We predict that VT is cleared when VT(0) ≤ 42/300 vRNA copies per ml, XD(0)/V(0) = 7.8 and persists otherwise. We also investigated the relation between viral clearance, VT(0) and the ratio XD(0)/V(0). We note that when the ratio between the immune complexes and free virus in the initial plasma is low, even a small inoculum size can create virus persistence. Conversely, when the immune complexes dominate the initial plasma, a large initial virus inoculum is needed to establish an infection (see Figure 4).
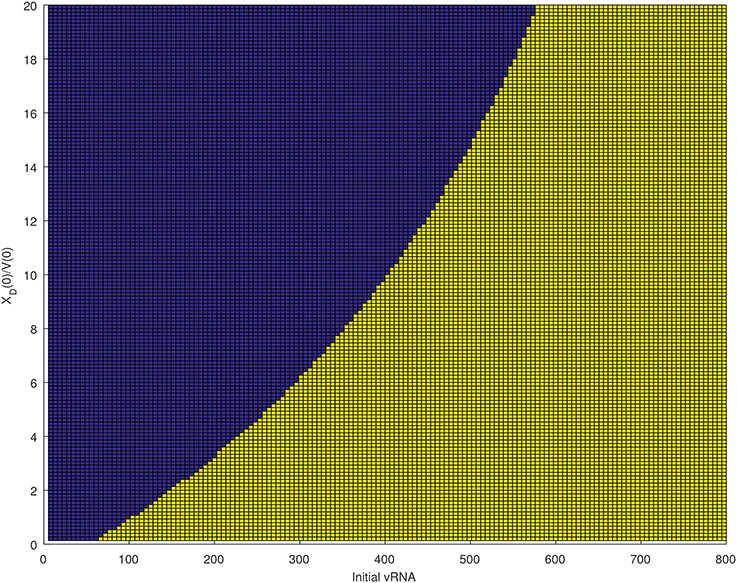
Figure 4. Asymptotic behavior for the VT solutions of (6) for median parameters in Table 3 as the initial vRNA and XD(0)/V(0) are varied. The blue region (left of the curve) corresponds to extinction asymptotic concentrations VT = 0 copies per ml. The yellow region (right of the curve) corresponds to persistence asymptotic concentrations copies per ml.
Infection With a Mix of Heat Inactivated Set-Point-Stage Plasma Mixed With Ramp-Up-Stage Virions
To determine whether antibodies play a role in reducing virus infectivity, Ma et al. designed an aliquot of ramp-up stage plasma containing 20 vRNA/0.5 ml mixed with 0.5 ml of heat inactivated set-point-stage plasma (Ma et al., 2009). The set-point-stage plasma contained antibodies capable of in vitro neutralization. They used the aliquot on four animals: 33681, 32350, 32970, and 36068, with the first three animals being protected and the last animal developing persistent infection.
To address this experimental setting we assume the model follows the dynamics given by median parameter values in the ramp-up case with V(0) = 20/300 copies per ml and XD(0) = 0 copies per ml (see Tables 1, 2). However, we vary AD(0) to account for donor's antibody being present in the inoculum. We find that a minimum of donor antibody molecules per ml (1.8 × 10⁻⁶ mg per ml) are needed for clearance. This value is above the antibody's limit of detection, but more than three orders of magnitude below the antibody's equilibrium values. This suggests that even low antibody levels may help protect the host.
We want to determine the additional recipient-virus dynamics that lead to infection in animal 36068. We fit VT given by model (6) with V(0) = 20/300 vRNA copies per ml, XD(0) = 0 vRNA copies per ml and molecules per ml to animal 36068's virus data and found that virus persistence is due to the recipient antibody dynamics (see Figure 5, right panel). Indeed, for a good fit we need to decrease the recipient's antibody carrying capacity to K = 5 × 10¹² molecules per ml, 10 times lower than the previous carrying capacity in ramp-up infected animals. The antigen-independent expansion rate r = 1.62 per day is 1.3 times smaller than the median per capita antibody expansion rate in the ramp-up infected animals, but similar to that of set-point infected animals (see Table 4). This implies that animal's 36068 immune response is not strong enough to prevent persistent viremia. Moreover, for these antibody parameters bistability does not occur (), and the virus reaches a positive steady state level regardless of the size and structure of the initial inoculum.
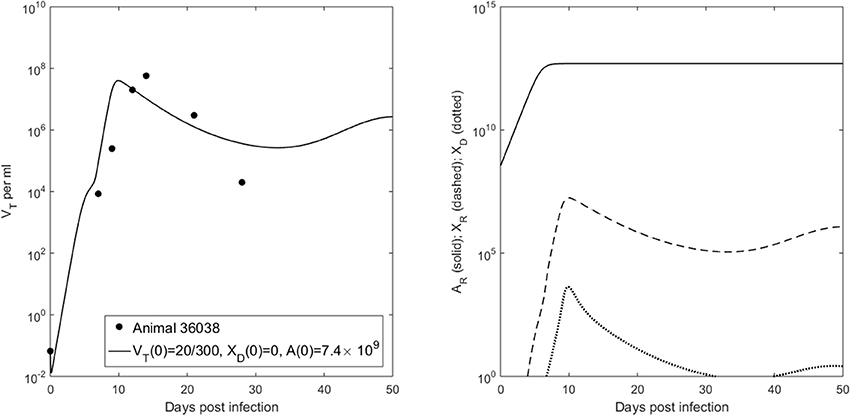
Figure 5. (Left) VT given by (6) vs. data; (Right) Free antibody (solid lines), recipient immune complexes (dashed lines) and donor immune complexes (dotted lines) for V(0) = 20/300 vRNA copies per ml, XD(0) = 0 vRNA copies per ml and molecules per ml.

Table 4. Parameter estimates and 95% confidence intervals from fitting VT to animal data for V(0) = 20/300 vRNA copies per ml, XD(0) = 0 vRNA copies per ml and molecules per ml.
Can Random Infection and Clearance Events Explain the Data?
To address whether the switch in virus dynamics is due to random effects, we use the stochastic model of virus infection and clearance developed in Pearson et al. (2011). Under the parametrization of model (1), the burst stochastic model in Pearson et al. (2011), is given by
Let n = (nV, nI) be the number of viruses and infected cells starting the SIV infection,
be the probabilities of extinction given an infection that is started by one virus or one infected cell. Then the probability of virus persistence given nV virion and nI infected cells, , can be computed analytically. Namely
where is the positive solution of the equation
Note that the probability of persistence ϵ is dependent on the burst size N and on the probability that a virus infects a cell, (see Pearson et al., 2011 for a full derivation). For fixed N = 300 virions per infected cell, T = 106 cells per ml, and c = 23 per day, we determine the infectivity values β that can explain the relationship between extinction/persistence and the inoculum size in ramp-up/set-point vRNA cases when free virus establishes the infection, i.e., nI = 0 (see Figure 6).
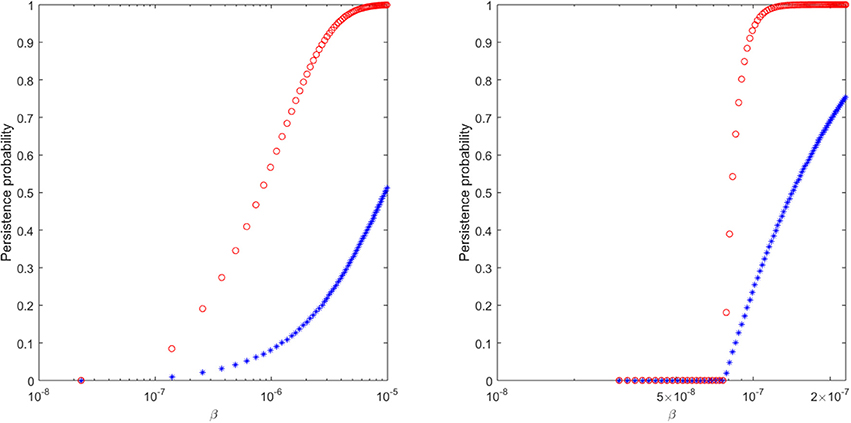
Figure 6. The probability of virus persistence for (Left) ramp-up-stage and (Right) set-point-stage vRNA data under the assumption of the burst stochastic model (9). The red circles account for the probability of persistence for high inocula, while the blue stars account for the probability of persistence for low inocula.
We find that a 99% probability of persistence for a ramp-up-stage inoculum of 20 vRNA occurs when the infectivity rate β>8 × 10⁻⁶, while the same persistence probability for a set-point inoculum of 1500 vRNA occurs for β>1.15 × 10⁻⁷ (see Figure 6, red circles). For these choices of β, the probability of extinction for the lower 2 ramp-up stage and 150 set-point-stage vRNA inoculum are 64% and 65%, respectively (see Figure 6, blue stars). In order for the proposed stochastic process to explain the experimental observations, there must be a 70-fold reduction in the infectivity rate β between ramp-up and set-point virus (8.75 times higher than estimated in Vaidya et al., 2010). Moreover, the extinction probability for the lower inocula is lower than ideal. While the stochastic explanation is still conceivable, we conclude that the presence of immune complexes in the inoculum is a compelling alternative explanation for the experimental outcomes.
Discussion
We developed a mathematical model of antibody responses to SIV infection that shows a bistable switch between persistent infection and virus clearance based on the composition of the plasma used for intravenous inoculation.
We made several interesting observations. When the plasma does not contain any free donor antibody, our model predicts that the difference between infection with high inoculum containing set-point-stage virus and infection with low inoculum containing ramp-up-stage virus can be explained by the presence of immune complexes in the inoculum that exceed free virus by a factor of 7.8. Such immune complexes can still infect target CD4 T cells, but have a 10-fold decrease in infectivity. Under these assumptions, the model fits the data when the infectivity of free virus is constant over time. There is a 1.5-fold decrease in the set-point-stage free virus infectivity compared to ramp-up-stage free virus infectivity, as reported in earlier studies (Ma et al., 2009; Vaidya et al., 2010). Such decrease may be due to temporal accumulation of non-infectious particles and to the emergence of other immune factors such as CD8 T cell responses.
When the inoculum plasma contains neutralizing antibody, our model predicts that infection is blocked even when free virus infectivity rates are as high as in the ramp-up stage. In order for virus to invade, antibody responses need to be 10 times lower at equilibrium. Moreover, their growth needs 1.3-fold reduction.
We assumed that the recipient and donor antibody have high avidity of 108 M−1 (as with infusion of broadly neutralizing antibody), a high antibody carrying capacity K = 5 × 10¹³ molecules per ml and estimated the recipient antibody expansion rate needed for protection. With our model, however, it is difficult to separate out the effects of changing the avidity rate KA = kp/km and changing the antibody carrying capacity K. For example we can preserve the results by decreasing avidity and increasing the carrying capacity. Similarly, the antibody antigen-dependent and antigen-independent growth factors, r and α, have synergistic effects. If we decrease r we can maintain the overall virus-antibody dynamics by increasing α (as detailed in the sensitivity Figure S2).
We have also assumed that the immune complexes infect at rate β1 = 0.1 × β ml per day per virion. This was an arbitrary choice, and the estimated infectivity rate β may change when the β to β1 ratio is varied.
An important variable in our study is the basic reproduction number , which has to remain below one for viral clearance. However, even when , a persistent infection can still occur when either inoculum is composed of mostly free virion, free virus infectivity rate is high, and/or equilibrium antibody levels are low. The presence of bistable switch allows us to alter the infection outcome in the model by changing the initial antibody levels. Knowing the minimum antibody concentration needed to prevent viremia under fixed parameter setting is important for guiding vaccine design.
To address whether stochastic effects alone can explain the data, we computed the probability of virus persistence under the assumption of a burst stochastic model developed in Pearson et al. (2011). We find that a 70-fold decrease in virus infectivity rate β is needed between the ramp-up and set-point-inoculum in order to obtain a 99% probability of persistence for a ramp-up inoculum of 20 vRNA and a set-point inoculum of 1500 vRNA occurs. This is higher than the 8-fold decrease reported in Vaidya et al. (2010). Furthermore, the extinction probabilities for the lower ramp-up inoculum of 2 vRNA and a set-point inoculum of 150 vRNA, 64% and 65%, are lower than ideal. While the stochastic explanation is still conceivable, we conclude that the presence of immune complexes in the inoculum is a possible alternative explanation for the experimental outcome.
Our study uses data from an intravenous inoculation experiment. It is not clear if a similar relationship exist with mucosal virus inoculation or with non-neutralizing antibody responses. In fact, some antibody responses were associated with enhanced risk of heterosexual HIV acquisition in RV144. Further, immune-complexed virus may be preferentially transported across epithelial surfaces by the neonatal Fc receptor (Haynes, 2012; Gorlani and Forthal, 2013; Gupta et al., 2013, 2015). Our analysis focused only on the role of antibody in infectivity after any epithelial barriers had been crossed.
In summary, we have developed a model of virus-host dynamics during SIV infection that gives insight into the relation between the structure of infecting inoculum, virus infectivity and disease outcomes. In particular, we showed that a large set-point-stage inoculum is needed for persistent infection due to the excess of immune complexes over the free virus. Moreover, we have estimated the antibody levels and the free virus infectivity and their relation to the disease outcome when the inoculum size and structure are well understood. Such predictions are important for vaccine design.
Author Summary
We investigate whether antiviral factors can explain the change in virus infectivity during acute and chronic stages of simian immunodeficiency virus infections. Our hypothesis is that acute plasma contains mostly free virus while chronic plasma contains antibody-virus immune complexes in addition to free virus. If such immune complexes can still infect, then their infectivity rate is reduced compared to that of the free virus. We test this hypothesis by developing a mathematical model of antibody-virus dynamics that assumes interactions between virus, recipient and donor antibodies, and the corresponding immune complexes. We fit the model to published viral load data from recipient rhesus macaques challenged intravenously with different virus loads collected during donor's acute and chronic stages of SIV infection. The fits give us parameter estimates for long-run antibody concentration, free virus infectivity rate, and the relation between protection and the free virus—immune complexes ratio in the inoculum.
Author Contributions
SC and JF designed the study and performed numerical experiments. CM provided the data. SC, CM, and JF wrote the paper.
Conflict of Interest Statement
The authors declare that the research was conducted in the absence of any commercial or financial relationships that could be construed as a potential conflict of interest.
Acknowledgments
SC acknowledges support from NSF grants DMS-1214582, DMS-1813011, Simons Foundation grant 427115 and VT's OASF. CM was supported by Public Health Services grants U51RR00169, from the National Center for Research Resources; and P01 AI066314 from the National Institute of Allergy and Infectious Diseases. We are grateful to Dr Honghu Li for valuable discussions.
Supplementary Material
The Supplementary Material for this article can be found online at: https://www.frontiersin.org/articles/10.3389/fmicb.2018.01216/full#supplementary-material
Footnotes
1. ^ IgG Human ELISA Kit ab100547. http://www.abcam.com/IgG-Human-ELISA-Kit-ab100547.html.
References
Bonhoeffer, S., May, R., Shaw, G., and Nowak, M. (1997). Virus dynamics and drug therapy. Proc. Natl. Acad. Sci. U.S.A. 94, 6971–6976. doi: 10.1073/pnas.94.13.6971
Ciupe, S. (2015). Mathematical model of multivalent virus-antibody complex formation in humans following acute and chronic HIV infections. J. Math. Biol. 71, 513–532. doi: 10.1007/s00285-014-0826-3
Deal, C., and Balazs, A. (2015). Engineering humoral immunity as prophylaxis or therapy. Curr. Opin. Immunol. 35, 113–122. doi: 10.1016/j.coi.2015.06.014
Gopalakrishnan, P., and Karush, F. (1975). Antibody affinity. VIII. measurement of affinity of anti-lactose antibody by fluorescence quenching with a DNP-containing ligand. J. Immunol. 114, 1359–1362.
Gorlani, A., and Forthal, D. (2013). Antibody-dependent enhancement and the risk of HIV infection. Curr. HIV Res. 11, 421–426. doi: 10.2174/1570162X113116660062
Gray, E., Madiga, M., Hermanus, T., Moore, P., Wibmer, C., Tumba, N., et al. (2011). The neutralization breadth of HIV-1 develops incrementally over four years and is associated with CD4+ T cell decline and high viral load during acute infection. J. Virol. 85, 4828–4840. doi: 10.1128/JVI.00198-11
Gupta, S., Gach, J., Becerra, J., Phan, T., Pudney, J., Moldoveanu, Z., et al. (2013). The Neonatal Fc receptor (FcRn) enhances human immunodeficiency virus type 1 (HIV-1) trancytosis across epithelial cells. PLoS Pathog. 9:e1003776. doi: 10.1371/journal.ppat.1003776
Gupta, S., Pegu, P., Venzon, D., Gach, J., Ma, Z., Landucci, G., et al. (2015). Enhanced in vitro transcytosis of simian immunodeficiency virus mediated by vaccine-induced antibody predicts transmitted/founder strain number after rectal challenge. J. Infect Dis. 211, 45–52. doi: 10.1093/infdis/jiu300
Haynes, B. (2012). Immune-correlates analysis of an HIV-1 vaccine efficacy trial. N. Engl. J. Med. 366, 1275–1286. doi: 10.1056/NEJMoa1113425
Haynes, B. (2015). New approaches to HIV vaccine development. Curr. Opin. Immunol. 35, 39–47. doi: 10.1016/j.coi.2015.05.007
Letvin, N., Rao, S., Montefiori, D., Seaman, M., Sun, Y., Lim, S.-Y., et al. (2011). Immune and genetic correlates of vaccine protection against mucosal infection by SIV in monkeys. Sci. Transl. Med. 3:81ra36. doi: 10.1126/scitranslmed.3002351
Liu, P., Overman, R., Yates, N., Alam, S., Vandergrift, N., Chen, Y., et al. (2011). Dynamic antibody specificities and virion concentrations in circulating immune complexes in acute to chronic HIV-1 infection. J. Virol. 85, 11196–11207. doi: 10.1128/JVI.05601-11
Ma, Z., Stone, M., Piatak, M., Schweighardt, B., Haigwood, N., Montefiori, D., et al. (2009). High specific infectivity of plasma virus from the pre-ramp-up and ramp-up stages of acute simian immunodeficiency virus infection. J. Virol. 83, 3288–3297. doi: 10.1128/JVI.02423-08
Markowitz, M., Louie, M., Hurley, A., Sun, E., Di Mascio, M., Perelson, A., et al. (2003). A novel antiviral intervention results in more accurate assessment of human immunodeficiency virus type 1 replication dynamics and T-cell decay in vivo. J. Virol. 77, 5037–5038. doi: 10.1128/JVI.77.8.5037-5038.2003
Mascola, J., and Haynes, B. (2013). HIV-1 neutralizing antibodies: understanding nature's pathways. Immunol. Rev. 254, 225–244. doi: 10.1111/imr.12075
Mascola, J., Lewis, M., Stiegler, G., Harris, D., VanCott, T., Hayes, D., et al. (1999). Protection of macaques against pathogenic simian/human immunodeficiency virus 89.6PD by passive transfer of neutralizing antibodies. J. Virol. 73, 4009–4018.
Moldt, B., Rakasz, E., Schultz, N., Chan-Hui, P.-Y., Swiderek, K., Weisgrau, K., et al. (2012). Highly potent HIV-specific antibody neutralization in vitro translates into effective protection against mucosal SHIV challenge in vivo. Proc. Natl. Acad. Sci. U.S.A. 109, 18921–18925. doi: 10.1073/pnas.1214785109
Nishimura, Y., Igarashi, T., Haigwood, N., Sadjadpour, R., Donau, O., Buckler, C., et al. (2003). Transfer of neutralizing IgG to macaques 6 h but not 24 h after SHIV infection confers sterilizing protection: Implications for HIV-1 vaccine development. Proc. Natl. Acad. Sci. U.S.A. 100, 15131–15136. doi: 10.1073/pnas.2436476100
Pearson, J., Krapivsky, P., and Perelson, A. (2011). Stochastic theory of early viral infection: continuous versus burst production of virions. PLoS Comput. Biol. 7, 1–17. doi: 10.1371/journal.pcbi.1001058
Perelson, A., Neumann, A., Markowitz, M., Leonard, J., and Ho, D. (1996). HIV-1 dynamics in vivo: Virion clearance rate, infected cell life-span, and viral generation time. Science 271, 1582–1586. doi: 10.1126/science.271.5255.1582
Plotkin, S. (2008). Vaccines: correlates of vaccine-induced immunity. Clin. Infect. Dis. 47, 401–409. doi: 10.1086/589862
Pollara, J., Bonsignori, M., Moody, M., Liu, P., Alam, S., Hwang, K.-K., et al. (2014). HIV-1 vaccine-induced C1 and V2 env-specific antibodies synergize for increased antiviral activities. J. Virol. 88, 7715–7726. doi: 10.1128/JVI.00156-14
Ramratnam, B., Bonhoeffer, S., Binley, J., Hurley, A., Zhang, L., Mittler, J., et al. (1999). Rapid production and clearance of HIV-1 and hepatitis C virus assessed by large volume plasma apheresis. Lancet 354, 1782–1785. doi: 10.1016/S0140-6736(99)02035-8
Rerks-Ngarm, S., Pitisuttithum, P., Nitayaphan, S., Kaewkungwal, J., Chiu, J., Paris, R., et al. (2009). Vaccination with ALVAC and AIDSVAX to prevent HIV-1 infection in Thailand. New Eng. J. Med. 361, 2209–2220. doi: 10.1056/NEJMoa0908492
Sachsenberg, N., Perelson, A., Yerly, S., Schockmel, G., Leduc, D., Hirschel, B., and Perrin, L. (1998). Turnover of CD4 and CD8 T lymphocytes in HIV-1 infection as measured by Ki-67 antigen. J. Exp. Med. 187, 1295–1303. doi: 10.1084/jem.187.8.1295
Schwesinger, F., Ros, R., Strunz, T., Anselmetti, D., Guntherodt, H.-J., Honegger, A., et al. (2000). Unbinding forces of single antibody-antigen complexes correlate with their thermal dissociation rates. Proc. Natl. Acad. Sci. U.S.A. 97, 9972–9977. doi: 10.1073/pnas.97.18.9972
Stafford, M., Corey, L., Cap, Y., Daar, E., Ho, D., and Perelson, A. (2000). Modeling plasma virus concentration during primary HIV infection. J. Theor. Biol. 203, 285–301. doi: 10.1006/jtbi.2000.1076
Tabei, S., Li, Y., Weigert, M., and Dinner, A. (2012). Model for competition from self during passive immunization, with application to broadly neutralizing antibodies for HIV. Vaccine 30, 607–613. doi: 10.1016/j.vaccine.2011.11.048
Tomaras, G., Binley, J., Gray, E., Crooks, E., Osawa, K., Moore, P., et al. (2011). Polyclonal B cell responses to conserved neutralization epitopes in a subset of HIV-1-infected individuals. J. Virol. 85, 11502–11519. doi: 10.1128/JVI.05363-11
Tomaras, G., Ferrari, G., Shen, X., Alam, S., Liao, H.-X., Pollara, J., et al. (2013). Vaccine-induced plasma IgA specific for the C1 region of the HIV-1 envelope blocks binding and effector function of IgG. Proc. Natl. Acad. Sci. U.S.A. 110, 9019–9024. doi: 10.1073/pnas.1301456110
Tomaras, G., Yates, N., Liu, P., Qin, L., Fouda, G., Chavez, L., et al. (2008). Initial B-cell responses to transmitted human immunodeficiency virus type 1: virion-binding immunoglobulin IgM and IgG antibodies followed by plasma anti-gp41 antibodies with ineffective control of initial viremia. J. Virol. 82, 12449–12463. doi: 10.1128/JVI.01708-08
Vaidya, N., Ribeiro, R., Miller, C., and Perelson, A. (2010). Viral dynamics during primary simian immunodeficiency virus infection: effect of time-dependent virus infectivity. J. Virol. 84, 4302–4310. doi: 10.1128/JVI.02284-09
Walker, L., Huber, M., Doores, K., Falkowska, E., Pejchal, R., Julien, J.-P., et al. (2011). Broad neutralization coverage of HIV by multiple highly potent antibodies. Nature 477, 466–470. doi: 10.1038/nature10373
Zalevsky, J., Chamberlain, A., Horton, H., Karki, S., Leung, I., Sproule, T., et al. (2010). Enhanced antibody half-life improves in vivo activity. Nat. Biotechnol. 28, 157–159. doi: 10.1038/nbt.1601
Keywords: SIV, immune complexes, mathematical model, bistable dynamics, stochastic model
Citation: Ciupe SM, Miller CJ and Forde JE (2018) A Bistable Switch in Virus Dynamics Can Explain the Differences in Disease Outcome Following SIV Infections in Rhesus Macaques. Front. Microbiol. 9:1216. doi: 10.3389/fmicb.2018.01216
Received: 08 January 2018; Accepted: 18 May 2018;
Published: 06 June 2018.
Edited by:
Ruy Ribeiro, Los Alamos National Laboratory (DOE), United StatesReviewed by:
Naveen K. Vaidya, San Diego State University, United StatesScott McKinley, Tulane University, United States
Copyright © 2018 Ciupe, Miller and Forde. This is an open-access article distributed under the terms of the Creative Commons Attribution License (CC BY). The use, distribution or reproduction in other forums is permitted, provided the original author(s) and the copyright owner are credited and that the original publication in this journal is cited, in accordance with accepted academic practice. No use, distribution or reproduction is permitted which does not comply with these terms.
*Correspondence: Stanca M. Ciupe, c3RhbmNhJiN4MDAwNDA7dnQuZWR1