 Mónica Fuensanta
 José Miguel Martín-Martínez
- Adhesion and Adhesives Laboratory, Department Inorganic Chemistry, University of Alicante, Alicante, Spain
New thermoplastic poly(ether-urethane) (TPUs) pressure-sensitive adhesives (PSAs) have been synthesized with the prepolymer method by reacting methylene diisocyanate, different blends of polyether diols—poly(propyleneglycol) (PPG) and poly(tetramethylene ether glycol) (PTMEG)—and 1,4-butanediol chain extender; different NCO/OH ratios have been used. The properties of the TPU PSAs depended on both the NCO/OH ratio and the PTMEG content in the blend. The addition of PTMEG polyol produced semicrystalline regions in the soft segments of the TPUs and inhibited the mobility of the polymeric chains; this led to improved cohesion of the TPU PSAs; however, similar degrees of phase separation were obtained in all TPUs synthesized with different PTMEG contents. The increase of the PTMEG content in the polyols blend improved both the cohesion and the adhesion but decreased the tack of the TPU PSAs. The optimal balance between the adhesion and cohesion properties was found in the TPU PSA synthesized with 50 wt% PPG + 50 wt% PTMEG and an NCO/OH ratio of 1.20.
Introduction
Pressure-sensitive adhesives (PSAs) are able to bond different substrates by applying light pressure for a short time, and they must be removed without leaving any residue. Therefore, the viscoelastic properties of the PSAs determined their performance; that is, the viscous component must be balanced for allowing adequate wettability and bonding, and the elastic component must be sufficient for allowing clean debonding from the substrate surface (Feldstein and Siegel, 2012). Pressure-sensitive adhesives are used as labels, tapes, protective films, and so on, and they are common in medical products (patches, surgical bandages, biomedical electrodes, medical plasters, etc.), in which good biocompatibility with human skin, excellent reversible adhesion, and permeability to water and air are important properties (Satas and Satas, 1989).
The main properties of the PSAs related to their viscoelastic properties are the tack, shear, and peel adhesion. The tack is the initial immediate bond of a PSA with a substrate upon applying light pressure. The shear adhesion is the resistance of the PSA to flow under creep and is essential to ensure an adequate easy debonding from the substrate without leaving adhesive residues; that is, it is related to the cohesion of the PSA. The force required to separate a PSA from a substrate surface is the peel adhesion. In general, the PSA for medical applications requires a careful reversible application to the clean skin surface, so medium–low tack is necessary.
The PSAs for medical applications are made of natural and synthetic rubbers, polyisobutylene (PIB), acrylates, or silicones (Czech et al., 2011). Because of allergic issues, the acrylic and silicone PSAs were replaced by PIBs, but PIB PSAs oxidized easily and showed limited permeability to water and air (Higgins et al., 1989). Polyurethane-based PSAs are scarcely used for medical devices but polyurethane PSAs intended for transdermal drug delivery have been developed (Chen et al., 2009), and more recently, novel solvent-free poly(ether-urethane)-silicone cross-linked PSAs have been synthesized for drug reservoir (Tombs et al., 2018).
Thermoplastic polyurethanes (TPUs) have a great potential for designing PSAs because of their segmented structure constituted by hard and soft segments. The hard segments are formed by reacting a diisocyanate and a short diol (chain extender), and they are polar and short, whereas the soft segments are made of the polyol chains, and they are less polar and have higher length than the hard segments. Therefore, the hard and the soft segments are incompatible and tend to segregate in immiscible domains, and the hard segments determine the cohesion properties of the TPUs, whereas the soft segments are related to their tack and adhesion properties (Yilgör and Yilgör, 2015). Thus, the structure of the TPUs can be designed by changing the composition and the extent of the interactions between the hard and the soft segments; this may allow finding the right balance between their adhesion and cohesion properties; however, typically the TPUs do not show tack, an important property for PSAs.
Recently, different TPU PSAs synthesized with blends of polypropylene glycols (PPGs) of different molecular weights and 4,4′-diphenylmethane diisocyanate (MDI) showed good tack at 10–37°C but low peel strength and cohesion (Fuensanta and Martín-Martínez, 2018). In order to improve the cohesion of the TPU PSAs, the hard segments content of the TPUs was changed by using different blends of PPGs of different molecular weights (Fuensanta and Martín-Martínez, 2019), and it was shown that the TPU PSAs synthesized with lower hard segments content had poor shear strength but high tack and peel strength, whereas the increase of the hard segments increased the shear strength and the peel strength values, but tack was low.
In this study, the segmented structure and the degree of phase separation of the TPUs have been modified by changing the extent of the interactions between the soft segments (blends of polyether polyols with and without alkyl pendant groups; Scheme 1) and the hard segments content (NCO/OH ratio = 1.05–1.35). The absence of the methyl pendant group in the poly(tetramethylene ether glycol) (PTMEG) will allow more net van der Waals interactions between the soft segments in the TPU reducing the mobility of the polymer chains, but increasing its cohesion and mechanical properties. The mixing of PTMEG with PPG, which has no pendant group, during the synthesis of the polyurethanes will modify the extent of interactions between the soft segments. The structure of the TPUs synthesized with different blends of PPG and PTMEG polyols of similar molecular weights was determined by infrared spectroscopy, differential scanning calorimetry (DSC), and thermal gravimetric analysis (TGA), and their viscoelastic properties were obtained by plate–plate rheology. Thermoplastic polyurethane PSAs were prepared by placing TPU coatings on PET (polyethylene terephthalate) film (Fuensanta and Martín-Martínez, 2018), and the tack, shear under creep, and peel adhesion properties were measured.
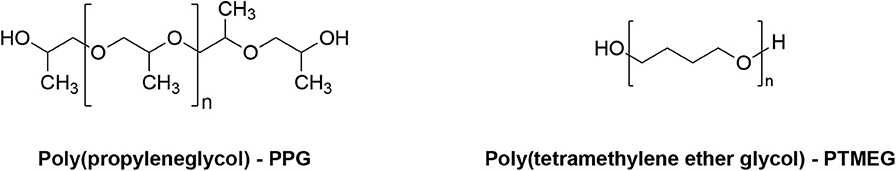
Scheme 1. Chemical structures of the polyether polyols.
Materials and Experimental Techniques
Materials
The TPUs were synthesized by reacting MDI [Desmodur® 44MC flakes supplied by Covestro (Leverkusen, Germany)], different blends of PPG of molecular weight 2,000 g/mol [Alcupol® D2021 supplied by Repsol (Madrid, Spain)], and PTMEG of molecular weight 2,000 g/mol (PTMEG) supplied by Sigma-Aldrich (St. Louis, MO, USA). The polyols were melted and dried at 80°C under reduced pressure (300 mbar) for 2 h before used. Dibutyl tin dilaurate (DBTDL) was used as catalyst, and 1,4-butanediol (BD) was used as chain extender; both were supplied by Sigma-Aldrich. Methyl ethyl ketone (MEK) supplied by Jaber S.A. (Almansa, Spain) was used to dissolve the TPU for allowing adequate coating on PET films (TPU PSAs).
Synthesis of the Thermoplastic Poly(Ether-Urethane)s
The thermoplastic thermoplastic poly(ether-urethane)s were synthetized by using the prepolymer method in 500 mL glass reactor under inert atmosphere (dried nitrogen), and an anchor shaped stirrer coupled to Heidolph overhead stirrer RZR-2000 (Kelheim, Germany) was used (Fuensanta and Martín-Martínez, 2018). MDI was melted at 80°C in the reactor, and PPG, PTMEG, or PPG + PTMEG blends were added under stirring at 250 revolutions/min (rpm) for 30 min. Afterward, 0.04 mmol catalyst (DBTDL) was added, and the stirring was decreased to 80 rpm. The reaction lasted for 2 h, and the amount of free NCO content was determined by dibutylamine titration. Then, the chain extender (BD) was added under stirring at 80°C and 80 rpm for 5 min. The scheme of the synthesis of the TPUs is shown in Figure 1.
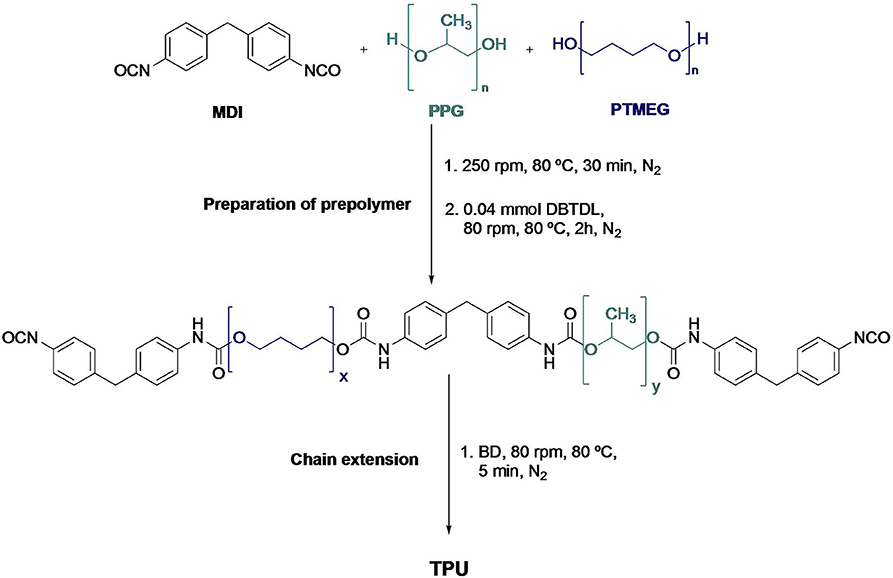
Figure 1. Scheme of the synthesis of the thermoplastic poly(ether-urethane)s.
Poly(ether-urethane) PSAs (TPU PSAs) were prepared according the procedure described in Fuensanta and Martín-Martínez (2019). One hundred milliliters of MEK solution containing 40 g TPU was spread on PET film (50 μm thick), and the thickness of the TPU coating was adjusted with a metering rod of 400 μm. The solvent evaporated at room temperature for 72 h for obtaining the TPU PSAs. The thicknesses of the TPUs on the PET films were 40 to 50 μm.
Experimental Techniques
Attenuated Total Reflection Infrared Spectroscopy
Attenuated total reflection infrared (ATR-IR) spectra of the TPUs were obtained in absorbance mode in a Tensor 27 FT-IR spectrometer (Bruker Optik GmbH, Erlinger, Germany) by using Golden Gate single reflection diamond, recording 64 scans with a resolution of 4 cm−1 in the range of wavenumbers from 4,000 to 400 cm−1 (Fuensanta and Martín-Martínez, 2018).
Differential Scanning Calorimetry
Differential scanning calorimetry was used to obtain the structural properties of the TPUs, a DSC Q100 calorimeter (TA Instrument, New Castle, DE, USA) under nitrogen atmosphere (flow rate = 50 mL/min) was used. Seven- to 8-mg sample was heated in hermetic sealed aluminum pan from −80 to 150°C, cooled at −80°C, and heated again from −80 to 200°C by using heating and cooling rates of 10°C/min (Fuensanta and Martín-Martínez, 2018). The glass transition temperatures and the thermal events of the TPUs were obtained from the second DSC heating run.
Thermal Gravimetric Analysis
Thermal gravimetric analysis was also used to obtain the structural properties of the TPUs, a TGA Q500 equipment (TA Instruments) under nitrogen atmosphere (flow rate = 50 mL/min) was used. A 10-mg sample was placed in platinum crucible, and it was heated from 35 to 800°C by using a heating rate of 10°C/min (Fuensanta and Martín-Martínez, 2018).
Plate–Plate Rheology
The viscoelastic properties of the TPUs were assessed in a DHR-2 rheometer (TA Instruments) using parallel plate–plate geometry; a stainless-steel plate of 20-mm diameter and a gap of 0.40 mm were used. Temperature sweep experiments were carried out from −5 to 120°C, by using a heating rate of 5°C/min and a frequency of 1 Hz. Furthermore, frequency sweep experiments were carried out at 25°C by using 2.5% strain amplitude in the angular frequency range from 0.01 to 100 rad/s (Fuensanta and Martín-Martínez, 2018).
Adhesion Properties
The adhesion properties of the TPU PSAs were assessed at 25°C by probe tack, 180° peel strength, and creep test under shear (Figure 2).
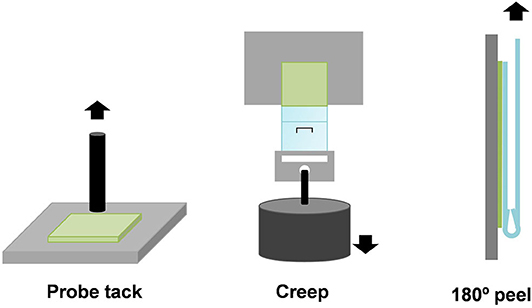
Figure 2. Scheme of the probe tack, creep test under shear, and 180° peel strength of aluminum/TPU PSA joints.
The probe tack of the TPU PSAs was measured at 25°C by using a flat-end cylindrical stainless-steel probe of 3-mm diameter in a TA.XT2i Texture Analyzer (Stable Micro Systems, Surrey, UK) (Figure 2) (Fuensanta and Martín-Martínez, 2018). The probe was approached slowly to the TPU PSA surface applying a load of 5 N for 1 s, and it was pulled out at 10 mm/s. The maximum of the stress–strain curve was taken as the tack of the TPU PSA. At least five replicates were carried out and averaged.
A 180° peel strength of aluminum 5754/TPU PSA joints was carried out in an Inston 4411 universal testing machine (Instron Ltd., Buckinghamshire, UK); the pulling rate was 152 mm/min (Fuensanta and Martín-Martínez, 2018). The TPU PSA strips have dimensions of 30 × 300 × 0.5 mm, and they were joined to clean aluminum 5754 pieces of dimensions 30 × 150 × 1.5 mm; the joints were made by passing 30 times a 2-kg rubber-coated roller (Figure 2). Five replicates were tested and averaged for each joint.
The creep tests under shear of the TPU PSAs were carried out in a Shear-10 equipment (ChemInstruments, Fairfield, OH, USA). Thermoplastic polyurethane PSA strips of 2.4 × 20 cm were attached to the center of a clean polished stainless-steel 304 piece. Thermoplastic polyurethane PSA area of 2.5 × 2.5 mm was joined to the stainless steel, and a 2-kg rubber-coated roller was passed over the joint. The, the TPU PSA stainless-steel joint was placed on the holder of the equipment hanging a weight of 1 kg at the bottom (Fuensanta and Martín-Martínez, 2019). The creep resistance at 25°C of the TPU PSAs is related to their cohesion and was obtained as the “holding time,” that is, the time needed for the TPU PSA strip to fall down. Three replicates were tested for each TPU PSA, and the results obtained were averaged.
Results and Discussion
The innovative strategy of this study is the synthesis of TPUs by using blends of two polyether polyols of different structure for being used as PSAs. According to Scheme 1, PPG is a polyether with methyl pendant groups that disturb the interactions between the chains, whereas PTMEG has no pendant groups that allow more net interaction between the chains. In the Supplementary Materials (Figures S1–S3, Tables S1, S2), the characterization of the two polyether polyols is shown. Poly(propyleneglycol) shows one glass transition temperature at −69°C and one thermal decomposition at 350°C, whereas PTMEG shows more intense C-O-C band at 1,101 cm−1 in the ATR-IR spectrum and one melting process at 26°C with noticeable enthalpy due to the interaction between the chains; furthermore, PTMEG shows two thermal decompositions at 280 and 417°C (the main); the higher temperature of the main decomposition than in PPG can be associated to the interactions between the chains. The use of blends of PPG and PTMEG should change the interactions between the soft segments, which will modify the degree of phase separation and the properties of the TPU PSAs.
Modification of the Hard Segments Content by Changing the NCO/OH Ratio of the Poly(Ether-Urethane)s
For increasing the cohesion of the TPUs, their hard segments content was increased from 11.7 to 15.8% by synthesizing different TPUs with 50 wt% PPG + 50 wt% PTMEG blend and different NCO/OH ratios (1.05–1.35) (Table 1).
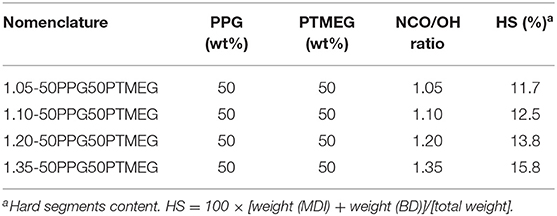
Table 1. Nomenclature and composition of the poly(ether-urethane)s synthesized with 50 wt% PPG + 50 wt% PTMEG blend and different NCO/OH ratios.
The chemical structure of the TPUs was analyzed by ATR-IR spectroscopy (Figure 3A). All ATR-IR spectra were normalized with respect to the most intense absorption band of the C-O-C group at 1,099 cm−1. The absorption bands at 3,506 to 3,498 and 3,296 to 3,292 cm−1 are attributed to the N-H stretching of the urethane group; the N-H bending band appears at 1,534 cm−1, and the C-N stretching is found at 1,222 to 1,221 cm−1. The main characteristic bands of the polyols (PPG and PTMEG) appear at 2,976 to 2,856 cm−1 (C-H stretching of the CH3 and CH2 groups), 1,449 to 1,448 cm−1 (C-H bending), 1,372 cm−1 (C-H rocking of the methyl group), and 1,099 to 1,098 cm−1–the most intense—due to C-O-C stretching. The C=O stretching band of the urethane group is located at 1,730 cm−1, and the absorptions bands at 1,599 and 1,412 cm−1 correspond to C-C and C-H stretching of the aromatic ring of MDI, respectively.
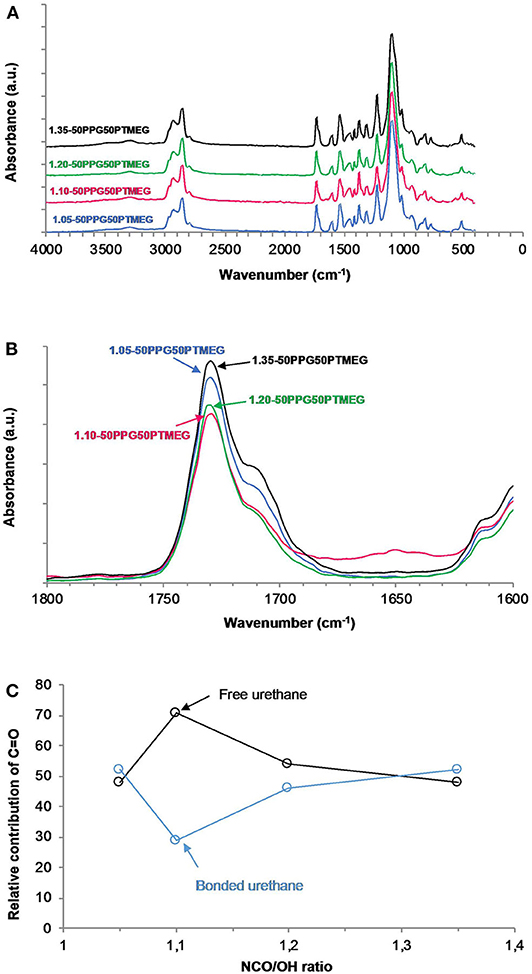
Figure 3. (A) ATR-IR spectra, (B) carbonyl region (1,800–1,600 cm−1) of the ATR-IR spectra, and (C) variation of the free and hydrogen-bonded urethane groups as a function of the NCO/OH ratio for TPUs synthesized with 50 wt% PPG + 50 wt% PTMEG blend and different NCO/OH ratios.
The ATR-IRs of all TPUs are quite similar, but they differ in the carbonyl region (Figure 3B) in which the percentages of the associated by hydrogen bonding urethane (bonded urethane) groups are different depending on the NCO/OH ratio. The free urethane and the ether groups bonded to N-H hydrogen appear at 1,730 to 1,729 cm−1, whereas the hydrogen-bonded urethane group appears at 1,711 to 1,710 cm−1 (Strikovsky and Zharkov, 1993; Mattia and Painter, 2007). In order to quantify the percentages of the free and bonded urethane groups in the TPUs, the carbonyl region was curve fitted, assuming a Gaussian function (Fuensanta and Martín-Martínez, 2019). According to Figure 3C, the percentages of the free and bonded urethane groups are similar is all TPUs, except in the one synthesized with NCO/OH ratio of 1.10 in which the free urethane groups are dominant. Therefore, 1.10-50PPG50PTMEG shows the highest degree of phase separation between the hard and soft segments, whereas similar degree of phase separation is found in the other TPUs.
The structure and thermal properties of the TPUs made with different NCO/OH ratios have been assessed by DSC and TGA. The DSC traces (Figure 4A) show the glass transition temperature of the soft segments (Tg) between −55 and −62°C; the lowest and similar Tg corresponds to 1.05-50PPG50PTMEG and 1.35-50PPG50PTMEG indicating lower degree of phase separation than in the other TPUs. Thus, one of the requirements in the adhesive in PSAs is obeyed; that is, the Tg must be substantially lower than the temperature of use. Furthermore, 1.10-50PPG50PTMEG shows a cold crystallization of the soft segments at 3°C followed by a melting peak of the soft segments at 18°C, which derives from the interactions between the PTMEG chains. This confirms the different structure of 1.10-50PPG50PTMEG with respect to the other TPUs, in agreement with the results of ATR-IR spectroscopy. On the other hand, the DTGA plots of the TPUs (Figure 4B) show three thermal degradations due to the decomposition of the free urethane hard domains (283–297°C), hydrogen-bonded urethane domains (315–337°C), and soft domains (383–393°C) (Ferguson and Petrovic, 1976). Because the amounts of PPG and PTMEG are similar in all TPUs, the differences in their structure and thermal properties can be ascribed to different interactions due to the hard segments. The existence of free urethane domains can only be distinguished in the TPUs made with NCO/OH ratios of 1.05 and 1.10, and in general, the percentage of by hydrogen-bonded urethane domains increases by increasing the NCO/OH ratio; 1.10-50PPG50PTMEG is an exception (Table 2). The percentages of the soft domains are more noticeable in the TPUs made with NCO/OH ratios of 1.10 and 1.20. Therefore, 1.35-50PPG50PTMEG shows the highest percentage of hydrogen-bonded urethane domains and the lowest percentage of soft domains, indicating less mobility of the polymeric chains and higher cohesion than in the other TPUs. On the contrary, 1.10-50PPG50PTMEG and 1.20-50PPG50PTMEG have the highest percentages of soft domains, indicating higher mobility of the polymeric chains, particularly for 1.10-50PPG50PTMEG in which dominant free urethane domains are distinguished.
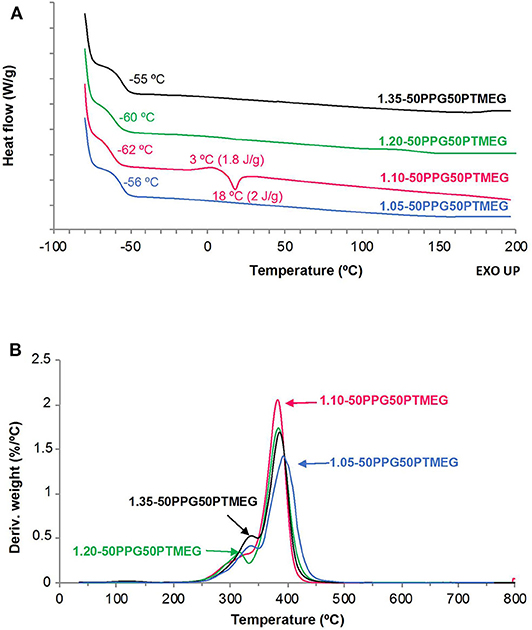
Figure 4. (A) DSC traces (second heating run) and (B) variation of the derivative of the weight as a function of the temperature for TPUs synthesized with 50 wt% PPG + 50 wt% PTMEG and different NCO/OH ratios.
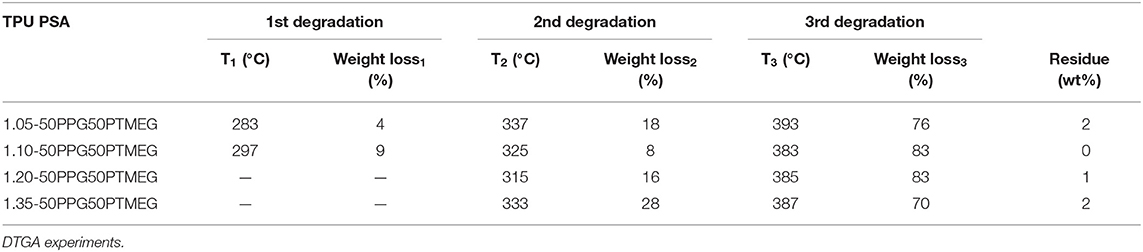
Table 2. Temperatures and weight losses of the thermal decompositions of the TPUs synthesized with 50 wt% PPG + 50 wt% PTMEG blend and different NCO/OH ratios.
The extent of mobility of the polymeric chains in the TPUs can be estimated from their rheological and viscoelastic properties. Figure 5A shows a decrease of the storage modulus (G′) by increasing the temperature in all TPUs; the decrease is more noticeable in 1.35-50PPG50PTMEG, and the rheological curves are quite similar in all TPUs except in 1.35-50PPG50PTMEG, likely due to the thermal rupture of higher amounts of hydrogen bonds between the hard domains. On the other hand, all TPUs show a crossover of the storage and loss moduli (Figure S4), and the values of temperature (Tcrossover) and modulus (Gcrossover) at the crossover are given in Table 3. Similar values of Gcrossover (1.2 105-1.6 105 Pa) are obtained in all TPUs indicating that they fulfill the Dahlquist criterion at room temperature (Dahlquist, 1969), one of the requirements in PSAs. However, the values of Tcrossover of the TPUs decrease by increasing the NCO/OH ratio; 1.10-50PPG50PTMEG is an exception because of its particular structure. Furthermore, 1.35-50PPG50PTMEG shows a temperature at the crossover lower than 25°C, indicating that at room temperature the elastic properties are dominant, and lower mobility of the polymeric chains than in the other TPUs can be expected.
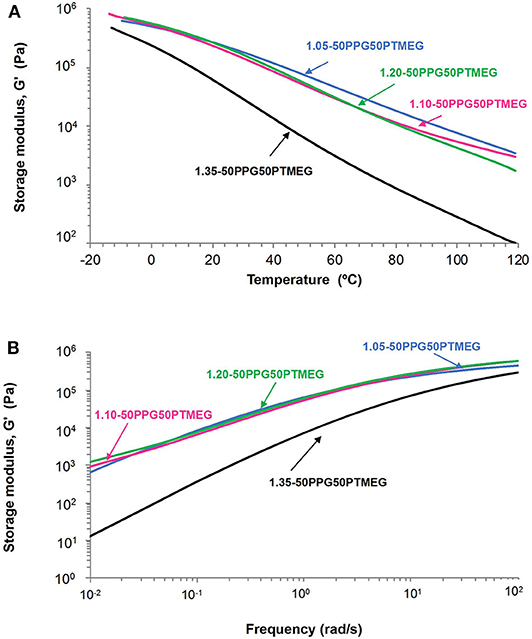
Figure 5. (A) Variation of the storage modulus (G′) as function of the temperature and (B) variation of the storage modulus (G′) as a function of the frequency for TPUs synthesized with 50 wt% PPG + 50 wt% PTMEG blend and different NCO/OH ratios.
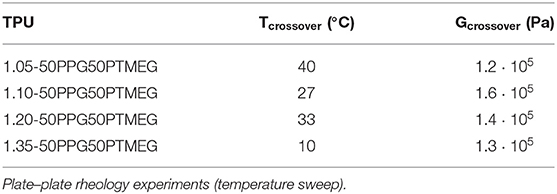
Table 3. Values of temperature and modulus at the crossover of G′ and G″ of the TPUs synthesized with 50 wt% PPG + 50 wt% PTMEG blend and different NCO/OH ratios.
The most common typical applications of the PSAs are at room temperature, and therefore, the viscoelastic properties of the TPUs were also determined at 25°C by oscillatory frequency sweep rheological experiments. It has been shown elsewhere (Derail and Marin, 2009) that the tack and the shear strength of the PSAs correlated well with their storage moduli (G′) values at lower frequency, whereas the peel strength was related to their G′ values at high frequency. Figure 5B shows that 1.35-50PPG50PTMEG should exhibit excellent tack but poor cohesion due to its low G′ value, and the rest of TPUs have similar rheological plots and higher G′ values at lower frequency, anticipating lower tack but higher cohesion. On the other hand, all TPUs should show good peel strength because of the high values of G′ at higher frequency.
The adhesion properties of the TPU PSAs made with different NCO/OH ratios were evaluated by probe tack, 180° peel strength, and creep test under shear (Table 4). In general, the TPU PSA made with NCO/OH ratio of 1.05 has low tack, low cohesion, and low peel strength due to its lower degree of phase separation, whereas 1.35-50PPG50PTMEG has good cohesion and peel strength, but low tack, likely due to the high content of the hydrogen-bonded urethane domains and low G′ value at lower frequencies in the rheological curves. Excellent tack and peel strength values are obtained for 1.10-50PPG50PTMEG, but the cohesion is moderate because of its particular structure, and 1.20-50PPG50PTMEG shows good tack, high cohesion, and high peel strength.
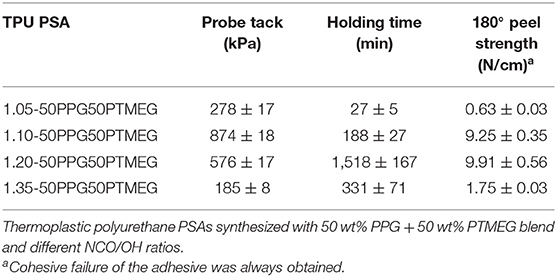
Table 4. Probe tack at 25°C, holding time at 25°C, and 180° peel strength at 25°C of aluminum 5754/TPU PSA joints.
Modification of the Interactions Between the Soft Segments by Changing the PTMEG Content in the Poly(Ether-Urethane)s
In this study, the interactions between the soft segments in the TPUs have been changed by mixing different amounts of PPG and PTMEG polyols during their syntheses; an NCO/OH ratio of 1.20 was used; this NCO/OH ratio was selected because of the adequate properties of the TPU PSAs, shown in Table 4. Table 5 summarizes the composition of the TPUs PSAs in which the hard segments content is similar (~14%); 1.20-100PTMEG is an exception.
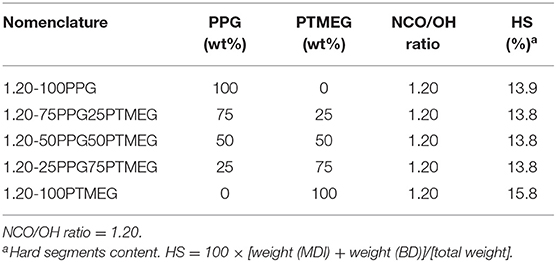
Table 5. Nomenclature and composition of the poly(ether-urethane)s synthesized with different PPG + PTMEG blends.
The structural characterization of the TPUs was assessed by ATR-IR spectroscopy, DSC, and TGA. All ATR-IR spectra of the TPUs show similar absorption bands, but the intensities of the C-H bands due to the polyols-−2,970 to 2,940 and 2,868 to 2,854 cm−1 (C-H stretching), 1,454 to 1,447 cm−1 (C-H bending), 1,372 to 1,370 cm−1 (C-H rocking of methyl group)—and 1,098 to 1,099 cm−1 (C-O-C stretching) (Figure S5) change. On the other hand, the carbonyl region of the ATR-IR spectra (Figure 6A) is similar in all TPUs synthesized with PPG + PTMEG blends, although the wavenumber in the maximum shifts slightly from 1,728 to 1,731 cm−1 by increasing the PTMEG content. The percentages of the free and hydrogen-bonded urethane groups obtained by curve fitting of the carbonyl bands (Figure S6) are shown in Figure 6B, the percentages of free urethane are slightly higher than the ones of the hydrogen-bonded urethane groups in all TPUs, irrespective of the PPG + PTMEG blend, except in 1.20-100PPG in which the hydrogen-bonded urethane groups are dominant.
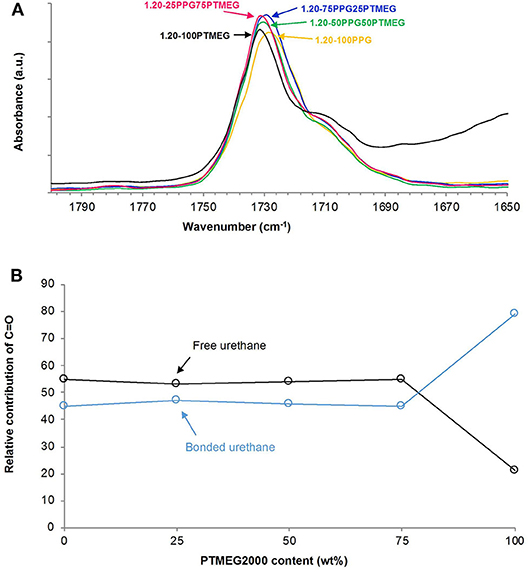
Figure 6. (A) Carbonyl region (1,800–1,650 cm−1) of the ATR-IR spectra and (B) variation of the free and hydrogen-bonded urethane groups as a function of the PTMEG content in the TPUs synthesized with different PPG + PTMEG blends. NCO/OH ratio = 1.20.
The DSC traces of the TPUs (Figure 7A) show the Tg of the soft segments between −66 and −50°C, and the increase of the PTMEG content decreases the Tg value of the TPU. Furthermore, the DSC traces of the TPUs synthesized with PTMEG and 25 wt% PPG + 75 wt% PTMEG blend show the melting of the soft segments indicating the existence of semicrystalline domains due to the interactions between the PTMEG soft segments. On the other hand, the TGA thermograms of the TPUs (Figure S7) and the temperatures at which 5 and 50 wt% are lost increase by increasing the PTMEG content (Table 6). Furthermore, the amounts of the soft domains in the TPUs made with PPG + PTMEG blends are similar, but the temperature of decomposition of the soft domains increases by increasing their PTMEG content, indicating higher interactions in the TPUs. The thermal decomposition of the hydrogen-bonded urethane hard domains can only be distinguished in the TPUs synthesized with more than 50 wt% PTMEG, and the percentages of free urethane hard domains in the TPUs decrease by increasing their PTMEG content, indicating stronger interactions between the hard domains. Additionally, the temperature at which the free urethane hard domains of the TPUs decomposes decreases by increasing the PTMEG content because of the stronger interactions between the hydrogen-bonded urethane hard domains.
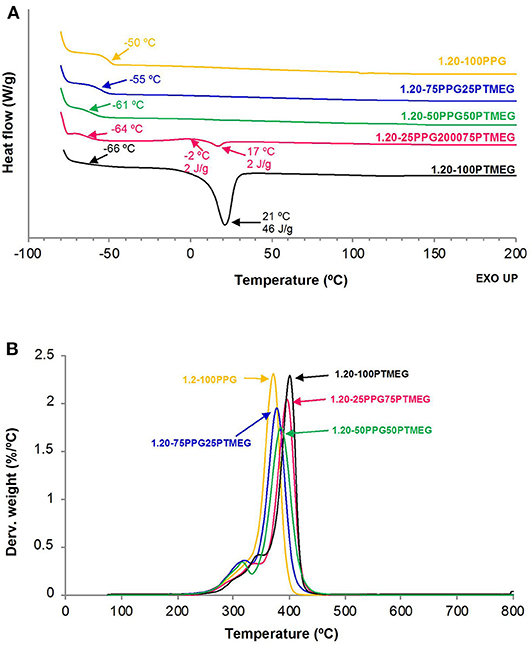
Figure 7. (A) DSC traces (second heating run) and (B) variation of the derivative of the weight as a function of the temperature for TPUs synthesized with different PPG + PTMEG blends. NCO/OH ratio = 1.20.
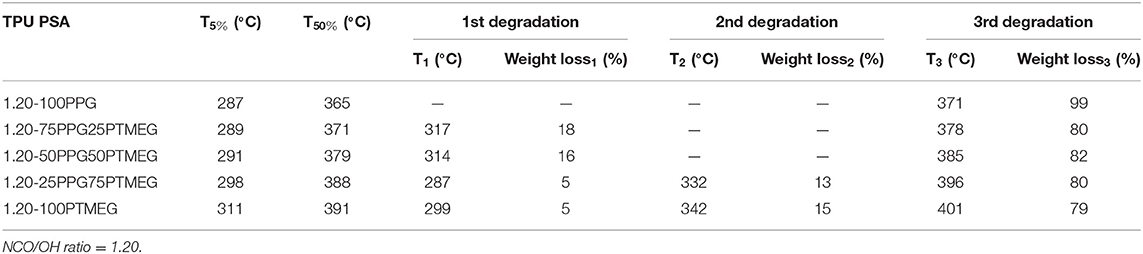
Table 6. Temperatures at which 5 (T5%) and 50 wt% (T50%) are lost, and temperatures and weight losses of the thermal decompositions of the TPUs synthesized with different PPG + PTMEG blends.
The viscoelastic properties of the TPUs synthesized with PPG + PTMEG blends were studied by temperature sweep plate–plate rheology experiments (Figure S8), and the storage modulus (G′) increases by increasing the PTMEG content, although the viscoelastic curves of the TPUs made with PPG or PTMEG only show different trend. All TPUs exhibit a crossover between the G′ and G″ moduli (Figure S9), and Table 7 shows that the temperatures at the crossover of the TPUs increase by increasing their PTMEG content, but the moduli at the crossover are similar in all TPUs.
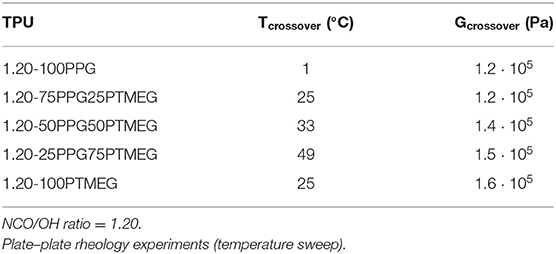
Table 7. Values of temperature and modulus at the crossover of G′ and G″ of the TPUs synthesized with different PPG + PTMEG blends.
Frequency sweep plate–plate rheology experiments were carried out to assess the viscoelastic properties at 25°C of the TPUs (Figure 8A). The rheological experiment of 1.20-100PTMEG could not be done because of the sliding of the plates during the experiment. The storage moduli (G′) of the TPUs increase by increasing their PTMEG content, as a consequence of the existence of semicrystalline domains of PTMEG soft segments, which decrease the molecular flexibility and the mobility of the polymeric chains (Inescu, 2005). The kind of PSA can be assessed by means of Chang's (1991) viscoelastic windows, which are built from the values of the storage (G′) and loss (G″) moduli at low (10−2 rad/s) and high (102 rad/s) frequencies. Chang proposed the existence of four quadrants to classify the different types of PSAs, depending on their location of the viscoelastic window. Chang's viscoelastic windows of the TPU PSAs are shown in Figure 8B, in which all them are below the Dahlquist criterion line indicating a good contact efficiency. By increasing the PTMEG content of the TPU PSAs, Chang's viscoelastic windows shift from the lower left quadrant characterized by low storage modulus and low dissipation (removable PSA) (1.20-100PPG), to the central region characterized by medium storage modulus and medium dissipation (general purpose PSA) (1.20-25PPG75PTMEG).
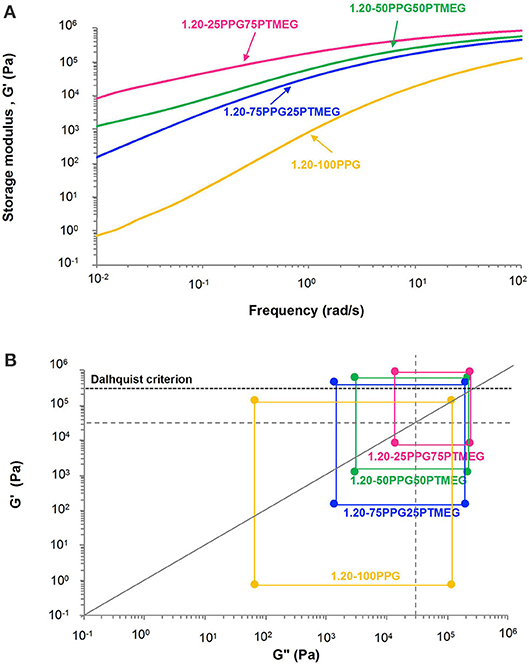
Figure 8. (A) Variation of the storage modulus (G′) at 25°C as a function of the frequency and (B) Chang's viscoelastic windows at 25°C of the TPUs synthesized with different PPG + PTMEG blends. NCO/OH ratio = 1.20. The four regions of Chang's viscoelastic window are shown as dotted lines, and the dashed line corresponds to the Dahlquist criterion.
The adhesion properties of the TPU PSAs are summarized in Table 8. The increase of the PTMEG content increases the cohesion (or holding time) and the peel strength of the TPU PSAs, but decreases the tack. This trend can be ascribed to the interactions between the PTMEG soft segments, which produce semicrystalline domains and reduce the mobility of the polyurethane chains. However, 1.20-50PPG50PTMEG PSA shows an excellent compromise between tack, holding time, and 180° peel strength, and it can be used as removable PSA in labels and medical patches.
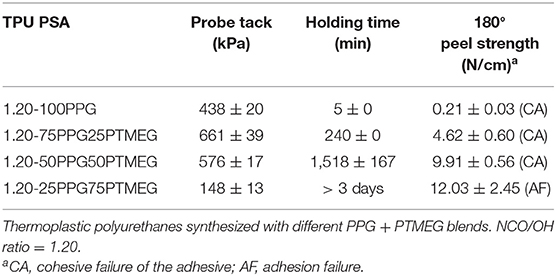
Table 8. Probe tack at 25°C, holding time at 25°C, and 180° peel strength at 25°C of aluminum 5754/TPU PSA joints.
Conclusions
Different TPUs intended for PSAs have been prepared by using blends of polyols with and without methyl pendant groups. The NCO/OH ratio was varied for increasing the hard segments contents, and the structure of the TPUs was similar, except in the one made with NCO/OH ratios of 1.10 and 1.35. The increase of the percentage of PTMEG polyol produced an increase of the thermal stability and the storage moduli of the TPUs due to the creation of semicrystalline regions due to the interactions between the soft segments. Excellent tack, shear strength, and peel strength were obtained in 1.20-50PPG50PTMEG PSA.
Data Availability Statement
The raw data supporting the conclusions of this article will be made available by the authors, without undue reservation.
Author Contributions
MF carried out the experiments and write the first draft of the manuscript. JM-M designed the experiments, contributed to the discussion of the results, and wrote the final manuscript. All authors contributed to the article and approved the submitted version.
Conflict of Interest
The authors declare that the PPG polyol sample was donated by Repsol (Madrid, Spain). The company was not involved in the study design, collection, analysis, interpretation of data, the writing of this article or the decision to submit it for publication.
Supplementary Material
The Supplementary Material for this article can be found online at: https://www.frontiersin.org/articles/10.3389/fmech.2020.00034/full#supplementary-material
References
Chang, E. P. (1991). Viscoelastic windows of pressure-sensitive adhesives. J. Adhes. 34, 189–200. doi: 10.1080/00218469108026513
Chen, X., Liu, W., Zhao, Y., Jiang, L., Xu, H., and Yang, X. (2009). Preparation and characterization of PEG-modified polyurethane pressure-sensitive adhesives for transdermal drug delivery. Drug Dev. Ind. Pharm. 35, 704–711. doi: 10.1080/03639040802512235
Czech, Z., Kowalczyc, A., and Swiderska, J. (2011). “Pressure sensitive adhesives for medical applications,” in Wide Spectra of Quality Control, ed I. Akyar (Rijeka: InTech), 309–332.
Dahlquist, C. A. (1969). “Pressure-sensitive adhesives,” in Treatise on Adhesion and Adhesives. ed R. L. Patrick (New York, NY: Marcel Dekker), 219–260.
Derail, C., and Marin, G. (2009). “Role of viscoelastic behavior of pressure-sensitive adhesives in the course of bonding and debonding processes,” in Handbook of Pressure-Sensitive Adhesives and Products. Fundamentals of Pressure Sensitivity. Eds I. Benedek and M. M. Feldstein (Boca Raton: CRC Press Chapter 4, 1–26.
Feldstein, M. M., and Siegel, R. A. (2012). Molecular and nanoscale factors governing pressure-sensitive adhesion strength of viscoelastic polymers. J. Polym. Sci. Part B: Polym. Phys. 50, 739–772. doi: 10.1002/polb.23065
Ferguson, J., and Petrovic, Z. (1976). Thermal stability of segmented polyurethanes. Eur. Polym. J. 12, 177–181. doi: 10.1016/0014-3057(76)90050-1
Fuensanta, M., and Martín-Martínez, J. M. (2018). Thermoplastic polyurethane coatings made with mixtures of polyethers of different molecular weights with pressure sensitive adhesion property. Prog. Org. Coat. 118, 148–156. doi: 10.1016/j.porgcoat.2017.11.021
Fuensanta, M., and Martín-Martínez, J. M. (2019). Thermoplastic polyurethane pressure sensitive adhesives made with mixtures of polypropylene glycols of different molecular weights. Int. J. Adhes. Adhes. 88, 81–90. doi: 10.1016/j.ijadhadh.2018.11.002
Higgins, J. J., Jagisch, F. C., and Stucker, N. E. (1989). “Butyl rubber and poly-isobutylene,” in Handbook of Pressure Sensitive Adhesive Technology. ed D. Satas (New York, NY: Van Nostrand Reinhold, 374–395.
Inescu, M. (2005). “Relationships between the oligo-polyol structure and polyurethane properties,” in Chemistry and Technology of Polyols for Polyurethanes. ed M. Ionescu (Shawbury: Rapra Technology Limited, 535–550.
Mattia, J., and Painter, P. (2007). A comparison of hydrogen bonding and order in a polyurethane and poly(urethane-urea) and their blends with poly(ethylene glycol). Macromolecules. 40, 1546–54. doi: 10.1021/ma0626362
Satas, D., and Satas, A. M. (1989). “Hospital and first aid products,” in Handbook of Pressure Sensitive Adhesive Technology. ed D. Satas (New York, NY: Van Nostrand Reinhold), 627–642.
Strikovsky, A. G., and Zharkov, V. V. (1993). Infra-red spectroscopy study of equilibrium association of urethane groups in poly(ether urethane)s. Polymer. 34, 3397–3401. doi: 10.1016/0032-3861(93)90467-O
Tombs, E. L., Nikolaou, V., Nurumbetov, G., and Haddleton, D. M. (2018). Transdermal delivery of ibuprofen utilizing a novel solvent-free pressure-sensitive adhesive (PSA): TEPI® technology. J. Pharm. Innov. 13, 48–57. doi: 10.1007/s12247-017-9305-x
Keywords: polyurethane, pressure-sensitive adhesive, viscoelastic properties, probe tack, peel, shear under creep
Citation: Fuensanta M and Martín-Martínez JM (2020) Viscoelastic and Adhesion Properties of New Poly(Ether-Urethane) Pressure-Sensitive Adhesives. Front. Mech. Eng. 6:34. doi: 10.3389/fmech.2020.00034
Received: 30 March 2020; Accepted: 04 May 2020;
Published: 24 June 2020.
Edited by:
Andrey I. Dmitriev, Institute of Strength Physics and Materials Science (ISPMS SB RAS), RussiaReviewed by:
Valentin L. Popov, Technical University of Berlin, GermanyAlexander Filippov, Donetsk Institute for Physics and Engineering, Ukraine
Copyright © 2020 Fuensanta and Martín-Martínez. This is an open-access article distributed under the terms of the Creative Commons Attribution License (CC BY). The use, distribution or reproduction in other forums is permitted, provided the original author(s) and the copyright owner(s) are credited and that the original publication in this journal is cited, in accordance with accepted academic practice. No use, distribution or reproduction is permitted which does not comply with these terms.
*Correspondence: José Miguel Martín-Martínez, am0ubWFydGluQHVhLmVz