 Björn Lechthaler
 Georg Ochs2,3
 Martin Dienwiebel
- 1Department of Materials Science and Engineering, Institute for Functional Materials, Saarland University, Saarbrücken, Germany
- 2Fraunhofer Institute for Mechanics of Materials, Freiburg, Germany
- 3Microtribology Centre μTC, Institute for Applied Materials, Karlsruhe Institute of Technology, Karlsruhe, Germany
Despite the great importance of the real contact area, it is a parameter which, depending on the tribological system, is difficult or impossible to obtain experimentally. In this work, a combination of methods was used to estimate the development of the real contact surface, and the results were compared with the friction coefficient course. The measurements were carried out with a home-built in situ tribometer, which records a 3D image of the surface after each individual friction cycle. A tungsten sample was treated by laser interference with a line-like pattern to produce a deterministic surface. This allowed for more precise tracking of the real contact area when combined with the use of an inert corundum sphere as a counter-body. The real contact area was calculated numerically from the height information obtained using a contact application. Finally, the true contact surface was compared with the parallel-recorded friction values. After a short running-in phase, the friction behavior and the real contact surface showed comparable courses. This indicates that the changes in the real contact area could explain the friction behavior of the laser-patterned sample, and the methodology was proven to be suitable for experimentally estimating the real contact area.
1. Introduction
The area of contact AC has a great influence on the behavior of a tribosystem. Both the friction coefficient and wear can be influenced by changing the topography of the surface. Therefore, there are many well-known methods for modifying surfaces (Willis, 1986; Gerbig et al., 2002; Li et al., 2010).
It is important to distinguish the difference between geometric and real contact surfaces (Bowden and Tabor, 1951; Bhushan, 1998), since energy is only dissipated on the real contact surface.
One process for producing tailor-made surfaces, and thus specifically influencing the true contact area, is the direct laser interference patterning method, which allows for large-area structuring with micrometer accuracy (Mücklich et al., 2006).
Gachot et al. (2013) showed how the frictional properties of a tribosystem can be changed by laser structuring on both the base and counter-body. It was observed that the coefficient of friction initially drops rapidly and rises again continuously after a short break-in period. The results suggest that this increase is caused either by changes in the material (martensite transformation of the steel or inhomogeneity in the laser structure) or, more possibly, by an increase in the real contact area due to flattening of the laser structures.
The question now is how to verify, in this example or for other systems, that the increase in the real contact area is the decisive factor for the behavior of the coefficient of friction? Despite the importance of this parameter, experimental access to the real contact surface is difficult. There are some methods, but they are usually restricted (Woo and Thomas, 1980). In optical methods, for example, one of the bodies must be transparent. The real contact area is then measured directly through the body using a microscope and CCD camera (Ovcharenko et al., 2006). If the experiment can be carried out completely in water or oil, the contact surface can be measured using ultrasonics (Aymerich and Pau, 2004). For a dry case, a simulation is possible, but for complex geometries, it is difficult to accurately replicate the material behavior, and the surface and the simulation can only indicate a tendency (Sayles and Thomas, 1978; Bhushan, 1998).
In this work, a different approach has been chosen. A friction experiment was performed using a home-built in situ tribometer with an on-line holographic microscope (Korres and Dienwiebel, 2010; Feser, 2014). Tungsten was used instead of steel to exclude the martensite transition. Furthermore, by using a new optimized laser interference method (Bieda et al., 2016), a very homogeneous, sinusoidal pattern was created to minimize the influence of uncontrolled surface defects. This type of pattern has the advantage of flattening continuously and in a defined manner, which simplifies the analysis compared to a static rough surface. The height information of the obtained topography development was then evaluated with a contact mechanics code developed by Pastewka Jacobs et al. (2016). This application made it possible to numerically calculate the real contact surface directly from the power density spectra. Finally, these data were compared with the evolution of the coefficient of friction, which allowed us to clarify whether the friction behavior can be explained by the flattening of the structures and an increase in the contact surface.
2. Experimental Procedure
Disc-shaped samples of 20 mm in diameter and 5 mm in thickness were cut from a tungsten rod (Plansee, purity 99.95 %, Young's modulus 411 GPa and Poisson's ratio 0.28), polished to a surface roughness (Ra) of 10(2) nm, and finally patterned with a laser interference method to create a well-defined, wavy, line-like surface.
For this experiment, a picosecond interference system was used (Bieda et al., 2016). In this method, the laser beam is split by a diffractive optical element into two beams, parallelized by a prism, and finally interfered with a lens on the sample. This results in a line-shaped intensity distribution (Figure 1). After the production of the sample, the height profiles were recorded with a laser scanning microscope (LSM, OLS4100, Olympus) with a lateral resolution of 0.2 μm and a z-resolution of up to 10 nm. For this experiment, a 50× lens was used. Friction tests were conducted with a special in situ ball-on-disk tribometer in linear reciprocating sliding mode with online topography and wear measurements (Korres and Dienwiebel, 2010; Feser, 2014). As a counter-body, an alumina ball (with a diameter of 6 mm, a surface roughness (Ra) of 14(5) nm, a Young's modulus 380 GPa and a Poisson's ratio of 0.22) by Anton Paar GmbH (formerly CSM Instruments) was used.
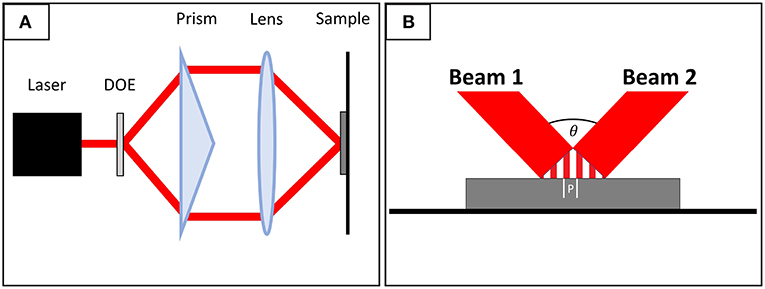
Figure 1. (A) The basic setup for the interference method used. The laser beam is split by a DOE (diffractive optical element), parallelized with a prism, and finally interfered with a lens on the sample surface. (B) A close-up of the interference. The distance between two maxima is called surface period P.
The tests were conducted at a normal load of 0.22 N, the linear sliding speed was set to 5 mm/s, and the stroke length was 79 mm. The experiment was finished after 500 cycles. Due to the large minimum stroke length of the tribometer, the tungsten disc was mounted in a specially designed and polished steel adapter (Figure 2). During each cycle, the counter-body moved over both the steel surface and the laser-textured tungsten disc. The following surface analysis considered only the changes on the tungsten surface.
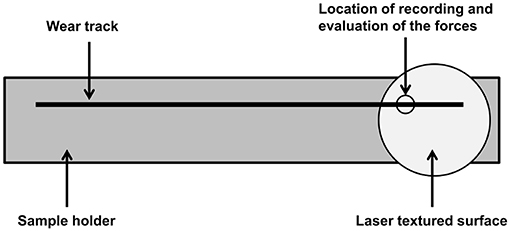
Figure 2. Because of large minimum stroke length of the tribometer, the tungsten disc was mounted in a polished steel adapter. The figure shows a schematic illustration of the adapter. The counter-body (corundum ball) slides over both the adapter and the sample. After each cycle, a 3D image of the sample surface is taken at the same position.
After each cycle, a 3D image was taken with a digital holographic microscope (DHM, R2100 series Lynćee Tec SA, Switzerland, Feser, 2014) with a 20× lens. The contact mechanics simulations were performed on the web interface of the python code PyCo by L. Pastewka (http://contact.engineering/). Based on the boundary element method, it employs FFT coupled to a conjugate gradient method for an efficient calculation of the inter-surface gap and pressure distribution (Pastewka and Robbins, 2016; Kling et al., 2018; Weber et al., 2018). This code outputs a diagram in which the quotient of real and geometric contact surfaces is plotted over the normalized surface pressure σ*. The following applies to the surface pressure:
The normalization of σ is done by the normalized modulus of elasticity E* which is calculated from the modulus of elasticity E and Poisson's ratio ν of the two contact partners as follows:
In the version provided by Pastewka for this work, the counter-body is assumed to be smooth and even, and only elastic deformations are considered.
The surface morphology was imaged by scanning electron microscopy (SEM, Helios, Nanolab600). In addition, a focused ion beam (FIB) microscope (Helios, Nanolab600) was selected to prepare cross-sections to investigate the microstructure of the sample before and after the experiments (The unedited original images can be found in the Supplementary Material). The chemical composition of the laser-structured surface was analyzed by energy dispersive X-ray spectroscopy (EDS) with an acceleration voltage of 3 kV using an EDAX instrument detector and EDAX Genesis software.
3. Results
After the laser treatment, the surface was first characterized with the LSM. The laser treatment created a sinusoidal line-like pattern on the surface of the tungsten sample. A depth of approximately 0.7 μm and a distance between the maxima of approximately 9 μm were determined (Figure 3).
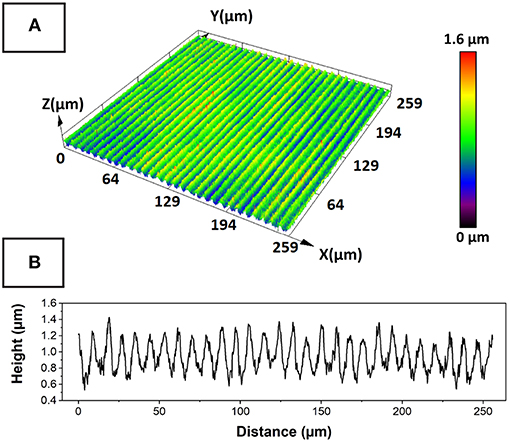
Figure 3. (A) A height profile of the surface after the laser treatment. A cross-section through the profile is shown on the bottom (B). The depth of the structure is approximately 0.7 μm and the distance between the maxima is 9 μm. To form the cross-section, an average was taken over a range of 2.5 μm in the direction of the lines.
The patterning was conducted under atmosphere and a porous layer up to 480 nm thick was formed on the surface. An EDS analysis conducted on the layer showed that it was tungsten oxide (Figure 4). Due the use of a picosecond laser, there was a negligible influence on the microstructure.
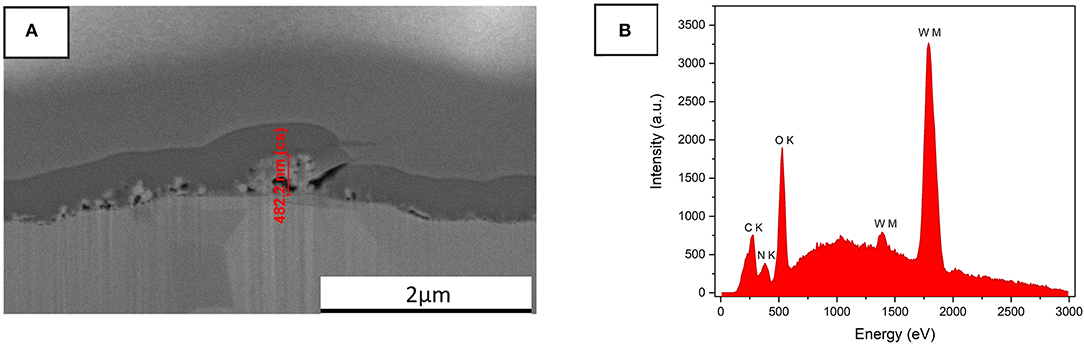
Figure 4. (A) Shows that the result of picosecond laser impact on tungsten is a porous layer of up to 480 nm thick, and the microstructure underneath shows no visible changes. (B) An EDS measurement conducted on only the laser-textured surface area. The analysis shows that the layer is mainly tungsten oxide with a very low nitrogen content, which is a result of laser structuring under atmosphere.
On this laser-patterned surface, the friction force was measured under a constant normal force of 0.22 N. The normal force was stable during the process. The friction force presented a plateau between the 15 and 105th cycles and several peaks around the 183, 386, and 405th cycles. For the remaining duration, the friction force showed a steady value of 0.08 N (Figure 5).
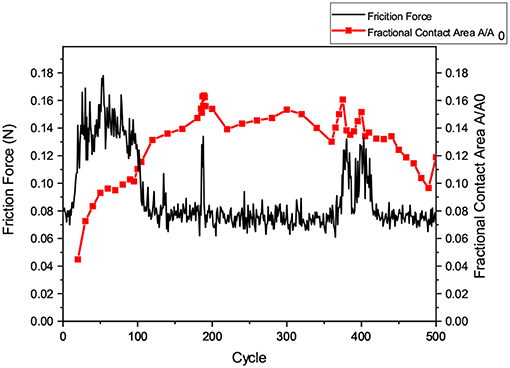
Figure 5. The graph shows the friction force and the contact area as functions of the number of sliding cycles. The black line shows the friction force and the red line the fractional contact area [the ratio of true (A) and apparent contact area (A0)]. After a running-in phase of approximately 105 cycles, the courses of the true contact surface and the friction coefficient are correlated.
To determine the real contact area, every 20th recorded cycle was evaluated manually with the contact mechanics code. In sections where the frictional force varied significantly, the number of analyzed cycles was increased to capture the change in detail. The surface pressure was calculated for a circular contact. The width of the friction track (26.62 μm) was used as the diameter. As an approximation, this value was assumed to be constant in the calculations.
The real contact area could only be determined from the 20th cycle onward, since no reliable friction track could be measured beforehand. Up to the 105th cycle, the contact surface increased rapidly, and afterwards, the course of the contact surface corresponded to the course of the frictional force. This behavior can be correlated to the 3 major peaks that were present in both the course of frictional force and the real contact surface. This means that, apart from the running-in phase, a correlation between friction force and real contact area was observed. An increase in the real contact area led to a corresponding increase in the coefficient of friction. The results of the real contact area calculations and the recorded friction forces are illustrated in 5.
Microstructural investigations of the laser-textured sample were carried out before and after the rubbing experiment with the FIB. For this experiment, cross-sections were prepared on a reference area and on a rubbed area. In the contact surfaces of the topography maximum, the oxide layer was completely removed, and in the underlying microstructure, significant deformation layers were obtained in the grain orientation contrast (Figure 6).
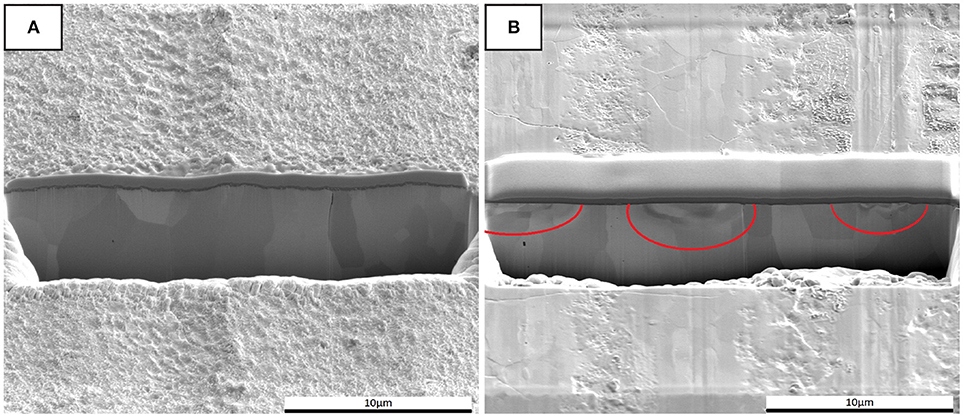
Figure 6. (A) A cross-section through the surface of the laser-structured tungsten sample, where the continuous dark area is platinum applied for the cross-section. The small porous layer underneath is the oxide, for which a layer thickness of up to 480 nm was measured. The tungsten structure with the individual grains is visible below. (B) A cross-section in the wear track after the rubbing experiment. In the contact surfaces of the topography maximum, the oxide layer is completely removed, and in the underlying microstructure, significant deformation layers can be seen in the grain orientation contrast (marked with red circles). The normal force during the experiment was 0.22 N and the speed was 5 mm/s. As a counter-body, an alumina ball with a diameter of 6 mm was used.
4. Discussion
The temporal development of the fractional contact area surface correlates to but is not completely identical to the development of the friction coefficient. The most obvious deviation can be found at the beginning of the curve, where the measured real contact area is close to the zero point and the coefficient of friction rises rapidly in a short term for the first 105 cycles before dropping back down.
The increase in the real contact area at the beginning of the experiment can be explained by the continuous removal of the oxide layer and flattening of the asperities (Figure 4), which increases the surface conformity. The initial height and fluctuating frictional force are a consequence of the formation and disruption of oxide particulate agglomerates. In addition, a plastic deformation of the surface, which takes place primarily at the topography maxima, can lead to a local recrystallization of the microstructure (Figure 6) until a state of equilibrium is formed. The sudden decrease in frictional force is mainly due to the complete removal of the oxide layer after 105 cycles, which is known to contribute to the high frictional resistance (Polcar et al., 2007). Afterwards, there is a purely metallic contact situation. It should be noted that the use of the adapter may lead to a minor contamination of the tungsten surface with steel wear particles. This could also influence the friction coefficient.
After the running-in phase, the basic course of the calculated true contact area and the measured friction forces show comparable behavior. The fact that the behavior of the frictional force depends on the contact area can be further substantiated by observing the topographical images. In Figure 7, there are 3 height profiles: before the friction force peak (cycle 160), at the peak (cycle 188), and after the peak (cycle 220). Notably, in cycles 160 and 220, there are considerably more areas with isolated heights (dark brown/red areas) than in cycle 188. If these heights are missing, the hard counter-body can lie on more of the surface, which leads to an increase in the contact area. This in turn would agree with the calculated course of the contact surface shown in Figure 5.
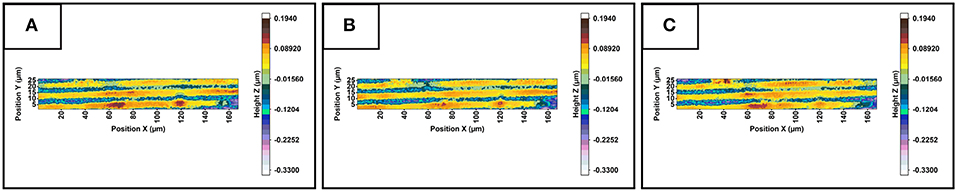
Figure 7. (A) (cycle 160) and (C) (cycle 220) show heights (dark brown/red areas) that are almost not visible in (B) (cycle 188). Due to the missing heights, the counter-body in (B) can lie on more of the surface, which corresponds to the calculated values of the real contact area shown in Figure 5.
After the running-in phase, the real contact area was correlated to the friction force, but some deviations were observed. They were mainly related to the method of calculating the real contact area. Several approximations were used. First, the counter-body, which in reality is a ball with its own surface roughness and a diameter of 6 mm, was assumed in the calculation to be flat with a perfectly smooth surface. Additionally, the SEM images in Figure 6 showed a clear plastic deformation which was not considered in the calculation.
It can be concluded that, despite the approximations, a clear trend and correlation between the real contact area and the frictional force can be observed and proved, which indicates the potential of this method.
5. Conclusion
It was shown that the combination of an in situ tribometer, contact application, and laser-textured surface allows for the estimation of the course of the real contact surface. Thus, it was demonstrated that, after a short run-in period, the course of the friction coefficient correlated directly with the development of the true contact surface. It can be concluded that the increase in the friction coefficient of laser-textured surfaces, as suggested in Gachot et al. (2013), can be attributed to an increase in the real contact area. In addition, the procedure showed much potential despite the deviations. Pastewka's contact application is still under development. If plastic deformations and the surface properties of the counter-body are correctly considered, a very precise calculation of the contact area might be possible.
Data Availability Statement
The Datasets for this work can be found in the Supplementary Materials.
Author Contributions
BL designed the adapter, produced, and characterized the samples before and after the friction process and wrote the manuscript. GO conducted the friction experiment and calculated the real contact area using the contact mechanics code. BL, GO, FM, and MD discussed interpretation of results. MD and FM supervised the project.
Funding
The present work is supported by funding from the Deutsche Forschungsgemeinschaft (DFG, project: MU 959/30-1 and DI 1464/5-1).
Conflict of Interest Statement
The authors declare that the research was conducted in the absence of any commercial or financial relationships that could be construed as a potential conflict of interest.
Acknowledgments
Special thanks go to Valentin Lang from the Chair of Large Area Laser Based Surface Structuring of Prof. Dr. Andrés Lasagni for his help in the production of the samples. And to Dr. Lars Pastewka from Karlsruhe Institute of Technology for providing the contact application for the evaluation of the contact surface.
Supplementary Material
The Supplementary Material for this article can be found online at: https://www.frontiersin.org/articles/10.3389/fmech.2019.00003/full#supplementary-material
References
Aymerich, F. and Pau, M. (2004). Assessment of nominal contact area parameters by means of ultrasonic waves. J. Tribol. 126, 639–645. doi: 10.1115/1.1760764
Bhushan, B. (1998). Contact mechanics of rough surfaces in tribology: multiple asperity contact. Tribol. Lett. 4, 1–35.
Bieda, M., Siebold, M., and Lasagni, A. F. (2016). Fabrication of sub-micron surface structures on copper, stainless steel and titanium using picosecond laser interference patterning. Appl. Surf. Sci. 387, 175–182. doi: 10.1016/j.apsusc.2016.06.100
Feser, T. (2014). Untersuchungen zum Einlaufverhalten binärer α -Messinglegierungen unter Ölschmierung in Abhängigkeit des Zinkgehaltes. KIT Scientific Publishing. doi: 10.5445/KSP/1000041146
Gachot, C., Rosenkranz, A., Reinert, L., Ramos-Moore, E., Souza, N., Müser, M. H., et al. (2013). Dry friction between laser-patterned surfaces: role of alignment, structural wavelength and surface chemistry. Tribol. Lett. 49, 193–202. doi: 10.1007/s11249-012-0057-y
Gerbig, Y., Dumitru, G., Romano, V., Spassov, V., and Haefke, H. (2002). Effects of laser texturing on technical surfaces. Mater. Res. Soc. Symp. Proc. 750, 1–6. doi: 10.1557/PROC-750-Y5.37
Jacobs, T., Junge, T., and Pastewka, L. (2016). Quantitative characterization of surface topography using spectral analysis. arXiv 1607.03040.
Kling, T., Vogler, D., Pastewka, L., Amann, F., and Blum, P. (2018). Numerical simulations and validation of contact mechanics in a granodiorite fracture. Rock Mech. Rock Eng. 51, 2805–2824. doi: 10.1007/s00603-018-1498-x
Korres, S. and Dienwiebel, M. (2010). Design and construction of a novel tribometer with online topography and wear measurement. Rev. Sci. Inst. 81:063904. doi: 10.1063/1.3449334
Li, J., Xiong, D., Dai, J., Huang, Z., and Tyagi, R. (2010). Effect of surface laser texture on friction properties of nickel-based composite. Tribol. Int. 43, 1193–1199. doi: 10.1016/j.triboint.2009.12.044
Mücklich, F., Lasagni, A. F., and Daniel, C. (2006). Laser interference metallurgy – using interference as a tool for micro / nano structuring. Int. J. Mat. Res. 97, 1337–1344. doi: 10.3139/146.101375
Ovcharenko, A., Halperin, G., Etsion, I., and Varenberg, M. (2006). A novel test rig for in situ and real time optical measurement of the contact area evolution during pre-sliding of a spherical contact. Trib. Lett. 23, 55–63.
Pastewka, L. and Robbins, M. O. (2016). Contact area of rough spheres: Large scale simulations and simple scaling laws. Appl. Phys. Lett. 108:221601. doi: 10.1063/1.4950802
Polcar, T., Parreira, N. M., and Cavaleiro, A. (2007). Tungsten oxide with different oxygen contents: sliding properties. Vacuum 81, 1426–1429. doi: 10.1016/j.vacuum.2007.04.001
Sayles, R. S. and Thomas, T. R. (1978). Computer simulation of the contact of rough surfaces. Wear 49, 273–296.
Weber, B., Suhina, T., Junge, T., Pastewka, L., Brouwer, A. M., and Bonn, D. (2018). Molecular probes reveal deviations from Amontons' law in multi-asperity frictional contacts. Nat. Commun. 9:888. doi: 10.1038/s41467-018-02981-y
Keywords: direct laser interference patterning, dry friction, in-situ tribometer, real contact area, asperity contacts
Citation: Lechthaler B, Ochs G, Mücklich F and Dienwiebel M (2019) Evolution of the True Contact Area of Laser Textured Tungsten Under Dry Sliding Conditions. Front. Mech. Eng. 5:3. doi: 10.3389/fmech.2019.00003
Received: 02 November 2018; Accepted: 22 January 2019;
Published: 08 February 2019.
Edited by:
Yu Tian, Tsinghua University, ChinaReviewed by:
Jiliang Mo, Southwest Jiaotong University, ChinaLuciano Afferrante, Politecnico di Bari, Italy
Qunyang Li, Tsinghua University, China
Copyright © 2019 Lechthaler, Ochs, Mücklich and Dienwiebel. This is an open-access article distributed under the terms of the Creative Commons Attribution License (CC BY). The use, distribution or reproduction in other forums is permitted, provided the original author(s) and the copyright owner(s) are credited and that the original publication in this journal is cited, in accordance with accepted academic practice. No use, distribution or reproduction is permitted which does not comply with these terms.
*Correspondence: Björn Lechthaler, Yi5sZWNodGhhbGVyQG14LnVuaS1zYWFybGFuZC5kZQ==