 Yuehong Zheng1,2
 Peiqing La
- 1State Key Laboratory of Advanced Processing and Recycling of Non-ferrous Metals, Lanzhou University of Technology, Lanzhou, China
- 2Key Laboratory of Materials Modification by Laser, Ion and Electron Beams, Ministry of Education, Dalian University of Technology, Dalian, China
It is one of the effective ways to obtain excellent comprehensive performance of 2205 duplex stainless steel (DSS) to adjust the volume ratio and grain size of α and γ phases. In the present paper, 2205 DSSs with micro-nano structures were successfully prepared by aluminothermic reaction under appropriate Fe2O3 excess conditions, and the formation mechanism of micro/nano structures was studied from the aspects of the preparation process, element equivalent, and residual Al content. Here, the Creq/Nieq ratio of the 2205 DSS is 2.09, indicating that the solidification mode belongs to mode F, that is, L → L + α→α→α + γ. The residual Al content and the volume percentages of α and γ phases and their grain sizes can be controlled by reasonably adjusting the excess percentage of Fe2O3. When the excess percentage of Fe2O3 is 5.0%, the volume percentages of α and γ phases reach the minimum and maximum values, respectively. However, when there is a large amount of unreacted Al in the alloy or an inappropriate excess percentage of Fe2O3 for preparation, only the α phase is contained in alloys.
Introduction
In modern industry, the annual consumption of 2205 duplex stainless steel (DSS) has been growing due to its excellent welding and mechanical and corrosion resistance (Wang et al., 2011; Verma and Taiwade, 2017; Gupta et al., 2018; Rosado-Carrasco et al., 2019). It is widely used in shipbuilding, petrochemical industry, deep sea pipeline, and other fields (Ghosh et al., 2012; Stergiou and Papadimitriou, 2012; Yan et al., 2015a, b). However, according to the chemical composition of 2205 DSS [C: ≤0.03, Mn: ≤2.00, P: ≤0.04, S: ≤0.03, Si: ≤1.00, Cr: 21.00∼24.00, Ni: 4.50∼6.50, N: 0.08∼0.20, Mo: 2.50∼3.50, and Fe balance (wt. %)], the contents of chromium and nickel are relatively high, and China is a country lacking in nickel and chromium (Pariser et al., 2018). The rapid development of the DSS industry will inevitably aggravate the shortage of raw materials. Therefore, it is imperative to develop the DSS with low nickel, low cost, and good performance.
For the performance of 2205 DSSs, researchers have studied more about their corrosion resistance (Moteshakker and Danaee, 2016; Xu et al., 2017; Zhao et al., 2017). However, as a structural material, its microstructure and mechanical properties need to be concerned. Traditionally, the performance of 2205 DSSs is mainly improved by heating treatment. For example, Liou et al. (2001) studied the structure and properties of 2205 DSS with a pre-deformation of 5% at room temperature after solid solution and aging treatment; the results showed that transformation from the ferrite phase (α) to the austenite phase (γ) and the precipitation of the second phase significantly affected the balance of strength and ductility of the alloy. Similarly, Luo et al. (Luo and Zheng, 2011) studied the evolution of the structure and properties of hot-rolled 2205 DSS after solution treatment at 1050°C/2 h and then sensitization at 850°C at different times and found that the tensile strength of alloy after sensitizing for 2 h increased to 806 MPa while the elongation decreased to 12.7%. The reason is perhaps that with the extension of sensitization time, a large number of brittle phases precipitated on the α/γ and α/α phase boundaries, resulting in the reduction in plasticity. From these two examples, the improvement of the performance of 2205 DSSs can be seen. The control of the α/γ phase ratio is particularly important. In addition, the heat treatment method usually causes the precipitation of brittle phase and reduces its comprehensive mechanical properties.
In order to achieve the balance between strength and ductility, literature (Liu et al., 2010) reported that adding lanthanum- and cerium-mixed rare earth elements to 2205 DSSs can improve its mechanical properties. When the content of rare earth was 0.046%, the strength was about 780 MPa and the elongation was about 38%, which were 3.97 and 11.67% higher than that of materials without rare earth elements, respectively. This is primarily because the rare earth elements dissolved in the alloy preferentially concentrated in the grain boundary, which inhibited the grain boundary slip and grain growth, increased the grain boundary, increased the resistance of dislocation motion, and then increased the steel strength. While under the effect of external force, the strain difference between the fine grains and near the grain boundaries was small, the deformation was uniform, and the stress was distributed on more grains. Then, the probability of crack propagation caused by stress concentration is reduced, and alloys can bear larger strain before fracture and absorb more energy during fracture, thus improving the plasticity and toughness. Therefore, it can be observed that grain size adjustment is a method to increase both strength and ductility of alloys.
At present, the methods to obtain refined grains mainly include the addition of rare earth elements (Liu et al., 2010) or large plastic deformation (Korznikov et al., 1994; Yanushkevich et al., 2016; Müller et al., 2019). However, economically, these two methods are not appropriate for mass production. Based on the research of grain size control, our research group focused on the preparation of large-size bulk alloys with micro-nano structure by the aluminothermic method. Through the multi-scale structure of the alloy, the strength and toughness of the alloy can be matched. So far, 316L and 304 austenitic stainless steels with excellent comprehensive properties have been successfully prepared (La et al., 2014; Shi et al., 2019).
Therefore, we will try to add Fe2O3 with different excess percentages on the basis of theoretical raw materials, in order to obtain nanocrystalline/microcrystalline multi-scale structure 2205 DSSs with the best morphology and ratio of α and γ phases by aluminothermic reaction. Then, the influence of excessive ratio of Fe2O3 on the microstructure evolution of the alloy will be studied, which provides theoretical guidance for the preparation of high-performance 2205 DSSs.
Experimental
The detailed experimental process for the preparation of 2205 DSSs by aluminothermic reaction is as follows: First, according to its standard chemical composition and chemical reaction equation Fe2O3 + 2Al→2Fe + Al2O3, the weight percent of the standard reaction materials was obtained, as shown in Table 1. On the basis of standard proportion, Fe2O3 was added in excess percentages of 2.5, 5.0, 7.5, 10.0, and 12.5%, respectively, to obtain a series of alloy reaction raw materials. Here, the percentage for excessive Fe2O3 represents the percentage of Fe2O3 powder mass that exceeds that of the standard raw material. For the convenience of description, the excess percentage of Fe2O3 in the standard proportion was described below as 0%. The raw materials used in our work were all powders with a purity of ≧ 99 wt. %. Then, the reactant powder was weighed and placed in a tank of a QM-BP planetary ball mill. Mill balls were Al2O3 balls and the ball-to-material ratio was 1:2, the milling time was 8 h, and rotation speed was 150 r/min, the reaction material was screened out with a sieve and then compacted into Φ85 × 15-mm green bodies with a press (about 35 MPa). Lastly, the green bodies and 2 g of a sheet-like ignition agent were placed in a mold equipped with a copper substrate of aluminothermic reaction equipment.

Table 1. Standard proportion of 2205 DSS reaction raw materials.
Subsequently, the closed autoclave was filled with 2 MPa argon at room temperature, and then 1.5 MPa of argon was discharged to exhaust the air in the autoclave after a few minutes. When the temperature was raised to 200°C, the remaining argon was discharged again to release water vapor and residual air. Then, the autoclave was refilled with 5 MPa argon and the temperature increased. As the temperature reached about 260°C, the ignition agent started to react and released a large amount of heat, which caused the reaction between the reaction materials. The reaction combustion wave quickly spread from the top to the bottom of the reaction material, and the reactants were converted into products in the reaction zone. Simultaneously, the products were melted into a superheated liquid under the heat released by the reaction itself. The furnace was cooled to room temperature under argon. Finally, gray Al2O3 layers on the surface of 2205 DSSs were manually removed to obtain the as-cast samples.
The as-cast alloys were cut into rectangular samples of 12 mm× 12 mm× 5 mm by wire cutting. Structural analysis was performed using an X-ray diffractometer (XRD, D8 ADVANCE, Karlsruhe, Germany) (λCu–Kα = 0.154056 nm). After the sample surface was corroded by aqua regia, the metallographic structure was analyzed with an optical metallographic microscope (MeF3, Wetzlar, Germany), and the element distribution was observed using electron probe microanalysis (EPMA-1600, Kyoto, Japan). A scanning electron microscope (SEM, JSM-6700F, Tokyo, Japan) was utilized to observe the surface morphology, and energy dispersion spectroscopy (EDS) analysis was performed on typical morphology regions. An electron backscatter diffraction (EBSD, ztecX-Max80, Oxford, United Kingdom) probe on a SEM (Quanta 450 FEG, Hillsboro, United States) was used to analyze grain orientation and grain size. Further, the microstructure was observed with a transmission electron microscope (TEM, JEM-2010, Tokyo, Japan) operating at 200 kV. TEM samples were thinned by electrolysis using a dual spray electrolyzer. The electrolyte is a mixed solution of 2 vol. % perchloric acid and 98 vol. % alcohol.
Results
Figure 1 shows XRD patterns of 2205 DSSs prepared with different Fe2O3 excess percentages. When the Fe2O3 excess percentage is 0%, only the diffraction peak of the body-centered cubic α phase appears, and there is no diffraction peak of the γ phase. When the Fe2O3 excess percentage is 2.5%∼10.0%, the patterns are mainly composed of diffraction peaks of α and γ phases. For the excess percentage of 12.5%, only a single-phase diffraction peak of α phase appears. In addition, for alloys prepared with the Fe2O3 excess percentages of 2.5 and 5.0%, σ phase diffraction peaks also appear, and the intensity of σ phase diffraction peaks in the latter was greater.
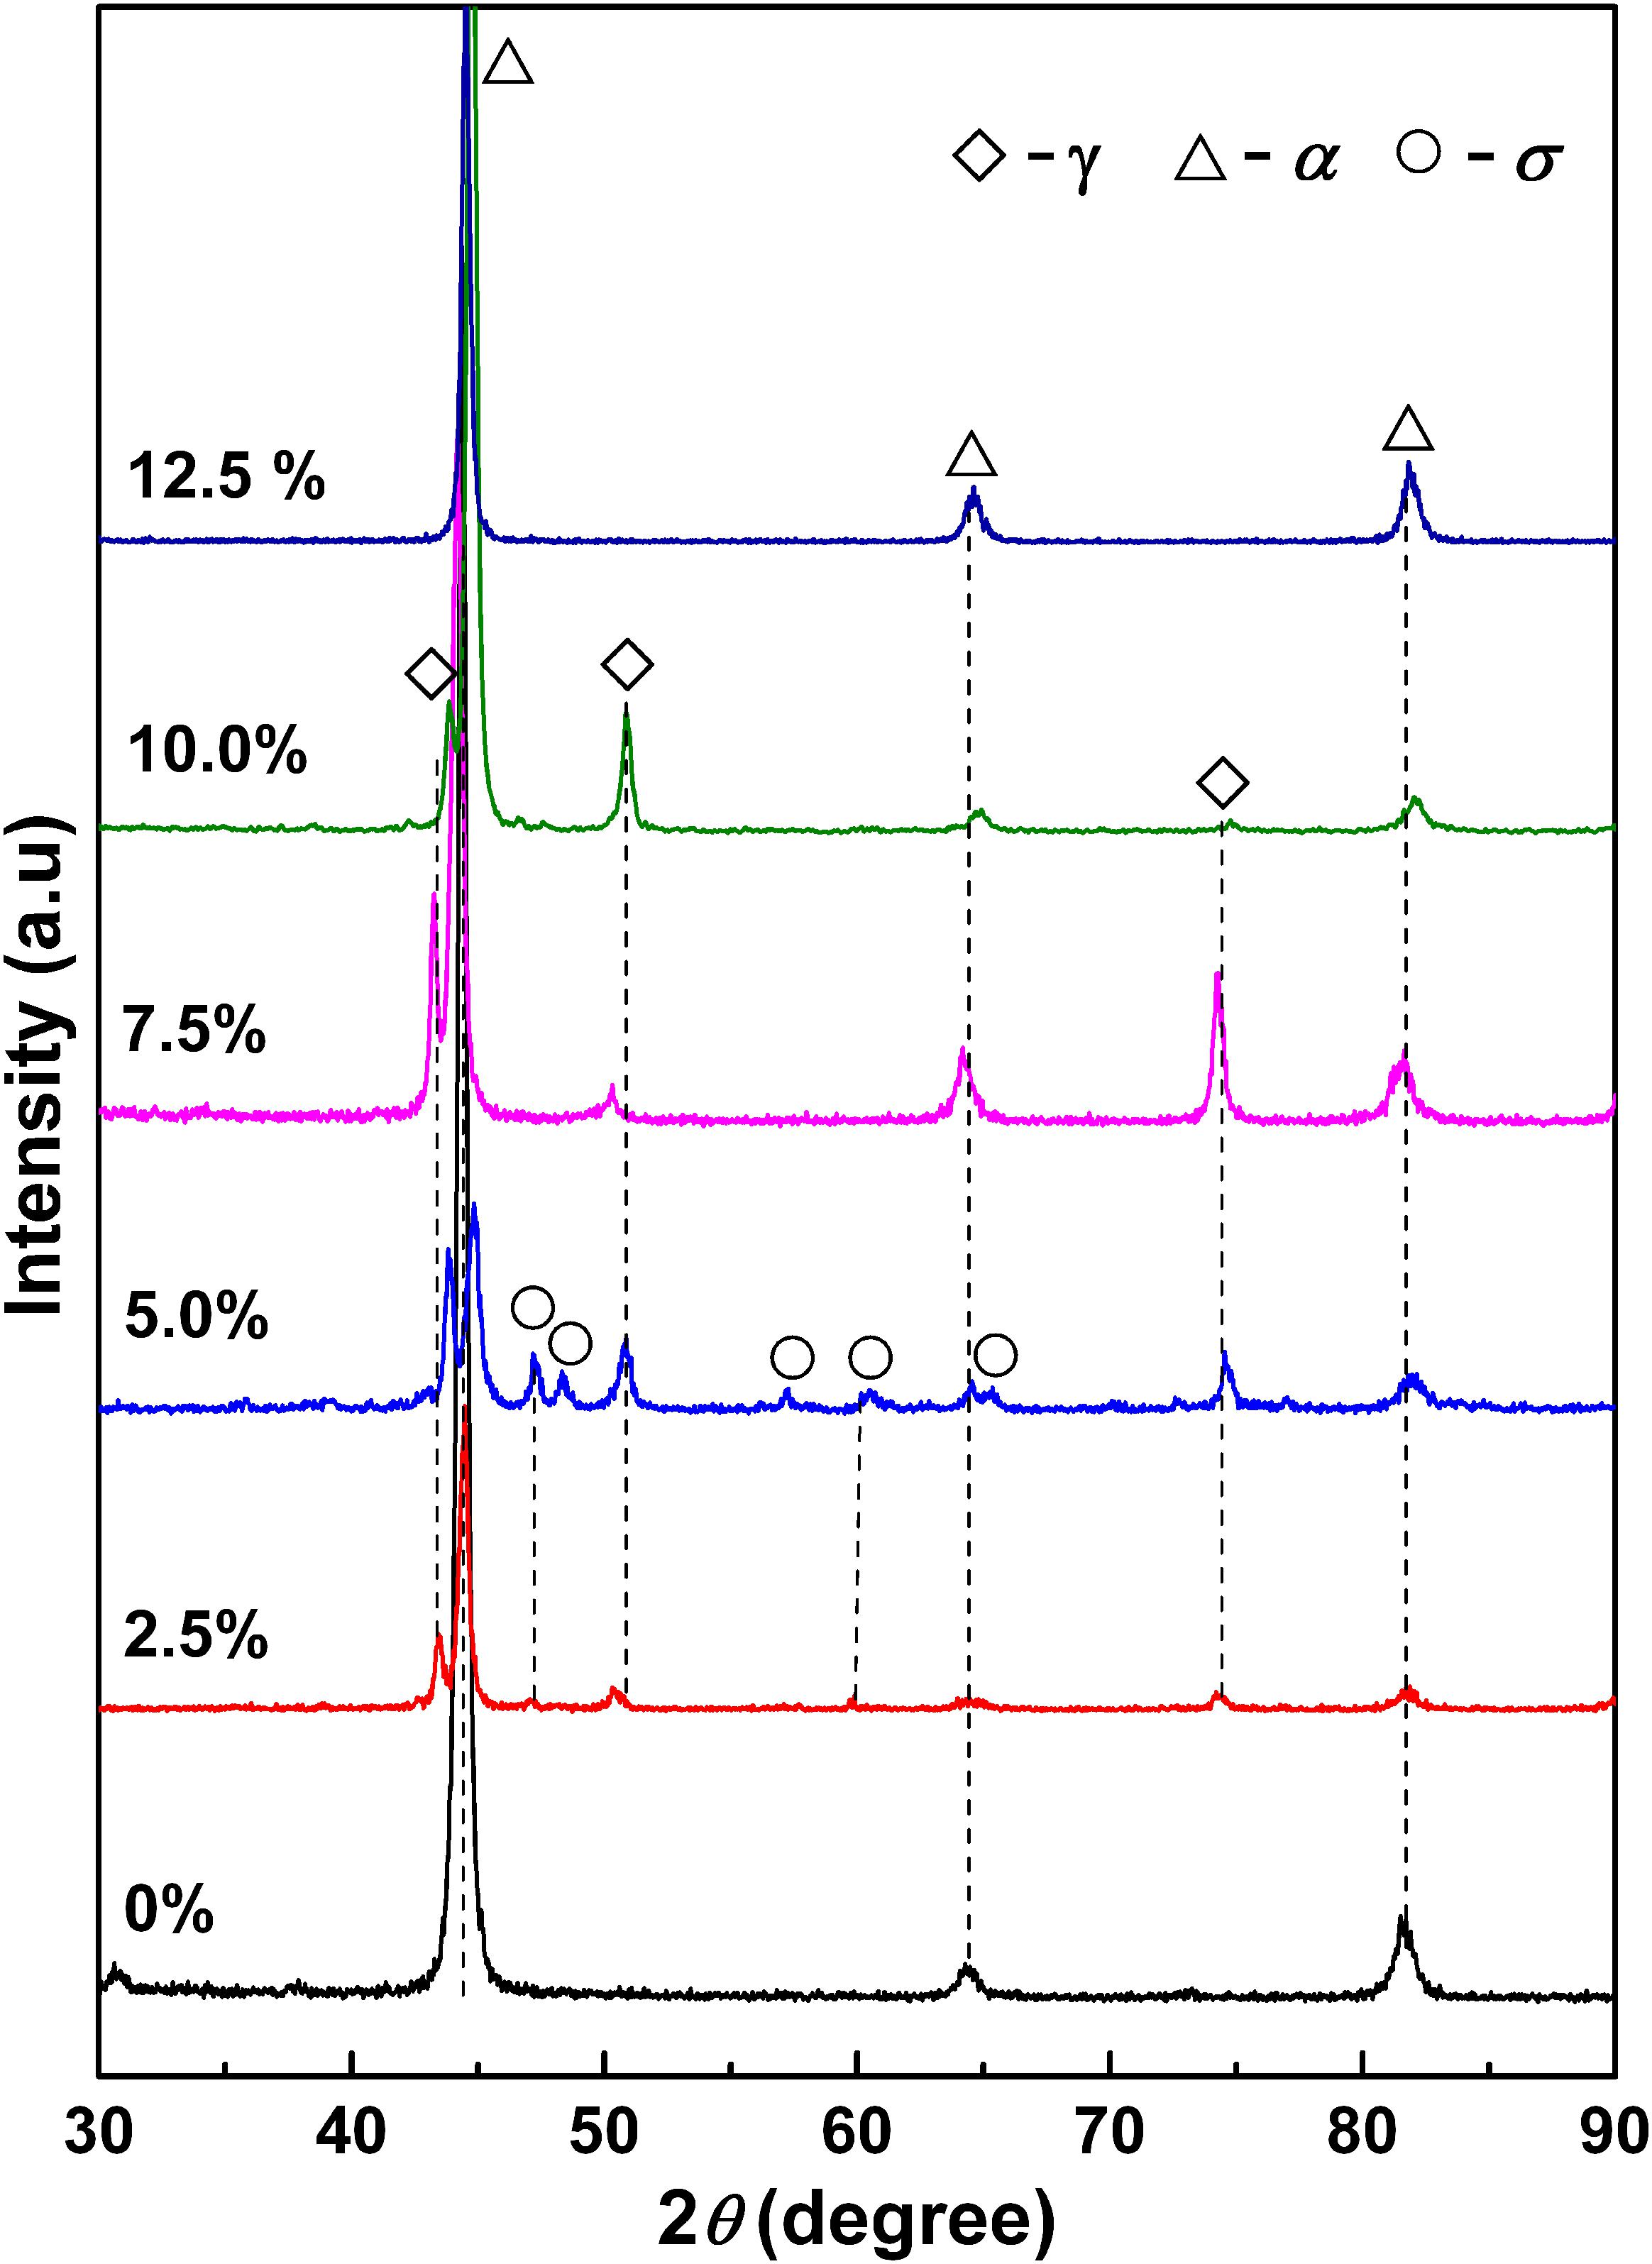
Figure 1. X-ray diffractometer patterns of 2205 DSSs prepared with different Fe2O3 excess percentages.
The metallographic results of 2205 DSS prepared at different Fe2O3 excess percentages are shown in Figure 2. When the Fe2O3 excess percentage is 0%, the alloy consists of a gray matrix and black particles. According to statistics of multiple metallographic images by professional software, the gray matrix and black particles accounted for 92.59 and 7.41%, respectively. Combined with XRD, the gray matrix can be determined as the α phase. For Fe2O3 excess percentages of 2.5 and 5.0%, the alloys are composed of gray matrix and white island-like and black particulate regions, while for Fe2O3 excess percentages of 7.5 and 10.0%, the alloy is mainly composed of a white matrix and irregular gray phases. However, when the excess percentage of Fe2O3 is 12.5%, the alloy is composed of a gray matrix, white strips, and black particles, and it can be clearly seen that the alloy structure has a preferred orientation. According to the XRD patterns (Figure 1), it can be preliminarily determined that the white phase area is the γ phase; whether the black particles are all σ phase needs to be further analyzed. Obviously, with the increase in Fe2O3 content, the volume percentage of the α phase decreases first and then increases, while that of the γ phase increases first and then decreases. When the Fe2O3 excess percentage is 5%, the volume percentages of gray and white reach the lowest and the highest, respectively.
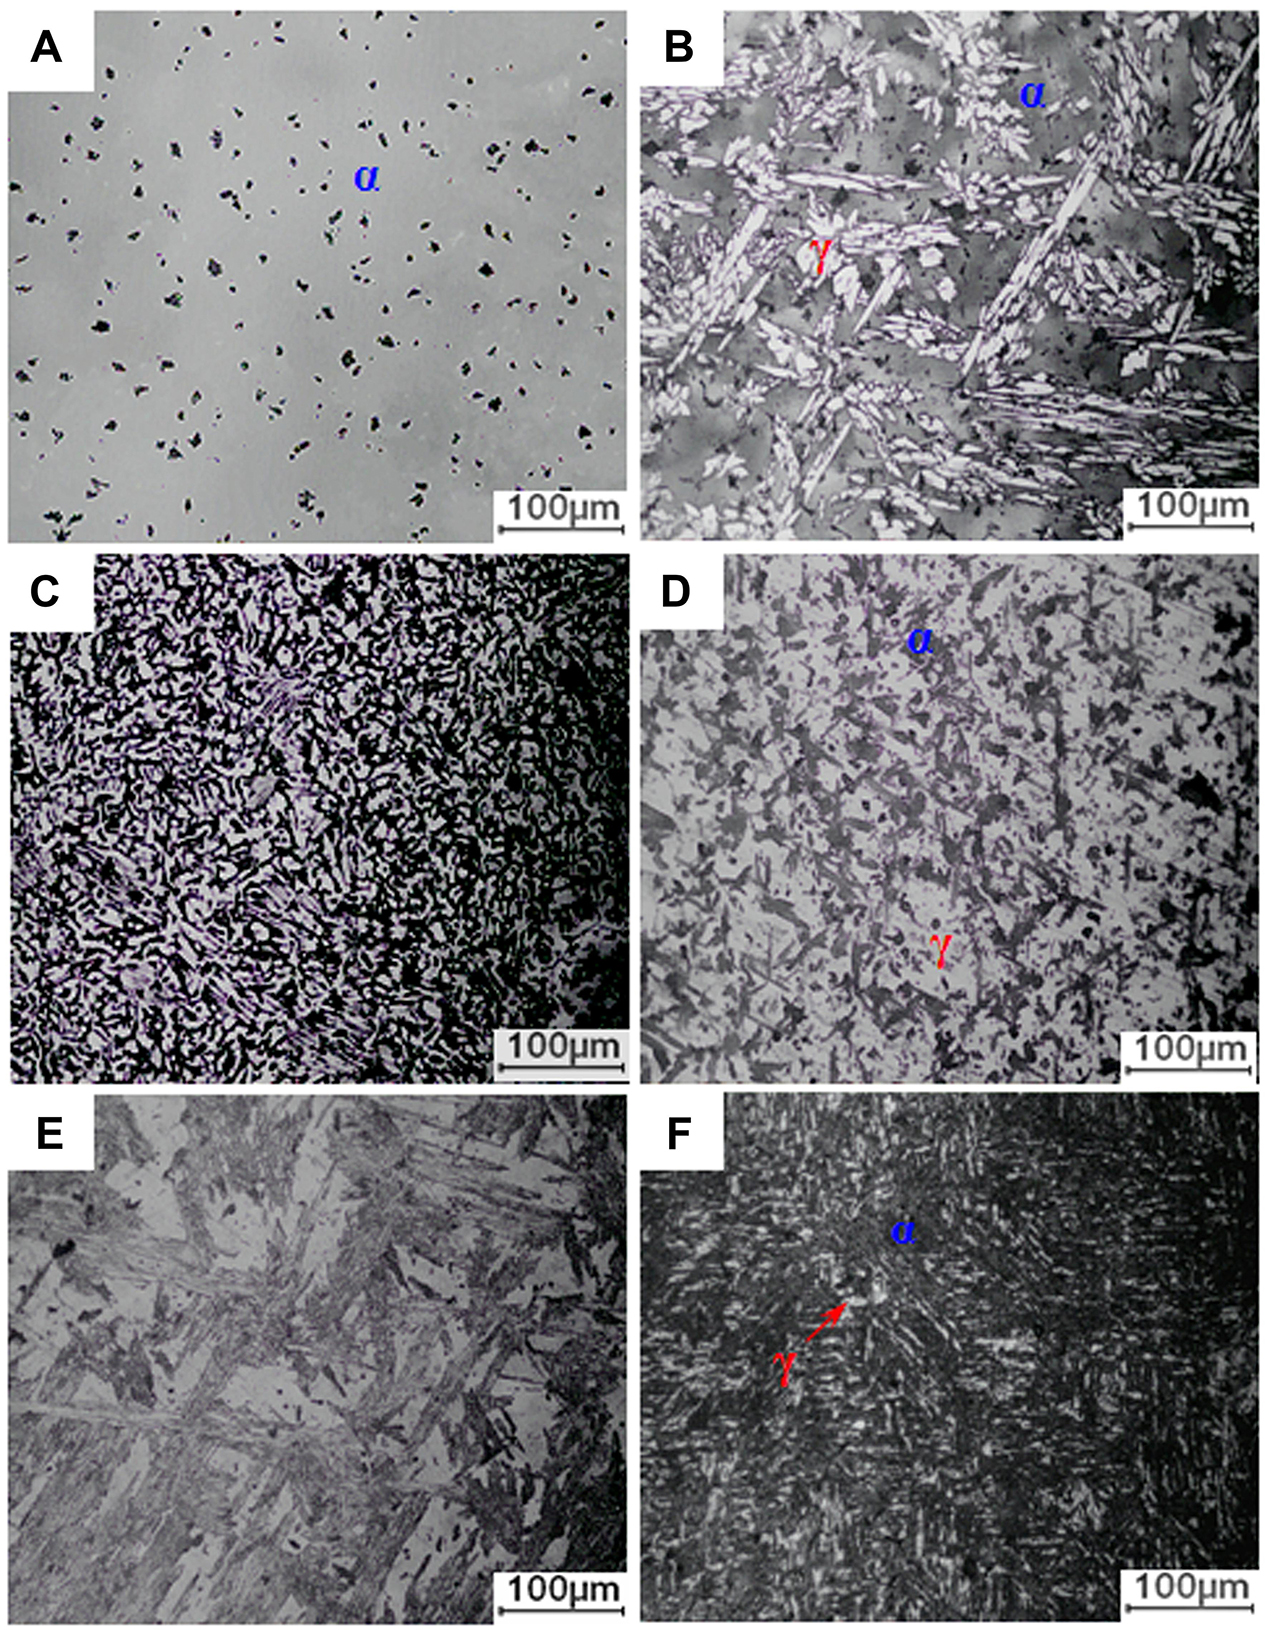
Figure 2. Metallographic images of 2205 DSSs prepared with different Fe2O3 excess percentages: (A) 0%, (B) 2.5%, (C) 5.0%, (D) 7.5%, (E) 10.0%, and (F) 12.5%.
Figure 3 shows EPMA backscattered electron images (BEIs) of 2205 DSS prepared with different Fe2O3 excess percentages and their corresponding element mappings, which can be used to qualitatively analyze the distribution of individual elements in the alloys. For the Fe2O3 excess percentage of 0% (Figure 3a), except for the matrix α phase, there are spot-like Fe-depleted regions in the alloy, a part of C and Cr is enriched in the Fe-depleted region, and Al and N correspond to a spot-like enrichment. It can be concluded preliminarily that the black particles in the BEIs are an inclusion of AlN and CrC. When Fe2O3 is excessive (Figures 3b–f), the spot-like Fe-depleted regions are significantly smaller than those in Figure 3a, while in the Fe-like depleted regions, C and Cr, Al and N, or the corresponding enrichment of Si and C, that is, the black particles in the BEIs, are mainly AlN, CrC, and SiC inclusions. In addition, Fe-Cr-Mn or Fe-Cr-C-Mn intermetallic compound particles also exist in some alloys. As the excess percentage of Fe2O3 increases, the Al content gradually decreases. When the excess percentage is 12.5%, the distribution of Al disappears in the alloy.
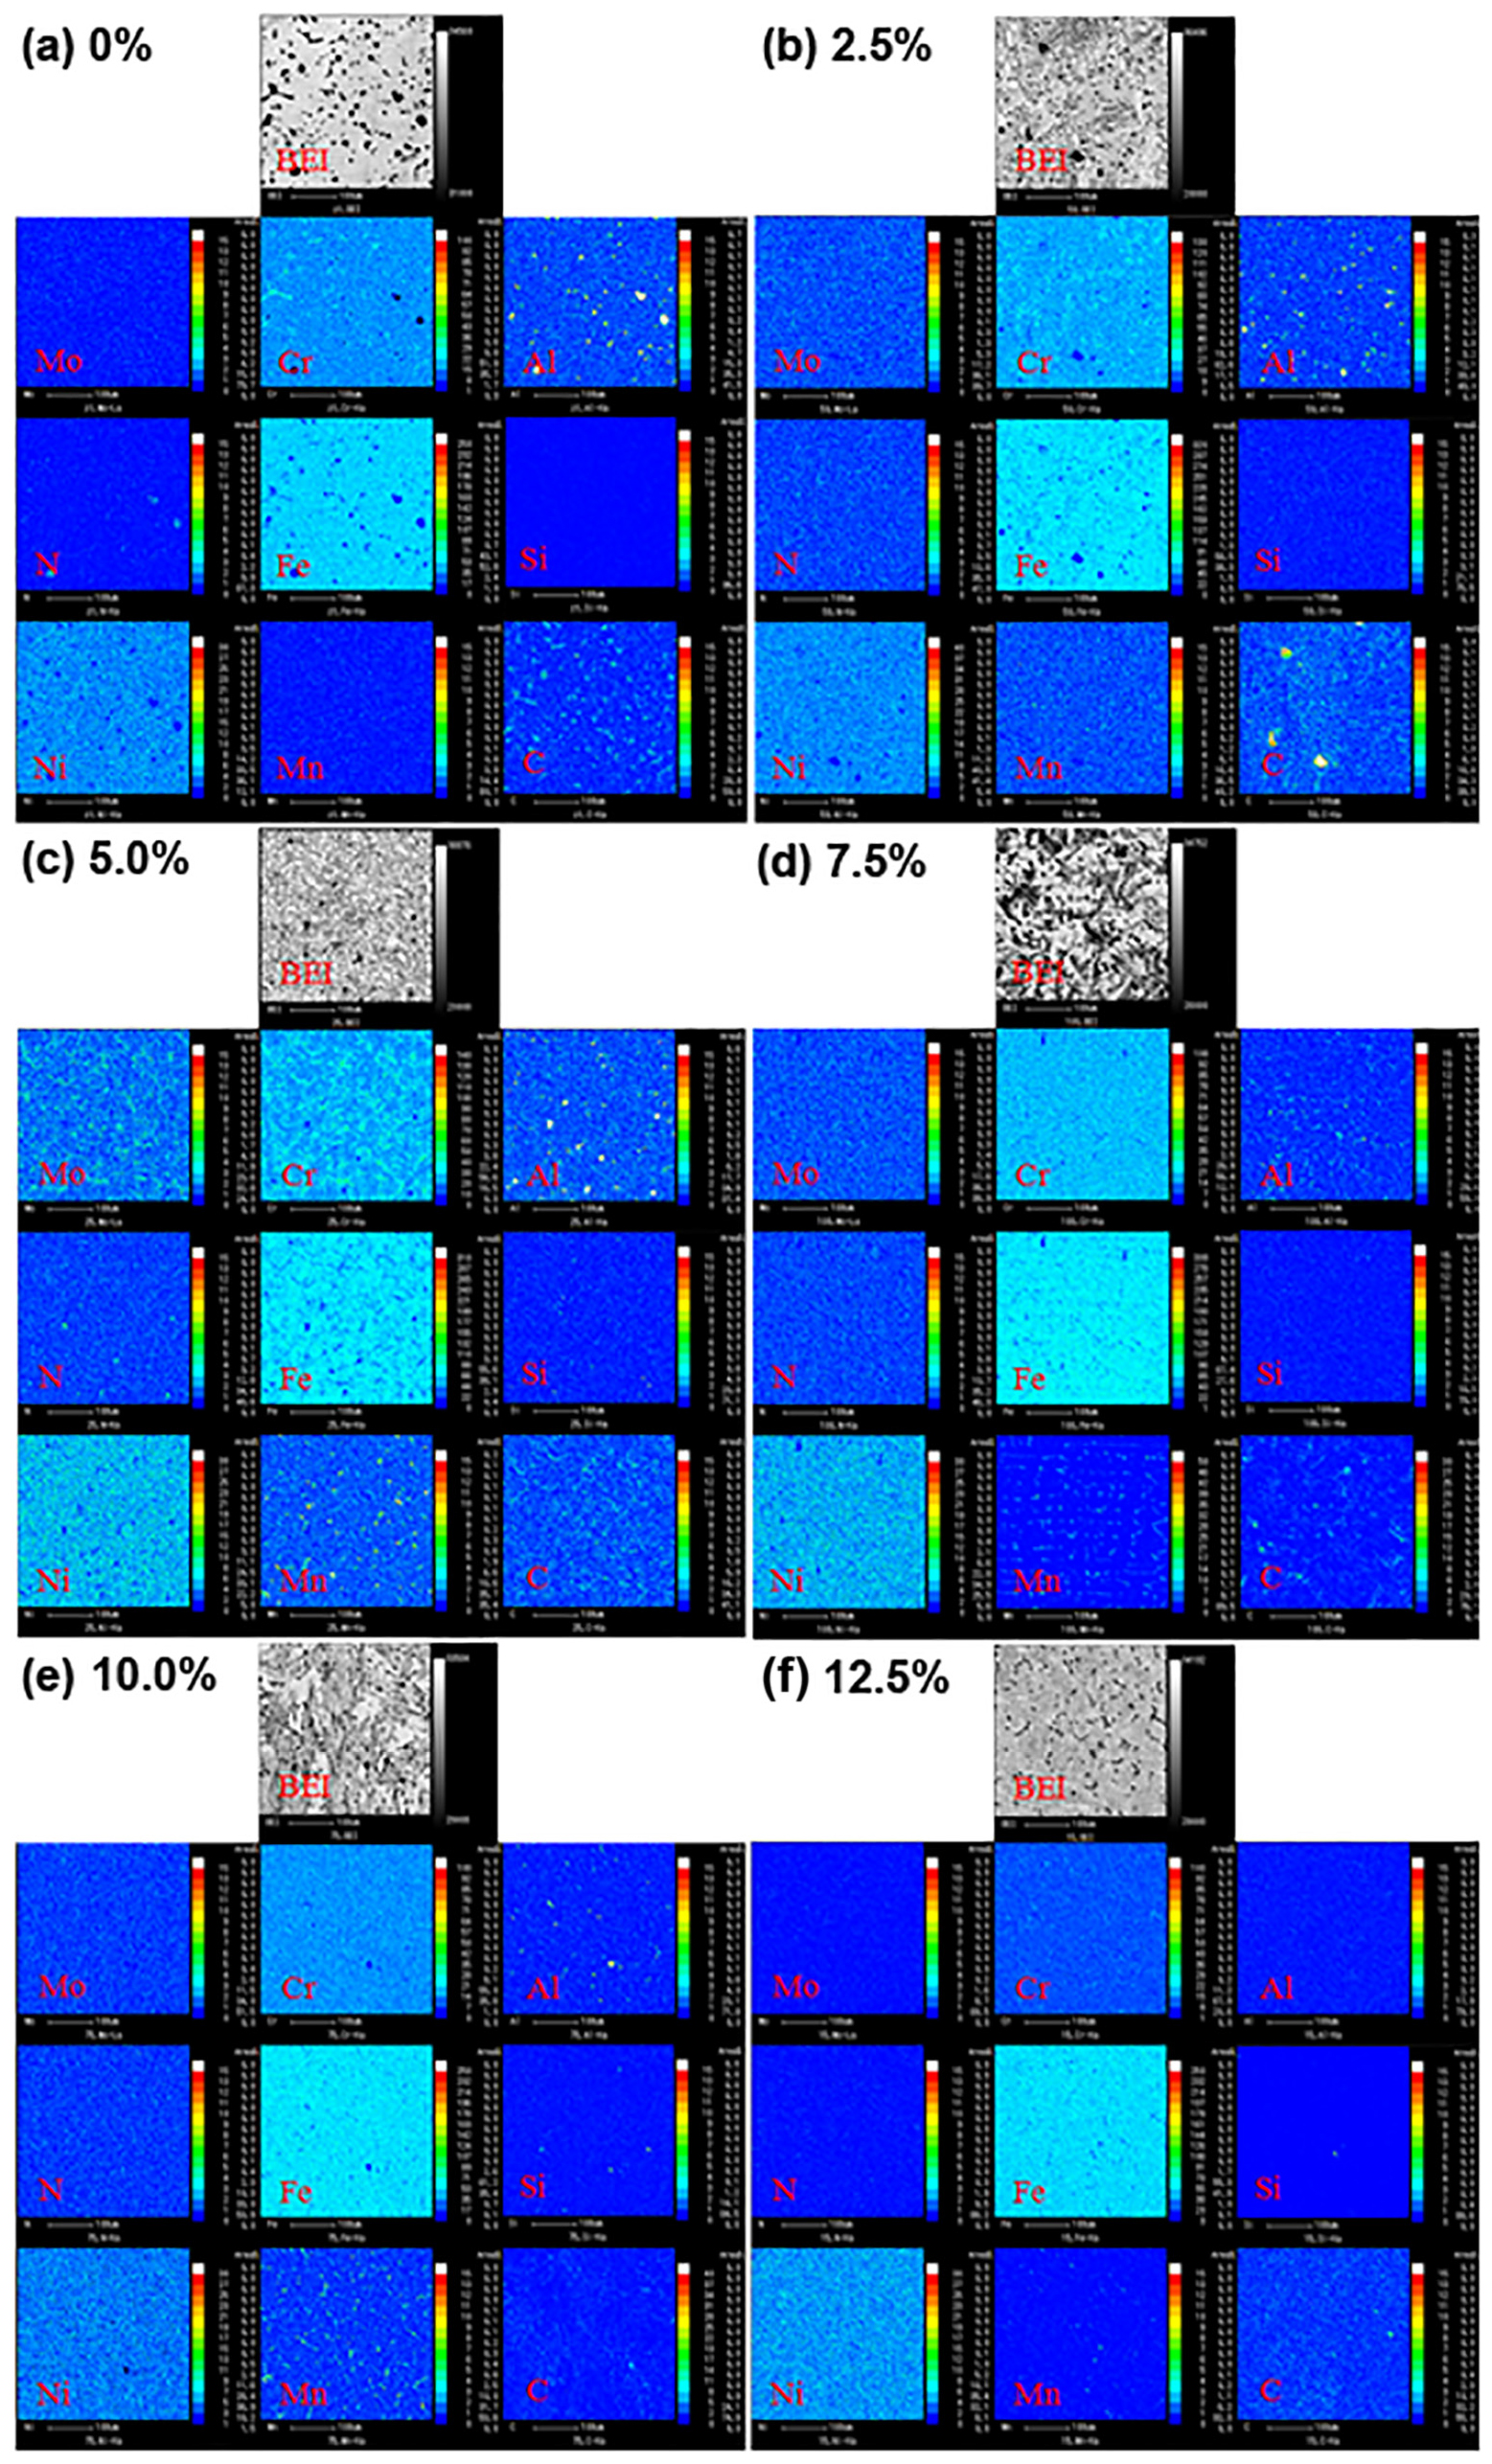
Figure 3. EPMA backscattered electron images (BEIs) of 2205 DSS prepared with different Fe2O3 excess percentages and their corresponding element mappings: (a) 0%, (b) 2.5%, (c) 5.0%, (d) 7.5%, (e) 10.0%, and (f) 12.5%.
Figure 4 shows SEM results of 2205 DSS prepared at different Fe2O3 excess ratios, and the typical morphologies in each alloy are numbered and analyzed in order. The results are listed in Table 2. For the Fe2O3 excess percentage of 0% (Figure 4A), comparing Figure 2A, it can be seen that the black phase on the metallographic image is composed of black particles and white needle-like phases, and some white needle-like phases precipitate around the black particles. As can be seen from Table 2, the black particles are AlN inclusion, and the white needle-like phases are σ phases composed of Fe-Cr-C-Mo. However, element mapping shows that Mo is uniform in the alloy, mainly because Mo is a trace element and the content in the white needle-like phases is not different from that in the matrix. Combining the results of XRD, EPMA, and EDS, it can be determined that the dark gray matrix on the metallographic image is α phase, and the black phase is composed of AlN inclusion and σ phase. In addition, it can be known from Table 2 that the 2205 DSS prepared in the normal proportion is consistent with the theoretical standard composition, except that the Al content is high.
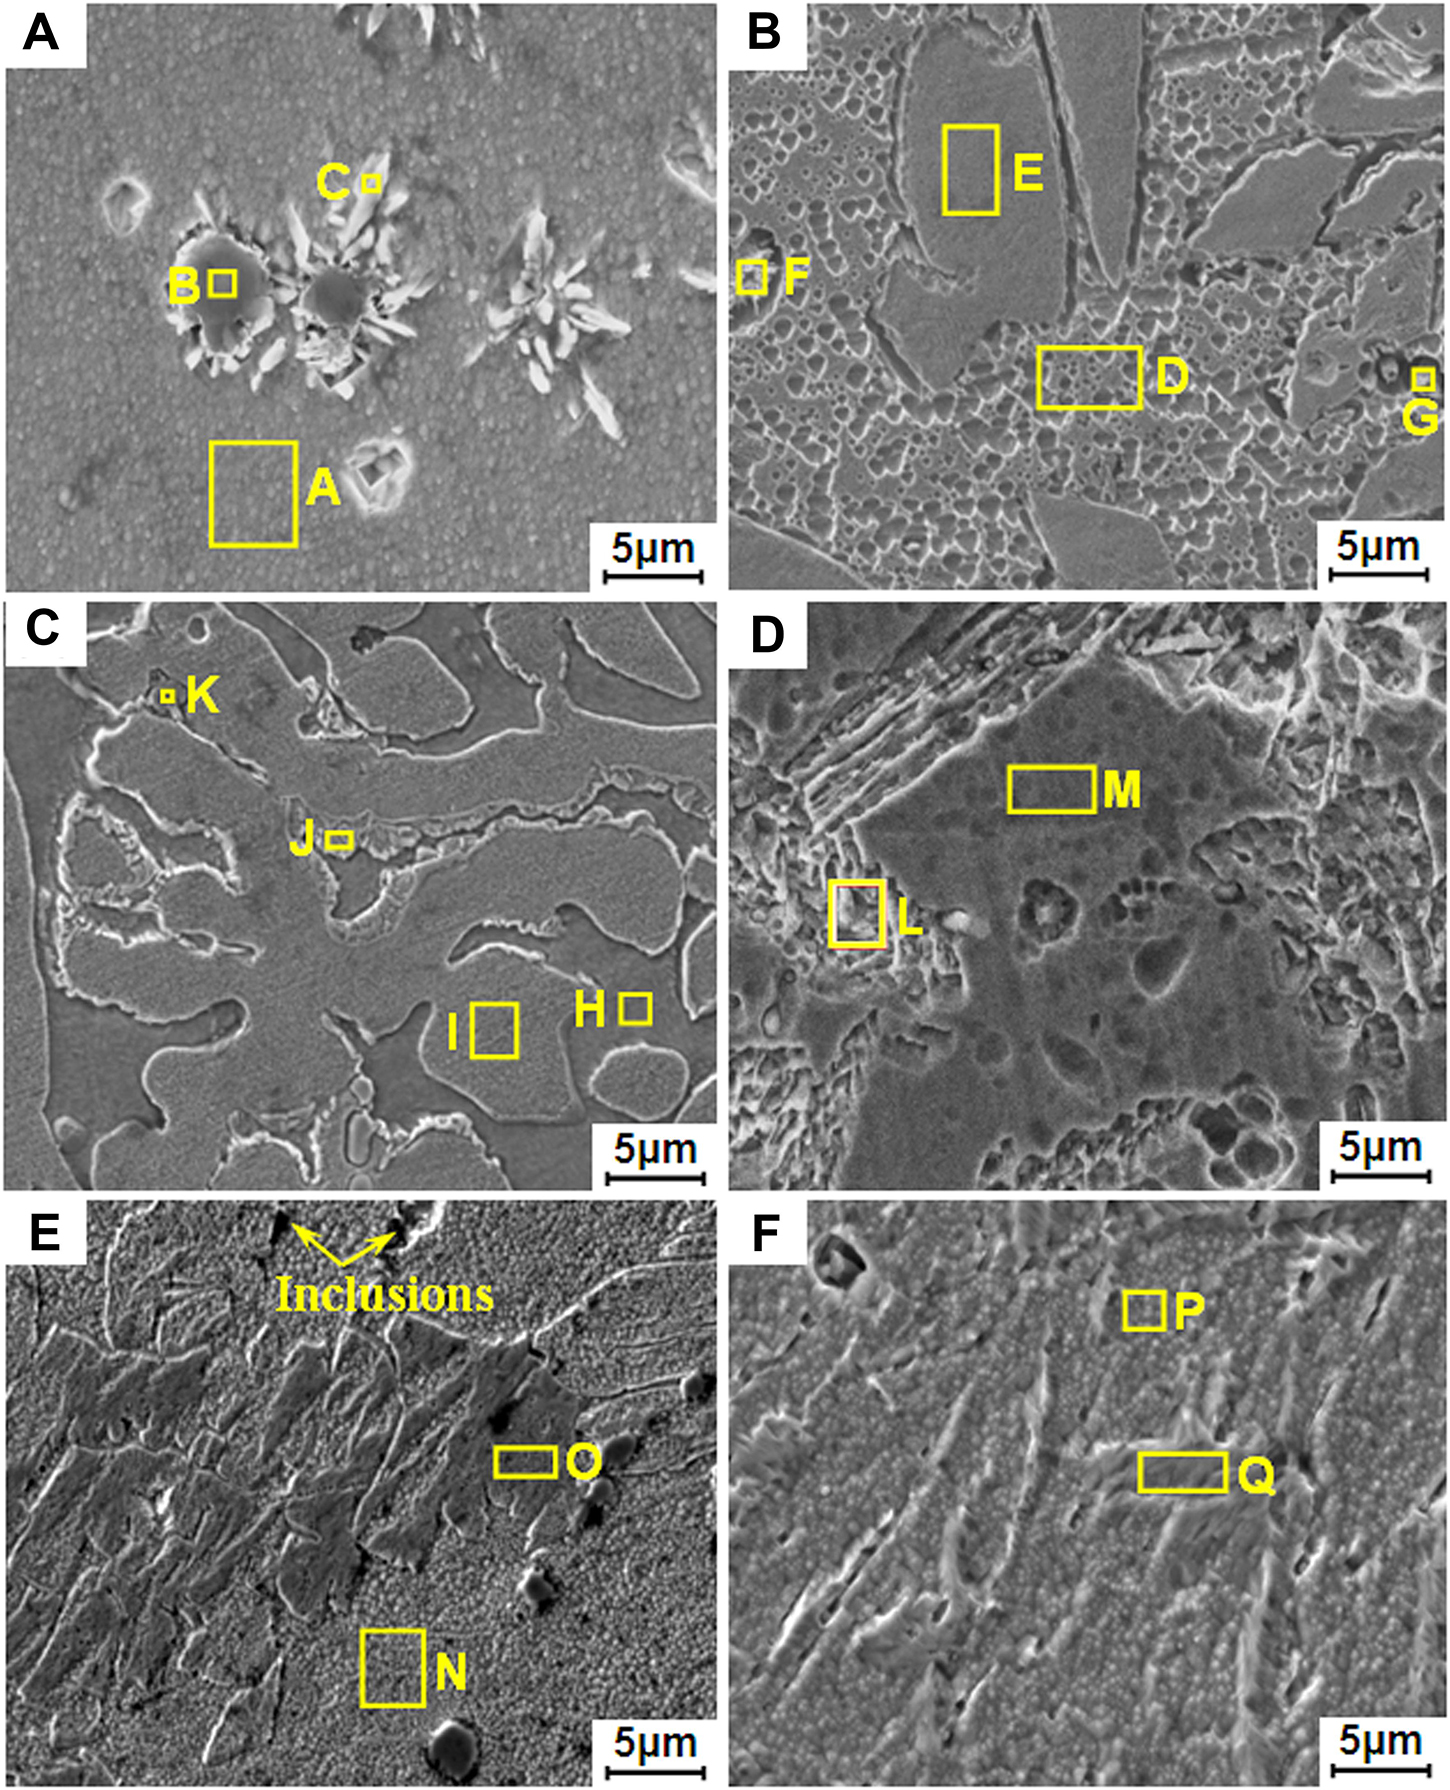
Figure 4. Scanning electron microscope results of 2205 DSSs prepared with different Fe2O3 excess percentages: (A) 0%, (B) 2.5%, (C) 5.0%, (D) 7.5%, (E) 10.0%, and (F) 12.5%.
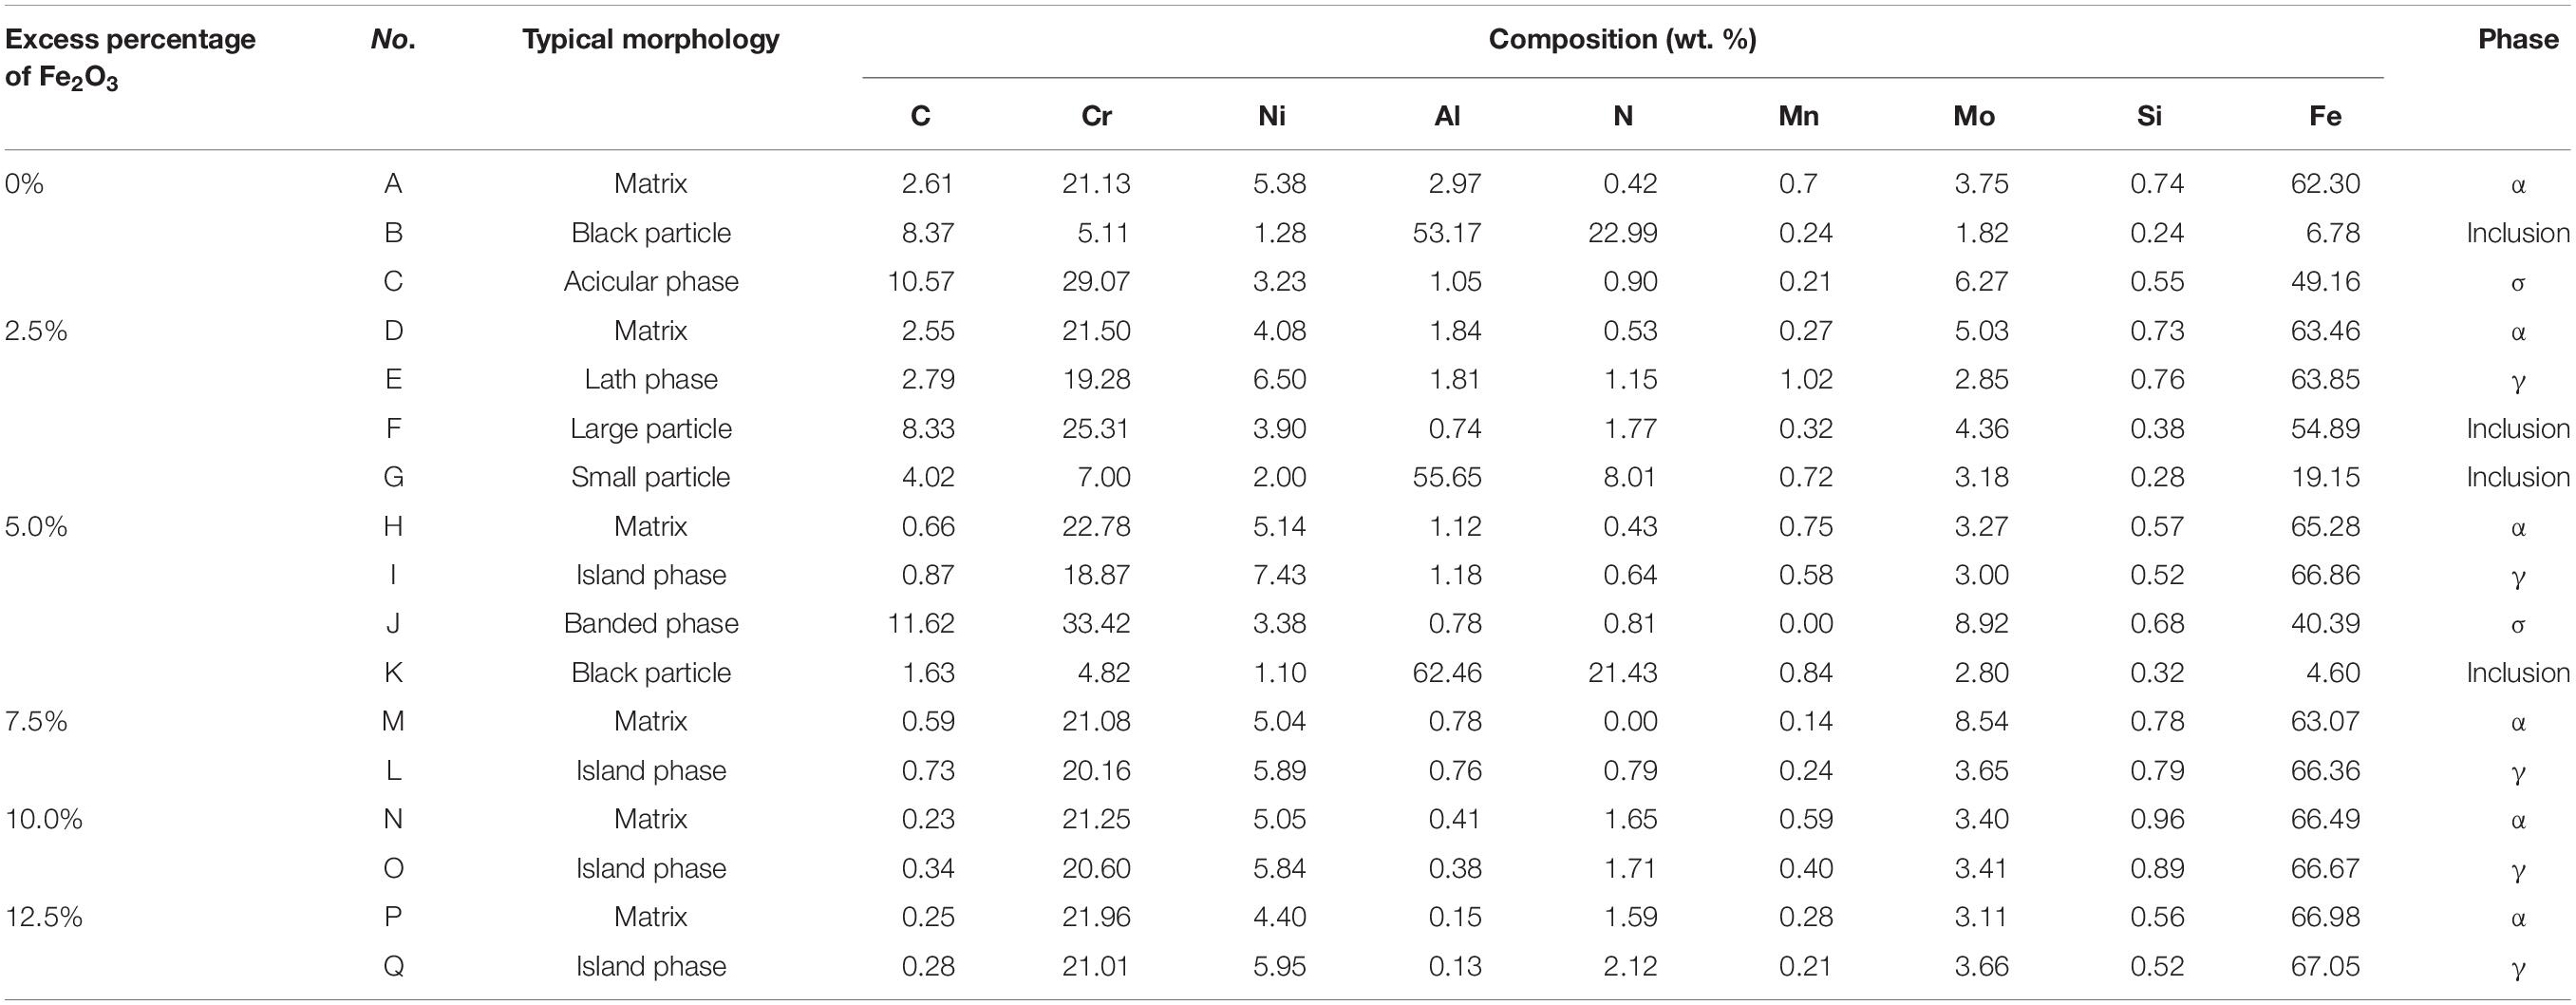
Table 2. Elemental weight percentage of typical regions in the alloys.
As can be seen from Figures 4B–F, alloys prepared with the Fe2O3 excess ratios of 2.5, 5, 7.5, 10, and 12.5% are mainly composed of concave and convex phases. The EDS results show that compared with the convex phase, the concave phase (matrix phase) is richer in Cr and depleted in Ni, and Cr and Ni are ferrite and austenitic elements, respectively. Therefore, it can be determined that the etched concave phase is α phase, and the unetched convex phase is γ phase. It can be known from Table 2 that the composition of 2205 DSSs prepared with excessive Fe2O3 is within the standard composition range, but the alloy contains a certain amount of Al.
In addition to the α and γ phases, there are other typical morphologies in the alloys, such as a small amount of small particles with high C/Cr or Al/N content, which can be determined as AlN and CrC inclusions. When Fe2O3 is in excess of 5%, there is a σ phase composed of Fe-Cr-C-Mo around the γ phase. When the Fe2O3 is excessive by 7.5%, Mo content in the α phase is high, indicating that the α phase contains a small amount of the σ phase, while a small amount of Fe-Cr-C-Mn intermetallic compounds were found when Fe2O3 was excessive by 7.5, 10, and 12.5%.
After further statistical analysis of multiple SEM pictures by professional software, the volume fractions of α and γ phases in each alloy can be roughly obtained. Figure 5 shows the Al content and the volume fractions of α and γ phases (b) in 2205 DSSs prepared with different Fe2O3 excess percentages. Obviously, with the excessive addition of Fe2O3, Al gradually decreases. The volume percentage of the α phase decreases first and then increases, while the volume percentage of the γ phase shows an opposite trend.
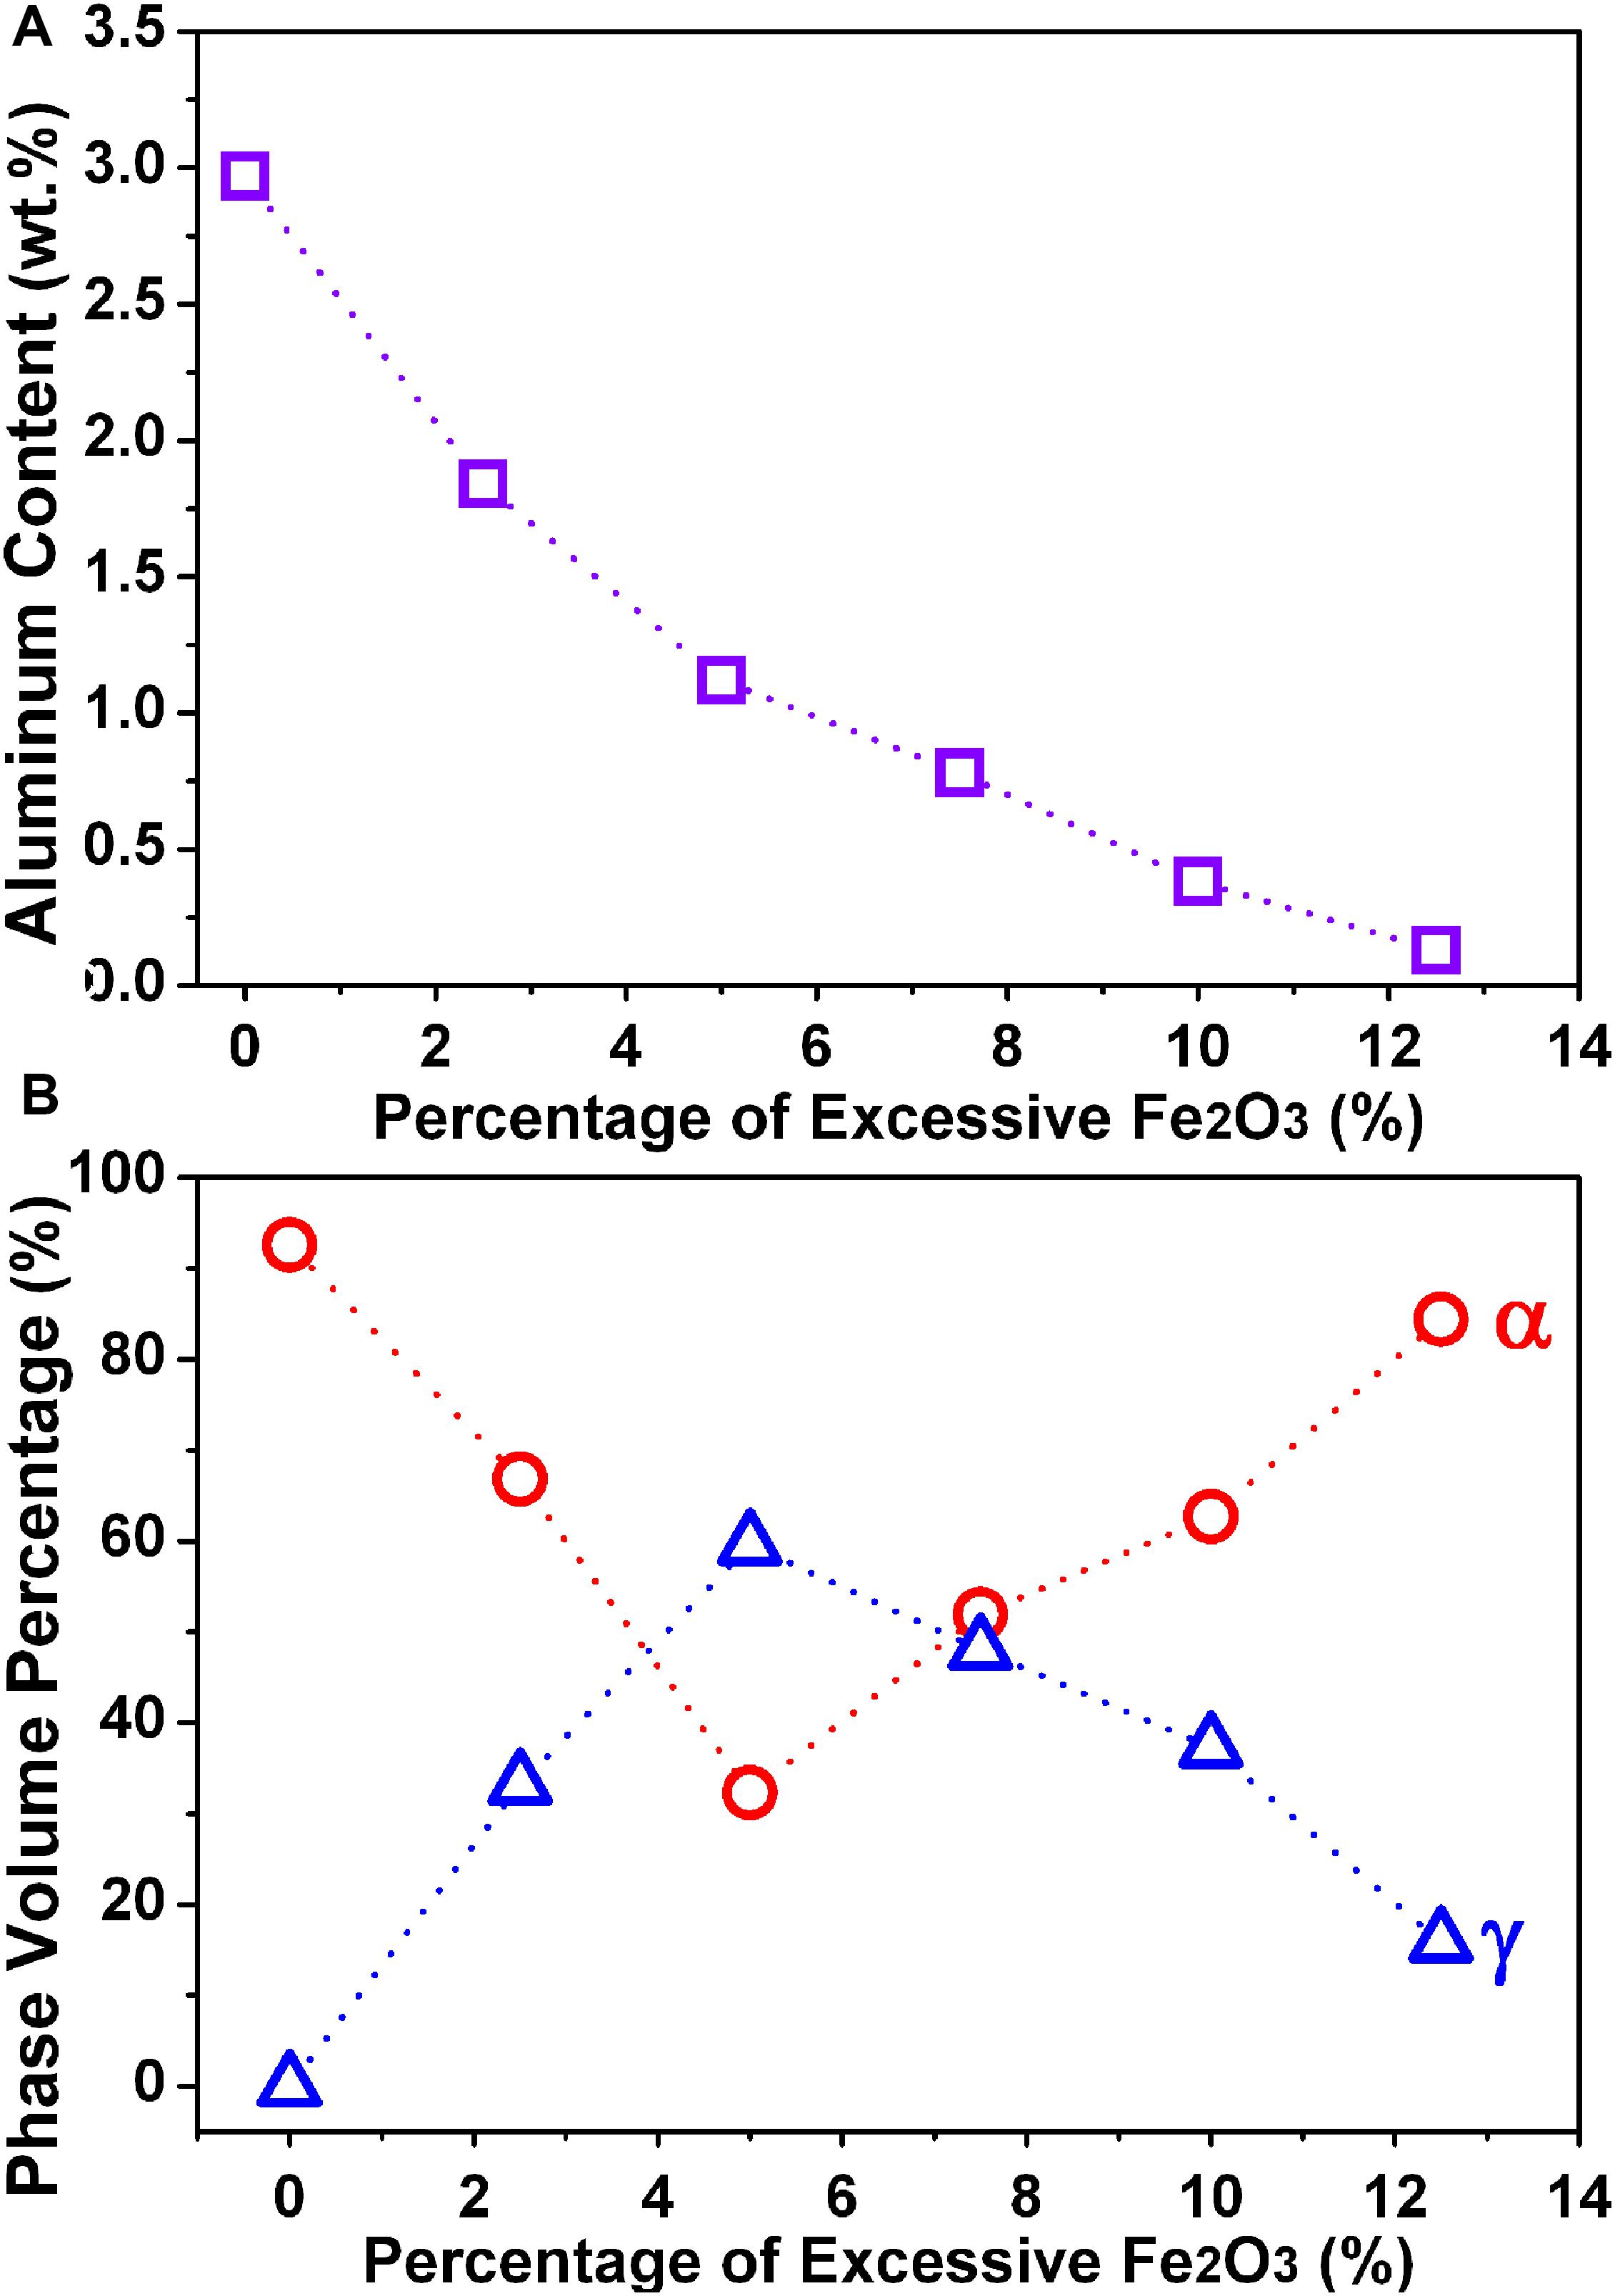
Figure 5. Relationship between the excess percentage of Fe2O3 and the Al content (A) and the volume fractions of α and γ phases (B) in 2205 DSSs.
However, according to literatures (Chai et al., 2018; Chen et al., 2019), EBSD and TEM analysis can obtain more information about the structure and grain size of alloys. Therefore, the EBSD and TEM analysis was further performed on some typical samples. Figure 6 shows the grain orientation, phase distribution image, and grain size relative frequency of γ and α phases in the 2205 DSS prepared by a 5% excess of Fe2O3. Here, EBSD results (Figures 6a,b) explain the distribution of the two main phases, which can be seen to be consistent with the metallographic structures and SEM morphologies. The grain size distribution diagrams (Figures 6c,d) also show that micro- and nano-crystals are present in the alloy, and the grain sizes are mainly distributed in the range of 0.25∼0.75 μm. Due to the limited resolution of EBSD, the interpretation of smaller grains is not very sensitive, and the presence of nanocrystalline in the alloy requires further TEM analysis.
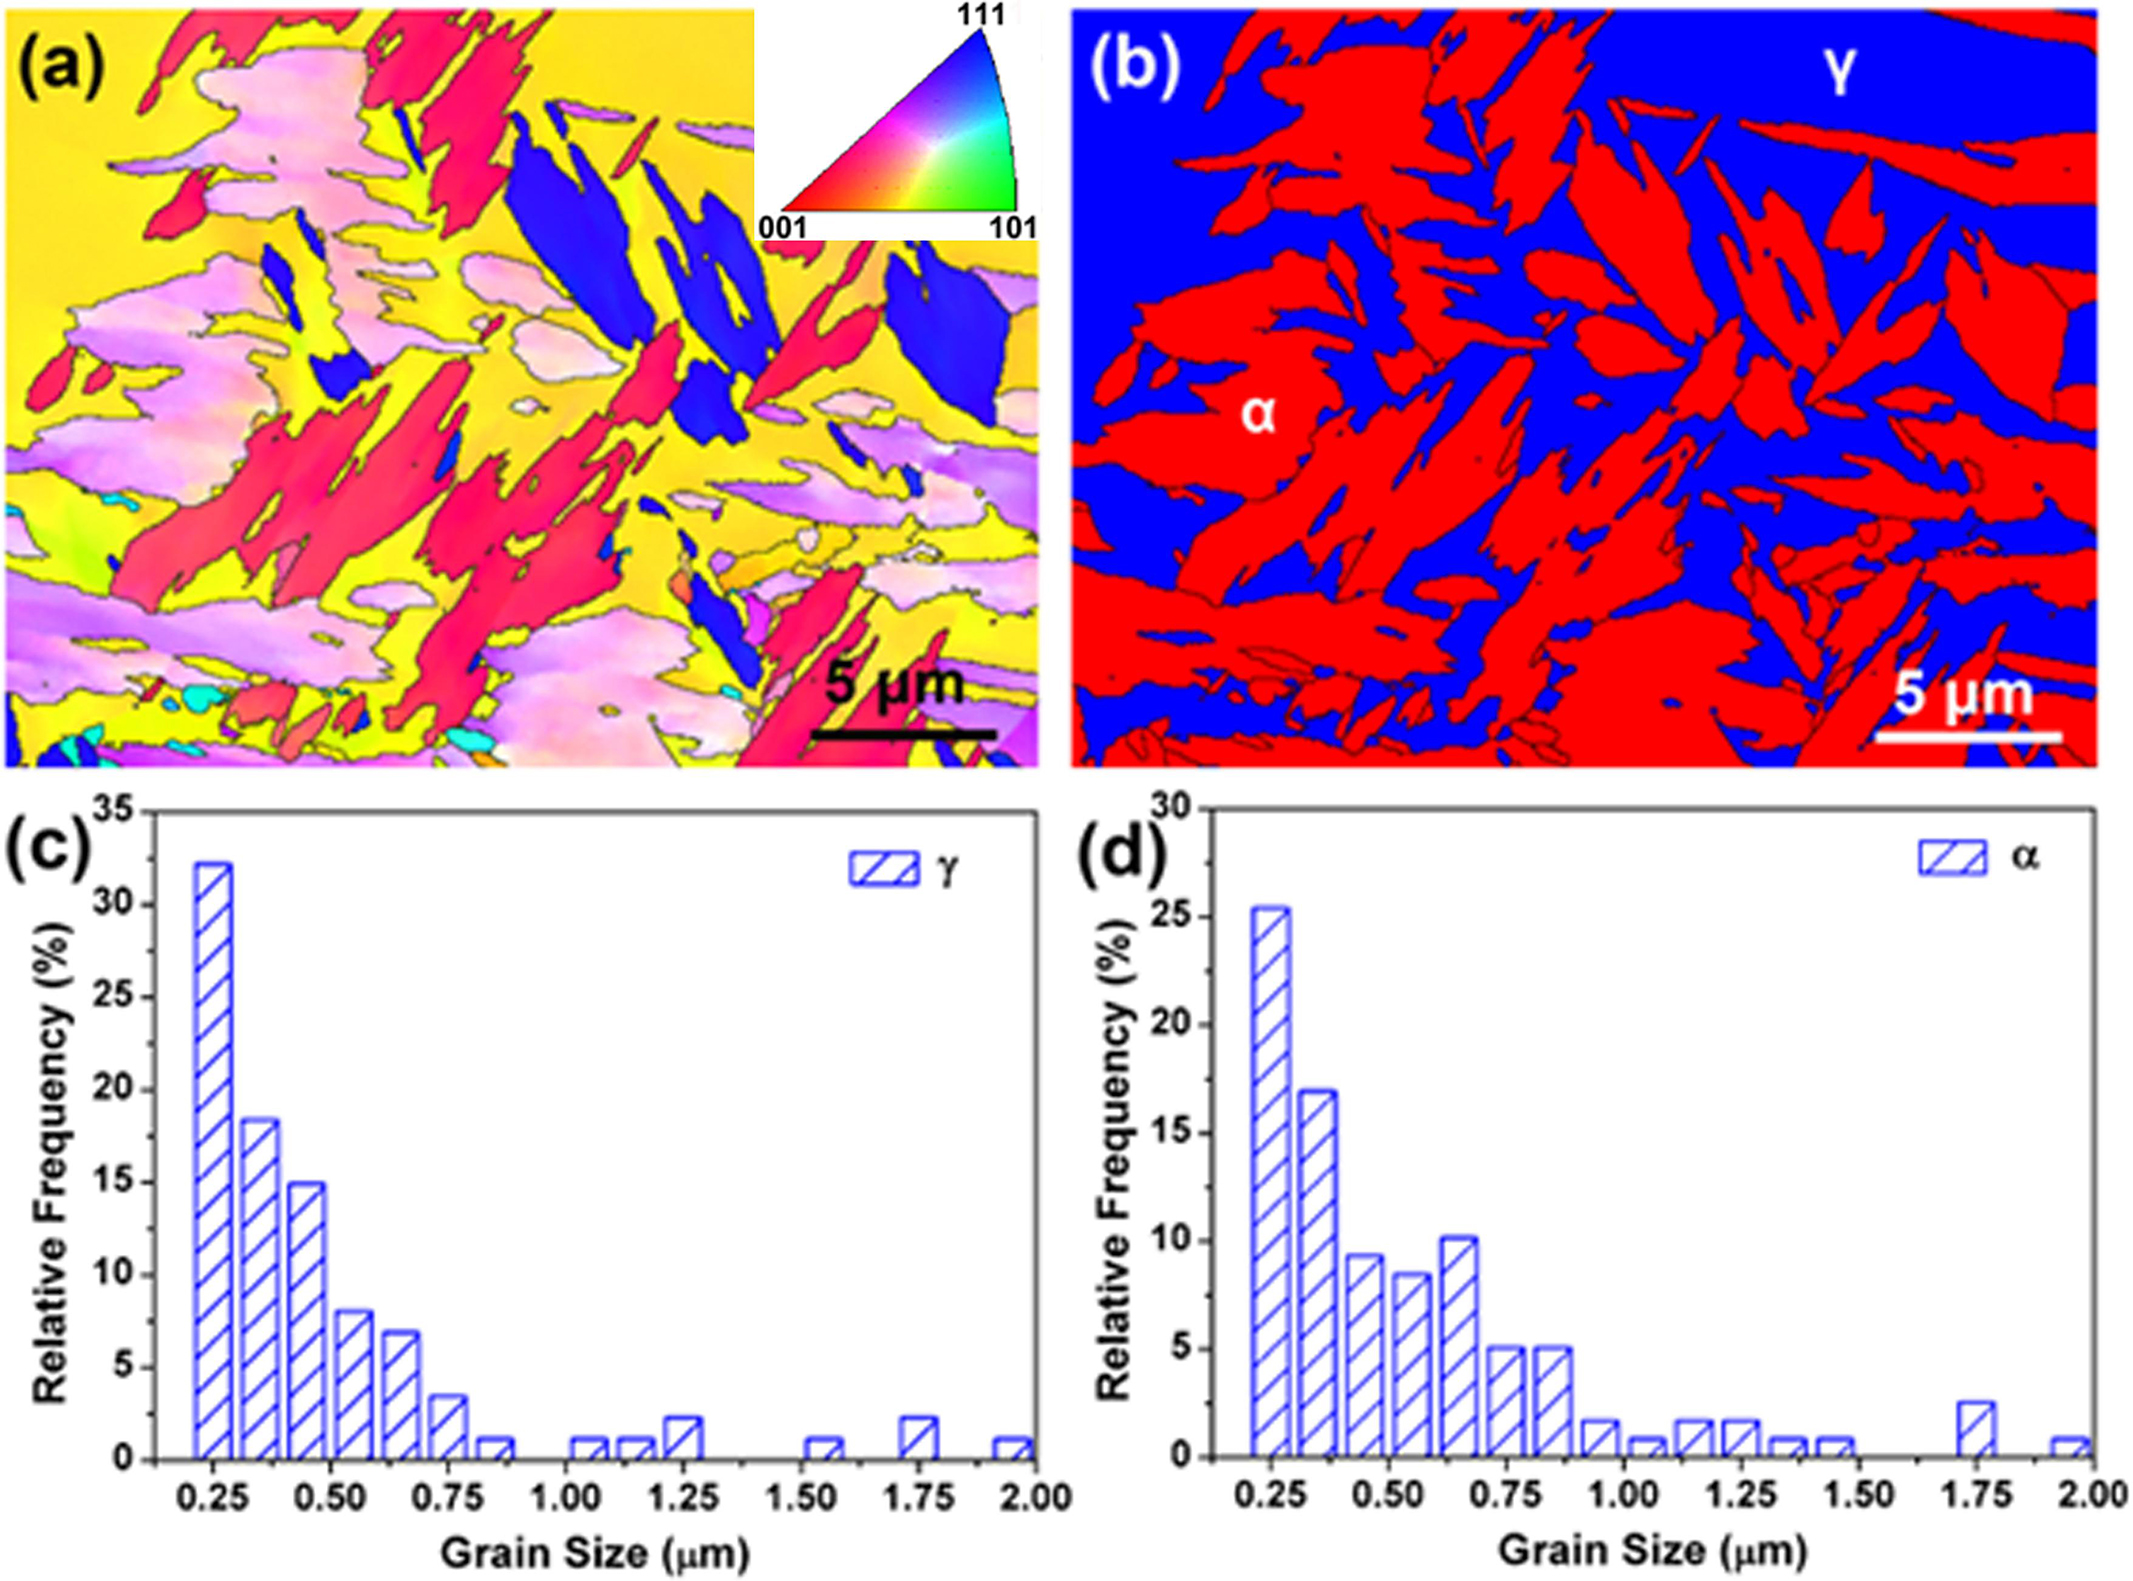
Figure 6. Electron backscatter diffraction orientation map (a) and phase map (b) of the 2205 DSS prepared with the excessive Fe2O3 of 5.0%; grain size relative frequency of γ (c) and α (d) phases.
Figure 7 shows TEM analysis results of the 2205 DSS prepared with a Fe2O3 excess percentage of 0%. The bright-field image (Figure 7a) is mainly composed of white, gray, and black areas. It can be seen that the grains in black and white regions are microcrystallines, but the grains in the gray areas are quite small. Figure 7b shows the corresponding selected area electron diffraction (SAED) pattern of a bright-field image. The calibration results showed that the nanocrystalline rings are mainly diffraction of the α phase. Moreover, one of the corresponding dark-field images (as shown in Figure 7c) shows that the white spots are nanocrystallines. According to the statistics of white points on several dark-field images, the volume fraction of nanocrystals is 69.70%, and the size distribution of nanocrystals is shown in Figure 7d, with an average grain size of 19.45 nm. In summary, bulk DSS prepared by aluminothermic reaction is composed of nanocrystalline and microcrystalline composite structures.
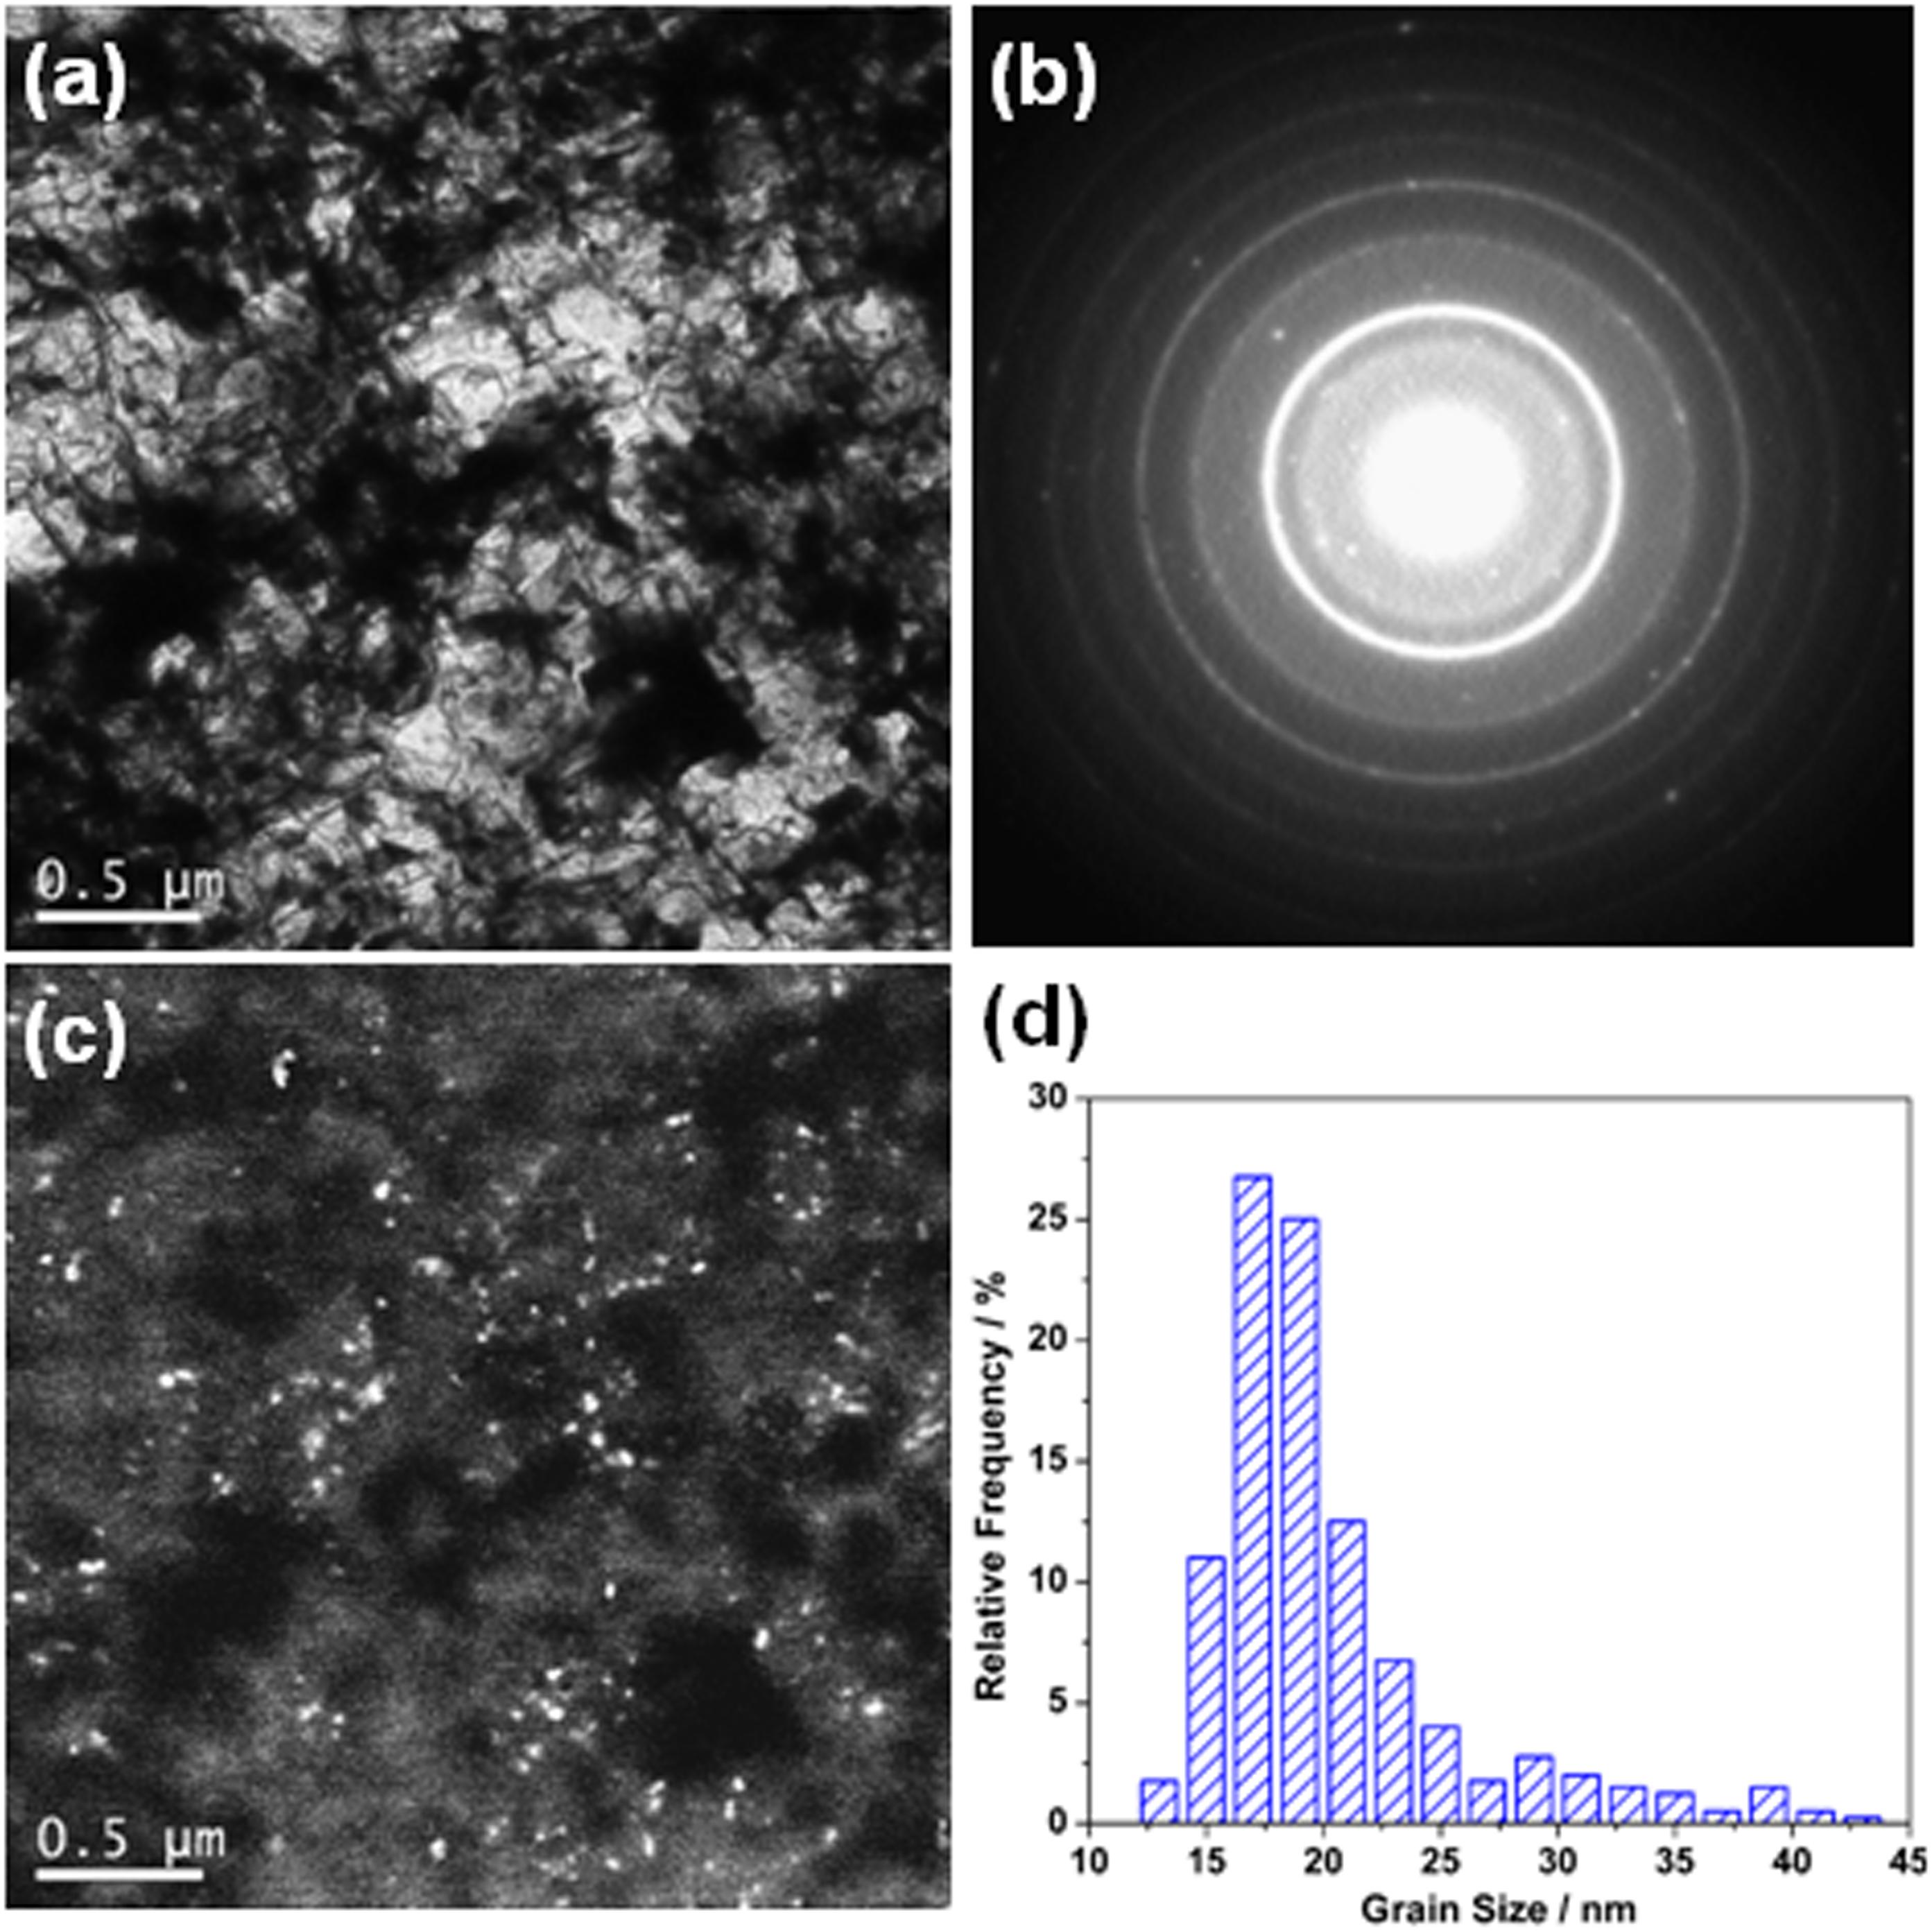
Figure 7. Transmission electron microscope results of the 2205 DSS prepared with the excessive Fe2O3 of 0%: (a) bright-field image, (b) selected area electron diffraction, (c) dark-field image, and (d) size distribution of the crystal grains.
Similarly, 2205 DSS prepared with Fe2O3 excess percentage of 5% was also analyzed by TEM, as shown in Figure 8. Obviously, the black and white areas in the bright-field image (Figure 8a) are microcrystal areas. The gray area is nanocrystalline. Figure 8b is the SAED pattern corresponding to the bright-field image, and the white bright spots in the corresponding dark-field image (Figure 8c) are also nanocrystals. According to grain size statistics of nanocrystals (Figure 8d), the average grain size is about 20.90 nm and the volume fraction is 74.2%. It can be seen that the 2205 DSS prepared with excessive Fe2O3 is still composed of a micron and nanocrystalline composite structure.
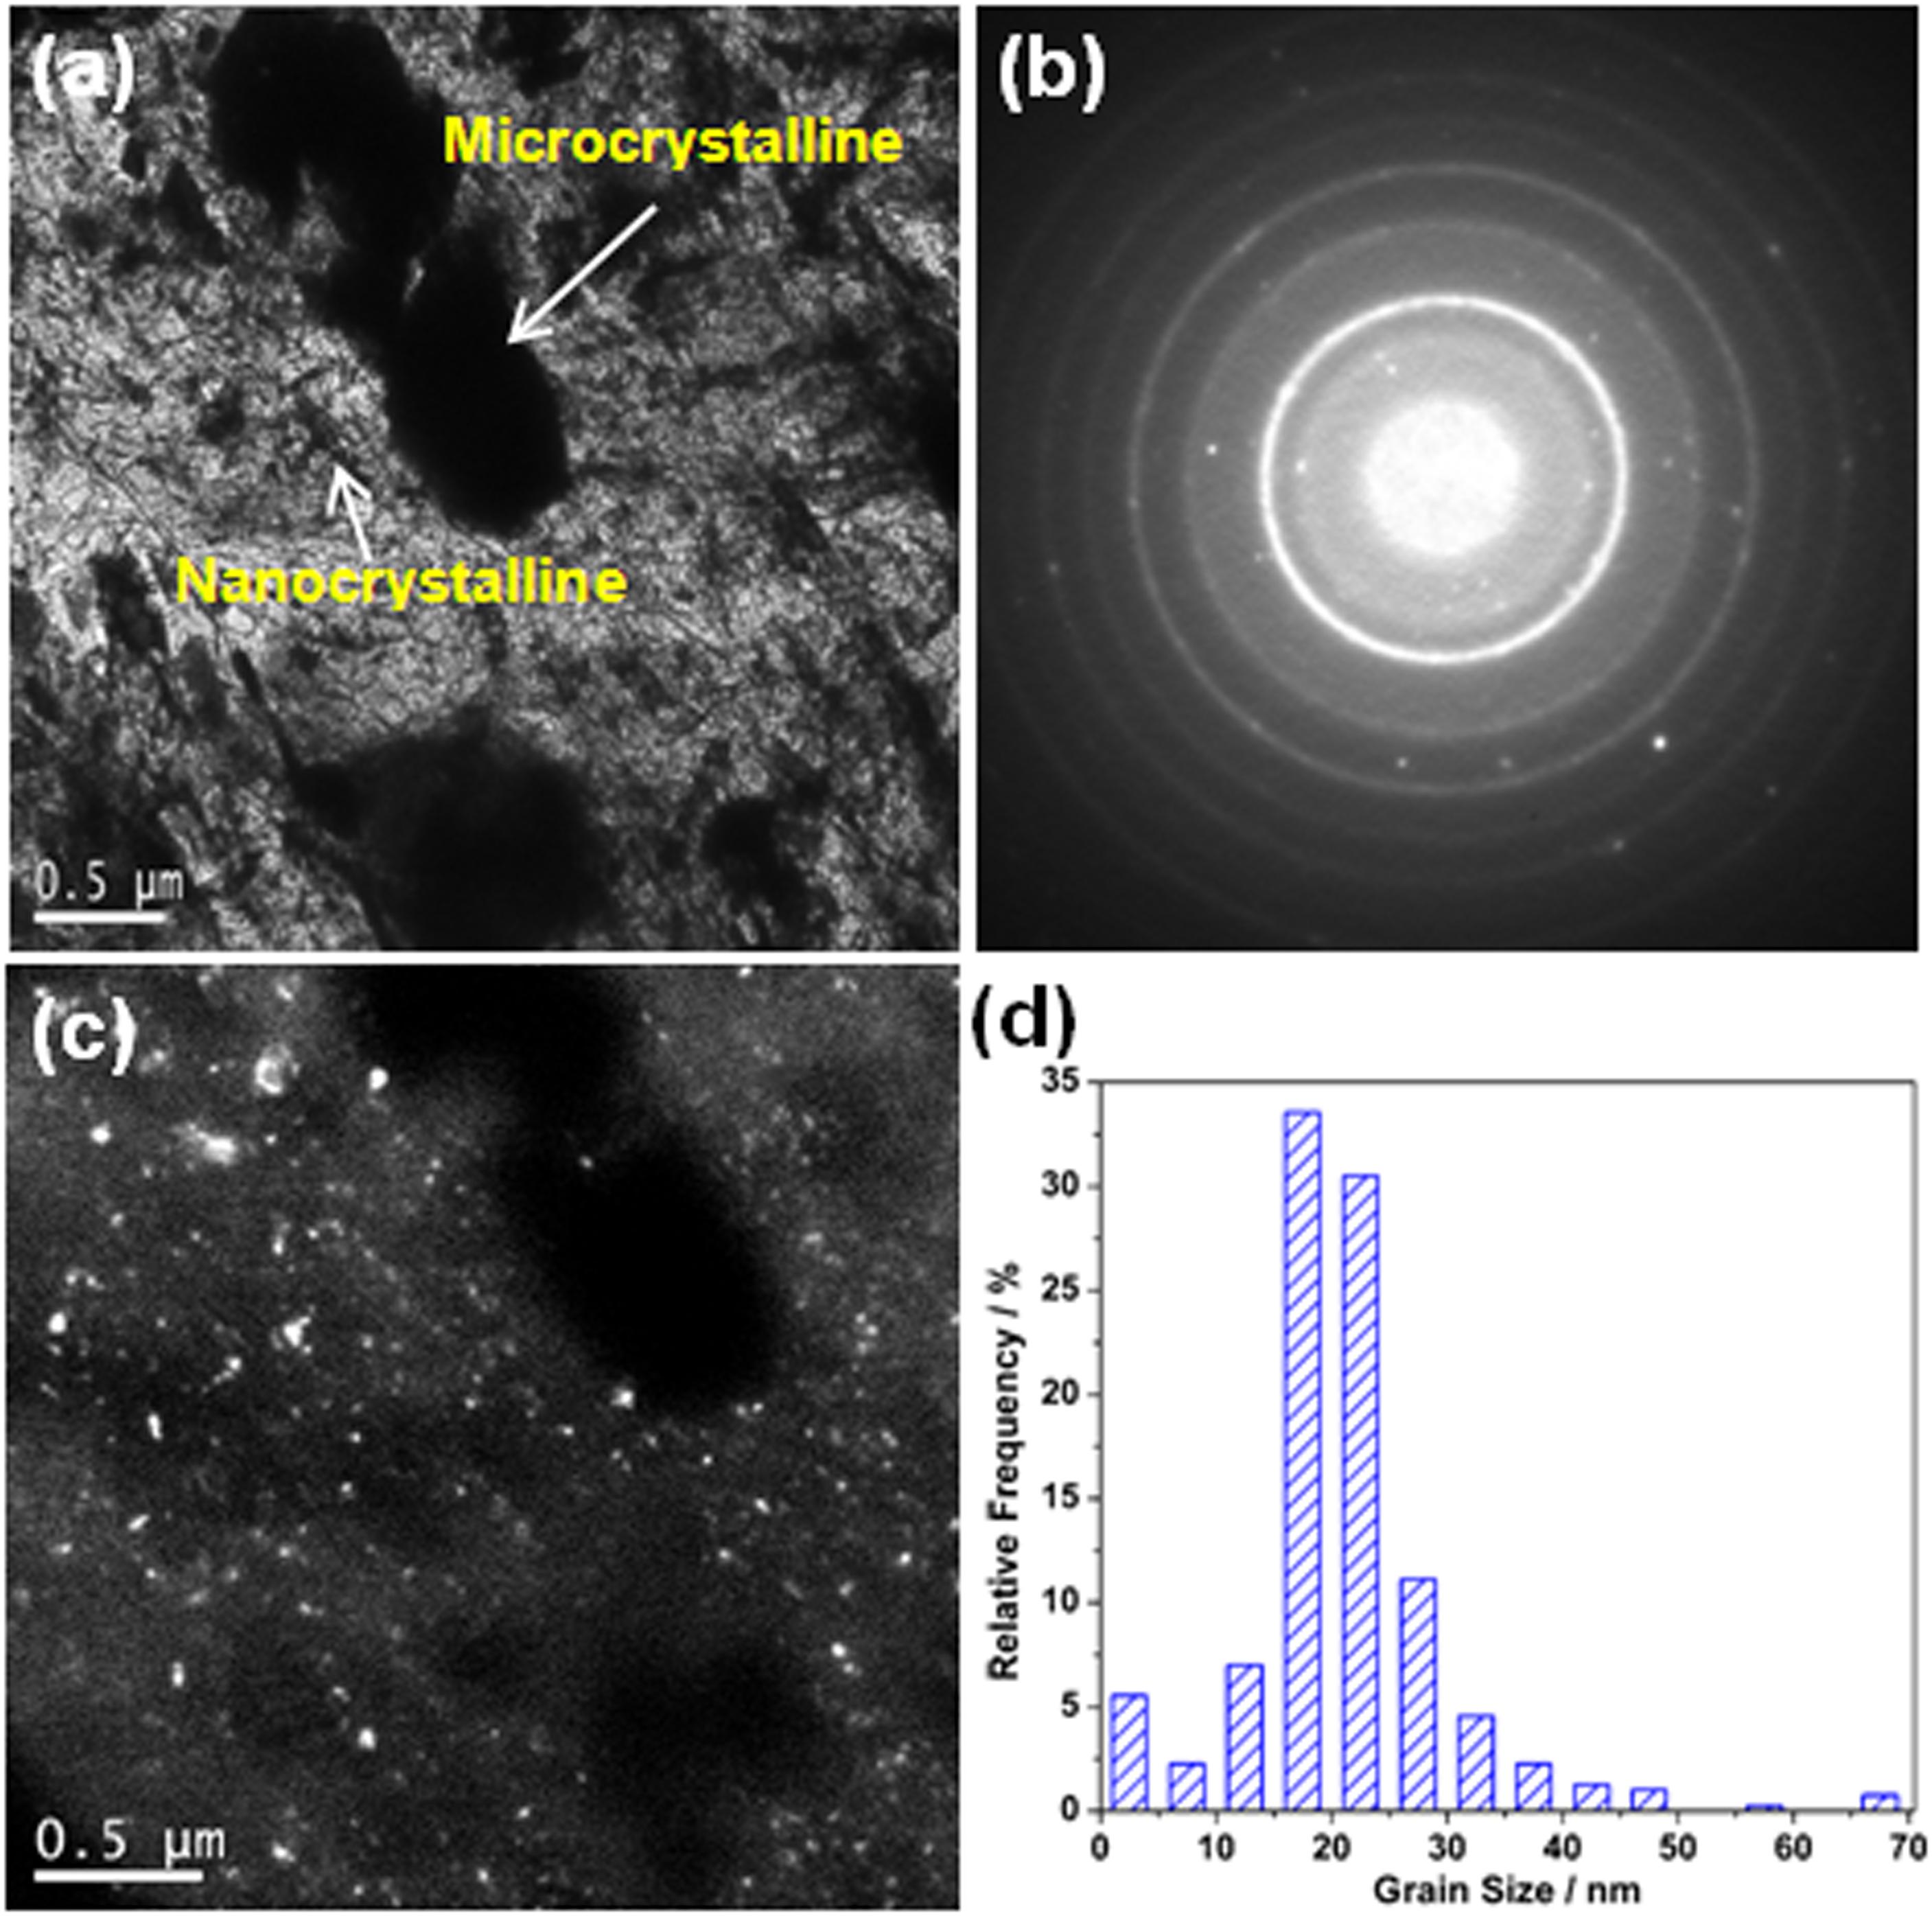
Figure 8. Transmission electron microscope results of the 2205 DSS prepared with the excessive Fe2O3 of 5.0%: (a) bright-field image, (b) selected area electron diffraction, (c) dark-field image, and (d) size distribution of the crystal grains.
Discussion
Formation Mechanism of Nanocrystalline and Microcrystalline Composite Structure
During the preparation of alloys, the adiabatic temperature (about 3000 K) released by the aluminothermic reaction is much higher than the melting point (about 1200 K) of 316L stainless steel and the by-product Al2O3. Therefore, the alloy and the Al2O3 melt have been overheated and cannot be provided by heterogeneous nucleation sites. Thus, all liquid products crystallize and solidify in a homogeneous nucleation manner on a highly thermally conductive Cu substrate (La et al., 2006, 2013, 2010). According to the relation between uniform nucleation rate and super cooling degree (Frank, 1952), it can be known that the nucleation rate of a liquid metal is very low below the effective nucleation temperature but increases sharply at a certain temperature. Therefore, at the initial stage of crystallization, the nucleation rate is very low, and the critical nucleus radius is large, but this part of grain takes longer to grow, which grows into micron phases after the solidification. While the temperature drops to a certain value, the nucleation rate increases and the critical nucleation radius decreases; furthermore, the cooling rate of the melt is high due to the high thermal conductivity of the copper substrate. Subsequently, the viscosity of the melt is high, the atomic diffusion speed is slow, and the grains cannot grow up quickly, thus obtaining nanoscale α phase grains.
Formation Mechanism of Organizational Structure
From the structural analysis, it can be seen that most of the alloys are not a single α phase, but there is a transition from α to γ phase, and the organization is a mixture of α and γ phases at room temperature. This can be understood from the following perspective.
Generally, the phase equilibrium designed in DSS is determined according to the Schaeffler phase diagram and the Delong diagram derived subsequently. Therefore, Cr equivalent (Creq) and Ni equivalent (Nieq) are proposed. Creq converts the ferritizing elements (such as Cr, Si, Mo, etc.) into the sum of several Cr according to their ferritization intensity. Similarly, Nieq converts austenitizing elements (such as Ni, N, Mn, etc.) into the sum of several Ni based on their austenitization intensity.
According to the Creq/Nieq ratio, the solidification mode of stainless steel can be divided into the following four categories (Rajasekhar et al., 1997; Li et al., 2005):
Model A: Creq/Nieq < 1.25, the solidification mode is L→L + γ→γ;
Model AF: 1.25 < Creq/Nieq < 1.48, the solidification mode is L→L + γ→L + γ + α→γ + α;
Model FA: 1.48 < Creq/Nieq < 1.95, the solidification mode is L→L + α→L + α + γ→α+γ;
Model F: Creq/Nieq > 1.95, the solidification mode is L→L + α→α→α+γ.
In this work, according to the design composition of 2205 DSS, Creq and Nieq can be calculated as follows:
Creq = Cr% + Mo% + 1.5Si% + 0.5Nb% = 25.61
Nieq = Ni% + 30C% + 30N% + 0.5Mn% = 12.25
That is, Creq/Nieq = 2.09 > 1.95, which belongs to the model F. Namely, at the beginning of solidification, the high-temperature α phase precipitates from the liquid phase firstly. After the liquid phase is completely transformed into the α phase, the γ phase begins to precipitate, and the structure is a mixture of α and γ at room temperature.
In addition, it can be seen from the SEM images that with the occurrence of the aluminothermic reaction, impurities and intermetallic compounds precipitated on the α phase and the α/γ phase boundaries, such as AlN, CrC, SiC, Fe-Cr-Mn, and Fe-Cr-Mo. There are two reasons for this: Firstly, the raw material powders of 2205 DSS were melted due to the high heat released during the aluminothermic reaction, but Cr and C, Al and N can be easily combined to form Cr-C compounds and AlN inclusions (McKee, 1986; Lückl et al., 2018). Secondly, due to the low atomic density in the α phase lattice, the diffusion rate of alloying elements in the α phase is faster than that in the γ phase, so it is easy to form intermetallic compounds. Moreover, Cr and Mo are enriched in the α phase, leading to the precipitation of the σ phase on the boundary between α and γ phases (Chen and Yang, 2001; Chen et al., 2002; Huang and Shih, 2005; Chan and Tjong, 2014).
Effect of Al on the Formation of Organizational Structure
For the 2205 DSS prepared by the aluminothermic reaction, it should also be noted that the influence of Al on the structure cannot be ignored. Al is not included in the standard component of 2205 DSS, but it is a ferritizing element. Therefore, Al introduced due to incomplete aluminothermic reaction will inevitably increase Creq and correspondingly decrease Nieq. As can be seen from the Schaeffler phase diagram, this will inevitably lead to an increase in the volume percentage of the α phase.
In the present paper, when Fe2O3 excess percentage is 0%, the red Fe2O3 is found in the residue of Al2O3, indicating that the aluminothermic reaction is incomplete. The reason is that the atomic diffusion is slow and the kinetic process is affected during the reaction process. Meanwhile, the high thermal conductivity of the copper substrate leads to the rapid cooling rate of the melt and the insufficient heat of the subsequent reaction. Thus, a part of Al will be dissolved in the alloy, while unreacted Fe2O3 is precipitated together with Al2O3. Namely, 2205 DSS contains Al. Moreover, the content of Ni and N is small, which shows a weak balance effect of the γ phase. Finally, the alloy only contains the α phase.
With the increase in Fe2O3, Al will gradually decrease, which will promote the transformation of the α to γ phase in the alloy. The volume fraction of the α phase will decrease accordingly. However, the volume fraction of the α phase does not decrease monotonically with the excess ratio of the Fe2O3 or Al content; the minimum value is obtained when the excess percentage of Fe2O3 is 5%. This is because the solidification mode of 2205 DSS belongs to mode F, that is, L → L + α→α→α + γ. When there is a larger excess percentage of Fe2O3, unreacted Fe2O3 needs to absorb heat with the precipitation of Al2O3, which reduces the aluminothermic reaction temperature. Furthermore, the copper substrate has a high thermal conductivity, and the melt has a fast cooling rate, resulting in a shorter phase transition time and the insufficient transformation of the α to γ phase. Therefore, when the excess percentage of Fe2O3 is greater than 5%, the α phase gradually increases and the γ phase gradually decreases.
Conclusion
In the present paper, 2205 DSSs were prepared by aluminothermic reaction, and the formation mechanism of micro/nano structures was studied from the aspects of the preparation process, element equivalent, and residual Al content. The main conclusions are as follows.
(1) A micro-nanocrystal composite structure can be obtained in 2205 DSSs by aluminothermic reaction under appropriate Fe2O3 excess conditions.
(2) The ratio of Creq/Nieq in the alloy is 2.09, indicating that alloys belong to model F solidification, and their phase transition mode is L → L + α→α→α + γ.
(3) The residual Al content and the volume percentages of α and γ phases and their grain sizes can be controlled by reasonably adjusting the excess percentage of Fe2O3. When the Fe2O3 excess percentage is 5.0%, the volume percentages of α and γ phases reach the minimum and maximum values, respectively. However, as the excess percentages of Fe2O3 are 0% and 12.5%, alloys consist mainly of a phase.
Data Availability Statement
All datasets generated for this study are included in the article/supplementary material.
Author Contributions
YZ contributed the central idea, analyzed most of the data, and wrote the initial draft of the manuscript. HZ and NZ prepared and analyzed of samples. PL checked the structure, data, and language of the manuscript. YS prepared the TEM samples. MZ and FZ contributed to refining the ideas, carried out the additional analyses, and finalized the manuscript.
Funding
This work was supported by the National Natural Science Foundation of China (Grant No. 51561020) and the Open Project of Key Laboratory of Materials Modification by Laser, Ion and Electron Beams (Dalian University of Technology), Ministry of Education (Grant No. KF1803).
Conflict of Interest
The authors declare that the research was conducted in the absence of any commercial or financial relationships that could be construed as a potential conflict of interest.
References
Chai, L., Wang, T., Ren, Y., Song, B., Guo, N., and Chen, L. (2018). Microstructural and textural differences induced by water and furnace cooling in commercially pure Zr annealed in the α+β region. Metals Mater. Int. 24, 673–680. doi: 10.1007/s12540-018-0079-6
Chan, K., and Tjong, S. (2014). Effect of secondary phase precipitation on the corrosion behavior of duplex stainless steels. Materials 7, 5268–5304. doi: 10.3390/ma7075268
Chen, K., Zeng, L., Li, Z., Chai, L., Wang, Y., and Chen, L. (2019). Effects of laser surface alloying with Cr on microstructure and hardness of commercial purity Zr. J. Alloys Compounds 784, 1106–1112. doi: 10.1016/j.jallcom.2019.01.097
Chen, T. H., Weng, K. L., and Yang, J. R. (2002). The effect of high-temperature exposure on the microstructural stability and toughness property in a 2205 duplex stainless steel. Mater. Sci. Eng 338, 259–270. doi: 10.1016/s0921-5093(02)00093-x
Chen, T. H., and Yang, J. R. (2001). Effects of solution treatment and continuous cooling on σ-phase precipitation in a 2205 duplex stainless steel. Mater. Sci. Eng. A 311, 28–41. doi: 10.1016/S0921-5093(01)00911-X
Frank, F. C. (1952). Supercooling of liquids. Proc. R. Soc. Lond. Ser. A Math. Phys. Sci. 215, 43–46. doi: 10.1098/rspa.1952.0194
Ghosh, S. K., Mahata, D., Roychaudhuri, R., and Mondal, R. (2012). Effect of rolling deformation and solution treatment on microstructure and mechanical properties of a cast duplex stainless steel. Bull. Mater. Sci. 35, 839–846. doi: 10.1007/s12034-012-0353-z
Gupta, A., Kumar, A., Baskaran, T., Arya, S. B., and Khatirkar, R. K. (2018). Effect of heat input on microstructure and corrosion behavior of duplex stainless steel shielded metal arc welds. Trans. Indian Inst. Metals 71, 1595–1606. doi: 10.1007/s12666-018-1294-z
Huang, C. S., and Shih, C. C. (2005). Effects of nitrogen and high temperature aging on σ phase precipitation of duplex stainless steel. Mater. Sci. Eng. A 402, 66–75. doi: 10.1016/j.msea.2005.03.111
Korznikov, A. V., Ivanisenko, Y. V., Laptionok, D. V., Safarov, I. M., Pilyugin, V. P., and Valiev, R. Z. (1994). Influence of severe plastic deformation on structure and phase composition of carbon steel. Nanostruct. Mater. 4, 159–167. doi: 10.1016/0965-9773(94)90075-2
La, P., Wei, F., Hu, S., Li, C., and Wei, Y. (2013). White cast iron with a nano-eutectic microstructure and high tensile strength and considerable ductility prepared by an aluminothermic reaction casting. Mater. Sci. Eng. A 561, 317–320. doi: 10.1016/j.msea.2012.10.002
La, P., Wei, F., Lu, X., Chu, C., Wei, Y., and Wang, H. (2014). Effect of annealing temperature on microstructure and mechanical properties of bulk 316L stainless steel with nano-and micro-crystalline dual phases. Metal. Mater. Trans. A 45, 5236–5244. doi: 10.1007/s11661-014-2432-9
La, P., Wei, Y., Lv, R., Zhao, Y., and Yang, Y. (2010). Effect of Mn element on microstructure and mechanical properties of bulk nanocrystalline Fe3Al based materials prepared by aluminothermic reaction. Mater. Sci. Eng. A 527, 2313–2319. doi: 10.1016/j.msea.2009.12.043
La, P. Q., Yang, J., Cockayne, D. J. H., Liu, W. M., Xue, Q. J., and Li, Y. D. (2006). Bulk nanocrystalline Fe3Al-based material prepared by aluminothermic reaction. Adv. Mater. 18, 733–737. doi: 10.1002/adma.200501684
Li, J. Y., Sugiyama, S., and Yanagimoto, J. (2005). Microstructural evolution and flow stress of semi-solid type 304 stainless steel. J. Mater. Process. Technol. 161, 396–406. doi: 10.1016/j.jmatprotec.2004.07.063
Liou, H. Y., Tsai, W. T., Pan, Y. T., and Hsieh, R. I (2001). Effects of alloying elements on the mechanical properties and corrosion behaviors of 2205 duplex stainless steels. J. Mater. Eng. Perform. 10, 231–241. doi: 10.1361/105994901770345268
Liu, X., Chen, L., Du, X. J., and Wang, L. M. (2010). Influence of rare earth element on microstructure and mechanical properties of 2205 duplex stainless steel. Mater. Mech. Eng. 34, 46–49.
Lückl, M., Wojcik, T., Povoden-Karadeniz, E., Zamberger, S., and Kozeschnik, E. (2018). Co-precipitation behavior of MnS and AlN in a low-carbon steel. Steel Res. Int. 89:1700342. doi: 10.1002/srin.201700342
Luo, S. J., and Zheng, X. X. (2011). Effects of sensitizing treatment on microstructure and mechanical properties of 2205 duplex stainless steel. Mater. Eng. 5, 76–80. doi: 10.3969/j.issn.1001-4381.2013.06.001
McKee, D. W. (1986). The oxidation of dispersed refractory metal compounds and their behavior as carbon oxidation catalysts. Carbon 24, 331–336. doi: 10.1016/0008-6223(86)90234-4
Moteshakker, A., and Danaee, I. (2016). Microstructure and corrosion resistance of dissimilar weld-joints between duplex stainless steel 2205 and austenitic stainless steel 316L. J. Mater. Sci. Technol. 32, 282–290. doi: 10.1016/j.jmst.2015.11.021
Müller, T., Bachmaier, A., Stark, A., Schell, N., and Pippan, R. (2019). Nanostructured low carbon steels obtained from the martensitic state via severe plastic deformation, precipitation, recovery, and recrystallization. Adv. Eng. Mater. 21:1800202. doi: 10.1002/adem.201800202
Pariser, H. H., Backeberg, N. R., Masson, O. C. M., and Bedder, J. C. M. (2018). Changing nickel and chromium stainless steel markets-a review. J. S. Afr. Inst. Min. Metal. 118, 563–568. doi: 10.17159/2411-9717/2018/v118n6a1
Rajasekhar, K., Harendranath, C. S., Raman, R., and Kulkarni, S. D. (1997). Microstructural evolution during solidification of austenitic stainless steel weld metals: a color metallographic and electron microprobe analysis study. Mater. Charac. 38, 53–65. doi: 10.1016/s1044-5803(97)80024-1
Rosado-Carrasco, J., Krupp, U., López-Morelos, V. H., Giertler, A., García-Rentería, M. A., and González-Sánchez, J. (2019). Effect of a magnetic field applied during fusion welding on the fatigue damage of 2205 duplex stainless steel joints. Int. J. Fatigue 121, 243–251. doi: 10.1016/j.ijfatigue.2018.12.022
Shi, Y., La, P., Han, Y., Wei, F., Sheng, J., and Li, Z. (2019). Rolling tuning microstructure and tensile properties of nano/microcrystalline 304 stainless steel. Modern Phys. Lett. B 33:1950344. doi: 10.1142/S0217984919503445
Stergiou, V., and Papadimitriou, G. D. (2012). Effect of an electron beam surface treatment on the microstructure and mechanical properties of SAF 2205 joints produced with electron beam welding. J. Mater. Sci. 47, 2110–2121. doi: 10.1007/s10853-011-6011-9
Verma, J., and Taiwade, R. V. (2017). Effect of welding processes and conditions on the microstructure, mechanical properties and corrosion resistance of duplex stainless steel weldments—A review. J. Manufact. Process. 25, 134–152. doi: 10.1016/j.jmapro.2016.11.003
Wang, S., Ma, Q., and Li, Y. (2011). Characterization of microstructure, mechanical properties and corrosion resistance of dissimilar welded joint between 2205 duplex stainless steel and 16MnR. Mater. Design 32, 831–837. doi: 10.1016/j.matdes.2010.07.012
Xu, D., Xia, J., Zhou, E., Zhang, D., Li, H., Yang, C., et al. (2017). Accelerated corrosion of 2205 duplex stainless steel caused by marine aerobic Pseudomonas aeruginosa biofilm. Bioelectrochemistry 113, 1–8. doi: 10.1016/j.bioelechem.2016.08.001
Yan, J., Gu, T., Qiu, S., Wang, J., Xiong, J., and Fan, H. (2015a). Phase transformations during the low-temperature nitriding of AISI 2205 duplex stainless steel. Metal. Mater. Trans. B 46, 1461–1470. doi: 10.1007/s11663-015-0298-x
Yan, J., Wang, J., Lin, Y., Gu, T., Zeng, D., Huang, R., et al. (2015b). Microstructure and properties of SAE 2205 stainless steel after salt bath nitrocarburizing at 450°C. J. Mater. Eng. Perform. 23, 1157–1164. doi: 10.1007/s11665-014-0922-y
Yanushkevich, Z. C., Molodov, D. A., Belyakov, A. N., and Kaibyshev, R. O. (2016). Recrystallization kinetics of an austenitic high-manganese steel subjected to severe plastic deformation. Russian Metal. 2016, 812–819. doi: 10.1134/S0036029516090184
Zhao, Y., Zhou, E., Liu, Y., Liao, S., Li, Z., Xu, D., et al. (2017). Comparison of different electrochemical techniques for continuous monitoring of the microbiologically influenced corrosion of 2205 duplex stainless steel by marine pseudomonas aeruginosa biofilm. Corros. Sci. 126, 142–151. doi: 10.1016/j.corsci.2017.06.024
Keywords: duplex stainless steel (2205), aluminothermic reaction casting, micro/nanocrystalline, microstructure, transmission electron microscope
Citation: Zheng Y, Zhao H, Zhang N, La P, Shi Y, Zhu M and Zhan F (2020) Effect of Excessive Fe2O3 on Microstructural Evolution of Micro/Nanocrystalline 2205 Duplex Stainless Steel Prepared by Aluminothermic Reaction. Front. Mater. 7:119. doi: 10.3389/fmats.2020.00119
Received: 16 January 2020; Accepted: 16 April 2020;
Published: 27 May 2020.
Edited by:
Qing Liu, University of Science and Technology Beijing, ChinaReviewed by:
Liang-Yu Chen, Jiangsu University of Science and Technology, ChinaYang Zhou, Southeast University, China
Copyright © 2020 Zheng, Zhao, Zhang, La, Shi, Zhu and Zhan. This is an open-access article distributed under the terms of the Creative Commons Attribution License (CC BY). The use, distribution or reproduction in other forums is permitted, provided the original author(s) and the copyright owner(s) are credited and that the original publication in this journal is cited, in accordance with accepted academic practice. No use, distribution or reproduction is permitted which does not comply with these terms.
*Correspondence: Peiqing La, cHFsYUBsdXQuY24=; cHFsYUBsdXQuZWR1LmNu