 Sonia Rodríguez-López1Jürgen Malzbender2Virginia M. Justo3Francisco C. Serbena3Sonja M. Groß-Barsnick4Maria J. Pascual1*
- 1Glass Department, Ceramics and Glass Institute (CSIC), Madrid, Spain
- 2Forschungzentrum Jülich GmbH, Institute of Energy and Climate Research (IEK), Microstructure and Properties of Materials (IEK-2), Jülich, Germany
- 3Department of Physics, State University of Ponta Grossa, Ponta Grossa, Brazil
- 4Forschungzentrum Jülich GmbH, Central Institute of Engineering, Electronics and Analytics (ZEA), Engineering and Technology (ZEA-1), Jülich, Germany
The objective of this paper is to illustrate a variety of studies carried out to improve the quality of some particular glass-ceramic joining materials based on measured properties such as gas-tightness and mechanical resistance and demonstrate the feasibility of using the proposed materials for solid oxide fuel cells (SOFC) and solid oxide electrolysis cells (SOEC) applications. First, the sealing conditions have been optimized for the two selected compositions in the system MgO-BaO/SrO-B2O3-SiO2. Once the joining materials have been optimized, the gas-tightness has been measured as a function of the glass-ceramic crystallization degree, its thermal cycling behavior and the influence of a reducing atmosphere on this property. The electrical resistance at high temperature has also been studied. Subsequently, the chemical compatibility of the joints steel/glass-ceramic has been evaluated by means of the analysis of the cross-sections using SEM and EDX. Furthermore, the mechanical and chemical stability of the joints has also been studied as a function of the crystallization degree, the resistance vs. thermal cycling and the influence of a reducing atmosphere. Finally, the mechanical resistance of the joints regarding flexural loading has been characterized employing a 4-point bending method both at room temperature and at relevant high temperatures varying the seal thickness. Overall, the results verify that the developed and tested materials are promising for long term stable SOFC and SOEC applications in advanced stack designs aiding prolonged lifetime under thermal-cyclic conditions.
Introduction
The processing of the sealant material is a key issue that influences the quality of the joint between the SOFC stack components and the glass-ceramic sealant (Lessing, 2007). A poor gas-tightness will affect the stack performance negatively and will contribute to its degradation (Fergus, 2005). A good processing control will also affect the long term resistance and stability of the joints within the environment of the coexisting oxidizing and reducing atmospheres of the cell (Weil, 2006). If the glass does not provide a good sealing ability, there will be areas of easy access for the gases in the joints seal/interconnect and seal/electrolyte interfaces, which will favor interfaces degradation and as a consequence deteriorate the joint through the formation of undesirable corrosion products (Haanappel et al., 2005; Rodríguez-López et al., 2016). Additionally, the seal itself and also its joints with the stack components must withstand different mechanical stresses resulting from the planar configuration and its modular character, including both compressive and tensile stresses (Blum et al., 2011). Another important quality is that the seals must work as electrical insulators between the repetition units. As a consequence, not only the seals have to be electrical isolators but also it must join well with the stack materials (Fergus, 2005). The adhesion of a glass correlates with its viscosity at joining temperature tolerable for the SOFC components. In parallel, interfacial reactions between glass seal and the components are governed by their thermodynamic equilibrium at the specific temperature as well. Thus, the joining process influences inevitably various specifics of the glass sealant.
The measurement of the mechanical properties of the steel/glass-ceramics joints is difficult since the results are highly influenced by the configuration of the test and the size of the samples, in such a way that components of other forces (not only the one subject of the measurement, i.e., additional unwanted bending) can influence the measurement (Nielsen et al., 2008; Smeacetto et al., 2008; Cela Greven, 2014). Although there are many papers in the literature that report on mechanical properties, the comparison of results turns out to be complicated due to this problem.
In order to compare results regarding joint strengths, the results with respect to the type of test and the applied force types should be discussed separately. As a consequence, the tensile tests provide values around 0.5–18.2 MPa (average values for different sealants) when they are measured at room temperature (Rodríguez-López, 2016), with the higher value corresponding to the glass-ceramic V1649 based on the SrO-La3O3-B2O3 glass system developed by the company 3M (Timurkutluk et al., 2015). Values increase from 16.7 to 31.3 MPa when measured at room temperature in air and wet H2, respectively, as reported for the glass-ceramic GC-9, based on the BaO-CaO-La2O3-ZrO2-Al2O3-B2O3-SiO2 glass system (Lin et al., 2012, 2015). In fact, the tensile strength in wet H2 decreases to a maximum of 16.5 MPa at 700°C (Stephens et al., 2009) and 11.9 MPa at 800°C for the glass-ceramics GC-18 and GC-9, respectively. The thermal aging at high temperature of the latter glass-ceramic appears to increase the traction-resistance values.
The results corresponding to the shear strength obtained at room temperature give values between 0.9 and 47.1 MPa (Stephens et al., 2009). The glass-ceramic GC-18 based on the BaO-CaO-Al2O3-SiO2-B2O3 (BCASB) system yields the higher values measured in this torsion test. This glass-ceramic also provides higher values at high temperature (Stephens et al., 2009). The glass-ceramic GC9 displays an increase of the shear resistance with thermal aging time of the sealant material (800°C/1,000 h; Lin et al., 2015).
Finally, values obtained by 4-point flexural tests at room temperature range between 22 and 55 MPa (Rodríguez-López, 2016). The glass-ceramic H (system BaO-CaO-V2O5-ZnO-Al2O3-B2O3-SiO2) reinforced with silver particles provides here the higher value (Wei et al., 2015). Nevertheless, a glass-ceramic abbreviated type B (system BaO-CaO-Al2O3-SiO2) provides the reported best value of 30 MPa at a relevant high temperature for this application (Zhao, 2013; Malzbender et al., 2014). In general, thermal treatment time improves also the results regarding flexural strength at both room and high temperature (Rodríguez-López, 2016).
The objective of this paper is to illustrate a variety of studies carried out to improve the quality of some particular glass-ceramic joining materials and demonstrate their feasibility to be used in SOFC and SOEC applications. First, the sealing conditions have been optimized for two selected compositions in the system MgO-BaO/SrO-B2O3-SiO2. Once the joining materials have been optimized, the gas-tightness is measured as a function of the glass-ceramic crystallization degree, its thermal cycling behavior and the influence of a reducing atmosphere on this property. The electrical resistance at high temperature has also been studied. Subsequently the chemical compatibility of the joints steel/glass-ceramic has been evaluated by means of the analysis of the cross-sections using SEM and EDX. Furthermore, the stability of the joints has also been studied as a function of the crystallization degree, the resistance vs. thermal cycling and the influence of a reducing atmosphere.
Finally, the mechanical resistance of the joints regarding flexural loading has been characterized employing a four-point bending method at room temperature and at relevant high temperatures varying the seal thickness.
Experimental Procedure
Materials Preparation and Thermal and Structural Characterization
Two glass-ceramic compositions within the BaO/SrO-MgO-B2O3-SiO2 system have been studied in this work. The first composition is based on BaO (27BaO·18MgO·7.5B2O3·47.5SiO2, mol%.) and the second is based on SrO (27SrO·18MgO·10B2O3·45SiO2 mol%.), named 7.5B(Ba) and 10B(Sr), respectively. Melting details for these two glass compositions have been reported previously in Rodríguez-López et al. (2017).
The dilatometric, thermal and some mechanical properties of these glasses and corresponding glass-ceramics can also be found in Rodríguez-López et al. (2017). The glasses have been milled in acetone, using agate balls and jars in a planetary mill. Glass powders with a particle size D(v,0.5) = 13 μm, have been employed in the sealing tests.
The viscosity-temperature curves of the glasses were measured combining a rotation method for low viscosity (η < 104 dPas; temperatures higher than 950°C) and a beam bending method for high viscosities (η: 1013-109 dPa·s; temperatures between 650 and 750°C). The viscosities of glass-ceramic samples were measured by beam bending.
The viscosity at high temperature was measured with a Haake viscometer with a sensor E1700 according to the ISO 7884-2 standard (ISO 7884–2, 1987). The beam bending viscometer was a VIS401 (Bahr Thermoanalyse) in a three points configuration with a separation of 40 mm between the two inferior points. The samples characterized by this technique were rectangular bars of base glass and glass-ceramics with dimensions ~45 × 4 × 3 mm. The glass-ceramic bars were obtained by uniaxial press of glass powders and thermal treatment for 24 and 100 h at 800°C for the composition 7.5B(Ba) and 750°C for the composition 10B(Sr). The measurements were carried out applying constant loads between 10 and 200 g employing heating ramps of 2°C/min from room temperature to the deformation temperature.
X-ray diffraction experiments were carried out using a Rigaku diffractometer, model Ultima IV (Rigaku, Tokio, Japan) equipped with a furnace and monochromatic radiation CuKα (λ = 1.5418 Å). The scan was 10–70° (2θ) with a step of 0.02°. The samples were heated employing a heating rate of 2°C/min. The diffractograms were acquired at different rates 7, 2, or 0.5°/min. The temperature was stabilized for 15 min before starting the XRD scan and it was kept constant to the end of the experiment. The following thermal treatment was employed for powders of composition 7.5B(Ba): from room temperature up to 1,000°C during 10 min and cooling down to 800°C and stabilization for 24 h. The following thermal treatment was employed for powders of composition 10B(Sr): from room temperature to 850°C and stabilization for 10 h.
Sealing Experiments
The application of the seal has been performed employing two different techniques: paste technology using a dispenser robot and screen printing.
Sealing Substrates
The seal is in direct contact with the electrolyte of the half cell (electrolyte/anode) and the interconnect material. As interconnect material, two types of steel were employed Crofer22APU and Crofer22H (ThyssenKrupp AG). These steels have been specially designed for its use as interconnects for IT-SOFC. Different thicknesses and shapes were used depending on the properties to be measured. The substrates were cleaned before the application of the glasses with ethanol in an ultrasounds bath for 5 min. The compositional details and some properties of the steels Crofer22H and Crofer22APU can be found in Data (2010), ThyssenKrupp VDM Gmb (2010). The steel Crofer22H developed on the basis of Crofer22APU shows better resistance against corrosion and less Cr evaporation, which reduces the cathode contamination.
Robot Dispenser
For robot dispensing, by means of a syringe, a binder containing 5% Ethylcellulose dissolved in α-Terpineole was prepared. A paste was obtained by mixing 82 wt.% of glass and 18 wt.% of binder solution. The paste was manually mixed, homogenized and dispersed by ultrasound in order to avoid the formation of agglomerates. The glass paste application was carried out with a x-y-robot dispenser controlled by a program. The samples for the gas-tightness measurement and electrical resistance tests of the seals were prepared by this technique. Two Crofer22APU steel square substrates of 50 × 50 mm and 2 mm thickness, one of them with a hollow of 10 mm of diameter were used to allow the gas diffusion in the sample interior (dual atmosphere exposition). Two layers were deposited in order to apply a total mass of 1 g, between layer applications; the glass paste was dried in a heat chamber at 55°C. Zirconia spacers of 180 μm were used in order to maintain a minimum seal thickness.
Screen Printing
This technique of seal application was employed due to its high speed and the possibility to apply the glass paste in defined areas with a certain thickness in a single step. The pastes employed with these processing techniques are slightly less viscous (Federmann et al., 2019) and contain a bigger proportion of binder solution. Moreover, the binder solution contains more diverse mixture of organic additives than the paste employed for the dispenser robot, among them: butyl glycolate, polyvinyl butyral (Mowital) and a non-ionic polymeric surfactant (Hypermer). The conditions of viscosity and content in binder employed were previously optimized for the sealant application in large stacks (Steinberger-Wilckens et al., 2011). This technique was employed to get samples for the determination of the mechanical properties of the joints (Wei et al., 2015). The steel substrates were bars of Crofer22APU of 25 × 6 × 4 mm, for the determination of the fracture strength by means of bending tests.
The steel substrates are fixed by means of a magnetic table in order to prevent their movement. The paste is deposited on a net of certain thickness and geometry, which allows the positioning of the paste in the desired areas when pressure is applied.
After the process, the samples are dried during 12 h in a stove (55°C). The bars were sealed together with the aid of a joining jig designed for this purpose.
Sealing
The sealing process was adjusted for each of the studied compositions. In all cases, a dead load was applied in order to increase the contact between the samples to be sealed. Glass composition 7.5B(Ba) was heated up to 1,000°C (2°C/min), stabilization at this temperature for 10 min, then cooling down to 850°C, stabilization at this temperature for 10 h and then cooling down to room temperature at 2°C/min. For glass composition 10B(Sr), the heating was only up to 850°C with a stabilization at this temperature for 10 h. In both cases, there was an intermediate step at 350°C for 30 min to burn out all the organic components being present in the glass pastes.
Some samples were thermally cycled to evaluate the influence of this treatment on the microstructure of the sealant, to evaluate some properties after annealing. The cycling program consisted of heating up to 750°C (10°C/min) and stabilization for 5 h and cooling down to room temperature at a rate of 1°C/min for 50 cycles.
Gas-Tightness Measurements
The gas-tightness was measured for sandwiched samples Crofer22APU/glass-ceramic seal/Crofer22APU and Crofer22H/glass-ceramic/Crofer22H. These samples have a hollow of 10 mm of diameter in the center of one of the steel plates which allows the passage of gases to the samples' interior. The detection equipment was a helium leakages detector UL200 (Inficon) employing a difference of pressure of 1 bar (da Cruz Payão Filho et al., 2000; Cela Greven, 2014).
The influence of the degree of crystallization on the gas-tightness property was also determined. Thermal treatments were carried out for 24, 100, 300, and 800 h, respectively, at 800°C. The gas tightness of the joints was measured after these thermal treatments at room temperature. The influence of the thermal cycling (again 50 cycles) was also assessed.
In order to study the influence of a reducing atmosphere on this property and on joints with a certain degree of crystallization, a thermal treatment for 100 h at 800°C in a 4% H2 in Ar atmosphere was carried out.
Electrical Resistance at High Temperature
The electrical resistance was determined using the gas-tightness test sandwich samples. The measurements were carried out via four points testing of the sealing using 4 platinum wires (Cela Greven et al., 2013). The resistance of the samples at room temperature was higher than 2 GΩ. The measurements were carried out up to 850°C employing a heating ramp of 2°C/min and applying a potential difference of 5 V. The measurements were carried out in a resistive electrical furnace which apply the potential difference to the sample through a transformer and measure the resistance (Cela Greven, 2014).
Chemical Compatibility of the Seals
The chemical compatibility of the sealant materials with the steel and electrolyte was assessed employing scanning electron microscopy (SEM) and EDS chemical analysis of transversal cross sections of the joints.
Several electron microscopes were employed for the investigation of the samples' microstructure. A table SEM model TM-100 (Hitachi) was employed for the investigation of the fracture surfaces and for obtaining images at low magnification. A FE-SEM model Mira3 (Tescan) with a coupled X-ray fluorescence spectrometer for disperse energy (EDX) Silicon Drif Detector (SDD)-X-MaxN from Oxford Instruments was used for the observations at high magnification. A SE Cambridge Stereoscan 360 with EDX spectrometer from Oxford Instruments was also used.
Fracture Strength of the Joints
The fracture strength of the sealed steel bars was measured using a four-point bending configuration. The procedure described in DIN EN 843–2 (2007) was followed. The separation between the inferior and superior supports was 40 and 20 mm, respectively. The displacement scan was 0.01 mm/min. The tests were carried out employing an Instron 1362 tests machine, with a load cell of 1.5 kN (Interface 1210 BLR), coupled with a tubular furnace. The displacement was recorded with a ceramic bar coupled to a linear variation differential transformer (Sangamo, LVDT, precision 1.25 μm). The heating rate was 2°C/min and a preload of ~2 N was employed. These measurements were carried out at room and high temperature and using alumina support.
Results and Discussion
Dilatometric Properties and Viscosity of the Glasses
The dilatometric properties of the selected compositions have been reported already in Rodríguez-López et al. (2017). The glass transition temperatures (Tg) are 655°C and 675°C for 7.5B(Ba) and 10B(Sr) glasses, respectively. Figure 1 shows the experimental viscosity data points adjusted with equations VFT and MYEGA (Mauro et al., 2009). Both equations provide a good fit. At the sealing temperatures of 800–950°C, both compositions possess viscosities between 104 and 107 dPa·s, so a good bonding with the cell components can be expected. The maximal sealing temperature for SOFCs is debatable due to the oxidation and creep behavior of the ferritic stainless steels used as stack parts (Quadakkers et al., 2003). Joining tests with reactive air brazes have been carried out up to 1,050°C with a dwell time of 30 min, which can be seen as a limiting boundary condition for the sealing process development (Weil et al., 2005).
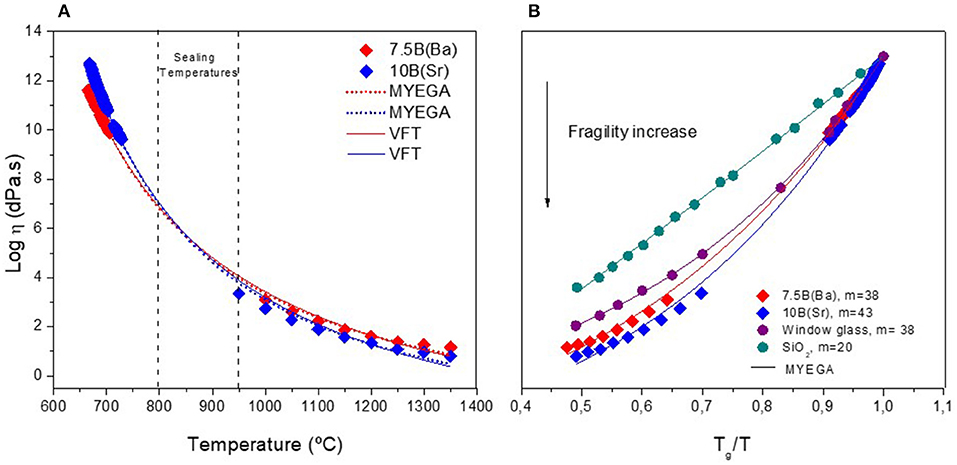
Figure 1. (A) Viscosity-temperature curves for the glasses 7.5B(Ba) and 10B(Sr). Fit of the experimental points: VFT equation (continuous lines) and MYEGA equation (dot lines). (B) Viscosity curves vs. Tg/T for the glasses 7.5B(Ba), 10B(Sr), window glass and silica, the continuous lines show the fit with MYEGA equation.
Sealing Stability and Gas-Tightness
A dispenser robot was used to apply the glass sealant on Crofer22APU steel plates and hence to obtain gas-tight joints. The sealing program, gas-tightness values, final thickness of the seal and glass viscosity are summarized in Table 1.
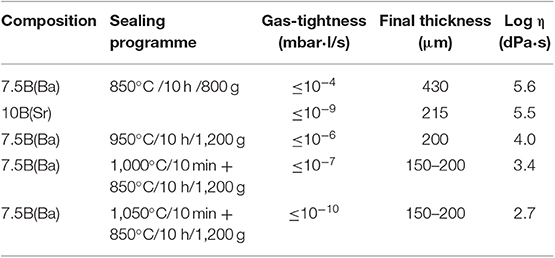
Table 1. Sealing in air, gas-tightness, and final thickness of the joints steel/glass-ceramic/steel.
The glass composition 10B(Sr) revealed an excellent gas-tightness of 10−9 mbar·l /s, even superior to the gas-tightness requirements for such materials (≤ 10−7 mbar·l /s per cm of joint; Eichler et al., 1999). The final thickness of the sealants is ~215 μm, which fits the desired thickness range in stacks of Forschungszentrum Jülich (between 200 and 250 μm; Steinberger-Wilckens et al., 2006). On the contrary, the composition 7.5B(Ba) provides a rather low gas-tightness 10−4 mbar·l /s and a higher thickness of ~430 μm. This composition possesses a larger sealant thickness due to its higher crystallization rate and hence higher viscosity. The viscosities reached during the sealing process which are presented in Table 1, reveal a good wettability of the substrate since for a good joining the glass must present viscosities in the 104-107 dPa·s (Weil, 2006). The viscosity of 7.5B(Ba) glass at 850°C (log η ~ 5.6) is suitable for sealing but the fast crystallization at this temperature leads to an increase of viscosity when increasing the crystalline fraction (Meinhardt et al., 2008) and as a consequence there is a limited wettability of the substrate and a higher seal thickness that leads to a poor gas-tightness.
In order to improve the gas-tightness of composition 7.5B(Ba), different sealing programs were employed, using also higher temperatures and loads to enhance the softening and wettability on the steel, favoring the sealing kinetics. The experiments are also summarized in Table 1. Increasing the sealing temperature and the applied load improves the gas-tightness significantly. The sealing at 950°C with a load of 1,200 g improves the leakage rate by two orders of magnitude (10−6 mbar·l/s), but this apparent gas-tightness is still below the requirements.
The experiments described in the following focused more on the increase of the temperature but for a short joining time (10 min) since above 1,000°C the steel softens significantly. An additional treatment at 850°C provides then a seal with higher crystallization degree and so enough mechanical stability at high temperature is expected. The gas-tightness reaches 10−7 and 10−10 mbar·l/s at 1,000 and 1,050°C, respectively. In these cases, the gas-tightness values improve three and six orders of magnitude, respectively, fulfilling the gas-tightness requirements (≤ 10−7 mbar·l/s). In spite of the excellent gas-tightness values obtained at 1,050°C, the temperature of 1,000°C was chosen for sealing due to the high chromium diffusion from the steal to the glass-ceramic as concluded from the green color displayed by the glass-ceramic sealed at 1,050°C and the respective specimens that were broken for inspection.
Once the sealing program was selected, two sandwich samples were prepared employing Crofer22H to investigate the differences in gas-tightness and so, the adherence differences between them. The same gas-tightness values were obtained employing different steels and no differences in terms of adherence appear to exist.
Evolution of the Gas-Tightness With the Crystallization Degree and Thermal Cycling
The joints discussed in the previous part were treated at 800°C in air, a typical operation temperature of planar SOFCs, and employing different types of treatment which simulates the crystallization of the sealant materials during stack operation. In this way, it is possible to study the evolution of the gas-tightness with the expected operation time in a realistic way. Moreover, the joints were thermally cycled (50 cycles) in order to evaluate the influence of thermal cycling on this property. The gas-tightness was measured in all cases at room temperature after each thermal treatment; the obtained results are summarized in Table 2.
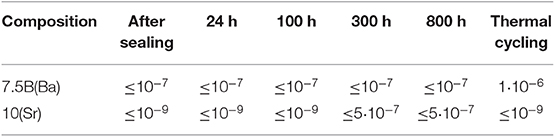
Table 2. Gas-tightness (mbar·l/s) of the joints Crofer22APU/glass-ceramic/Crofer22APU as a function of the treatment time at 800°C and after thermal cycling.
The annealing at 800°C for 800 h does not change the obtained gas-tightness for the composition 7.5B(Ba). It keeps constant for all the selected treatment times. After the thermal cycling, the gas-tightness decreased to 1·10−6 mbar·l/s, so the requirements were not fulfilled for this composition. The decrease in the gas-tightness can be a result of mechanical stresses caused by fast heating and cooling rates during the thermal cycling, which lead to the formation of small micro-cracks. The occurrence of such cracks can also be related to the lower percentage of glassy phase for this composition, since the glassy phase potentially helps to release stresses close to operation temperature, i.e., above the glass Tg (Chang et al., 2010; Cela Greven, 2014).
The gas-tightness behavior for composition 10B(Sr) is different. This composition keeps the gas-tightness requirements for all the studied thermal treatments although after 300 h of thermal treatment, the gas-tightness slightly decreases to around ≤ 5·10−7 mbar·l/s, probably due to the appearance of small pores and resulting low porosity associated with local contractions after the precipitation of crystalline phases with higher density than that of the initial starting glass. After the thermal cycles, this composition still guaranties a high gas-tightness, with values similar to those obtained after sealing, so the fast heating and cooling rates during the thermal cycling appear not to affect this property in this case. The greater amount of glassy phase of this composition is one of the factors helping to obtain the good stability since it favors stress relaxation. The higher mechanical strength of this composition vs. composition 7.5B(Ba) (Rodríguez-López et al., 2017) is another factor explaining the better response of the seal with respect to thermal cycling.
Effect of a Reductant Atmosphere on Gas-Tightness
In SOFCs, air is used as oxidant and fuel (e.g., H2, CH4, biogas, reformed diesel) as reductant, so it is interesting to study the effect of the high temperature treatments (800°C) in a reducing atmosphere on the gas-tightness of the joints. In this case, a single thermal treatment of 100 h in an Ar atmosphere with a 4% H2 was used. The selected samples were joints that were initially sealed in air (according to the optimized sealing procedures described in the experimental part) with a certain degree of crystallization (24 and 100 h at 800°C). The introduction of the reducing atmosphere in the cell is generally carried out once the seal has acquired a certain crystallization (after the completion of the sealing program), which is expected to provide a suitable mechanical stability.
The composition 10B(Sr) provides an excellent gas-tightness obtained for all samples treated in reducing atmosphere (≤ 2·10−9 mbar·l/s), verifying a high stability in this environment. On the contrary, the 7.5B(Ba) composition revealed a decrease in the gas-tightness values leading to values (10−5-10−6), smaller than those required and as a consequence this composition possesses low stability in hydrogen atmosphere.
Crystalline Phases After the Sealing Process
High temperature X-ray diffraction has been employed during a thermal treatment simulating the sealing program.
Figure 2A shows the results for 7.5B(Ba) glass composition. The first scan is carried out 1 min after reaching 1,000°C; the temperature was not stabilized for a longer time since a short sealing treatment is being employed (10 min). The diffractogram at 1,000°C shows as the first crystalline phases BaSi2O5, BaMg2Si2O7 and Ba3Si5O13. Results show that BaSi2O5 is the main phase at all studied temperatures and times although the peaks of the phase BaMg2Si2O7 also increase in terms of its intensity being the second predominant phase. When increasing the crystallization time, the phase Ba3Si5O13 disappears and it appears as a new phase Ba5Si8O21. After finishing the thermal treatment the phases are BaSi2O5, BaMg2Si2O7, and Ba5Si8O21. These are the same phases determined in Rodríguez-López et al. (2017) for a constant treatment at 800°C (without heating up to 1,000°C).
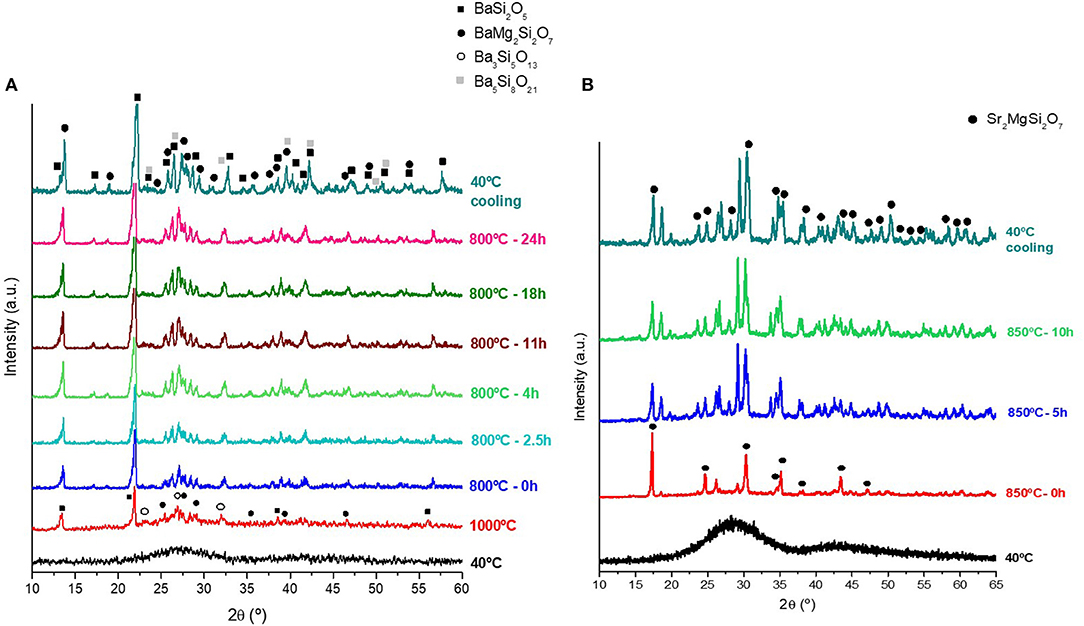
Figure 2. (A) High temperature X-ray diffraction of composition 7.5B(Ba). Heating rate 2°C/min and scan rate 2θ: 7°/min at 1000°C and 800°C−0 h and 2°/min for the rest of scans. (B) High temperature XRD of composition 10B(Sr). Heating rate: 2°C/min and scanning rate 2θ: 0.5°/min.
Figure 2B shows the XRD results at high temperature for the glass composition 10B(Sr) employing the sealing program described in the experimental part.
After reaching 850°C, the peaks corresponding to the phase Sr2MgSi2O7 can be observed and there are other diffraction peaks which assignation has not been possible as already explained in Rodríguez-López et al. (2017). The peaks increase in intensity with the treatment time being Sr2MgSi2O7 the predominant phase after completing the sealing treatment. After the thermal treatment, the diffraction peaks are coincident with those obtained in Rodríguez-López et al. (2017), so there is no difference in the precipitated crystalline phase when employing a higher thermal treatment temperature.
Electrical Resistance of the Joints at High Temperature
The electrical resistance after sealing at high temperature was evaluated using a four-point set-up. Figure 3A represents the resistance as a function of temperature for the two characterized glass compositions. The magnification shown in the inset indicates that both compositions provide good isolating properties although the strontium composition in general leads to higher resistance at the testing temperatures.
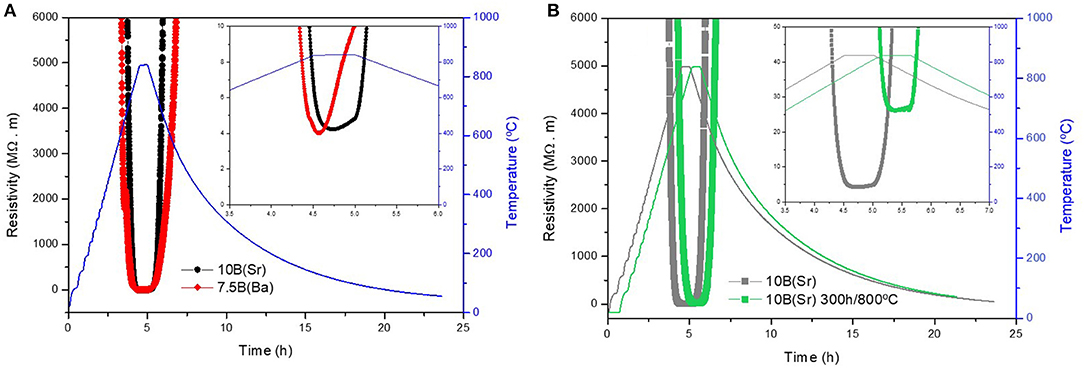
Figure 3. (A) Electrical resistance of the joints with compositions 7.5B(Ba) and 10B(Sr) after the sealing and at high temperature. (B) Electrical resistance at high temperature of the joints with composition 10B(Sr) after sealing and after 300 h of thermal treatment at 800°C.
All joints yielded an electrical resistance at room temperature higher than 2 GΩ, the resistance decreases with increasing temperature.
Table 3 presents the resistivity of each joint at different temperatures. The requirements for these materials are resistivities ≥103 Ω·m at a typical stack operation temperature of 800°C, so both compositions fulfill the requirements for these materials. Composition 10B(Sr) has a higher resistance at the temperatures presented in Table 3 although the resistivity values are in the same order of magnitude for both compositions, except at 700°C, where composition 10B(Sr) possesses an insulating character.
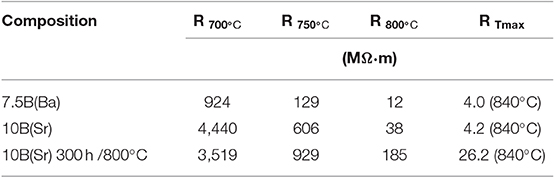
Table 3. Electrical resistance at high temperature of the joints.
The composition presenting better isolating properties was selected to evaluate the evolution of this property with the crystallization degree. For this purpose, a joint with 10B(Sr) glass composition with 300 h of treatment at 800°C was chosen. Figure 3B represents the difference of resistivities between a joint after sealing and another one with 300 h of thermal aging. In case of the aged sample, a high increase in resistivity is observed. Table 3 also shows the resistivity values of both samples at different test temperatures. The aged sample shows values of 185 MΩ·m at 800°C, while the joint just after sealing has a resistivity of 38 MΩ·m at the same temperature. So an increase of approximately one order of magnitude in the resistivity is confirmed when increasing the crystallization degree.
The crystalline phases not only provide mechanical stability at high temperature, but also provide a higher insulating character, hence, improving the electrical behavior of the stack.
Chemical Compatibility of the Joints
The previously described joints were embedded, cut and polished for the investigation of microstructures by SEM and EDS. In order to study the chemical compatibility, the Crofer22APU-glass-ceramic-Crofer22APU joints after sealing and after 800 h of thermal treatment at 800°C in air were selected. In this way, it was possible to observe the evolution of the joints and the glass-ceramic microstructure from the sealing process up to a short treatment period simulating the stack operation. The thermally cycled samples were also selected and the joints treated under reduced conditions (4% H2/Ar), in order to study how these two phenomena, affect the joints and microstructures.
Composition 7.5B(Ba)
Figure 4 shows the cross-section of the joint with composition 7.5B(Ba) after the sealing program. The void observed in the images is a result of the sample breakage for inspection after sealing. Figure 4A presents a general image in which it is possible to observe the outer and central zones of the joint. A high porosity is observed in the outer zones probably due to the insufficient evaporation of the binder employed for the application of the glass powder. The glass-ceramic exhibits a good densification and high crystallization degree (Figures 4B,C) after the sealing, the small cracks detected can be the reason why this composition did not reach a high gas-tightness compared with composition 10B(Sr) although they can also be due to the mechanical opening of the sample, for example the big transversal crack (Figure 4B) can be associated to this process. The detailed image of the interface between the glass-ceramic and the steel Crofer22APU demonstrates an excellent bonding with presence of crystallization at the interface.
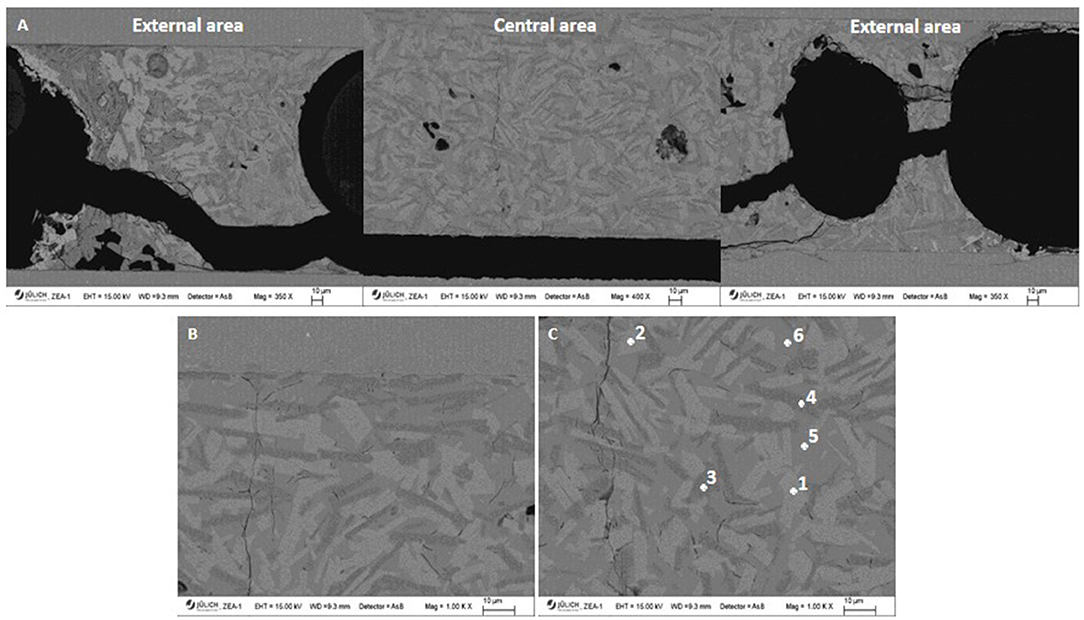
Figure 4. SEM images of the joint Crofer22APU-glass-ceramic 7.5B(Ba) after sealing (black void due to the opening of the sample for inspection). (A) General image of the joint showing outer and central areas. (B) Detail of the joint between steel and sealant. (C) Microstructure of the seal and EDX elemental analysis.
The EDX point analysis (Figure 4C, Table 4) reveals a structure and composition very similar to that presented in Rodríguez-López et al. (2017) for the glass-ceramic after 24 h of thermal treatment at 800°C. The spectra 1 and 2 indicate the presence of Ba, Si and O corresponding to barium silicate BaSi2O5, although the identification by EDX of the different present barium silicates in this glass-ceramic is complicated due to their close stoichiometry. The spectra 3 and 4 correspond to the phase with elongated crystals and with darker contrast containing Mg: BaMg2Si2O7. Finally, the spectra 5 and 6 correspond to the remaining vitreous phase.
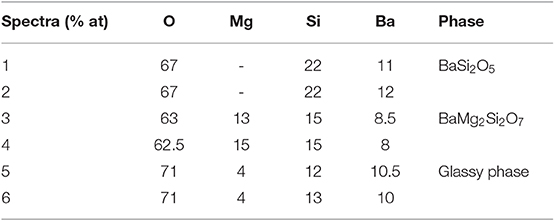
Table 4. Elemental analysis corresponding to Figure 4.
The interface steel/glass-ceramic was investigated in more detail by an EDX line scan (not shown). The elemental analysis does not reveal the existence of any intermediate layer between glass-ceramic and steel although there is a slight diffusion of steel elements toward the glass-ceramic, indicating that the native formed chromium oxide layer has been dissolved during the sealing process providing a suitable joining.
Composition 10B(Sr)
Figure 5A is a general view of the joint cross-section of composition 10B(Sr) after the sealing program, where it is possible to observe that the sample possesses a closed porosity and a lower degree of crystallization than composition 7.5B(Ba). If we compare the microstructures of the glass-ceramic in the joint with that of the glass-ceramic after 24 h of thermal treatment at 750°C, the increase of 100°C leads to a clear increase in the crystallization as well as in the size of the crystallites (Rodríguez-López et al., 2017). Figures 5B,C show the detail of the interface seal-steel and the very good adherence between glass-ceramics and Crofer22APU with crystal growth starting from the interface. The steel surface seems to enhance nucleation. Figures 5C,D and Table 5 shows the zones of point analysis by EDX. The spectra 1 and 2 correspond to the phase Sr2MgSi2O7 with similar proportion of Si and Sr. Spectra 3 and 4 correspond to a phase with stoichiometry SrMgSi2O6, formed by crystals with dark contrast and with bigger size than the previous phase. The dark points of small size correspond to spectra 5 and 6 which present SiO2 enrichment. The spectra 7 and 8 correspond to the remaining glassy phase and 9 to the steel Crofer22APU. Spectra 10 and 11 correspond to crystals of the phase Sr2MgSi2O7 close to the steel interface. The crystallites within this area closer to the steel show a slight presence of Cr and Fe that diffused from to steel to the glass-ceramics.
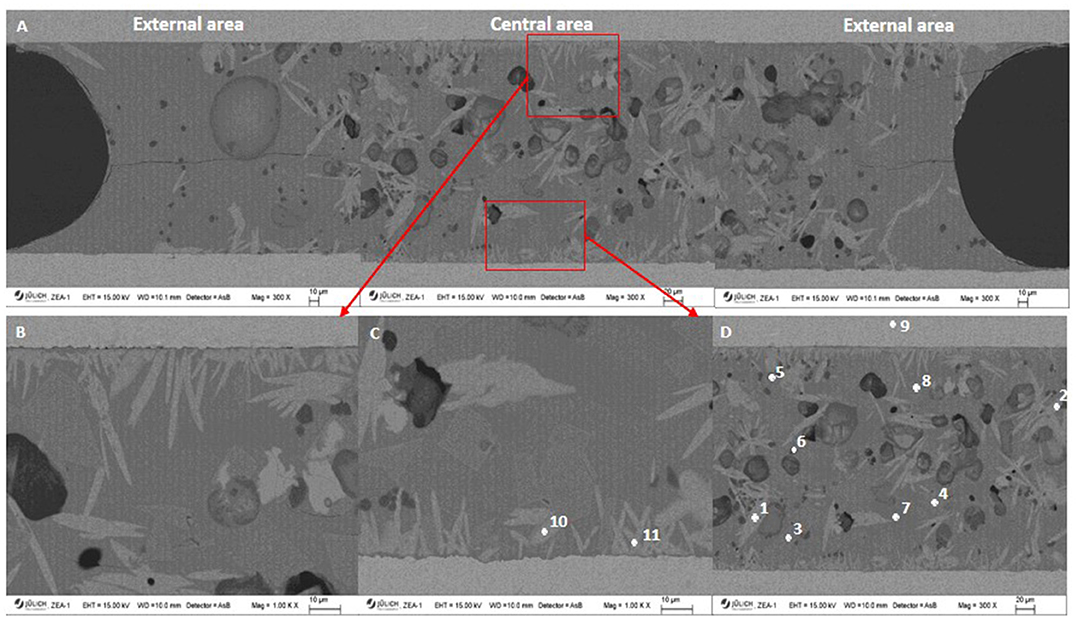
Figure 5. SEM images of the joint Crofer22APU-glass-ceramic seal 10B(Sr) after sealing at 850°C for 10 h. (A) General image of the joint showing the outer and central areas. (B,C) Detail of the joint between steel and sealant. (C,D) Microstructure of the seal and punctual elemental analysis by EDX.
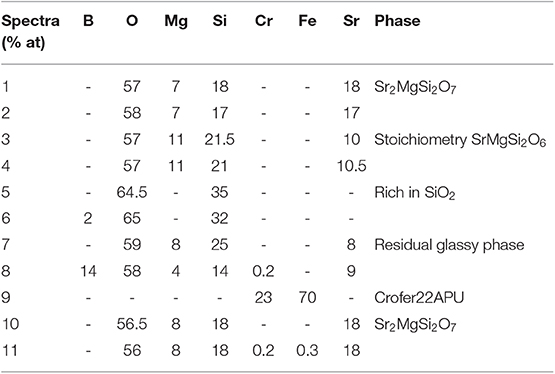
Table 5. Elemental analysis corresponding to Figure 5.
The linear elemental analysis obtained for both interfaces between steel and seal after joining (not shown) indicates that there is no formation of a new layer and no diffusion of Fe and Cr from the steel. In case of the inferior interface, a good bonding is also observed but there is a significant diffusion of Cr from the steel up to ~3 μm into the seal.
The EDX elemental analysis across the interfaces steel-glass-ceramic treated at 800°C for 800 h (Figures 6A–D) reveals in both cases the presence of a layer enriched in Cr, Mn, and O of ~2–3 μm thickness. The formation of this layer indicates a possible formation of (Mn, Cr)3O4, the formation of this layer has been widely described in the literature (Mantel, 2000; Yang et al., 2003, 2004; Chou et al., 2008; Smeacetto et al., 2009, 2013; Lin et al., 2012; Kaur et al., 2013) in the surface of ferritic stainless steels constituted by Fe, Cr, and Mn such as Crofer22APU. This layer is a stable coating (Kaur et al., 2013) and less reactive than Cr2O3, which can also be formed in the steel surface. The presence of this layer prevents the chromium evaporation and hence it minimizes the steel corrosion and it also avoids the possible formation of strontium chromates with high thermal expansion coefficient TEC (21–23·10−6 K−1, 25–1,000°C; Chou et al., 2007) which can cause the physical separation of seal and steel. Another positive aspect of this layer is that it improves the sealing interface acting as a transitional layer between metal and the glass-ceramic seal.
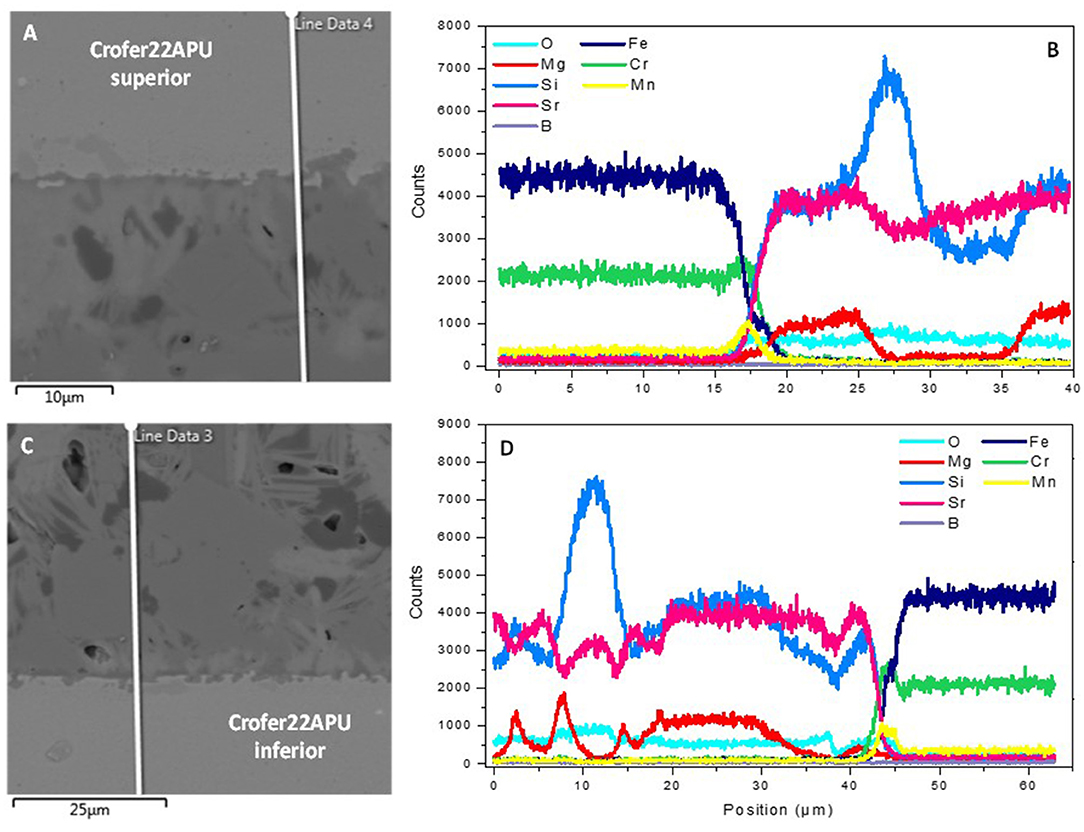
Figure 6. (A) Magnification of the interface superior steel Crofer22APU/glass-ceramic and (B) EDX linear analysis. (C) Magnification of the interface inferior steel/glass-ceramic and (D) EDX linear analysis. Glass-ceramic of composition 10B(Sr) treated at 800°C for 800 h.
The mapping of the interface inferior steel-glass-ceramic (Figure 7) confirms the presence of the spinel layer previously described since Cr and Mn are concentrated between steel and glass-ceramic. There is no diffusion of steel elements through the layer, which confirms the stability provided by this layer against steel degradation. The mapping also allows the identification of some of the crystalline phases such the phase with stoichiometry SrMgSi2O6 with higher Mg content which corresponds with the zones of high concentration of this element. The zones with high Si content correspond to the SiO2 reach phase. Although the Sr is distributed in all the analyzed areas, it is possible to distinguish zones with a higher concentration of this element corresponding to the phase Sr2MgSi2O7.
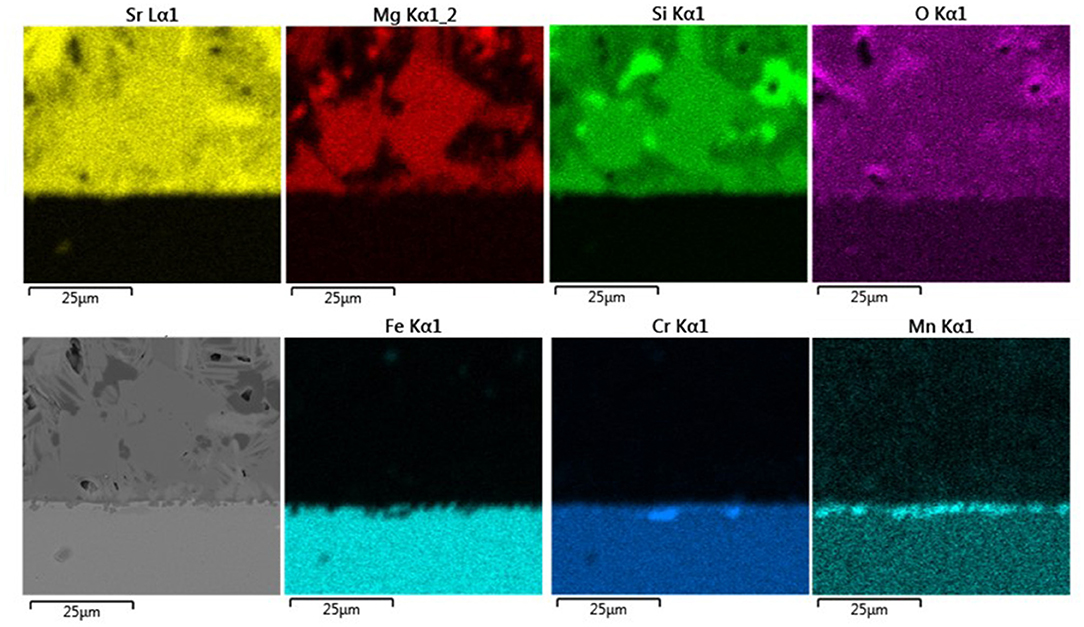
Figure 7. EDX elemental mapping for the joint inferior steel-glass-ceramic 10B(Sr) treated at 800°C for 800 h.
The cross-section of the samples treated in reducing atmosphere and after thermal cycling revealed similar good bonding characteristics (figures not shown). The thermally cycled samples showed as expected a higher crystallization degree but a stable joint.
Fracture Strength of the Joints
In order to determine the fracture stress of the joints at room and high temperature steel bars of Crofer22APU were sealed with glasses of the two selected compositions according to the experimental procedure and with the optimized sealing programs.
After sealing, the samples were rectified in order to obtain two flat surfaces and they were mechanically tested using 4-point bending. The fracture stress was then determined for samples with different sealing thickness.
Figure 8 shows the load-displacement curves as a function of temperature and sealant thickness. The bars sealed and tested at room temperature have a linear loading curve up to fracture, which demonstrates the brittle behavior of this type of materials; this behavior is observed for one layer applied by screen printing as well as two layers of glass-ceramic. The linear behavior disappears at 800°C, and the samples fail at lower loads compared to those measured at room temperature.
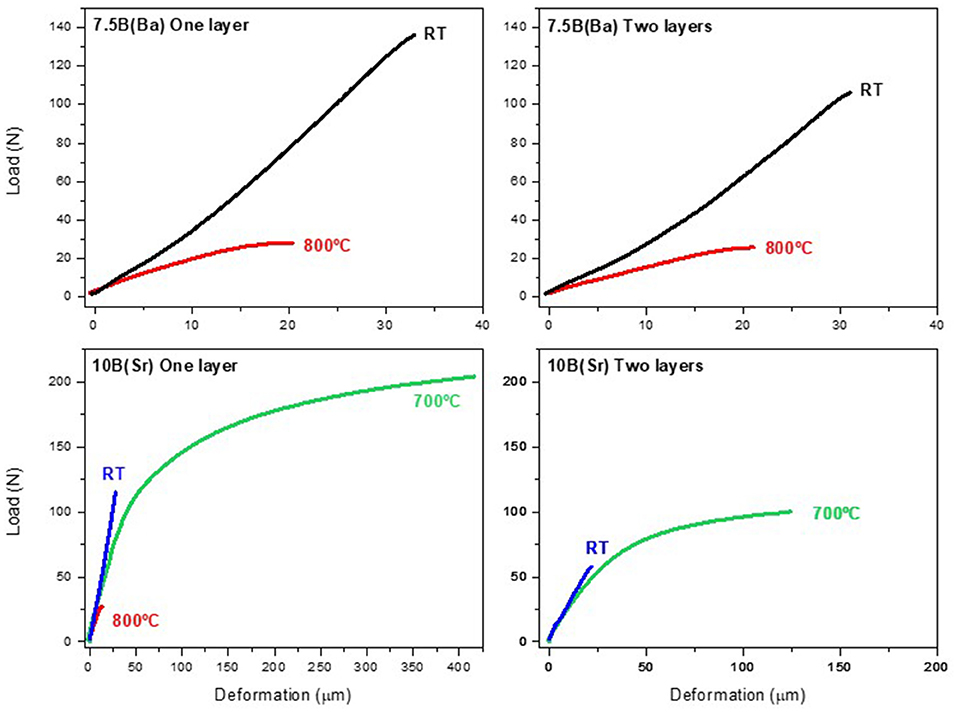
Figure 8. Load-deformation curves for the bars sealing with one or two layers applied by screen printing as a function of testing temperature for compositions 7.5B(Ba) and 10B(Sr).
In fact, the composition 10B(Sr) characterized at 700°C reveals a curve with a non-linear trend, where the plastic deformation continues for a long loading time, in that way, high deformations are obtained and the joint finally breaks at higher load values. In this case, the viscoelastic-plastic flow influenced by the remaining glassy phase promotes a ductile behavior at temperatures above Tg (Chang et al., 2010; Zhao, 2013) acting as a reinforcement mechanism of the joint and indicating also a stress relaxation effect due to the presence of the glassy phase (Chang et al., 2010). This behavior occurs independently of the sealant thickness and indicates a possible “self-healing” effect of the cracks produced during the test due to the glassy phase softening explaining the higher mechanical resistance of these samples.
In order to asses the origin of the massive deformation of the samples of 10B(Sr) composition during the high temperature measurements due to its lower refractory character compared with composition 7.5B(Ba), the viscosity was measured using “beam-bending” of glass-ceramic bars with the same thermal treatment (850°C during 10 h; graph not shown; Rodríguez-López, 2016). A strong increase in viscosity of the glass-ceramic was observed so the massive softening of this material is discarded at 700°C as well as 800°C since it possesses high viscosities between 1012 and 109.5 dPa·s in the temperature range between 938 and 950°C.
Table 6 summarizes the flexural strength obtained as a function of the seal thickness and temperature of testing. Composition 7.5B(Ba) offers a medium resistance of 42 MPa at room temperature. These values are superior to those reached for the 10B(Sr) composition with values of 30 MPa. This is probably due to the higher sealing temperature of the barium composition that provides a better adherence between the steel and the glass-ceramic although it also leads to higher degradation of the steel.
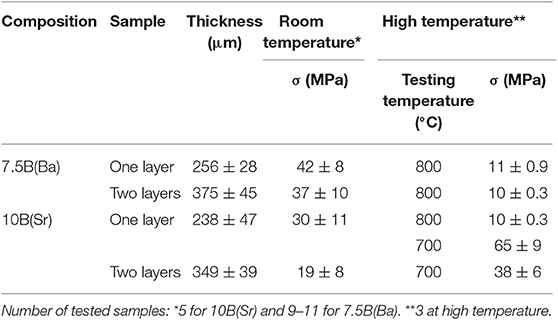
Table 6. Flexural resistance at room and high temperature as a function of the seal thickness.
Both seals present a decrease of the flexural resistance with the increase of temperature with reduction in the values of ~75% for the barium composition and ~66% for the strontium composition at 800°C, providing values of 11 and 10 MPa, respectively. The larger values are obtained for the strontium composition at 700°C, with resistances of 65 MPa, due to the already mentioned reinforcing effect of the glassy phase fluency. This behavior evidences the positive influence of the presence of glassy phase in the mechanical properties in this case.
The influence of the thickness of the sealant shows a slightly negative tendency onto this mechanical property in the case of composition 7.5B(Ba) although the values are constant within the measurement deviation. However, for the composition 10B(Sr), this influence is remarkably negative, diminishing the strength values at larger thickness. This influence can be explained by the compressive stresses produced during cooling that is induced by the differences in TEC between glass-ceramic and steel, which provoke an increase in the traction resistance. The residual compressive stress is higher for higher TEC difference (Malzbender et al., 2014). This effect is more important for the strontium composition, as can be observed in Figure 9A, due to the greater difference in TEC between the glass-ceramic and the Crofer22APU (Rodríguez-López et al., 2017). According to this argument, the 7.5B(Ba) glass-ceramics should have a smaller difference in TEC with Crofer22APU leading to a lower residual stresses in the joint.
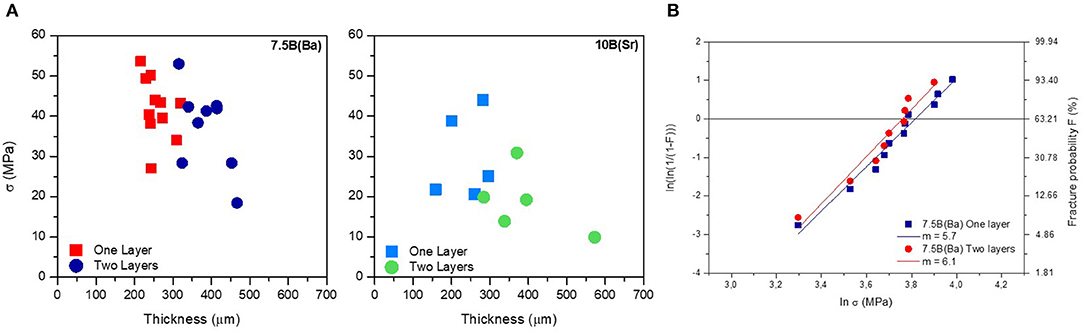
Figure 9. (A) Influence of the seal thickness on the flexural resistance values, left composition 7.5B(Ba), right composition 10B(Sr). (B) Weibull distribution for bars joined with one or two layers of glass-ceramic 7.5B(Ba).
The Weibull distribution was employed to check the reliability of these values, due to the bigger number of tested barium composition samples and taking into account the relevance of the number of tests when using this distribution only the results of this composition were used for a statistical analysis. Figure 9B shows the results of the two parameter Weibull distribution for bars sealed with one and two layers of glass-ceramics 7.5B(Ba). Note, although used here for discussion, strictly the statistical analysis requires a larger specimens number of ~30, hence the analysis presented here is only used to reveal tendencies in materials behavior.
The Weibull moduli are between 5.7 and 6.1, with a small increase of the reliability of the samples with larger thickness, however considering limited specimens number and statistical uncertainty, these can be considered as being identical; these values are similar to those obtained for sintered bars of this composition after 24 h of treatment (Rodríguez-López et al., 2017) which revealed a value of 6.4.
As expected, the strength values of the joints are smaller than those of bulk materials due to differences in the sintering and processing conditions, use of binder, plastificants, etc., which affect the final glass-ceramics microstructure and in particular its porosity.
If the obtained values are compared with those described in the literature employing the same type of test with similar sealant thickness, the values of 42 MPa obtained at room temperature for composition 7.5B(Ba) are superior to those described in the literature with values of 34 and 25 MPa for the seals H-P and B (Zhao, 2013; Malzbender et al., 2014), respectively, and similar to the values of 30 MPa obtained for composition 10B(Sr). At 800°C, the value ~10 MPa obtained for both compositions is 10 times higher than that obtained for the seal H-P with values ~1 MPa but less than the one presented by the seal B with values of ~30 MPa. Nevertheless, the best values of flexural resistance (65 MPa) obtained at 700°C for composition 10B(Sr) are superior to those of seals tested in a similar configuration.
Conclusions
Through the optimization of sealing programs, gas-tight joints were obtained for two glass-ceramic compositions which fulfill the requirements for SOFC operation. The 7.5B(Ba) composition requires a higher sealing temperature (1,000°C) to achieve the appropriate gas-tightness due to its higher crystallization rate, high viscosity and poor wettability. The sealing temperature of this composition is a drawback for its use as IT-SOFC sealant material, since the steel may suffer larger degradation and may even soften at these temperatures. In contrast, the 10B(Sr) composition has sufficient gas-tightness when it is sealed at the typical temperature employed for these materials (850°C). For this composition, the gas-tightness values meet the requirements in all studied cases: evolution with time of thermal treatment in air (degree of crystallization of the seal), thermal cycling response and thermal treatment in reducing atmosphere. The barium composition has low stability of gas-tightness, showing values below those required after thermal cycling and thermal treatments in reducing atmosphere.
The crystalline phases obtained during and after sealing do not vary when using higher temperatures than those employed for the preparation of bulk glass-ceramics from glass powder. The final phases are BaSi2O5, BaMg2Si2O7, Ba3S5O13, and Ba5Si8O21 for the 7.5B(Ba) composition and Sr2MgSi2O7 for the 10B(Sr) composition. The main crystalline phases were not altered, so the use of different temperatures is not stimulating the precipitation of new crystalline phases.
The high temperature electrical resistance of joints fulfills the electrical requirements for SOFC seals. The 10B(Sr) composition showed a higher resistivity than the barium composition. The crystalline phases contribute to the insulating character, since an increase in electrical resistance occurs after thermal aging.
A study of the cross-section of the sealed samples showed greater stability of the 10B(Sr) joints due to the formation of a Cr and Mn spinel, which confers stability to the interface. This layer reduces the evaporation of Cr from the steel and the diffusion of steel elements to the glass-ceramic seal, as well as helping to minimize the formation of corrosion products. Although the formation of this layer is not observed after sealing, it is detected after thermal treatments in reducing atmosphere, in air and after thermal cycling. This layer does not appear in case of the 7.5B(Ba) joints, where Cr diffusion from steel to the glass-ceramic was found.
The 10B(Sr) composition presents greater stability of the joints with thermal cycling because of its higher content in residual glassy phase, which helps to release the stresses produced during thermal cycling.
Flexural strength values obtained at room temperature (42 MPa) were higher for the 7.5B(Ba) composition due to the excellent densification of this composition in the center of the joints. The strength values at 800°C show a decrease by 66–75% (~10 MPa) compared to room-temperature results for both compositions. The 10B(Sr) composition presents the best strength results at 700°C with a value of 65 MPa. Load-displacement curves show linear behavior at room temperature, which is transformed into a non-linear behavior as the test temperature increases. At 700°C, the 10B(Sr) composition curves exhibit a ductile behavior, which indicates a viscous deformation effect of residual glassy phase. This phenomenon reinforces the strength of the joint, probably due to the self-healing of cracks caused during testing through the viscoelastic/plastic deformation of the glassy phase. The value obtained at 700°C is higher than the values found in the literature for SOFC sealing materials.
Overall, the results verify that the developed and tested material is promising for long term stable SOFC and SOEC application in advances stack designs aiding prolonged lifetime under thermal-cyclic conditions.
Data Availability Statement
The raw data supporting the conclusions of this article will be made available by the authors, without undue reservation, to any qualified researcher.
Author Contributions
SR-L carried out most of the experimental work and participate in the writing and discussion of the paper. JM carried out the joint strength measurements and participated in the discussion of results and writing of the paper. VJ and FS carried out the high temperature X-ray diffraction experiments and participated in the discussion of results. SG-B coordinated the gas-tightness and electrical resistance experiments and participated in the discussion of results. MP designed and structured the work coordinating all the experiments and participated in the writing and discussion of the paper.
Conflict of Interest
The authors declare that the research was conducted in the absence of any commercial or financial relationships that could be construed as a potential conflict of interest.
Acknowledgments
The authors thank the European project FP7-JTI-CP-FCH, Working toward Mass Manufactured, Low Cost and Robust SOFC stacks (MMLRC = SOFC), project reference: 278525. The authors are also grateful to project CNPq/PVE 400590/2013 and CAPES for financial support and C-LABMU/UEPG for the use of research facilities. SR-L thanks the financial support given by the Trust of the Journal of the European Ceramic Society (JECS Trust) through grant No. 201354.
References
Blum, L., Gross, S. M., Malzbender, J., Pabst, U., Peksen, M., Peters, R., et al. (2011). Investigation of solid oxide fuel cell sealing behaviour under stack relevant conditions at Forschungszentrum Jülich. J. Power Sources 196, 7175–7181. doi: 10.1016/j.jpowsour.2010.09.041
Cela Greven, B. (2014). Glass-ceramic sealant reinforcement for high-temperature applications (PhD Thesis). Forschungszentrum Jülich, RWTH Aachen University.
Cela Greven, B., Gross-Barsnick, S. M., Federmann, D., and Conradt, R. (2013). Strength evaluation of multilayer glass-ceramic sealants. Fuel Cells 13, 565–571. doi: 10.1002/fuce.201200155
Chang, H. T., Lin, C. K., and Liu, C. K. (2010). Effects of crystallization on the high-temperature mechanical properties of a glass sealant for solid oxide fuel cell. J. Power Sources 195, 3159–3165. doi: 10.1016/j.jpowsour.2009.12.008
Chou, Y. S., Stevenson, J. W., and Singh, P. (2007). Novel refractory alkaline earth silicate sealing glasses for planar solid oxide fuel cells. J. Electrochem. Soc. 154, B644–B651. doi: 10.1149/1.2733868
Chou, Y. S., Stevenson, J. W., and Singh, P. (2008). Effect of pre-oxidation and environmental aging on the seal strength of a novel high-temperature solid oxide fuel cell (SOFC) sealing glass with metallic interconnect. J. Power Sources 184, 238–244. doi: 10.1016/j.jpowsour.2008.06.020
da Cruz Payão Filho, J., Schmidt, W., and Schröder, G. (2000). Fundamentos de Ensaio de Vazamento e Estanqueidade. Jülich: Forschungszentrum Jülich.
Data, M. (2010). No, S., Crofer 22H Material Data Sheet No. 4050. Werdohl: VDM Metals GmbH. Available online at: https://www.vdm-metals.com/fileadmin/user_upload/Downloads/Data_Sheets/Data_Sheet_VDM_Crofer_22_H.pdf
DIN EN 843–2, 2007–03. (2007). Advanced Technical Ceramics—Mechanical Properties of Monolithic Ceramics at Room Temperature – Part 2: Determination of Young's Modulus, Shear Modulus and Poisson's Ratio, (Berlin).
Eichler, K., Solow, G., Otschik, P., and Schaffrath, W. (1999). BAS (BaO-Al2O3-SiO2)-glasses for high temperature application. J. Eur. Ceram. Soc. 19, 1101–1104. doi: 10.1016/S0955-2219(98)00382-3
Federmann, D., Zerfass, H., and Gross-barsnick, S. (2019). Method for Producing a Solder Glass Green Seal. U. S. Patent No 10,170, 775 B2. Washington DC: Patent, U. S., and Trademark Office.
Fergus, J. W. (2005). Sealants for solid oxide fuel cells. J. Power Sources 147, 46–57. doi: 10.1016/j.jpowsour.2005.05.002
Haanappel, V. A. C., Shemet, V., Gross, S. M., Koppitz, T., Menzler, N. H., Zahid, M., et al. (2005). Behaviour of various glass–ceramic sealants with ferritic steels under simulated SOFC stack conditions. J Power Sources 150, 86–100. doi: 10.1016/j.jpowsour.2005.02.015
ISO 7884–2. (1987). Glass—Viscosity and Viscometric Fixed Points - Part 2: Determination of Viscosity by Rotation Viscometers, (Geneve).
Kaur, G., Singh, K., Pandey, O. P., Homa, D., Scott, B., and Pickrell, G. (2013). Structural and thermal properties of glass composite seals and their chemical compatibility with Crofer 22APU for solid oxide fuel cells applications. J. Power Sources 240, 458–470. doi: 10.1016/j.jpowsour.2013.03.142
Lessing, P. A. (2007). A review of sealing technologies applicable to solid oxide electrolysis cells. J. Mater. Sci. 42, 3465–3476. doi: 10.1007/s10853-006-0409-9
Lin, C. K., Chen, J. Y., Tian, J. W., Chiang, L. K., and Wu, S. H. (2012). Joint strength of a solid oxide fuel cell glass-ceramic sealant with metallic interconnect. J. Power Sources 2015, 307–317. doi: 10.1016/j.jpowsour.2012.01.048
Lin, C. K., Liu, Y. A., Wu, S. H., Liu, C. K., and Lee, R. Y. (2015). Joint strength of a solid oxide fuel cell glass-ceramic sealant with metallic interconnect in a reducing environment. J. Power Sources 280, 272–288. doi: 10.1016/j.jpowsour.2015.01.126
Malzbender, J., Zhao, Y., and Beck, T. (2014). Fracture and creep of glass-ceramic solid oxide fuel cell sealant materials. J. Power Sources 246, 574–580. doi: 10.1016/j.jpowsour.2013.08.010
Mantel, M. (2000). Effect of double oxide layer on metal–glass sealing. J. Non. Cryst. Solids 273, 294–301. doi: 10.1016/S0022-3093(00)00137-X
Mauro, J. C., Yue, Y., Ellison, A. J., Gupta, P. K., and Allan, D. C. (2009). Viscosity of glass forming liquids.Proc. Natl. Acad. Sci. U. S. A. 106:19780. doi: 10.1073/pnas.0911705106
Meinhardt, K. D., Kim, D. S., Chou, Y. S., and Weil, K. S. (2008). Synthesis and properties of a barium aluminosilicate solid oxide fuel cell glass-ceramic sealant. J. Power Sources 182, 188–196. doi: 10.1016/j.jpowsour.2008.03.079
Nielsen, K. A., Solvang, M., Nielsen, S. B. L., and Beeaff, D. (2008). Mechanical behaviour of glassy composite seals for IT-SOFC application. Adv. Solid Oxide Fuel Cells II Ceram. Eng. Sci. Proc. 27, 315–323. doi: 10.1002/9780470291337.ch31
Quadakkers, W. J., Piron-Abellan, J., Shemet, V., and Singheiser, L. (2003). Metallic interconnectors for solid oxide fuel cells - a review. Mater. High Temp. 20, 115–127. doi: 10.1179/mht.2003.015
Rodríguez-López, S. (2016). Propiedades termomecánicas de sellos vitrocerámicos del sistema RO-MgO-B2O3-SiO2 (R=Ba, Sr) para SOFC (PhD Thesis). CSIC, Autonoma University of Madrid, Madrid, Spain.
Rodríguez-López, S., Haanappel, V. A. C., Durán, A., Muñoz, F., Mather, G. C., Pascual, M. J., et al. (2016). Glass-ceramic seals in the system MgO-BaO-B2O3-SiO2 operation under simulated conditions. Int. J. Hydrog. Energy 41, 15335–15345. doi: 10.1016/j.ijhydene.2016.07.051
Rodríguez-López, S., Wei, J., Laurenti, K. C., Mathias, I., Justo, V. M., Serbena, F. C., et al. (2017). Mechanical properties of solid oxide fuel cell glass-ceramic sealants in the system BaO/SrO-MgO-B2O3-SiO2. J. Eur. Ceram. Soc. 37, 3579–3594. doi: 10.1016/j.jeurceramsoc.2017.03.054
Smeacetto, F., Chrysanthou, A., Moskalewicz, T., and Salvo, M. (2013). Thermal cycling of Crofer22APU-sealant-anode supported electrolyte joined structures for planar SOFCs up to 3000 h. Mater. Lett. 111, 143–146. doi: 10.1016/j.matlet.2013.08.025
Smeacetto, F., Chrysanthou, A., Salvo, M., Zhang, Z., and Ferraris, M. (2009). Performance and testing of glass-ceramic sealant used to join anode-supported-electrolyte to Crofer22APU in planar solid oxide fuel cells. J. Power Sources 190, 402–407. doi: 10.1016/j.jpowsour.2009.01.042
Smeacetto, F., Salvo, M., Ferraris, M., Casalegno, V., Asinari, P., and Chrysanthou, A. (2008). Characterization and performance of glass–ceramic sealant to join metallic interconnects to YSZ and anode-supported-electrolyte in planar SOFCs. J. Eur. Ceram. Soc. 28, 2521–2527. doi: 10.1016/j.jeurceramsoc.2008.03.035
Steinberger-Wilckens, R., Blum, L., Buchkremer, H. P., de Haart, B., Malzbender, J., and Pap, M. (2011). Recent results in solid oxide fuel cell development at Forschungszentrum Juelich. ECS Trans. 35, 53–60. doi: 10.1149/1.3569978
Steinberger-Wilckens, R., Blum, L., Buchkremer, H. P., Gross, S., Bert de Haart, L., Hilpert, K., et al. (2006). Overview of the development of solid oxide fuel cells at Forschungszentrum Juelich. Int. J. Appl. Ceram. Technol. 3, 470–476. doi: 10.1111/j.1744-7402.2006.02102.x
Stephens, E. V., Vetrano, J. S., Koeppel, B. J., Chou, Y., Sun, X., and Khaleel, M. A. (2009). Experimental characterization of glass-ceramic seal properties and their constitutive implementation in solid oxide fuel cell stack models. J. Power Sources 193, 625–631. doi: 10.1016/j.jpowsour.2009.02.080
Timurkutluk, B., Ciflik, Y., and Korkmaz, H. (2015). Strength evaluation of glass-ceramic composites containing yttria stabilized zirconia after thermal cycling. Ceram. Int. 41, 6985–6990. doi: 10.1016/j.ceramint.2015.01.153
Wei, J., Pecanac, G., and Malzbender, J. (2015). Mechanical behavior of silver reinforced glass-ceramic sealants for solid oxide fuel cells. Ceram. Int. 41, 15122–15127. doi: 10.1016/j.ceramint.2015.08.084
Weil, K. S. (2006). The state-of-the-art in sealing technology for solid oxide fuel cells. JOM 58, 37–44. doi: 10.1007/s11837-006-0052-6
Weil, K. S., Kim, J. Y., and Hardy, J. S. (2005). Reactive air brazing: a novel method of sealing SOFCs and other solid state electrochemical devices. Electrochem. Solid-State Lett. 8, A133–A136. doi: 10.1149/1.1850391
Yang, Z., Hardy, J. S., Walker, M. S., Xia, G., Simner, S. P., and Stevenson, J. W. (2004). Structure and conductivity of thermally grown scales on ferritic Fe-Cr-Mn steel for SOFC interconnect applications. J. Electrochem. Soc. 151:A1825. doi: 10.1149/1.1797031
Yang, Z., Xia, G., Meinhardt, K. D., Weil, K. S., Stevenson, J. W., and Scott, K. (2003). Chemical stability of glass seal interfaces in intermediate temperature solid oxide fuel cells. J. Mater. Eng. Perform. 22, 2892–2899. doi: 10.1007/s11665-013-0731-8
Keywords: glass-ceramic, sealing, gas-tightness, thermomechanical properties, joint strength, SOFC
Citation: Rodríguez-López S, Malzbender J, Justo VM, Serbena FC, Groß-Barsnick SM and Pascual MJ (2020) Thermo-Mechanical Stability and Gas-Tightness of Glass-Ceramics Joints for SOFC in the System MgO-BaO/SrO-B2O3-SiO2. Front. Mater. 7:19. doi: 10.3389/fmats.2020.00019
Received: 01 November 2019; Accepted: 16 January 2020;
Published: 07 February 2020.
Edited by:
Valeria Cannillo, University of Modena and Reggio Emilia, ItalyReviewed by:
Francesco Basoli, Campus Bio-Medico University, ItalyGuglielmo Macrelli, Independent Researcher, Este, Italy
Copyright © 2020 Rodríguez-López, Malzbender, Justo, Serbena, Groß-Barsnick and Pascual. This is an open-access article distributed under the terms of the Creative Commons Attribution License (CC BY). The use, distribution or reproduction in other forums is permitted, provided the original author(s) and the copyright owner(s) are credited and that the original publication in this journal is cited, in accordance with accepted academic practice. No use, distribution or reproduction is permitted which does not comply with these terms.
*Correspondence: Maria J. Pascual, mpascual@icv.csic.es