 Valentina Iozzino
 Annarita De Meo
 Roberto Pantani
94% of researchers rate our articles as excellent or good
Learn more about the work of our research integrity team to safeguard the quality of each article we publish.
Find out more
ORIGINAL RESEARCH article
Front. Mater. , 28 November 2019
Sec. Polymeric and Composite Materials
Volume 6 - 2019 | https://doi.org/10.3389/fmats.2019.00305
This article is part of the Research Topic Biodegradable Matrices and Composites View all 25 articles
Poly(Lactic Acid), PLA represents a very interesting polymer for industrial applications because of its good processability, the possibility of being obtained from renewable sources, good physical properties, biocompatibility, and biodegradability. The major depolymerization mechanism and the step that controls the rate of PLA biodegradation in compost is represented by the hydrolysis. The characteristic of being degradable is not per se an advantage: the inclination to degrade in the presence of water represents a limit for specific industrial applications, especially for durable components that are designed for long-period utilization such as in the automotive, electronic, and agricultural sectors, as well as in medical applications. Being able to control the degradation rate would be a real advantage: a product should preserve its characteristics during processing and for a time comparable to its application but should be nevertheless fully biodegradable at longer times. Furthermore, a gradient of properties could allow producing samples in which some portions degrade at a faster rate and some others at a slower one. Different methods can be used to influence the degradation rate of PLA, some examples are blending, copolymerization and surface modification. However, these change the physical properties of the material. Any factor influencing the rate of hydrolysis can affect the biodegradation process. The objective of this work is verifying the possibility to modulate the rate of degradation in the same part, in time and at different rates. The method is represented by a technique that influences locally the morphology of the samples. Biphasic samples (half amorphous and the other half crystalline) were obtained by micro-injection molding and the degradation process was monitored by means of hydrolysis tests. The analysis confirmed the crystalline regions show a slightly better resistance to the hydrolysis compared to the amorphous.
In the last decades, environmental and economic challenges led scientists and producers to replace, in part, oil-based polymers with biodegradable. Poly(l,l-lactide) acid, hereafter called PLA, represents a good candidate. PLA is a thermoplastic characterized by a high value of strength and a high modulus. The resources that are used to produce PLA, like rice, corn or wheat, are annually renewable. Moreover, it is compostable and can be recycled (Drumright et al., 2000; Sawyer, 2003), producing this polymer consumes carbon dioxide (Dorgan et al., 2001). Another advantage of the PLA is its biocompatibility, especially for biomedical applications, in fact, it is not toxic for local tissues (Farah et al., 2016). Furthermore, the degradation products do not affect tissue healing. The use of PLA, that was limited for medical and dental applications in the past, is turning into common applications like packaging and single-use products.
Being interested in the use of PLA in engineering areas and in applications for higher added value, currently, many scientists focused their attention in the production of new biodegradable polymers that have better processability, mechanical properties, and thermal resistance, as well as long durability and stability (Murariu and Dubois, 2016). In the last years, the market is turning to more “durable” biomaterials like engineering parts for electronics and automotive industry (Drumright et al., 2000; Auras et al., 2004; Guptaa et al., 2007; Jamshidian et al., 2010; Nampoothiri et al., 2010; Babu et al., 2013; Raquez et al., 2013; Murariu et al., 2014; Wertz et al., 2014). The concern for the use of this polymer to satisfy the market needs of bioplastics with a long duration, in sectors such as electronics and automotive components and obtain a processability similar to that of the existing polymers, is causing a rapid growth in PLA production.
The PLA products can be obtained by using the common processing techniques like extrusion, injection molding and compression molding (Garlotta, 2001; McKeen, 2014). Ghosh et al. (2008) verified that the technique for shear controlled orientation in injection molding, called SCORIM, can have an effect on the final energy at break as well as the maximum stress. However, due to its high viscosity, and a relatively narrower processing windows with respect to other resins, only under particular conditions, PLA can be processed by microinjection molding and most of the literature research focused on the microinjection molding of PLA composites or blends (Zhao et al., 2018; Zhou et al., 2018).
To enhance PLA properties, many efforts are undertaken via different techniques and modifications, adding additives (Iozzino et al., 2018) or by realizing physical treatments (Harris and Lee, 2008; De Santis et al., 2017). Some workers proved that by increasing the crystallinity of PLA products the chemical and thermal resistances improve (Gamez-Perez et al., 2011). For this reason, the study of the crystallization kinetics of PLA was of relevant importance (Pantani et al., 2010).
The degradation of biopolymers is the result of two mechanisms: the chemical hydrolysis and the water and oligomer diffusion. In order to estimate the effects of one of the two mechanisms, the hydrolytic degradation kinetics in the chemical regime, the study can be performed in solution (Zhang et al., 1994; De Jong et al., 2001). Different authors suggest an Arrhenius-dependent kinetics (Tsuji, 2003; Weir et al., 2004; Speranza et al., 2014). Many papers concerned the hydrolysis of PLA, studying the elements that can affect the mechanism of chain scission like the molecular weight, the temperature and the chain stereo-configuration (Lostocco and Huang, 1998; Drumright et al., 2000; Gorrasi and Pantani, 2017). Some workers verified that the carboxyl end groups accelerate the hydrolysis of PLA (Li et al., 1990; Hocking et al., 1995), and the kinetics solution is determined by the pH of the degrading medium (De Jong et al., 2001). The mechanism of hydrolysis is still under investigation, in fact, some authors verified that the scission of the chains occurs randomly also in acid (Shih, 1995) or in basic conditions (Belbella et al., 1996). The process of chain scission compared to the end scission determines a substantial reduction of the physical properties (Gleadall et al., 2014). Although, the influence of the stereochemical composition is still not clear (Gorrasi and Pantani, 2013).
The control of the biodegradation rate is interesting for the application in many sectors (Ha and Xanthos, 2010). There are several techniques that can be used to modify the rate of biodegradation. Examples are developments of blends, copolymers and use of particular fillers (Arias et al., 2014; Stloukal et al., 2015; Iozzino et al., 2018).
Literature research reveals that the morphology itself of the PLA can affect its degradation. Since the possibility for the water molecules to enter inside the rigid crystalline regions is extremely limited, the crystalline portion of PLA parts show higher resistance to the hydrolysis respect to amorphous regions. When different crystallinity levels are present in the part, the hydrolysis proceeds breaking the chains in the amorphous regions, therefore, removing the oligomers and monomers that are soluble in water, only intact crystalline regions remain (Tsuji, 2010). Others (Pantani and Sorrentino, 2013) demonstrated, also, that the initial morphology of PLA parts has a high influence on the degradation, in particular on the swelling and flake off processes. Completely amorphous PLA showed a higher degradation than semicrystalline PLA in presence of the same conditions of hydrolytic process (Fukushima et al., 2013). The amount of hydrolysis found for amorphous PLA parts was considerably high. In crystalline polymers the hydrolytic attack of ester bonds can be favorite.
The aim of this work is the production of parts with different morphologies, investigate the effect of the hydrolysis on the degradation of the poly-lactid acid parts and therefore observe the establishment of a profile of the properties inside each sample. In particular, thin PLA bars characterized by different crystallinity along the length were produced by microinjection molding adopting a novel technique that permits the local control of the temperature during and after the process thus affecting the crystallization in a selected region of the sample (De Santis and Pantani, 2016). The crystallinity, the evolution of the molecular weight and the mechanical properties of biphasic samples with different times of hydrolysis were investigated.
The material used in this work is a commercial PLA, the 4032D, supplied by Natureworks. Its D-enantiomer content is approximately equal to 2%. The molecular weight distribution detected by chromatography: Mn 119,000 g/mol and Mw 207,000 g/mol. In order to prevent viscosity degradation, each test was preceded by a drying procedure for the material that was kept for 8 h at 60°C under vacuum.
PLA bars were produced by injection molding with a Haake MiniJet Machine and a mold with a cavity geometry of 10 × 4 mm with a thickness of 0.25 mm. Micromolding was carried out at a melt temperature of 220°C, injection pressure of 150 bar, post injection pressure of 140 bar. The whole process was carried out under a nitrogen atmosphere. The cavity was inserted in a special mold equipped with a control system for the temperature of the cavity surfaces. This system adopted resistances to heat the surfaces of the cavity by Joule effect and thermocouples that allowed controlling the temperature by switching the current to the heaters. As showed in Figure 1, the process involved different steps: after the cavity surfaces were heated up to 160°C the molten PLA was injected into the thin the cavity (injection step), the material was cooled by switching off the resistances from about 160°C to about 50°C in 15 s (cooling step). Then only one zone of the solid injected sample was kept at 105°C for 500 s (annealing step). Since the PLA has very slow crystallization kinetics, the region of the injection-molded parts that did not experience the annealing step resulted to be fully amorphous. The region that was kept at 105°C (De Meo et al., 2018) resulted crystalline. Two protocols were used to produce the samples for the degradation study. In protocol “a,” after the filling and cooling steps, the region under annealing is the one after the gate. In the protocol “b,” the region under annealing is the tip of the sample (Figure 1).
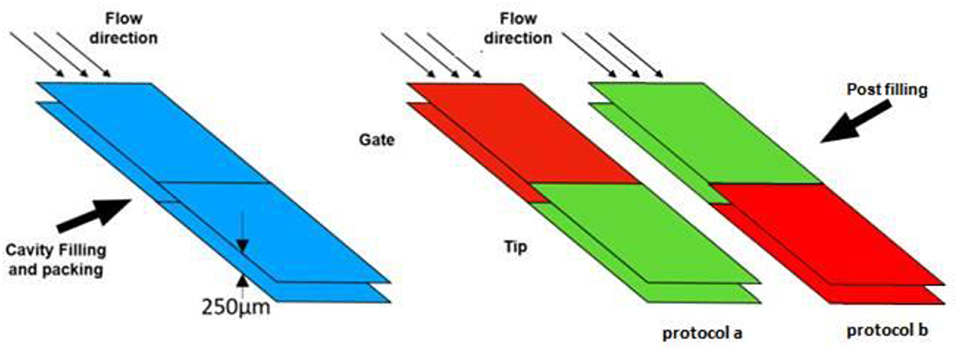
Figure 1. Schematic of the steps for the parts production.
The degradation of the PLA parts was investigated by means of hydrolysis tests. Each sample was immersed into distilled water. In line with the ASTM and ISO standards, the biodegradation experiments were carried out at 58°C. The samples have been put individually in containers with distillated water where the quantity of water [ml] was 800 times the quantity of the dried sample [g]. A thermostatic bath equipped with a lid was adopted to mantain the temperature constant and equal to 58°C during the hydrolysis experiments. After every 24 h of hydrolysis, the water of each sample was analyzed by using a Crison pH-meter at 25°C. The water used in this work has a pH value of about 6.5. The water of each sample was replaced by the same amount of fresh distilled water to assure that the pH value of the hydrolysis medium remains constant. This operation was carried out by using a syringe which needle diameter is 0.2 mm. In order to carry out the necessary analysis, the samples were collected and dried in vacuum conditions at 60°C for about 3 h and then weighed. The samples, for the whole hydrolysis test, remain in their vessels, to avoid losses of the hydrolyzed material. All tests were carried out on at least three samples. The results reported refer to the average upon all the tests. The hydrolysis of all samples was carried out for about 60 days. After 60 days, since the samples became fragments with a very small mass an accurate analysis was not possible anymore.
Calorimetric analysis were carried out to monitor the crystallinity with the time of hydrolysis. A Mettler DSC822 in flowing nitrogen atmosphere was used for this purpose. To obtain reliable measurements, the indium, which is a standard material, was used to calibrate the heat flow and the temperature Thermograms were obtained by considering a mass of about 5 mg for each sample and the following thermal program:
• Heating at 10°C/min from −10°C to 200°C (first heating);
• Isothermal step for 5 min at 200°C;
• Cooling step at 10°C/min from 200°C to−10°C (cooling);
• Heating at 10°C/min from −10°C to 200°C (second heating).
As hydrolysis proceeds, the evolution of molecular weight of the microparts was monitored by performing GPC analyses. A HPLC Waters (Milford, MA, USA) fitted out with an auto-sampler. After dissolving the parts in thetrahydrofuran (THF), considering a ratio between the sample mass and the quantity of solvent at 50°C equal to 1 [g/mol], a 0.45 μm filter Chromafil PTFE was used for the investigation.
The breaking force was evaluated by means of penetration mechanical tests. The dynamic mechanical measurements were performed by using the Perkin Elmer DMA 8000 (Waltham, MA, USA). The machine is equipped with a tip that has a diameter of 150 μm. For each experiments, the maximum value of force was equal to 7 N and the load rate was 0.2 N/min. A schematic of the device used is shown in Figure 2. The sample was placed under the tip with an increasing force up to the maximum allowed value of 7 N (the instrumental limit). DMA returned the values of the force and the displacement of the tip.
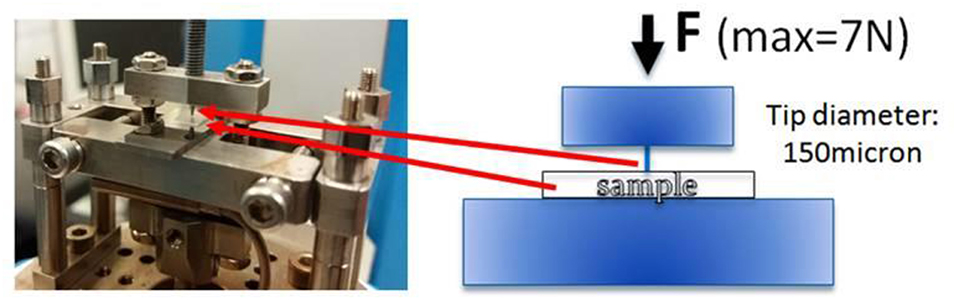
Figure 2. Assembly for penetration test and scheme of the test.
PLA bars were obtained by microinjection molding. To permit the filling in the microcavity and prevent a premature solidification, a value of temperature between the glass transition temperature and the melting temperature was applied at the surface of the cavity without changing the temperature of the rest of mold. The special system, as showed in Figure 3, is able to increase the temperature of the cavity surfaces from 60°C, temperature of the mold, to 150°C. That value was set just before the filling, manually activated at the machine, and was kept until the injection step ended. After that, by switching off the heaters the rapid cooling led the surfaces in less than 10 s to 60°C. Without extracting the sample from the mold the preparation of each sample included a second step in which an isothermal step (crystallization step) involved only an area of the injected samples. A temperature of 105°C was applied for 500 s. In these conditions, a low crystallization time is expected (De Meo et al., 2018).
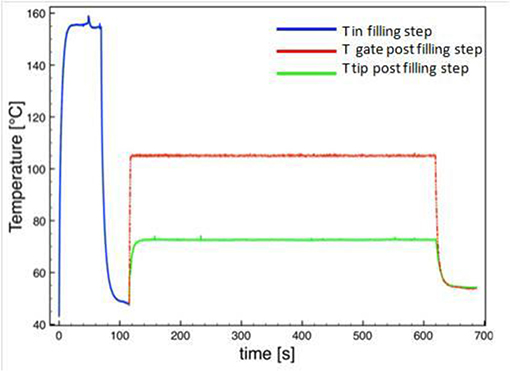
Figure 3. Temperature measurements during the process.
The hydrolysis mechanism represents the main cause is the main of depolymerization in fact, it controls the biodegradation in compost. The hydrolysis rate, therefore, indicates the rate of degradation during composting. The samples were put in distilled water and at the set time were taken out and dried for the needed investigations: optical, calorimetric, GPC and mechanical analysis.
All the samples were observed and photographed under polarized light. As showed in the Figure 4 there was a clear difference between the two regions of the sample: the amorphous region was transparent whereas the crystalline one appeared opaque. Analyzing the images of the samples under hydrolysis it is evident that the crystalline zone of the sample remained unchanged for a time of 12 days (Figure 5). The appearance of the amorphous zone changed after the second day turning from transparent to opaque. The same phenomenon was already observed in the PLA (Pantani and Sorrentino, 2013). This could be due to the micro-fractures due to the water moving away from the sample during the drying phase. Obviously, the crystalline zone had a lower water permeability at least for the first 25 days of hydrolysis. From 30 days there were no differences between the two different morphologies. The degradation tests confirmed that crystalline regions had a slightly better resistance to hydrolysis.
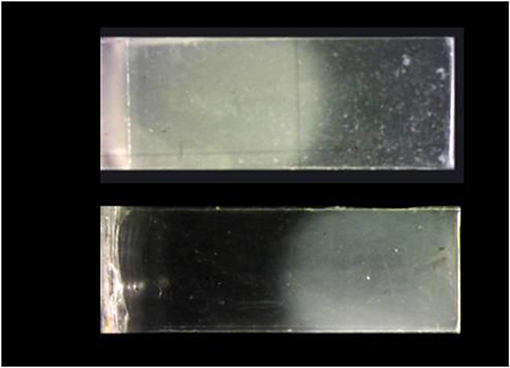
Figure 4. Not hydrolyzed biphasic samples, on the top the one produced by Protocol “a” and bottom by Protocol “b”.
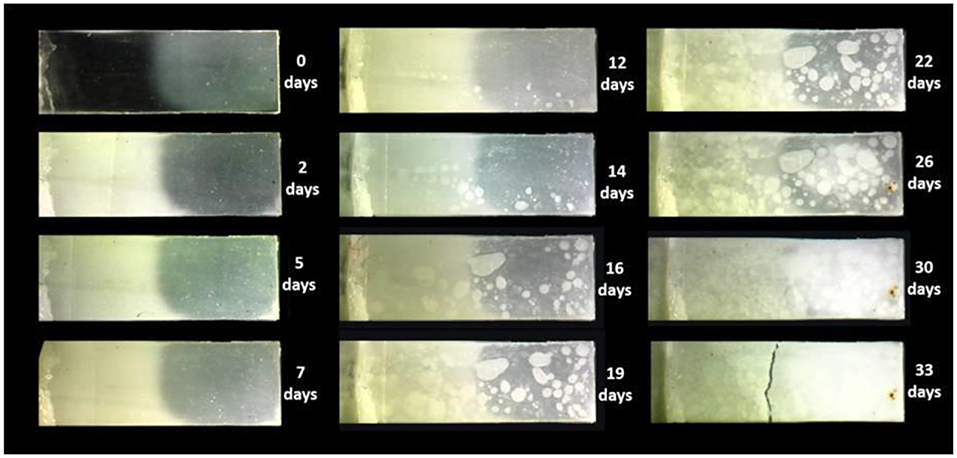
Figure 5. Images of hydrolyzed samples of micro-injected biphasic PLA sample (amorphous gate, crystalline tip).
From the results of the DSC analysis, before the hydrolysis (samples 0 days) reported in Figures 6, 7, it is evident that there was a difference between the phases: there were crystallization and melting peaks for the amorphous phase and there was only a melting peak for the crystalline phase. The Glass Transition Temperature and the Melting Temperature exhibited the same values for both phases. Tg and Tm, also, are very similar to those observed in the pellet indicating no degradation had occurred in the manufacturing process, neither in the crystallization step. The degree of crystallization calculated from the analysis of the thermograms is negligible for the amorphous region in all the samples, whereas for the crystalline phase, in the case of both protocols adopted, “a” and “b,” the values were between 30 and 35% (Table 1). In all the biphasic samples, the crystallization degree reached in the annealing step was then close to the maximum achievable for this grade of PLA when crystallized from the molten state.
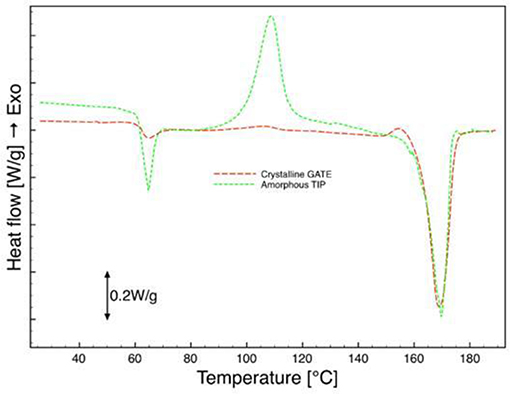
Figure 6. DSC analysis of micro-injected biphasic PLA sample (amorphous tip, crystalline gate), first scan.
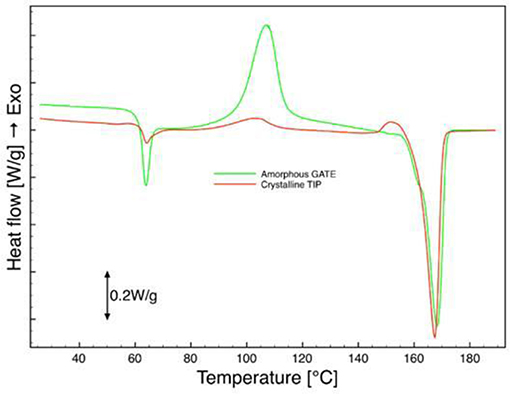
Figure 7. DSC analysis of micro-injected biphasic PLA sample (amorphous gate, crystalline tip), first scan.
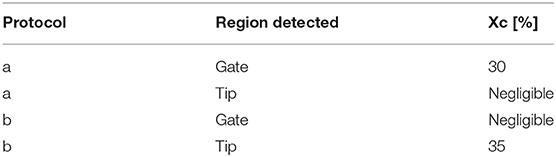
Table 1. Crystalline degree of the biphasic samples before the hydrolysis.
During hydrolysis a small piece from each region of the sample was analyzed by calorimetry with the same protocol used for the sample 0 days. Figures 8, 9 show the DSC curves obtained from the amorphous zone and the crystalline one respectively. In both cases, the Tg is clear only in the case of the sample 0 days whereas it is not detectable from hydrolyzed samples. Before the hydrolysis, the melting temperature is 169.3°C for the crystalline zone and 167.3°C for the amorphous zone. After 40 days of hydrolysis in both regions it is 156.8°C.
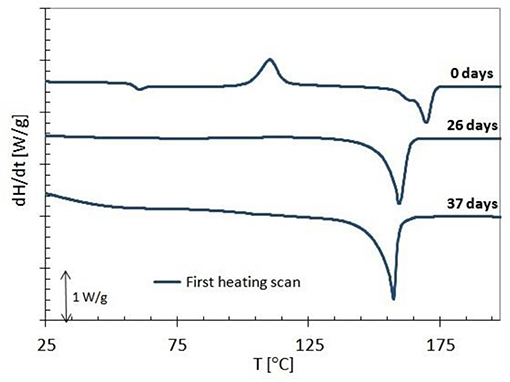
Figure 8. DSC curves of amorphous zone of biphasic samples at different time of degradation.
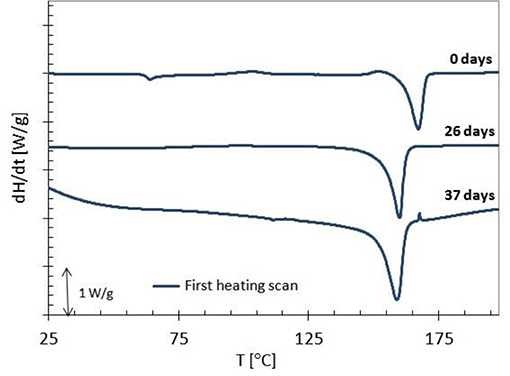
Figure 9. DSC curves of crystalline zone of biphasic samples at different time of degradation.
The evolution of the crystallinity degree with the time of hydrolysis is reported in Figure 10. As expected, an increase in the crystallinity degree was observed. This result could be due to the erosion of the amorphous regions and the crystallization of the amorphous ones. As the hydrolysis proceeds the crystallization is more fast in the amorphous region than in the crystalline one. The difference in crystallization rate probably indicates a slower degradation of the crystalline zone with respect to the amorphous one. After 25 days of hydrolysis, however, no significant difference can be observed between the values of the Xc of the two morphologies.
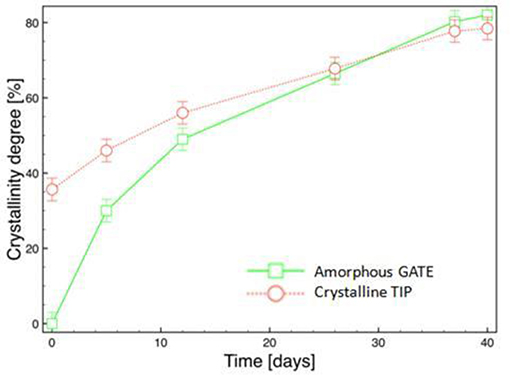
Figure 10. Evolution of degree of crystallinity during hydrolysis of micro-injected biphasic PLA sample (amorphous gate, crystalline tip).
Figure 11 shows the evolution of the number average molecular weight (Mn) as the hydrolysis of micro-injected biphasic PLA samples proceeds. No differences in the evolution of Mn as the hydrolysis proceeds: after 35 days we can see that Mn for the crystalline zone is a slightly higher than for the amorphous zone. The analysis of the evolution in time of Mn, and the molecular weight of the repeating unit permitted evaluating the kinetic constant of the hydrolysis process, k'= k×ρ/M, where ρ is the density of the polymeric part (about 1.21 Kg/m3), M is the molecular weight of the repeating unit (72 g/mol for the PLA 4032D) (Gorrasi and Pantani, 2013). The value k' represents the kinetic constant of the process of hydrolysis:
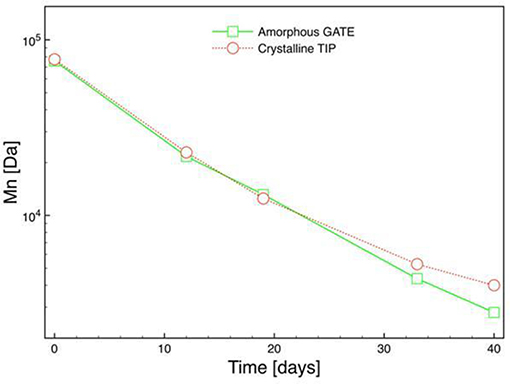
Figure 11. Evolution of number average molecular weight (Mn) during hydrolysis of micro-injected biphasic PLA sample (amorphous gate, crystalline tip).
The kinetic constants calculated by the evolution of the average molecular weight in each region gave a value of 0.086 days−1 for the amorphous and a value of 0.081 days−1 for the crystalline zone showing a small difference between the two regions. This could be ascribed to the process used to produce the samples: the high shear imposed by the micro-injection molding could have generated precursors of crystallites that easily grew once the hydrolysis began. Dimensions and arrangement of the crystalline structure as well as a different orientation from the gate to the tip of the sample probably have an effect on the process highlighting the need for future investigations on the phenomenon.
The resistance to the penetration was evaluated with the time of the hydrolysis. In each region of the sample, the mechanical test gave the force applied and the corresponding displacements (Figure 12). The maximum force applied was 7 N. Observing the Figure 13, it is evident that up to 12 days, no fracture was detected in either phase. After 19 days, the sample did not withstand the force applied and broke. As the hydrolysis proceeds a decreasing mechanical stresses was needed to break the sample. For the crystalline phase the force at break is slightly higher than the one noticed in the amorphous phase.
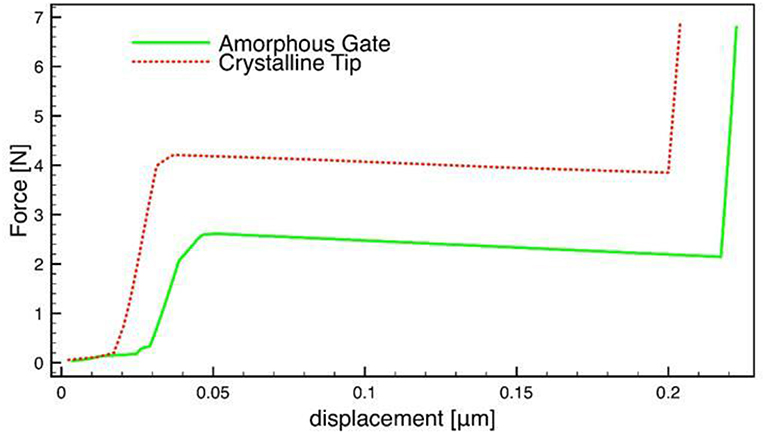
Figure 12. Example of evolution of the force vs. displacement in the two zones (amorphous and crystalline) of the same hydrolyzed sample for which the break is observed.
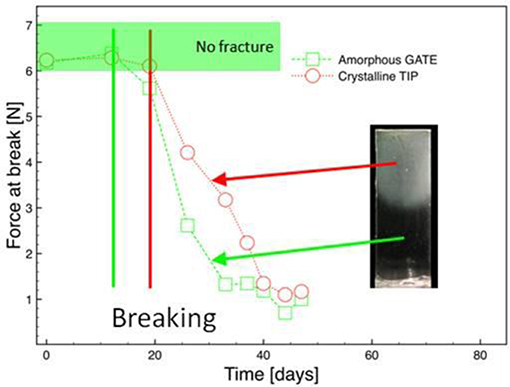
Figure 13. Evolution of force at break during hydrolysis of micro-injected biphasic PLA sample (amorphous tip, crystalline gate).
In this work, biphasic samples of PLA were obtained by micro-injection molding. For this purpose a new dynamic mold temperature control system for rapid heating and cooling of the mold was used. The system allowed filling a microcavity and produce bars with a thickness of 0.25 mm. Half bar, after the injection, was kept at 105°C for 500 s to permit a rapid crystallization. The biphasic samples were then hydrolyzed. The hydrolysis process was monitored by considering: the evolution of the degree of crystallinity of the samples by means of the differential scanning calorimetry technique (DSC), the evolution of the molecular weights by means of gel permeation chromatography (GPC), changes in mechanical behavior. For all the sample, in both morphologies, Xc increases as the hydrolysis proceeds. The value of Xc of the crystalline phase, increases more slowly than the Xc of the amorphous phase as the hydrolysis proceeds: this probably indicates a slower degradation of the crystalline zone than of the amorphous zone. The molecular weights decrease for both zones of the two samples. We could observe a slightly slower reduction of Mn with time for the crystalline regions with respect to the amorphous ones as the hydrolysis proceeds. On analyzing the mechanical tests the amorphous zone showed higher frangibility than the crystalline revealing that the crystalline regions present a slightly better resistance to the hydrolysis.
All datasets generated for this study are included in the article/supplementary material.
RP designed theexperiments and supervised the work. AD was responsible for the preparation of the samples and wrote the draft of the paper. VI performed the tests of hydrolysis and the characterization of the samples. All the authors reviewed and accepted.
The authors declare that the research was conducted in the absence of any commercial or financial relationships that could be construed as a potential conflict of interest.
Arias, V., Höglund, A., Odelius, K., and Albertsson, A.-C. (2014). Tuning the degradation profiles of poly(l-lactide)-based materials through miscibility. Biomacromolecules 151, 391–402. doi: 10.1021/bm401667b
Auras, R., Harte, B., and Selke, S. (2004). An overview of polylactides as packaging materials. Macromol. Biosci. 4, 835–864. doi: 10.1002/mabi.200400043
Babu, R., O'Connor, K., and Seeram, R. (2013). Current progress on bio-based polymers and their future trends. Prog. Biomater 2:8. doi: 10.1186/2194-0517-2-8
Belbella, A., Vauthier, C., Fessi, H., Devissaguet, J. P., and Puisieux, F. (1996). In vitro degradation of nanospheres from poly(D,L-lactides) of different molecular weights and polydispersities. Int. J. Pharmaceut. 129, 95–102. doi: 10.1016/0378-5173(95)04258-X
De Jong, S. J., Arias, E. R., Rijkers, D. T. S., van Nostrum, C. F., Kettenes-van den Bosch, J. J., and Hennink, W. E. (2001). New insights into the hydrolytic degradation of poly(lactic acid): participation of the alcohol terminus. Polymer 42, 2795–2802. doi: 10.1016/S0032-3861(00)00646-7
De Meo, A., De Santis, F., and Pantani, R. (2018), Dynamic local temperature control in micro-injection molding: effects on poly(lactic acid) morphology. Polym Eng Sci. 58, 586–591. doi: 10.1002/pen.24784
De Santis, F., and Pantani, R. (2016). Development of a rapid surface temperature variation system and application to micro-injection molding. J. Mater. Process. Technol. 237, 1–11. doi: 10.1016/j.jmatprotec.2016.05.023
De Santis, F., Volpe, V., and Pantani, R. (2017). Effect of molding conditions on crystallization kinetics and mechanical properties of poly(lactic acid). Polym. Eng. Sci. 57, 306–311. doi: 10.1002/pen.24414
Dorgan, J. R., Lehermeier, H. J., Palade, L. I., and Cicero, J. (2001). Polylactides: properties and prospects of an environmentally benign plastic from renewable resources. Macromol. Symp. 175, 55–66. doi: 10.1002/1521-3900(200110)175:1<55::AID-MASY55>3.0.CO;2-K
Drumright, R. E., Gruber, P. R., and Henton, D. E. (2000). Polylactic acid technology. Adv. Mater. 12, 1841–1846. doi: 10.1002/1521-4095(200012)12:23<1841::AID-ADMA1841>3.0.CO;2-E
Farah, S., Anderson, D. G., and Langer, R. (2016). Physical and mechanical properties of PLA, and their functions in widespread applications — a comprehensive review. Adv. Drug Deliv. Rev. 107, 367–392. doi: 10.1016/j.addr.2016.06.012
Fukushima, K., Feijoo, J. L., and Yang, M. C. (2013). Comparison of abiotic and biotic degradation of PDLLA, PCL and partially miscible PDLLA/PCL blend. Eur. Polym. J. 49, 706–717. doi: 10.1016/j.eurpolymj.2012.12.011
Gamez-Perez, J., Nascimento, L., Bou, J., Franco-Urquiza, E., Santana, O., Carrasco, F., et al. (2011). Influence of crystallinity on the fracture toughness of poly(lactic acid)/montmorillonite nanocomposites prepared by twin-screw extrusion. J. Appl. Polym. Sci. 120, 896–905. doi: 10.1002/app.33191
Garlotta, D. (2001). A literature review of poly(lactic acid). J. Poly. Environ. 9,_63–84. doi: 10.1023/A:1020200822435
Ghosh, S., Vianac, J. C., Reisab, R. L., and Manoa, J. F. (2008). Oriented morphology and enhanced mechanical properties of poly(l-lactic acid) from shear controlled orientation in injection molding. Mater. Sci. Eng. A. 490, 81–89. doi: 10.1016/j.msea.2008.01.003
Gleadall, A., Pan, J., Kruft, M. A., and Kellomäki, M. (2014). Degradation mechanisms of bioresorbable polyesters. Part 1. effects of random scission, end scission and autocatalysis. Acta Biomater. 10, 2223–2232. doi: 10.1016/j.actbio.2013.12.039
Gorrasi, G., and Pantani, R. (2013). Effect of PLA grades and morphologies on hydrolytic degradation at composting temperature: assessment of structural modification and kinetic parameters. Polym. Degrad. Stab. 98, 1006–1014. doi: 10.1016/j.polymdegradstab.2013.02.005
Gorrasi, G., and Pantani, R. (2017). “Hydrolysis and biodegradation of poly(lactic acid),” in Synthesis, Structure and Properties of Poly(lactic acid). Advances in Polymer Science, Vol. 279, eds M. Di Lorenzo and R. Androsch (Cham: Springer), 119–152. doi: 10.1007/12_2016_12
Guptaa, B., Revagadea, N., and Hilbornb, J. (2007). Poly(lactic acid) fiber: an overview. Prog. Poly. Sci. 32, 455–482. doi: 10.1016/j.progpolymsci.2007.01.005
Ha, J. U., and Xanthos, M. (2010). Novel modifiers for layered double hydroxides and their effects on the properties of polylactic acid composites. Appl. Clay Sci. 47, 303–310. doi: 10.1016/j.clay.2009.11.033
Harris, A. M., and Lee, E. C. (2008). Improving mechanical performance of injection molded PLA by controlling crystallinity. J. Appl. Polym. Sci. 107, 2246–2255. doi: 10.1002/app.27261
Hocking, P. J., Timmins, M. R., Scherer, T. M., Fuller, R. C., Lenz, R. W., and Marchessault, R. H. (1995). Enzymatic degradability of poly(beta-hydroxybutyrate) as a function of tacticity. J. Macromol. Sci. Pure Appl. Chem. A 32, 889–894. doi: 10.1080/10601329508010302
Iozzino, V., Askanian, H., Leroux, F., Verney, V., and Pantani, R. (2018). Poly(lactic acid)-based nanobiocomposites with modulated degradation rates. Materials 11:E1943. doi: 10.3390/ma11101943
Jamshidian, M., Tehrany, E. A., Imran, M., Jacquot, M., and Desobry, S. (2010). Poly-lactic acid: production, applications, nanocomposites, and release studies. Compr. Rev. Food Sci. Food Saf. 9, 552–571. doi: 10.1111/j.1541-4337.2010.00126.x
Li, S. M., Garreau, H., and Vert, M. (1990). Structure property relationships in the case of the degradation of massive aliphatic poly-(α-hydroxy acids) in aqueous-media. 1. poly(DL-lactic acid). J. Mater. Sci. Mater. Med. 1, 123–130. doi: 10.1007/BF00700871
Lostocco, M. R., and Huang, S. J. (1998). The hydrolysis of poly(lactic acid) poly(hexamethylene succinate) blends. Polym. Degrad. Stab. 61, 225–230. doi: 10.1016/S0141-3910(97)00138-9
McKeen, L. W. (2014). “Plastics used in medical devices,” in Handbook of Polymer Applications in Medicine and Medical Devices (William Andrew Publishing), 21–53.
Murariu, M., and Dubois, P. (2016). PLA composites: from production to properties. Adv. Drug Deli. Rev. 107, 17–46. doi: 10.1016/j.addr.2016.04.003
Murariu, M., Laoutid, F., Dubois, P., Fontaine, G., Bourbigot, S., Devaux, E., et al. (2014). “Pathways to biodegradable flame retardant polymer (nano) composites,” in Polymer Green Flame Retardants, eds C. D. Papaspyrides and P. Kiliaris (Amsterdam; Oxford, UK; Waltham, MA: Elsevier), 709–773.
Nampoothiri, K. M., Nair, R. N., and John, R. P. (2010). An overview of the recent developments in polylactide (PLA) research. Bioresour. Technol. 101, 8493–8501. doi: 10.1016/j.biortech.2010.05.092
Pantani, R., De Santis, F., Sorrentino, A., De Maio, F., and Titomanlio, G. (2010). Crystallization kinetics of virgin and processed poly(lacticacid). Poly. Degrad. Stabil. 95:1148. doi: 10.1016/j.polymdegradstab.2010.04.018
Pantani, R., and Sorrentino, A. (2013). Influence of crystallinity on the biodegradation rate of injection-moulded poly(lactic acid) samples in controlled composting conditions. Poly. Degrad. Stabil. 98, 1089–1096. doi: 10.1016/j.polymdegradstab.2013.01.005
Raquez, J.-M., Habibi, Y., Murariu, M., and Dubois, P. (2013). Polylactide (PLA)-based nanocomposites. Prog. Pol. Sci. 38, 1504–1542. doi: 10.1016/j.progpolymsci.2013.05.014
Sawyer, D. J. (2003). Bioprocessing – no longer a field of dreams. Macromol. Symp. 201, 271–281. doi: 10.1002/masy.200351130
Shih, C. (1995). A graphical method for the determination of the mode of hydrolysis of biodegradable polymers. Pharm. Res. 12, 2036–2060. doi: 10.1023/A:1016276830464
Speranza, V., De Meo, A., and Pantani, R. (2014). Thermal and hydrolytic degradation kinetics of PLA in the molten state. Poly. Degrad. Stabil. 100, 37–41. doi: 10.1016/j.polymdegradstab.2013.12.031
Stloukal, P., Kalendova, A., Mattausch, H., Laske, S., Holzer, C., and Koutny, M. (2015). The influence of a hydrolysis-inhibiting additive on the degradation and biodegradation of PLA and its nanocomposites. Poly. Test. 41, 124–132. doi: 10.1016/j.polymertesting.2014.10.015
Tsuji, H. (2003). In vitro hydrolysis of blends from enantiomeric poly(lactide)s. Part 4: well-homo-crystallized blend and nonblended films. Biomaterials 24, 537–547. doi: 10.1016/S0142-9612(02)00365-4
Tsuji, H. (2010). “Hydrolytic degradation,” in Poly (Lactic Acid) Synthesis, Structures, Properties, Processing, and Applications, eds R. F. Grossman, D. Nwabunma, R. Auras, L. Lim, S. E. Selke, and H. Tsuji (Wiley), 343–381.
Weir, N. A., Buchanan, F. J., Orr, J. F., Farrar, D. F., and Dickson, G. R. (2004). Degradation of poly-L-lactide. Part 2: increased temperature accelerated degradation. Proc. Inst. Mech. Eng. Part H-J. Eng. Med. 218, 321–330. doi: 10.1243/0954411041932809
Wertz, J. T., Mauldin, T. C., and Boday, D. J. (2014). Polylactic acid with improved heat deflection temperatures and self-healing properties for durable goods applications. ACS Appl. Mater. Interfaces 6, 18511–18516. doi: 10.1021/am5058713
Zhang, X. C., Wyss, U. P., Pichora, D., and Goosen, M. F. A. (1994). An investigation of poly(lactic acid) degradation. J. Bioact. Compat. Poly. 9, 80–100. doi: 10.1177/088391159400900105
Zhao, Z.-G., Yang, Q., Coates, P., Whiteside, B., Kelly, A., Huang, Y.-J., et al. (2018). Structure and property of microinjection molded poly(lactic acid) with high degree of long chain branching. Ind. Eng. Chem. Res. 57, 11312–11322. doi: 10.1021/acs.iecr.8b01597
Keywords: PLA, micromolding, crystallinity, hydrolysis, mechanical properties
Citation: Iozzino V, De Meo A and Pantani R (2019) Micromolded Polylactid Acid With Selective Degradation Rate. Front. Mater. 6:305. doi: 10.3389/fmats.2019.00305
Received: 03 October 2019; Accepted: 14 November 2019;
Published: 28 November 2019.
Edited by:
Alessandro Pegoretti, University of Trento, ItalyReviewed by:
Debora Puglia, University of Perugia, ItalyCopyright © 2019 Iozzino, De Meo and Pantani. This is an open-access article distributed under the terms of the Creative Commons Attribution License (CC BY). The use, distribution or reproduction in other forums is permitted, provided the original author(s) and the copyright owner(s) are credited and that the original publication in this journal is cited, in accordance with accepted academic practice. No use, distribution or reproduction is permitted which does not comply with these terms.
*Correspondence: Annarita De Meo, YWRlbWVvQHVuaXNhLml0
Disclaimer: All claims expressed in this article are solely those of the authors and do not necessarily represent those of their affiliated organizations, or those of the publisher, the editors and the reviewers. Any product that may be evaluated in this article or claim that may be made by its manufacturer is not guaranteed or endorsed by the publisher.
Research integrity at Frontiers
Learn more about the work of our research integrity team to safeguard the quality of each article we publish.