- Council of Scientific and Industrial Research-Central Glass and Ceramic Research Institute, Kolkata, India
Ethanol sensors with effective and selective sensitivity are extensively used by traffic police to detect drunken drivers, in wine industries for controlling the fermentation process, food package testing, different medical applications etc. Orthorhombic phase pure α−MoO3 nanoparticles were synthesized via facile sol-gel technique to ethanol sensor. It was observed that the gas sensing response of the sample toward 100 ppm of ethanol vapor is 59% at 350 °C. The response and the recovery time of the gas sensor toward 100 ppm ethanol vapor are found to be 34 s and 70 s, respectively. The main obstacle for a gas sensor to be an excellent breath analyser is to remain insensitive toward the main interfering agent of exhaling human breath i.e. moisture. Prepared sensor is highly selective and shows almost no response toward saturated moisture.
Introduction
Nowadays due to the increase in environmental pollution and health hazards there is an increase in the demand for efficient chemical sensors to monitor environment (Wang et al., 2011a; Chao et al., 2012; Yang et al., 2013). Also, sensors are now considered as promising candidate for human exhale breath analysis to monitoring diseases. Acetone, alcohol, ammonia and so on, are some of the volatile organic compounds (VOCs) present in our breath (Guo et al., 2014; Xua et al., 2013; Tomer and Duhan, 2016). So, based on their elevated concentration in breath lots of diseases can be diagnosed which is very important to monitor human health (Endre et al., 2011; Reyes-Reyes et al., 2015; Brannelly et al., 2016). Among these VOCs ethanol is one of the widely studied pollutants. Accurate ppm level ethanol detection is quite difficult. Detection of ethanol vapor is very important for traffic police to detect drunken drivers, to control the fermentation process, etc. However, detection of a single target analyte amidst 1000 other volatiles (some of which could be cross-interfering) remains a challenge for the researchers. GC-MS, ion spectrometry etc. are traditional gas analysis tools. However, they are costly sophisticated and requires skilled manpower for operation. Need of the hour is metal oxide semiconductor based gas sensor which can be use as a breath analyzer.
Metal oxide semiconducting nanoparticles are considered to be the most efficient and promising material for gas sensors due to the presence of higher oxygen vacancies and surface area (Philip et al., 2006; Brezesinski et al., 2010; Greiner et al., 2013). There are many materials that are known to detect ethanol in ppm-ppb level. An n-type semiconducting pure orthorhombic molybdenum trioxide (MoO3) nanoparticle delineate lots of astonishing applications e.g., catalysis, energy storage, gas sensors etc (Chen et al., 2000; Rahmani et al., 2010; Sui et al., 2015; Yan et al., 2015). MoO3 stands out as it regards to ease of synthesis, excellent sensitivity, selectivity, and excellent anti-aging properties. Work by Zadeh et al. delineates that Zn doped MoO3 shows only 20% sensitivity toward 100 ppm of ethanol (Mousavi-Zadeh and Rahman, 2018). Another work by Mandal et al. demonstrates excellent ethanol sensitivity of MoO3 nanobelts and nanofibres synthesized via hydrothermal route (Mandal et al., 2019). There are some literature which proves that MoO3 nanoparticles are very good sensing elements (Sun et al., 2017; Yang et al., 2017).
In the present work nanocrystalline phase pure α-MoO3 has been prepared using a facile sol-gel route. The phase purity and morphology of the sample were confirmed by analyzing it using different sophisticated tools namely thermogravimetric analysis (TGA), X-ray diffraction analysis (XRD), Fourier Transform Infrared Spectroscopy (FTIR), Ultraviolet-vis (UV-vis) spectroscopy, and field emission scanning electron microscopy (FESEM), transmission electron microscopy (TEM). The sufficiently good sensitivity of pristine MoO3 toward ethanol is reported here.
Experimental
Material Preparation
α- MoO3 nanoparticles have been prepared by using facile sol-gel route (Ganguly and George, 2007). At first 6.17 gm of ammonium heptamolybdate (NH4)6Mo7O24·4H2O, Merck) was added in 200 ml of distilled water and stirred it for 15 min to dissolve the precursor completely. Then 1.05 gm of citric acid monohydrate (HOC(COOH)(CH2COOH)2 · H2O, Sigma aldrich) was added to the above solution. The above solution was stirred until the acid gets dissolved. After this the solution was kept over a hot plate at 60°C and stirrer continuously. Then requisite amount of ammonium hydroxide (NH3OH, Merck) was drop wise added to the above solution with constant stirring to keep the solution pH between 7 and 8. After that we left the solution on the hot plate until a thick gel is formed. Then the gel was kept in a furnace overnight at 120°C for drying. At last we calcined the material at 500°C for 4 h and collected the powdered sample for further use. It is to be noted here that the pH of the solution implies a lot of effect on the morphology of the product. There are some articles on the synthesis of α-MoO3 nanostructures which describes the pH dependency of the sample on its morphology. Li et al. in his works very clearly showed the pH dependent growth of different morphology preparation of α-MoO3 nanoparticles (Chao et al., 2012). Again Parwiz et al. delineates that how size of the particles can be controlled on changing the pH of the solution (Yang et al., 2013).
Characterization
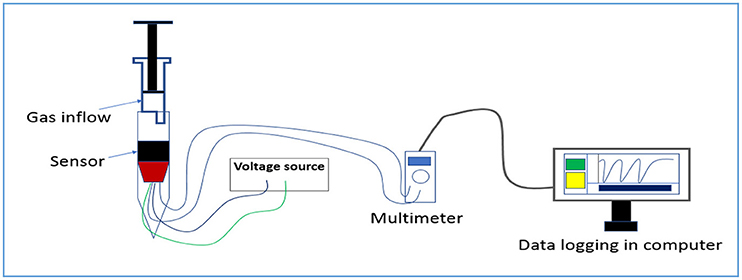
Using a NETZSCH 449C the thermogravitic analyser (TGA) of MoO3 was performed from 25° to 1,000°C with a heating rate of 10°C/min. The XRD analysis of the sample was carried out using X'Pert pro MPD XRD (PANalytical) diffractometer fitted with Cu Kα radiation. Band gap of the sample was estimated from light absorption ability plot using a UV-Vis spectrometer (CECIL Aquarius 7200). FTIR absorption spectra of the samples were studied using a Nicolet 380 FTIR spectrometer. A Carl Zeiss Supra 35 VP FESEM was used to conduct the morphological study in detail. The microstructural characterization study was undertaken using a Tecnai G2 30ST (FEI) transmission electron microscope (TEM). Current voltage (I-V) measurement was performed using a Agilent B2901A precision source meter at different temperature. For sensitivity study with different VoCs at various concentration a computer interfaced Agilent U1253A multimeter was used. A schematic (Figure 1) for gas sensing study has been provided for better understanding.
Results and Discussion
Structural and Morphological Analysis
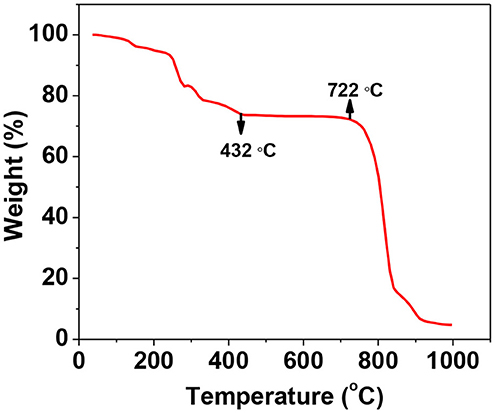
TGA analysis of the as-prepared gel in the temperature range from room temperature to 1,000°C was as shown in Figure 2. It shows that the material at first shows 5% weight loss up to 100°C which can be ascribed to loss of water present in the sample. Then there is 30% cumulative weight loss up to 432°C and 80% cumulative weight loss between 722° and 910°C. These weight losses are due to combustion of citric acid and volatilisation of the material itself, respectively.
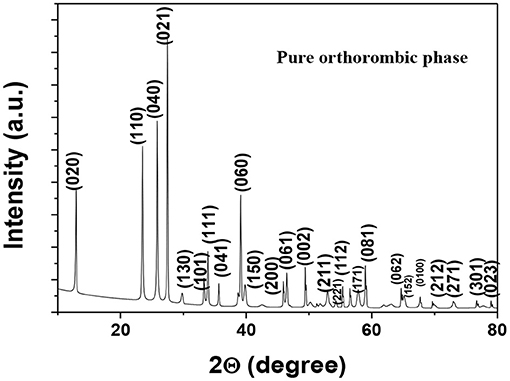
The X-ray diffraction pattern of α-MoO3 calcined at 500 °C was shown in Figure 3. All the prominent peaks matched well with standard data (JCPDS card no. 35-0609) which confirms the formation of orthorhombic phase pure α−MoO3. The graph shows no extra peaks from any other impurity phase.
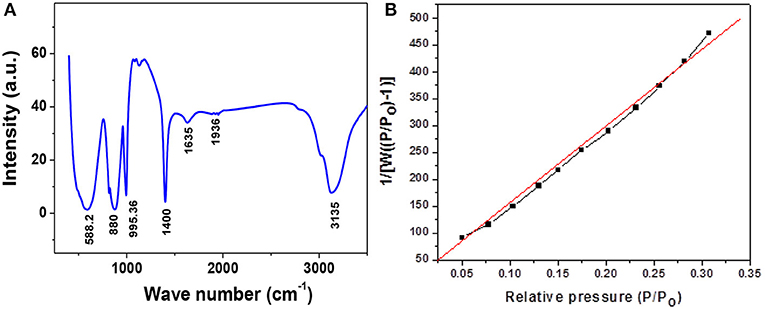
Figure 4A shows the FTIR pattern of pure phase α−MoO3 nanoparticles calcined at 500°C. Three strong vibrations peaks were detected at 588, 880 and 995 cm−1, associated, respectively, with the stretching mode of oxygen linked with three metal atoms, the stretching mode of oxygen in Mo–O–Mo units, and the Mo = O stretching mode of a layered orthorhombic α-MoO3 phase (Chiang and Yeh, 2013). The wavenumbers at 1,400, 1,635, 1,936, and 3,135 cm−1 are due to different stretching, vibration and bending modes of surface adsorbed water molecules, respectively. BET surface area of α−MoO3 nanoparticles calcined at 500°C is as shown in Figure 4B. The surface area calculated from the graph of the sample comes to be 2.360 m2/g. Presence of various bonds indicates the growth of desire phase.
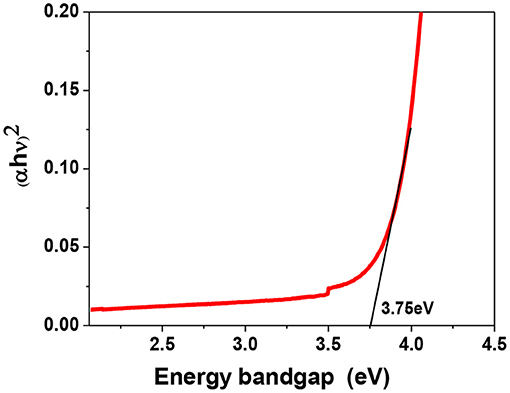
UV-Vis absorption study was carried out to get the information of energy ban structure. Figure 5 delineates the Tauc plot of α−MoO3 nanoparticles for determining the energy bandgap. The energy bandgap of bulk MoO3 is around 3.02 eV and the estimated bandgap of this sample comes to be around 3.75 eV. As compared to the bandgap of bulk MoO3 there is a blue shift in this sample due to the decrease in particle size (Patil et al., 2011).
FESEM micrograph of the synthesized α−MoO3 nanoparticles is shown in Figure 6A. It was found that the particles tried to form a thin plate-like structures. Also they are agglomerated in nature. This plate-like structure will be more effective to interact with the gas analyte. The TEM image in Figure 6B is similar to the FESEM image which shows that the sample is not completely spherical but plate-like structure. The EDAX image (Figure 6C) in the above figure confirms the absence of any other elements other than Mo and O. Since the sample was mounted on a carbon-coated copper grid so C and Cu peaks were visible in the graph.
Electrical and Gas Sensing Study
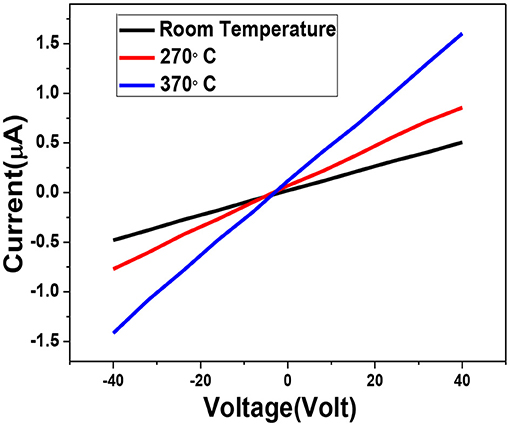
Since the prepared sensors are chemiresistive in nature; we have investigated the electrical transport behavior before its gas sensing study. Current-voltage (I-V) study of the sensor at ambient as well as different higher temperature is displayed in Figure 7. IV-characteristic measurement is very important to check the semiconductor-metal contact of the sensor element. I-V curve demonstrate good linear behavior at higher temperature which implies that the contact will remain the good if the sensor is operated at this temperature range. We have observed an ohmic behavior in the voltage range from −40 V to +40 V up to temperature around 370°C. Furthermore, no asymmetry is observed between direct and reverse regimes. The material exhibits semiconducting nature as the resistance of the material decreases with increasing temperature.
For gas sensing study the prepared sample was ground thoroughly and mixed well with iso-propyl alcohol used as a binder. Then this paste was coated on the hollow aluminum tube which is electrode at with the gold paste at the two ends and connected to platinum wires of 0.1 mm diameter.
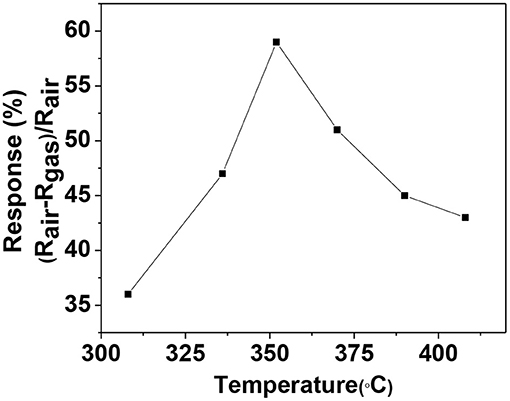
nichrome wire was inserted in the tube for heating the sensor element. Now the substrate was welded to stainless steel pins attached to a polymeric sensor head. The sensor head is covered with 200 μm mesh polymer net to protect the sensor from dust and other external particles (Chakraborty and Pal, 2017, 2019). Prepared sensor module was inserted in an indigenously built set up for sensing measurement. Figure 8 shows the response (%) of the sensor with the increasing operational temperature from 310° to 410°C toward 100 ppm of ethanol vapor. The operating temperature of the material for ethanol sensing comes out to be 350°C at which it shows maximum sensitivity. The response (%) at first increases with the increasing temperature then reaches saturation and then again starts to decrease. This behavior is normal for metal-oxide based sensors (Chakraborty and Pal, 2019).
The dynamic response curve shows the reproducibility of the sensor, which is completely reversible and very much required for sensing application. Figures 9A,B gives the resistance vs. time plot for 100 and 50 ppm ethanol, respectively. The response percentage of the sensor was calculated using the relation (1),
It was observed that the sensors delineated a good response of 59% toward 100 ppm of ethanol at 350°C. The response time and recovery time of the sensor are calculated to be 34 and 70 s, respectively. The base resistance of the sample remains almost constant throughout the whole process.
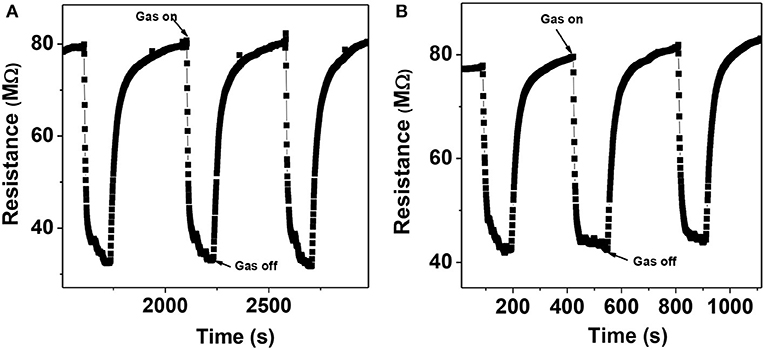
Figure 9. Dynamic response curve of α-MoO3 nanoparticles toward, (A) 100 ppm of ethanol, (B) 50 ppm of ethanol, at 350°C.
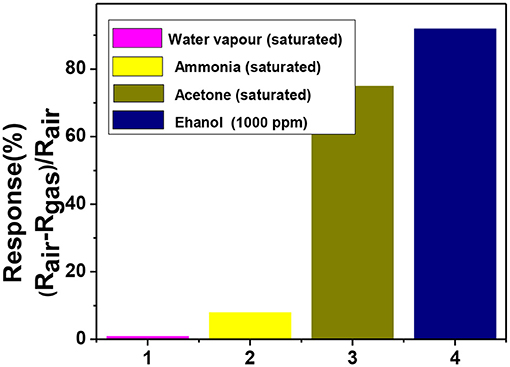
Selectivity is another important property of gas sensors. Figure 10 shows the selectivity of the sensing elements toward saturated ethanol and other VOCs like acetone and ammonia. The sensing performance was checked in the presence of moisture as it is an important interfering agent while considering for breathalyzer. The selectivity curve demonstrates that this sensor is very much selective toward ethanol vapor. The sensitivity of a particular material depends on its surface area, topology, morphology, defect states, and operating temperature. Though the material remains same if we change the operating temperature, morphology then the selectivity of the sample may change. The operating temperature plays a vital role in selecting gas analyte because the activation energy to break the gas analyte over the sensing material is different for different gas. The operating temperature for ammonia detection is higher around 400° to 450°C.
Gas Sensing Mechanism
MoO3 is an n-type metal oxide semiconductor with lots of lattice oxygen vacancies. Since gas sensing depends on the surface adsorbed oxygen molecules so here surface oxygen vacancies (interstitial oxygen and oxygen vacancies) play the main role. There is a coexistence of interstitial oxygen and oxygen vacancies for a surface defective MoO3 (Mandal et al., 2019). On the interaction of these oxygen defects with the ethanol, there is a release of free electrons in the conduction band. This oxygen vacancy activates the –CO and OH bond of ethanol and dehydrogenation takes place (Mandal et al., 2019). This will, in turn, increase the free electron concentration in the conduction band and hence the resistance will decrease.
Conclusion
We have successfully grown pure α-MoO3 nanoparticles using the facile sol-gel technique. It was observed that the orthorhombic phase of MoO3 shows a good response toward ethanol vapor in compared to acetone and ammonia. The gas sensors based on MoO3 manifest proficient response of 59% toward 100 ppm of ethanol vapor with fast response (34s) and recovery time (70 s) at the operating temperature 350°C. It also shows insensitivity toward moisture which is very important if used as breath analyzer.
Data Availability Statement
The datasets generated for this study are available on request to the corresponding author.
Author Contributions
All authors listed have made a substantial, direct and intellectual contribution to the work, and approved it for publication.
Conflict of Interest
The authors declare that the research was conducted in the absence of any commercial or financial relationships that could be construed as a potential conflict of interest.
Acknowledgments
Authors are thankful to DST-INSPIRE for providing fellowship and also to Material Characterization division of CSIR-CGCRI, Kolkata for rendering their support toward XRD, TEM/SEM measurements. Authors acknowledge Sagnik Das, Sk. Md. Mursalin, Md. Jalaluddin Mondal, and Raju Manna for their help in making the sensor module and helping in measurement. The authors are also thankful to DST-CSIR Sensor Hub (GAP 0332) for providing the facilities to conduct our experiments. TD acknowledges the project sponsored by DST-Nanomission (GAP 0368) for financial support.
References
Brannelly, N. T., Hamilton-Shield, J. P., and Killard, A. J. (2016). The measurement of ammonia in human breath and its potential in clinical diagnostics. Crit. Rev. Anal. Chem. 46, 490–501. doi: 10.1080/10408347.2016.1153949
Brezesinski, T., Wang, J., Tolbert, S. H., and Dunn, B. (2010). Ordered mesoporous α-MoO3 with iso-oriented nanocrystalline walls for thin-film pseudocapacitors. Nat. Mater. 9, 146–151. doi: 10.1038/nmat2612
Chakraborty, S., and Pal, M. (2017). Improved sensitivity of CdS nanoparticles by virtue of calcium doping: promising candidate for monitoring alcohol in exhale human breath. Mater. Des. 126, 18–28. doi: 10.1016/j.matdes.2017.04.032
Chakraborty, S., and Pal, M. (2019). Highly selective and stable acetone sensor based on chemically prepared bismuth ferrite nanoparticles. J. Alloys Compd. 787, 1204–1211. doi: 10.1016/j.jallcom.2019.02.153
Chao, J. F., Xu, X., Huang, H. T., Liu, Z., Liang, B., Wang, X. F., et al. (2012). Porous SnO2 nanoflowers derived from tin sulfide precursors as high performance gas sensor. Cryst. Eng. Comm. 14, 6654–6658. doi: 10.1039/c2ce25089f
Chen, K., Xie, S., Bell, A. T., and Iglesia, E. (2000). Alkali effects on molybdenum oxide catalystsfor the oxidative dehydrogenation of propane. J. Catal. 195, 244–252. doi: 10.1006/jcat.2000.3025
Chiang, T. H., and Yeh, H. C. (2013). The synthesis of α-MoO3 by Ethylene Glycol. Materials. 6, 4609–4625. doi: 10.3390/ma6104609
Endre, Z. H., Pickering, J. W., Storer, M. K., Hu, W. P., Moorhead, K. T., Allardyce, R., et al. (2011). Breath ammonia and trimethylamine allow real-time monitoring of haemodialysis efficacy. Physiol. Meas. 32, 115–130. doi: 10.1088/0967-3334/32/1/008
Ganguly, A., and George, R. (2007). Synthesis, characterization and gas sensitivity of MoO3 nanoparticles. Bull. Mater. Sci. 30, 183–185. doi: 10.1007/s12034-007-0033-6
Greiner, M. T., Chai, L., Helander, M. G., Tang, W. M., and Lu, Z. H. (2013). Metal/Metal-oxide in-terfaces: how metal contacts affect the work function and band structure of MoO3. Adv. Funct. Mater. 23, 215–226. doi: 10.1002/adfm.201200993
Guo, J., Zhang, J., Zhu, M., Ju, D., Xu, H, and Cao, B. (2014) High-performance gas sensor based on ZnO nanowires functionalized by Au nanoparticles. Sens. Actuators B. 199, 339-345. doi: 10.1016/j.snb.2014.04.010
Mandal, B., Aaryashree, D., Htay, M., and Mukherjee, M. T. (2019). Architecture tailoring of MoO3 nanostructures for superior ethanol sensing performance. Mater. Res. Bull. 109, 281–290. doi: 10.1016/j.materresbull.2018.09.041
Mousavi-Zadeh, S. H., and Rahman, M. B. (2018). Synthesis and ethanol sensing characteristics of nanostructured MoO3:Zn thin films. Surf. Rev. Lett. 25, 1850046–1850056. doi: 10.1142/S0218625X18500464
Patil, S. B., Mane, S. R., Patil, V. R., Kharade, R. R., and Bhosale, P. N. (2011). Chemosynthesis and characterization of electrochromic vanadium doped molybdenum oxide thin films. Arch. Appl. Sci. Res. 3, 481–491.
Philip, J., Punnoose, A., Kim, B. I., Reddy, K. M., Layne, S., Holmes, J. O., et al. (2006). Carrier-controlled ferromagnetism intransparent oxide semiconductors. Nat. Mater. 5 298–304. doi: 10.1038/nmat1613
Rahmani, M. B., Keshmiri, S. H., Yu, J., Sadek, A. Z., Al-Mashat, L., Moafi, A., et al. (2010). Gas sensing properties of thermally eva-porated lamellar MoO3, Sens. Actuat. Chem. 145, 13–19. doi: 10.1016/j.snb.2009.11.007
Reyes-Reyes, A., Horsten, R. C., Urbach, H. P., and Bhattacharya, N. (2015). Study of the exhaled acetone in type 1 diabetes using quantum cascade laser spectroscopy. Anal. Chem. 87, 507–512. doi: 10.1021/ac504235e
Sui, L., Song, X., Cheng, X., Zhang, X., Xu, Y., Gao, S., et al. (2015). An ultraselective and ultrasensitive TEA sensor based on α-MoO3 hierarchical nanostructures and the sensing mechanism. Cryst. Eng. Comm. 17, 6493–6503. doi: 10.1039/C5CE00693G
Sun, Y., Chen, L., Wang, Y., Zhao, Z., Li, P., Zhang, W., Hu, J., et al. (2017). Synthesis of MoO3/WO3composite nanostructures for highly sensitive ethanol and acetone detection. J. Mater. Sci. 52, 1561–1572. doi: 10.1007/s10853-016-0450-2
Tomer, V. K., and Duhan, S. (2016). Ordered mesoporous Ag-doped TiO2/SnO2 nanocomposite based highly sensitive and selective VOC sensors. J. Mater. Chem. 4, 1033–1043. doi: 10.1039/C5TA08336B
Wang, L. L., Fei, T., Lou, Z., and Zhang, T. (2011a). Three-dimensional hierarchical flowerlike -Fe2O3 nanostructures: synthesis and ethanol-sensing properties. ACS Appl. Mater. Interfaces 3, 4689–4694. doi: 10.1021/am201112z
Xua, Q. H., Xua, D. M., Guana, M. Y., Guoa, Y., Qi, Q., and Li, G. D. (2013). ZnO/Al2O3/CeO2 composite with enhanced gas sensing performance. Sens. Actuators 177, 1134 -1141. doi: 10.1016/j.snb.2012.12.029
Yan, H., Song, P., Zhang, S., Yang, Z., and Wang, Q. (2015). Facile fabrication and enhanced gassensing properties of hierarchical MoO3 nanostructures. RSC Adv. 5, 72728–72735. doi: 10.1039/C5RA13036K
Yang, L., Lin, H. Y., Zhang, Z. S., Cheng, L., Ye, S. Y., and Shao, M. W. (2013). Gas sensing of tellurium-modified silicon nanowires to ammonia and propylamine. Sens. Actuator. 177 260–264. doi: 10.1016/j.snb.2012.10.136
Keywords: α−MoO3, nanoparticles, sol-gel, ethanol vapor, sensitivity
Citation: Sau S, Chakraborty S, Das T and Pal M (2019) Ethanol Sensing Properties of Nanocrystalline α-MoO3. Front. Mater. 6:285. doi: 10.3389/fmats.2019.00285
Received: 01 July 2019; Accepted: 23 October 2019;
Published: 13 November 2019.
Edited by:
Sheikh A. Akbar, The Ohio State University, United StatesReviewed by:
Tridib Kumar Sinha, Gyeongsang National University, South KoreaMukul Pradhan, National Institute of Technology Meghalaya, India
Copyright © 2019 Sau, Chakraborty, Das and Pal. This is an open-access article distributed under the terms of the Creative Commons Attribution License (CC BY). The use, distribution or reproduction in other forums is permitted, provided the original author(s) and the copyright owner(s) are credited and that the original publication in this journal is cited, in accordance with accepted academic practice. No use, distribution or reproduction is permitted which does not comply with these terms.
*Correspondence: Mrinal Pal, palm@cgcri.res.in
 Sucheta Sau
 Sonam Chakraborty
 Mrinal Pal