 Daniel Gálvez-Moreno
 Dimitri Feys
 Kyle Riding
- 1Department of Civil, Architectural and Environmental Engineering, Missouri University of Science and Technology, Rolla, MO, United States
- 2Department of Civil and Coastal Engineering, University of Florida, Gainesville, FL, United States
Concrete pumping is the most used technique to transfer concrete from the mixer truck to the formwork. Numerous studies have been performed on the flow behavior of concrete in pipes, as well as the consequences of pumping on fluid and hardened concrete properties. One of the negative consequences of pumping concrete is a decrease in freeze-thaw resistance. This is caused by a decrease in air content and an increase in air bubble size, due to dissolution and reappearance of air and air bubble coalescence under pressure. This paper investigates the capability of rheology to understand air dissolution and reappearance in cement paste under combined action of pressure and flow. A majority of the air bubbles in the cement pastes show low capillary-numbers, indicating the applied stress is insufficient to overcome the surface tension. Removing air causes a decrease in viscosity (or shear stress), up to a certain threshold pressure sufficient for full dissolution of the air. For mixtures with small air bubbles, the sudden application of pressure causes an immediate decrease in viscosity or shear stress. Mixtures with larger bubbles display a more gradual decrease in viscosity with the application of pressure. At depressurization, the viscosity of the sample is recovered almost instantly, although in some cases the viscosity is not fully recovered. This can be attributed to either an immediate air loss or to a coarsening of the air-void system, resulting in less non-deformable air bubbles in the paste.
Introduction
Concrete is the most popular construction material worldwide due to the global availability of its components at a relatively low cost, and suitable mechanical properties for most structural purposes (Aïtcin, 2014). The construction industry constantly challenges concrete producers to develop more complex mixture designs that are able to fulfill the mechanical and durability requirements of modern construction paired with demanding placement schedules and complex jobsite conditions. Concrete pumps have been used for over 80 years to place concrete and meet these conditions (Ball, 1935). Nowadays, pumping concrete is one of the most used practices to deliver concrete from mixer trucks directly to the casting place (ACI 304.2R-17, 2017). Many scientific studies have been performed to understand the flow of concrete through pipes and the influence of the mixture design and pumping parameters on the fresh properties of concrete after pumping (Jacobsen et al., 2008; Jolin et al., 2009; Choi et al., 2013; Kwon et al., 2013a,b; Feys et al., 2016a,b; Riding et al., 2016; Secrieru et al., 2017, 2018).
Typically, air-entrained concrete shows lower viscosity than non-air-entrained concrete with the same water-to-cement ratio (w/c) (Wallevik and Wallevik, 2011), but this is not necessarily true under pumping conditions. The role of entrained air on the rheological properties is one of the hardest to elucidate because when concrete flows under pressure, the air bubbles are prone to be dissolved in the water and reappear when pressure is removed, altering air bubble volume and size distribution (Elkey et al., 1994; Pleau et al., 1995). An adequate air-void system, with small air bubbles and low spacing factors, is essential for the freeze-thaw durability of permeable concrete (Pleau and Pigeon, 2014). Experiments and experiences show typically an increase in spacing factor due to pumping operations, which may negatively affect freeze-thaw resistance (Elkey et al., 1994; Pleau et al., 1995; Hover and Phares, 1996; Pleau and Pigeon, 2014).
The physical background for air dissolution and reappearance is covered by Henry's law (Equation 1) which states that, in steady-state conditions and at constant temperature, the concentration of gas that can be dissolved in a liquid is proportional to the partial pressure of that gas in that liquid (Elkey et al., 1994):
Where p is the partial pressure, k is Henry's law constant and C is the concentration of the dissolved gas in solution at equilibrium (Wang et al., 2010). Therefore, as the pressure increases, the capacity of water to carry dissolved air increases proportionally. In addition, if a fluid is under shearing conditions, dissolution is expected to happen faster (Favelukis et al., 1995). The air can be dissolved partially or totally depending on: the air content of concrete, the water availability, the pressure exerted by the pump (Macha et al., 1994), the portion of concrete sheared inside the pipe, degree of equilibrium between the air-water interface achieved during the pressurization time, filling coefficient of the pump pistons (Kaplan et al., 2005), and the permeability of the air-entraining admixture bubble film.
To add further complexity, bubbles in fluids act as soft particles susceptible to be deformed by the shearing forces acting on its surface. This shape distortion is described in literature by the capillary number (Equation 2) and it expresses the ratio between viscous forces and surface tension as follows:
Where Ca is the capillary number (-), is the shear rate in s−1, η is the apparent viscosity of the suspending medium (Pa s), a is the bubble diameter (m) and Γ is the surface tension at the water-air interface (N/m). When Ca≫ 1, the shearing forces on the bubble surface are sufficiently high to overcome the surface tension, the bubble elongates and reduces the apparent viscosity of the fluid (Rust and Manga, 2002; Feys et al., 2016b). At Ca≪ 1 the surface tension is strong enough to keep the bubbles spherical and amplify the overall rheological properties (Rust and Manga, 2002; Feys et al., 2009). With so many factors that affect the rheological properties of air entrained concrete during pumping, and possible interactions among them, the evaluation of the rheological properties under pressure would be more representative for the behavior during pumping.
Materials and Methods
Materials and Mixture Design
The cement pastes used in this study were produced using ordinary Portland cement (PC), ASTM C494 type F polycarboxylate ether (PCE) superplasticizer (SP) (C494/C494M-17, 2017), ASTM C494 Type B retarder (C494/C494M-17, 2017), air-entraining admixture (AEA), and tap water at water-to-cement ratios (w/c) of 0.35 and 0.45 (by mass). The retarder was added to minimize the effect of hydration during the rheological tests. In order to keep constant w/c regardless of the dosage of the AEA, the solid residue of the admixtures was determined by oven-drying as specified in ASTM C494-17 and the resulting mass loss was assumed to be water, which later was subtracted from the mixing water. The solid residues for the AEA, SP, and retarder were found to be 6, 25, and 13%, respectively.
The mixture proportions are shown in Table 1. Every mixture made had a replicate that was tested without pressurization (see further). The code name of the non-pressurized samples starts with “NP”. The solubility coefficient of air in water at 1.01 bar (atmospheric pressure) and 20°C is 1.85%v/v (% volume of gas/volume of water) (Krofta and Wang, 2000). As the solubility coefficient varies linearly with barometric conditions (Wang et al., 2010), 1.84%v/v was used to compensate for the local altitude and calculate the theoretical minimum required pressure (Equation 3) to fully dissolve the air bubbles into the liquid phase of the paste. It should however be noted that in the evaluated cement pastes, the amount of water was sufficient to dissolve all air, a condition which may not be valid for concrete.
Where P2 (bar) is the pressure required to achieve a solubility C2 (%v/v), and C1 (%v/v) is the solubility of air in water at atmospheric pressure P1 (bar). For example, the mixture P035-A3 requires a pressure, P2 = 7.2 bar to reach a solubility of 13.36% v/v (67.9 ml of air/508.2 ml of water * 100), parting from the atmospheric pressure P1 = 0.99 bar and an air solubility in water of 1.84%v/v at 20°C.
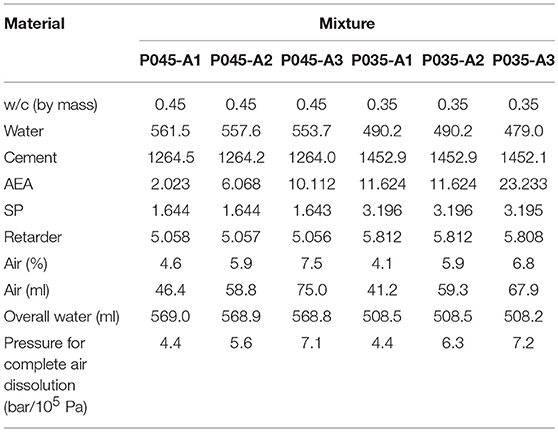
Table 1. Mixture proportions and measured air contents (units in g/l, unless indicated otherwise).
Two different mixing procedures and high doses (1.6–16 g/kg of cement) of AEA had to be used in order to achieve different volumes of entrained air. The main mixing procedure, using a small Hobart N50 mixer, consisted of first adding the water and the AEA to the mixing bowl, followed by the cement. Next, the mixer was started at speed 1 (139 rev/min) and the materials were mixed for 1 min. Then, the mixer was stopped for 30 s, the mixing bowl was scraped and the SP was added. Immediately after, the mixer was turned on at either speed 2 (285 rev/min) for mixtures P035-A2 and P035-A3 or speed 1 for all others. After 1 min, the retarder was incorporated to the mixture without stopping the mixer and the paste was mixed for an additional minute.
Testing Procedures
Self-consolidating consistency was desired to avoid: slippage between the wall of the inner cylinder of the rheometer and the sample, plug-flow, and entrapment of unquantified air in the rheometer cup when the samples were poured. Immediately after mixing, the air content was estimated using the procedure specified in ASTM C185-15a with the exception that the samples were not placed in layers inside the calibrated measure nor tamped. Two other samples were collected, one for rheological analysis and another for the estimation of the air-void size distribution using the AVA-3000 apparatus (Petersen, 2009). The rheometer used was an Anton Paar MCR-302 equipped with a cylindrical pressure cell that encapsulated the inner cylinder (Figure 1). The rotation of the inner cylinder was driven by a magnetic coupler attached to the rheometer transducer. The pressure was supplied by a gas tank filled with common air and controlled manually by an ordinary pressure regulator. The volume of the sample inside the rheometer cup was 22 ml, which ensured that the inner cylinder wall was always covered even when pressure was applied. The Peltier control unit kept temperature constant at 20°C throughout the experiment.
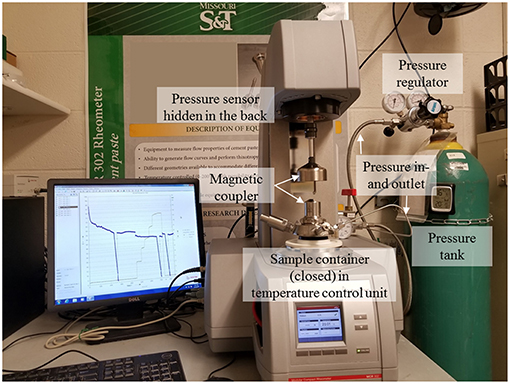
Figure 1. Set-up of rheometer with pressure system in Anton Paar MCR 302.
Two testing procedures were used for this project, and are denominated as “A” and “B” (Figures 2, 3). The main objective of procedure “A” was to assess the changes in the rheological properties caused by modifications in applied pressure, while procedure “B” evaluated the influence of a single pressure step on the rate of air dissolution and reappearance. Procedure “A” was using a set of prolonged shearing stages at a fixed shear rate of 100 s−1 combined with 3 flow curves. Apparent viscosity during the prolonged shearing steps was calculated by dividing the shear stress by the shear rate. The pressure was supplied in stepwise fashion, starting from atmospheric conditions to ~12 bar. Although the pressure regulator was adjusted manually, care was taken regarding supplying the pressure as consistently as possible across all tests. The flow curves were defined by linearly decreasing the shear rate from 100 to 10 s−1 in 25 s followed by a logarithmic decrease in shear rate from 10 to 0.01 s−1 during 5 s to obtain a better approximation of the yield stress. A 6th order polynomial was fitted to the whole data set conforming each flow curve and differentiated to the shear rate in order to define the differential viscosity at 50 s−1 (Feys and Asghari, 2019). The flow curves captured the rheological properties of the cement paste at the beginning of the test after structural breakdown (FC-1), under pressure (FC-2), and right after depressurization (FC-3).
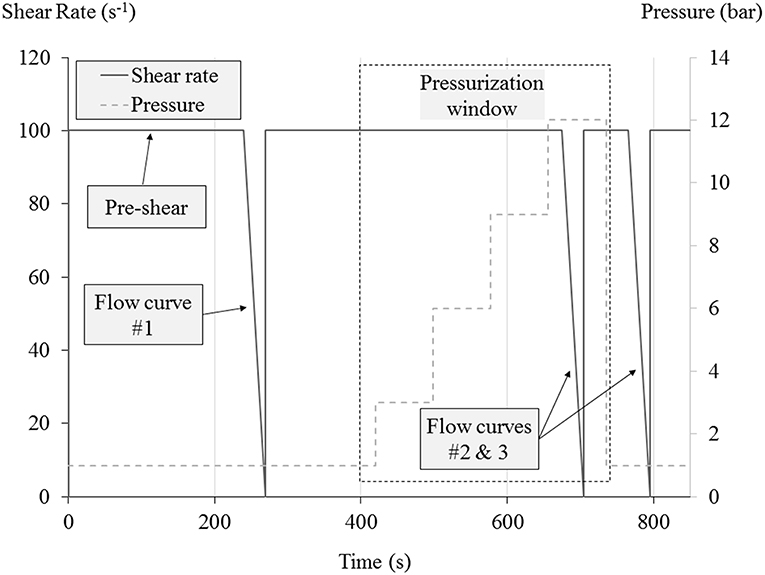
Figure 2. Procedure A contained a constant shear at 100 s−1, with flow curves being determined before, during and after pressure. Pressure was applied in several stepwise increments during the pressurization window.
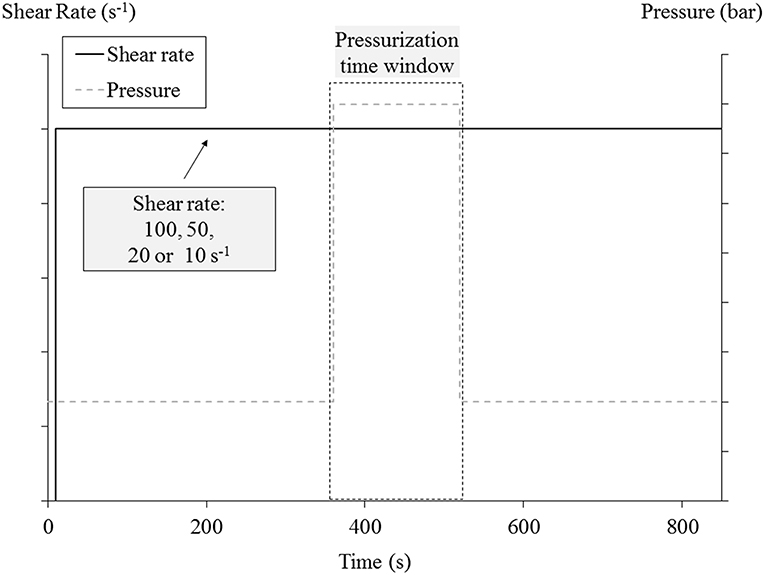
Figure 3. Procedure B imposed a constant shear rate during the test. Different tests had different constant values of shear rate. Pressure was applied in one single step during pressurization window.
Procedure “B” (Figure 3) was applied only on replicates of mixture P035-A3, and it imposes uninterrupted shearing at 100, 50, 20, and 10 s−1. Since every shear rate requires different stabilization times to reach shear stress equilibrium (Feys and Asghari, 2019), pressurization was not performed unless the shear stress was considered, visually, sufficiently stable. The pressure was supplied by opening the inlet valve of the pressure chamber in a single and fast maneuver exposing the sample from atmospheric conditions to ~4 bar during 2 min. Although the pressure regulator was set up to the desired pressure previously to loading the sample in the pressure chamber, the way pressure built up over time changed randomly between samples from a single sudden increase to the desired pressure, or a combination of a sudden increase with a slight further increase in pressure over time. However, there was not an evident change in the rheometer output attributable to this artifact.
Results and Discussion
Capillary Number
Table 2 shows that most of the air bubbles of the pressurized samples were <500 μm. Considering a constant shear rate of 100 s−1, an apparent viscosity of the suspending medium as η = 0.15 Pa s for w/c = 0.45 and η = 0.52 Pa s for w/c = 0.35, and assuming the surface tension of a combination of water-SP-AEA to be 0.040 N/m (Szwabowski and Lazniewska-Piekarczyk, 2009), the capillary number (Ca) would be <0.19 and 0.645, respectively, for bubbles sizes <500 μm. Therefore, a large majority of the air bubbles behaved mostly as solid particles and had the tendency to amplify the rheological properties, similar to solid particles amplifying the rheology of suspensions (Krieger, 1972). One caution about the results is that the AVA-3000 software is not designed to measure the air-void distribution of cement paste as it is programed to stop the measurement automatically after 3 min of not recording significant changes in the recorded data. As consequence, the smaller bubble size fractions may be underestimated, however those bubbles are also less susceptible to being deformed.
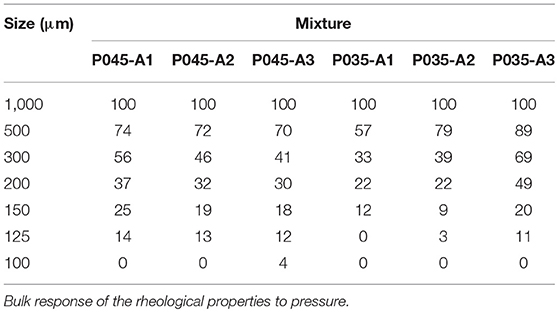
Table 2. Bubble size distribution (expressed as % passing) for the w/c = 0.35 and 0.45 mixtures, obtained from the AVA 3000.
The set of 6 mixtures and their corresponding non-pressurized replicates were tested using procedure “A”. Table 3 shows a summary of the apparent viscosity recorded at specific points of procedure “A” for w/c = 0.35 and 0.45. The column “Pressure” shows the pressure recorded after which the apparent viscosity no longer changed. As it was expected, the larger the volume of entrained air, the larger the pressure required to achieve full air dissolution in the liquid phase (see Table 1) (Elkey et al., 1994; Wang et al., 2010) and the larger the reduction of the rheological properties (Krieger, 1972). However, the experimental pressure values for which the rheological properties stabilized are higher than the theoretical ones required to achieve full dissolution. The w/c = 0.35 mixtures did not fully recover the apparent viscosity recorded right before the pressurization contrary to the mixtures with w/c = 0.45, suggesting changes in either air volume or distribution, which is discussed further.
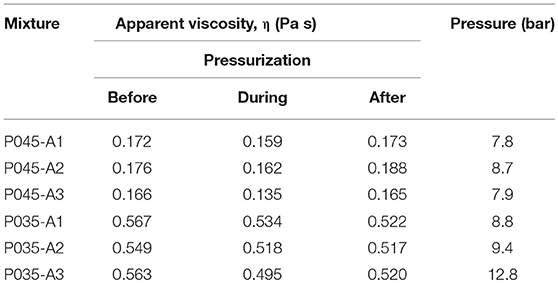
Table 3. Summary of apparent viscosity changes due to pressurization.
Figure 4 depicts the typical rheometer output for a pressurized and non-pressurized sample in terms of relative shear stress vs. time for the w/c = 0.45 mixtures. The relative shear stress is defined as “the shear stress at any time t divided by the average shear stress recorded 10 to 0 s before the pressurization step.” The effect of pressure can be clearly seen after t = 450 s. When the sample is suddenly pressurized to ~2.8 bar, a gradual reduction in the shear stress was experienced and was briefly stabilized for few seconds. When the next pressure step increment was supplied (4.8 bar), a gradual reduction on the shear stress was recorded once more. Further pressure additions did not provide significant changes in the rheometer output. The non-pressurized sample did not show any changes in rheological behavior during the same time period, indicating that the changes in rheology of the pressurized sample is solely caused by the pressure.
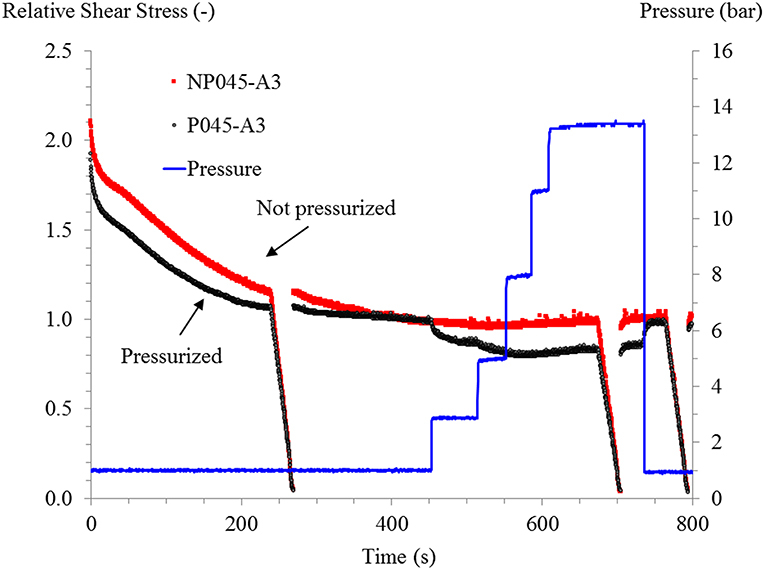
Figure 4. Rheological testing procedure “A” applied on mixture P045-A3. The relative shear stress equals 1 just before the application of pressure.
It is well known that the reduction of the (non-deformable) particle concentration of a suspension leads to a decrease in its rheological properties (Krieger, 1972). Since the only highly compressible phase present in the sample was air, the reduction in size and its eventual dissolution into the liquid phase due the pressure increase created a reduction in the bubble concentration and viscosity decreases. Figure 4 shows that when pressure was released at t = 736 s, the shear stress or viscosity was recovered to levels close to where it was before pressurization, as can also be seen in Table 3. Once the cement paste was exposed again to atmospheric conditions, the air-dissolving capacity of the water was restored to its original level and the dissolved air nucleated back almost instantly. The dynamic conditions of the sample during depressurization may accelerate this effect. The performed experiments cannot tell if the subsequent air nucleation created similar bubble size distributions or where the air reappeared. However, it is suggested by Dyer (1991) that dissolved air will preferentially reappear in already formed bubbles since it is thermodynamically less energy consuming than forming a new bubble. As a consequence, a coarser air-void system is expected to occur after depressurization (Elkey et al., 1994; Macha et al., 1994). At the end of the experiment, a thick layer of coarse foam was always observed on top of the inner cylinder, but only for the pressurized samples (Figure 5), suggesting that once pressure was released, air bubbles were formed somewhere in the rheometer cup, expanded due to the pressure decrease, and traveled to the surface due to buoyancy.
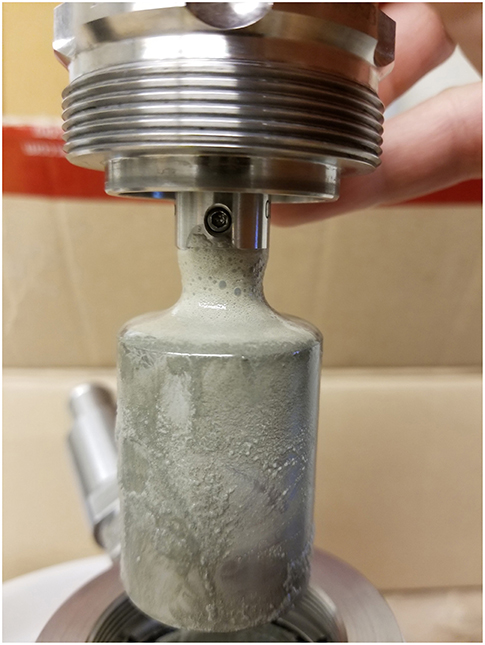
Figure 5. The pressurization/depressurization of the samples yielded a substantial volume of foam on top of the inner cylinder of the pressure cell. Picture taken after removing the inner cylinder from the pressure cell.
Figure 6 illustrates the response to pressurization/depressurization of mixture P035-A3. This mixture showed that at t = 450 s, the pressure was increased from atmospheric conditions to 3.9 bar leading to a sudden drop, followed by a gradual reduction of the rheological properties until equilibrium was reached. At t = 510 s the pressure was increased to 6.5 bar and a new (but smaller) drop in the shear stress was recorded. Figure 7 shows that the sudden drop of rheological properties was only observed in the mixtures P035-A2 and P035-A3 and such effect can be related to their finer bubble size distribution (see Table 2). Part of the mixing process of P035-A2 and P035-A3 was performed at a higher mixing speed than the other samples. This change in the mixing energy produced a more refined bubble size distribution. On the other hand, P035-A1 was mixed using the same procedure as all w/c = 0.45 mixtures. The reduced amount of water combined with relatively low mixing energy did not permit the incorporation of high volumes of air and resulted in the coarser bubble size distribution of all the mixtures tested. Since for mixtures P035-A2 and P035-A3, the concentration of small bubbles was larger than in the others, a small increase in pressure leads to the rapid dissolution of an important fraction of the air-void system. The internal air pressure due to surface tension is inversely proportional to the diameter of the bubble (Elkey et al., 1994; Macha et al., 1994; Wang et al., 2010). The solubility of air depends on the partial pressure surrounding the bubble, the small bubbles are the first ones to dissolve because their internal pressure is higher and any further increase in pressure will increase the degree of air under-saturation of water, promoting air diffusion from the bubbles (Macha et al., 1994). In addition, small bubbles have larger specific surface, which accelerates the dissolution process (Pleau et al., 1995). Therefore, the rheological properties decrease consistently with the principle of particle concentration of suspensions as the air dissolves (Krieger, 1972). Figure 6 also shows that once the pressure was released, the rheological properties were not fully restored as was the case of the w/c = 0.45 mixtures, at least not within the remaining part of the test. This behavior was observed in all pressurized w/c = 0.35 samples. The lack of reestablishment of the rheological properties suggests a change in air volume and/or distribution.
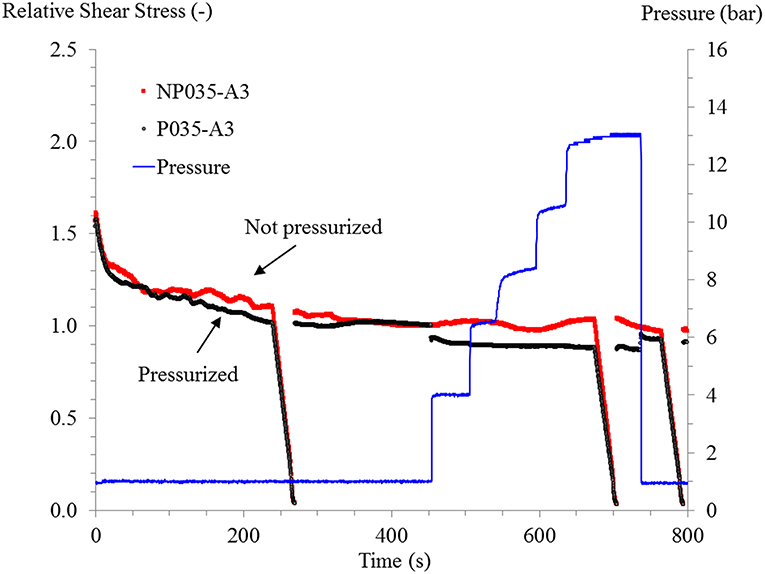
Figure 6. Rheological testing procedure “A” applied on mixture P035-A3.
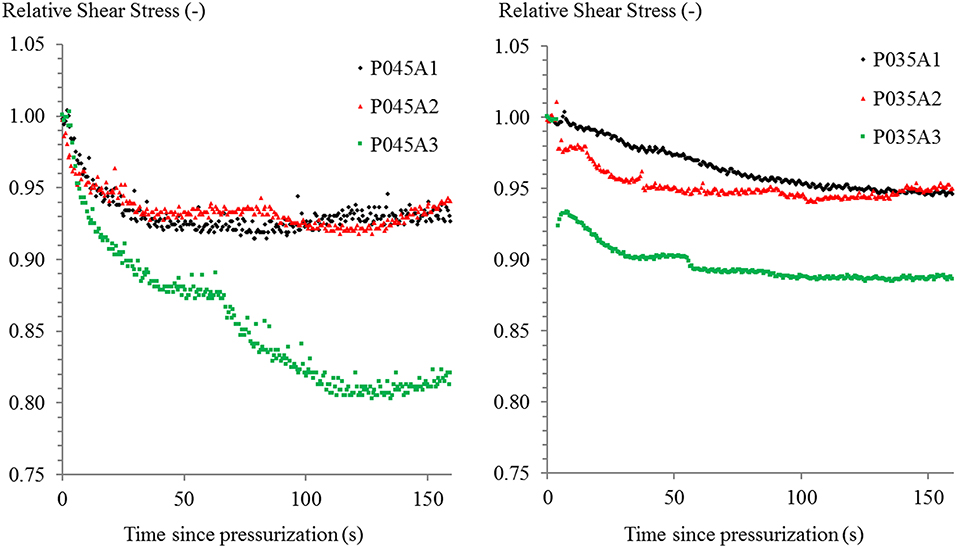
Figure 7. Comparison of the relative shear stress response to pressurization over time of w/c = 0.45 (left) and w/c = 0.35 (right) mixtures. Pressure steps are not shown.
Flow Curves
Since every mixture design tested was different in terms of AEA dose and air content, small changes in workability were observed between samples. Therefore, the pre-shear performed during the first 240 s of the testing procedure “A” was insufficient to achieve shear stress equilibrium. Nevertheless, the pressurization of the samples was performed under equilibrium conditions ensuring that any major change in the rheometer output was induced by pressure changes only. The changes in yield stress were too small to derive any conclusions. Figure 8 depicts the behavior of the differential viscosity of the flow curves. When w/c = 0.45 mixtures were pressurized, the reduction in differential viscosity was increased with a higher initial air content, and the viscosity fully recovered once the pressure was released. The case of the mixtures prepared with w/c = 0.35 followed a similar trend but the differential viscosity was not fully recovered after subjecting the system to atmospheric conditions. The results on differential viscosity followed the observations for the apparent viscosity.
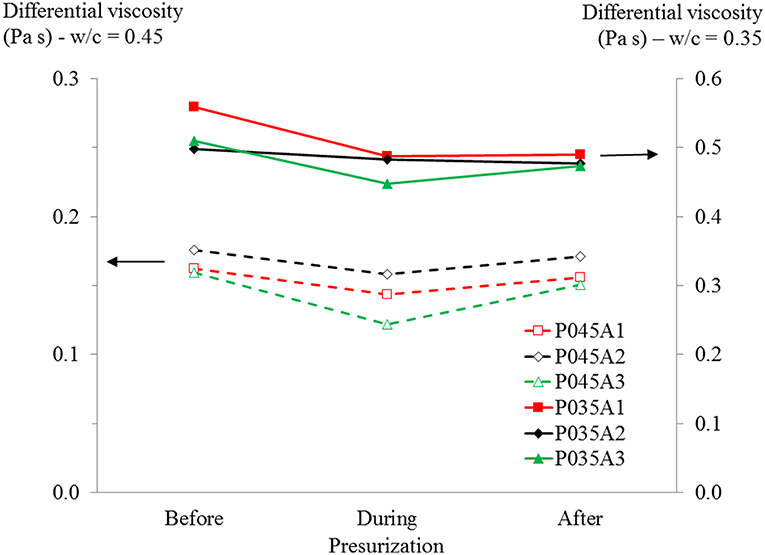
Figure 8. Differential viscosity at 50 s−1. Mixtures with w/c = 0.45 are plotted on the left axis, those with w/c = 0.35 on the right axis.
Rate of Air Dissolution and Reappearance
For this testing series, replicates of mixture P0.35-A3, all containing ~7% air by volume, were evaluated according to procedure B. The samples were exposed to a constant shear rate (100, 50, 20 or 10 s−1), and were subjected to a sudden increase in pressure of ~4 bar, which was maintained for 2 min. A pre-shear period was applied on all samples in an attempt to reach equilibrium. Although visually, the shear stress appeared to be in equilibrium during the tests, analysis has shown this was not the case. As such, to eliminate the effect of structural breakdown, the shear stress-time curve before pressurization was fitted with a double exponentially decreasing function (Equation 4), adequately capturing the behavior (Figure 9).
Where τ is shear stress (Pa), t is time (s) and, A, B, C, D, and E are fitting constants. Then, the data of the pressurization stage at each shear rate were normalized point by point using the extrapolated fitted function. Figures 10–13 show the influence of the shear rate on the shear stress response caused by air dissolution at 100, 50, 20 and 10 s−1. At 100 s−1 the changes in the rheological properties of the sample occur immediately and a small recovery hump followed again by a slight reduction and further stabilization of the rheological properties can be seen during the pressurization stage. When pressure is relieved, the rheological properties are partially restored after 6 s. At 50 s−1, the same behavior can be seen but this time the instantaneous reduction on the shear stress was higher than the observed at 100 s−1 and, once the mixture got depressurized the shear stress partially recovered in ~2 s and stayed relatively constant for the rest of the test. At 20 and 10 s−1, there is an abrupt drop in the rheological properties as well, with the main difference that the recovery hump that happens immediately after pressurizing the system is broader and takes ~40 s to get stable. Once that the pressure is released, it takes only a few seconds to fully recover the initial relative shear stress but immediately after this it starts decreasing again.
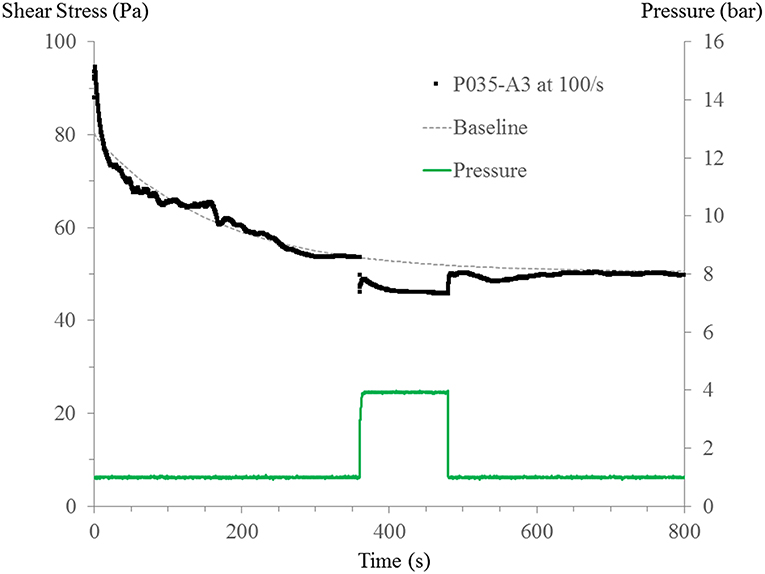
Figure 9. A double exponential approach based on data prior to pressurization was implemented to define a baseline for normalization.
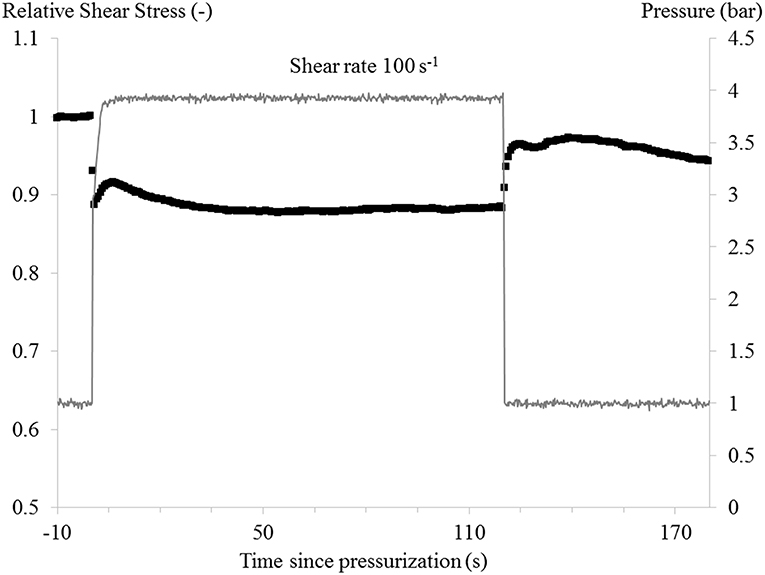
Figure 10. Rate of air dissolution and reappearance at a shear rate of 100 s−1.
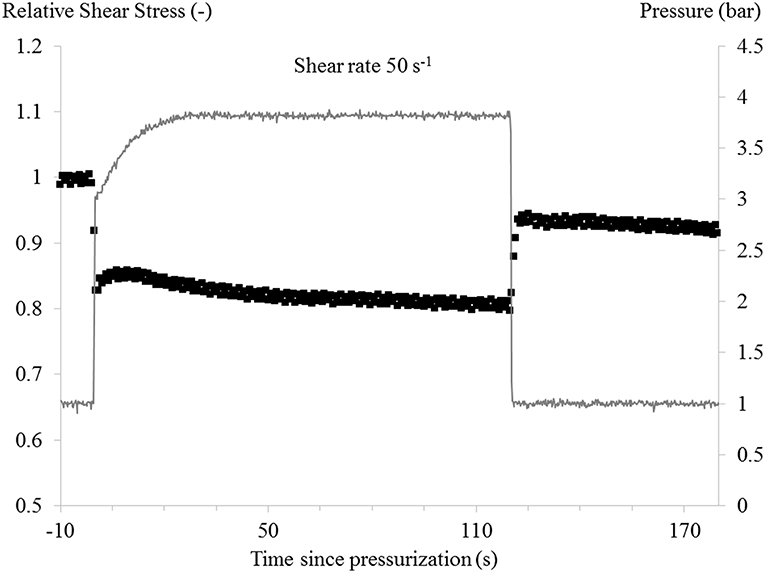
Figure 11. Rate of air dissolution and reappearance at a shear rate of 50 s−1.
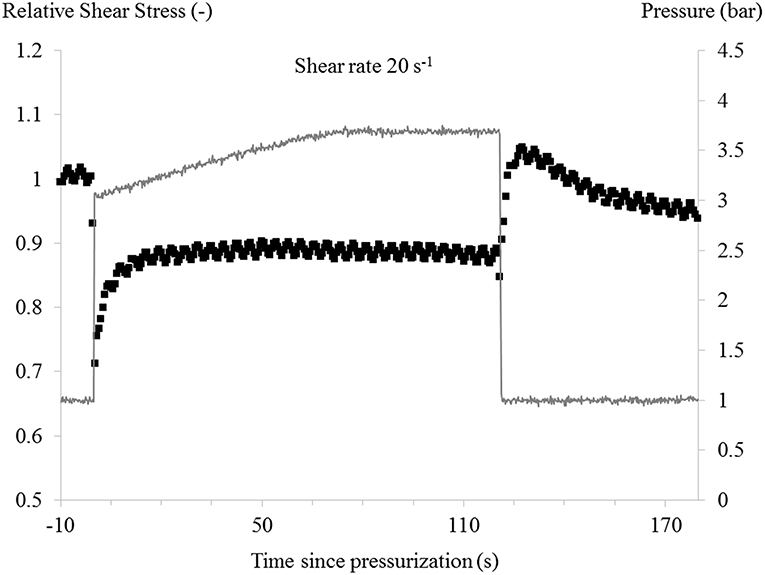
Figure 12. Rate of air dissolution and reappearance at a shear rate of 20 s−1.
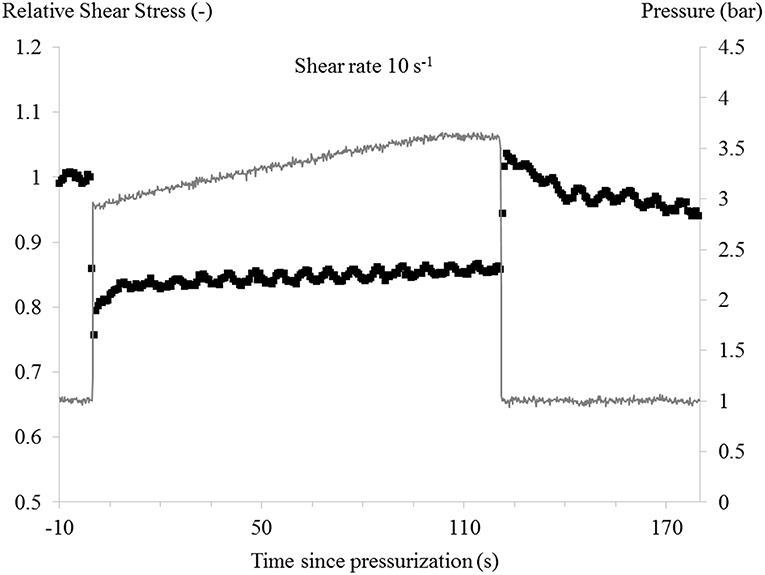
Figure 13. Rate of air dissolution and reappearance at a shear rate of 10 s−1.
From the results in Figures 10–13, it can be concluded that air is dissolved almost instantaneously after application of the pressure, regardless of the applied shear rate. However, as the evolution over time of rheological properties due to pressure application was different for mixtures P0.35-A2 and P0.35-A3 compared to the others (compare Figures 4, 6), it is believed that bubble size and shear rate will play an important role on air dissolution. This is also clear in Figure 7, as only P0.35-A2 and A3 showed a sudden decrease in relative shear stress, while all others showed a gradual decrease with time. As mentioned before, smaller air bubbles dissolve quickly, regardless of the applied shear rate. The larger air bubbles dissolve more slowly, and that process may be influenced by the applied shear rate. An explanation for the recovery of relative shear stress under pressure has not been found yet.
For the mixtures in Figures 10–13, the recovery of relative shear stress is immediate after depressurization, and for the low shear rates (20 and 10 s−1), the relative shear stress is fully recovered. At higher shear rates, the relative shear stress is not equal to 1 after depressurization, which may have several causes. This could indicate (1) an immediate air loss, (2) part of the air remains dissolved, or (3) the air-void system coarsens, creating larger air bubbles. The first hypothesis cannot be excluded. The second hypothesis seems unlikely, as at low shear, all air reappears. There are no physical reasons why all air would not reappear at higher shear rate, as on the contrary, increasing the shear rate should accelerate air reappearance. Hypothesis 3 is also possible. For the mixtures with w/c = 0.35, Ca starts to be close to 1, especially for the larger bubbles. This means that the deformation behavior of the air bubbles is uncertain (Rust and Manga, 2002). However, as air is assumed to reappear in existing bubbles at depressurization, the average bubble size increases, increasing the average Ca. As Ca is also proportional to the applied shear rate, increasing the bubble size could yield a lower amount of non-deformable air bubbles at high shear rates (50 and 100 s−1), while this would not be observed at low shear rates (10 and 20 s−1). More research is needed to verify these hypotheses. Furthermore, all samples show a lower relative shear stress at and beyond 30 s after depressurization, indicating that air is escaping from the sample (see Figure 5).
Conclusions
Applying pressure on air-entrained cement paste samples causes the shear stress or apparent viscosity at fixed shear rate to decrease. This decrease is attributed to the decrease in entrained air, which, based on the low capillary number, mainly remains non-deformed during the executed tests. Similarly, the differential viscosity of flow curves determined during pressurization decreases compared to the flow curves determined before the pressure step.
Increases in pressure beyond the initial pressure step cause a further decrease in viscosity, until a threshold pressure, above which all air is assumed to be dissolved in the water of the cement paste. This threshold pressure is dependent on the amount of air in the sample, according to Henry's law.
The shear stress or apparent viscosity of a mixture decreases either gradually or suddenly when applying the pressure. This difference in behavior is attributed to the size distribution of the air bubbles, as the mixtures with smaller air bubbles showed a sudden decrease in viscosity, while those with larger bubbles showed a more gradual decrease. The sudden decrease in viscosity seems to be independent of the applied shear rate.
At low shear rate, the shear stress is fully recovered in a short time after releasing the pressure, indicating that all air has reappeared almost instantly. At higher shear rates, the shear stress is not fully recovered at depressurization, which can be either attributed to an immediate loss of air, or to a coarsening of the air-void system, rendering less air bubbles non-deformable at the applied shear rates. With further shearing after depressurization, the shear stress decreases with time, which is assumed to be caused by a loss of air bubbles.
Author Contributions
DG-M is a Ph.D student who has executed all experimental work and analyses, under the supervision of DF and KR. DF is PI on the ACI and RE-CAST projects and KR is Co-PI on the ACI project. Several in-person meetings have been held, either at conferences or in Rolla. MO, to discuss the results, analyses, work plan, etc. with all authors.
Conflict of Interest Statement
This research work is sponsored by ACI and the US DOT.
The authors declare that the research was conducted in the absence of any commercial or financial relationships that could be construed as a potential conflict of interest.
Acknowledgments
The authors would like to acknowledge the American Concrete Institute's Concrete Research Council and the US Department of Transportation Tier-1 UTC (RE-CAST) (grant DTRT13-G-UTC45) at Missouri S&T for the financial support, the center for infrastructure engineering studies at Missouri S&T for the use of the equipment, and the staff of the Civil, Architectural and Environmental Engineering Department for the technical assistance in setting up the pressure system.
References
ACI 304.2R-17 (2017). Placing Concrete by Pumping Methods. Farmington Hills, MI: American Concrete Institute.
C494/C494M-17 (2017). Standard Specification for Chemical Admixtures for Concrete. West Conshohocken, PA: ASTM International.
Choi, M., Roussel, N., Kim, Y., and Kim, J. (2013). Lubrication layer properties during concrete pumping. Cement Concrete Res. 45, 69–78. doi: 10.1016/j.cemconres.2012.11.001
Dyer, R. M. (1991). An Investigation of Concrete Pumping Pressure and the Effects of Pressure on the Air-Void System of Concrete. Master Thesis, University of Washington.
Elkey, W., Janssen, D. J., and Hover, K. C. (1994). Concrete Pumping Effects on Entrained Air-Voids. Washington State Department of Transportation, Washington State Transportation Commission, Transit, Research, and Intermodal Planning (TRIP) Division, Seattle, WA. Available online at: http://www.wsdot.wa.gov/research/reports/fullreports/313.1.pdf
Favelukis, M., Tadmor, Z., and Talmon, Y. (1995). Bubble dissolution viscous liquids in simple shear flow. AIChE J. 41, 2637–2641. doi: 10.1002/aic.690411213
Feys, D., and Asghari, A. (2019). Influence of maximum applied shear rate on the measured rheological properties of flowable cement pastes. Cement Concr. Res. 117, 69–81. doi: 10.1016/j.cemconres.2018.12.003
Feys, D., De Schutter, G., Khayat, K. H., and Verhoeven, R. (2016b). Changes in rheology of self-consolidating concrete induced by pumping. Mater. Struct. 49, 4657–4677. doi: 10.1617/s11527-016-0815-7
Feys, D., Khayat, K. H., and Khatib, R. (2016a). How do concrete rheology, tribology, flow rate and pipe radius influence pumping pressure? Cement Concrete Comp. 66, 38–46. doi: 10.1016/j.cemconcomp.2015.11.002
Feys, D., Roussel, N., Verhoeven, R., and De Schutter, G. (2009). “Influence of air bubbles size and volume fraction on rheological properties of fresh self-compacting concrete,” in 3rd International RILEM Symposium on Rheology of Cement Suspensions Such as Fresh Concrete (Reykjavik).
Hover, K. C., and Phares, R. J. (1996). Impact of concrete placing method on air content, air-void system parameters, and freeze-thaw durability. Transport. Res. Record 1532, 1–8. doi: 10.1177/0361198196153200101
Jacobsen, S., Mork, J. H., Lee, S. F., and Haugan, L. (2008). Pumping of Concrete and Mortar-State of the Art. COIN Project Report, SINTEF Building and Infrastructure.
Jolin, M., Burns, D., Bissonnette, B., Gagnon, F., and Bolduc, L.-S. (2009). “Understanding the pumpability of concrete,” in Proceedings of the 11th Conference on Shotcrete for Underground Support (Davos).
Kaplan, D., De Larrard, F., and Sedran, T. (2005). Avoidance of blockages in concrete pumping process. ACI Mater. J. 102, 183–191. doi: 10.14359/14446
Krieger, I. M. (1972). Rheology of monodisperse latices. Adv. Colloid Interface Sci. 3, 111–136. doi: 10.1016/0001-8686(72)80001-0
Krofta, M., and Wang, L. K. (2000). Flotation Engineering. Technical Manual No. Lenox/01–05–2000/368, 1st Edition. Lenox, MA: Lenox Institute of Water Technology, 255.
Kwon, S. H., Park, C. K., Jeong, J. H., Jo, S. D., and Lee, S. H. (2013a). Prediction of concrete pumping: part I–development of new tribometer for analysis of lubricating layer. ACI Mater. J. 110,647–656. doi: 10.14359/51686332
Kwon, S. H., Park, C. K., Jeong, J. H., Jo, S. D., and Lee, S. H. (2013b). Prediction of concrete pumping: part II-analytical prediction and experimental verification. ACI Materials J. 110, 657–668. doi: 10.14359/51686333
Macha, R. K., Zollinger, D. G., and Szecsy, R. (1994). Examination of Air Entrainment Stability Factors of Pumped Concrete. College Station, TX: Texas Transportation Institute, Texas A & M University System.
Petersen, C. G. (2009). “Air void analyzer (AVA) for fresh concrete, latest advances,” in Ninth ACI International Conference on Superplasticizers and Other Chemical Admixtures in Concrete (Sevilla).
Pleau, R., Pigeon, M., Lamontagne, A., and Lessard, M. (1995). Influence of pumping on characteristics of air-void system of high-performance concrete. Transport. Res. Record 1478, 30–36.
Riding, K., Vosahlik, J., Feys, D., Malone, T. R., and Lindquist, W. (2016). Best Practices for Concrete Pumping (No. K-TRAN: KSU-14-2). Topeka, KS: Kansas Department of Transportation.
Rust, A. C., and Manga, M. (2002). Effects of bubble deformation on the viscosity of dilute suspensions. J. Non Newton. Fluid Mech. 104, 53–63. doi: 10.1016/S0377-0257(02)00013-7
Secrieru, E., Cotardo, D., Mechtcherine, V., Lohaus, L., Schröfl, C., and Begemann, C. (2018). Changes in concrete properties during pumping and formation of lubricating material under pressure. Cement Concrete Res. 108, 129–139. doi: 10.1016/j.cemconres.2018.03.018
Secrieru, E., Fataei, S., Schröfl, C., and Mechtcherine, V. (2017). Study on concrete pumpability combining different laboratory tools and linkage to rheology. Construct. Build. Mater. 144, 451–461. doi: 10.1016/j.conbuildmat.2017.03.199
Szwabowski, J., and Lazniewska-Piekarczyk, B. (2009). Air-entrainment problem in self-compacting concrete. J. Civil Eng. Manage. 15, 137–147. doi: 10.3846/1392-3730.2009.15.137-147
Wallevik, O. H., and Wallevik, J. E. (2011). Rheology as a tool in concrete science: the use of rheographs and workability boxes. Cement Concrete Res. 41, 1279–1288. doi: 10.1016/j.cemconres.2011.01.009
Keywords: cement paste, rheology, pressure, air-entrained, dissolution, reappearance
Citation: Gálvez-Moreno D, Feys D and Riding K (2019) Characterization of Air Dissolution and Reappearance Under Pressure in Cement Pastes by Means of Rheology. Front. Mater. 6:73. doi: 10.3389/fmats.2019.00073
Received: 15 January 2019; Accepted: 04 April 2019;
Published: 25 April 2019.
Edited by:
John L. Provis, University of Sheffield, United KingdomReviewed by:
Jian Ouyang, Dalian University of Technology (DUT), ChinaKenan Song, Massachusetts Institute of Technology, United States
Copyright © 2019 Gálvez-Moreno, Feys and Riding. This is an open-access article distributed under the terms of the Creative Commons Attribution License (CC BY). The use, distribution or reproduction in other forums is permitted, provided the original author(s) and the copyright owner(s) are credited and that the original publication in this journal is cited, in accordance with accepted academic practice. No use, distribution or reproduction is permitted which does not comply with these terms.
*Correspondence: Dimitri Feys, ZmV5c2RAbXN0LmVkdQ==