 Vanessa Jaiteh
 Tom Peatman
 Steve Lindfield
 Eric Gilman
 Simon Nicol
- 1Ministry of Natural Resources, Environment and Tourism, Koror, Palau
- 2Pacific Community (SPC), Nouméa, New Caledonia
- 3Independent Consultant, London, United Kingdom
- 4Coral Reef Research Foundation, Koror, Palau
- 5The Safina Center, Honolulu, HI, United States
- 6Centre for Conservation Ecology and Genomics, Institute for Applied Ecology, University of Canberra, Bruce, ACT, Australia
Bycatch on pelagic tuna longlines has contributed to population declines in several far-ranging, oceanic species and presents a conservation challenge that area-based management tools are increasingly promoted to address. In January 2020 the Republic of Palau, concerned about the impacts of longline fishing in its waters, closed 80% of its exclusive economic zone to all extractive activities, reserving the remaining 20% for a domestic fishing zone (DFZ). One of a growing number of very large marine protected areas, the Palau National Marine Sanctuary (PNMS) spans ∼500,000 km2 and was established inter alia to allow for the recovery of fish stocks adversely impacted by tuna longline fleets. Given that the main tuna stocks targeted in the western Pacific are not overexploited, the benefits of protection potentially afforded by the sanctuary are likely greater for vulnerable bycatch species. Evaluations of the sanctuary’s performance require, in part, a baseline of historical catch rates and effort distribution in the distant-water fleet (DWF) and locally based fleet (LBF) operating in Palau prior to sanctuary implementation. We describe the fishing effort, catch rates, catch estimates and fishing mortality in Palau’s longline fishery based on logbook, observer and electronic monitoring data. We defined bycatch as any species, retained or discarded, other than targeted tunas. Between 2010 and 2020, 104.8 million hooks were deployed, catching over 2 million individuals from 117 taxa at an overall target:bycatch ratio of 1:1, with a retention rate of ∼62%. Pronounced differences in fishing strategies and spatial distribution of effort between fleets were associated with large variations in catch rates and composition. The LBF had a larger effect on populations of at-risk species relative to the DWF, with higher catch rates and magnitudes for several vulnerable species and higher observable fishing mortality rates (64% vs 50% in the DWF). The sanctuary reshaped Palau’s longline fishery, contracting the fishery’s area and capacity. The relocation of the DFZ eliminated the LBF and constrained the DWF to an area where the fleet’s total catch rates and those of a number of vulnerable species were historically lower relative to former fishing grounds now closed by the sanctuary. Our results highlight the importance of consistent bycatch monitoring and emphasize the need for regional area-based approaches for managing longline fisheries.
Introduction
Bycatch in tuna longline fisheries is an ecological and socioeconomic sustainability issue that is exacerbated by monitoring and management challenges arising from the fisheries’ operational characteristics. Targeting highly mobile, far-ranging pelagic fishes, tuna longline vessels often spend weeks or months at sea before returning to port. In addition to fishing under license agreements in coastal states’ Exclusive Economic Zones (EEZs), they often fish in Areas Beyond National Jurisdiction (ABNJ; the high seas), resulting in monitoring inefficiencies that impede the verification of fishing practices and self-reported catches in logbook data. An inherently unselective gear, longlines typically have relatively high rates of bycatch in comparison to other fisheries targeting tuna (Hall et al., 2017; Gray and Kennelly, 2018), although soak time, hook shape and size, depth, bait type, and various gear modifications are known to affect catch rate and composition (Bigelow et al., 2006; Clarke et al., 2015; Gilman et al., 2018). Here we define bycatch as the catch of any species, whether retained, released alive or discarded dead, other than the tuna species targeted by the fishery we describe (cf Clarke et al., 2015). This definition comprises by-product, i.e., lower value market species that are typically retained, including non-target members of the family Scombridae, billfishes (Istiophoridae, Xiphiidae) and other teleosts (bony fishes). It also encompasses unmarketable species, and threatened, endangered or protected marine megafauna including elasmobranchs (sharks and rays; some of which are commercially valuable), turtles, seabirds, cetaceans (whales, dolphins, and porpoises) and some teleosts, whose life histories render them vulnerable to fishing pressure. We provide this definition with the caveat that entirely unambiguous definitions of bycatch may not exist, even when applied to only one study or fishery.
Globally, five tuna regional management fisheries organisations (t-RFMOs) assess the status of target and non-target species of tuna fisheries. The reported levels of bycatch, discards and fishing mortality have prompted t-RFMOs to issue mitigation measures intended to improve the ecological sustainability of their longline fisheries, but limited collection and provision of catch data for bycatch taxa often impede their capacity to implement and assess the efficacy of these measures (Gilman et al., 2014; Juan-Jordá et al., 2018). Established in 2004, the Western and Central Pacific Fisheries Commission (WCPFC) is the newest t-RFMO, with the highest number of listed longline vessels (3,766 in 2013). In addition to target tuna species, its mandate encompasses the sustainable use, conservation and management of dependent and associated non-tuna species. This mandate is carried out through several Conservation and Management Measures (CMMs), which direct member states and cooperating non-members to report, for example, interactions with seabirds and sea turtles, and provide catch, effort and size data on 20 key shark species in vessel logbooks. Since 2009, the WCPFC oversees a regional observer program (ROP) which requires 5% observer coverage for all longline fisheries (WCPFC, 2018). Other regulatory measures to reduce bycatch in WCPO longline fisheries include modifications of fishing gear or strategies, retention bans, various measures to mitigate shark finning (WCPFC, 2010) and, on a broader level, fisheries closures (e.g., in high seas pockets). Despite these mitigation measures, sustainability risk analyses and stock assessments for several globally threatened species, including bigeye thresher (Alopias superciliosus), blue (Prionace glauca), silky (Carcharhinus falciformis) and oceanic whitetip sharks (C. longimanus), indicate substantial and ongoing population declines that may require more comprehensive measures to complement and strengthen those already in place (Harley and Rice, 2012; Rice et al., 2015; Fu et al., 2017). Worldwide, reported shark landings have declined by 15% since peaking in 2003. Although shark management measures may have played a role in driving these reductions, the more likely causes appear to be declines in abundance and possibly increased underreporting (Davidson et al., 2015; Pacoureau et al., 2021).
Large (>10,000 km2) and very large marine protected areas (VLMPAs, >100,000 km2) are increasingly promoted as a tool in addressing national and international conservation targets. Most VLMPAs were established in the last decade, encompassing approximately 6.5% of the global ocean (Marine Conservation Institute, 2020) and reflecting their growing popularity as a sweeping approach to sustainability issues, including fishing-induced population declines in large bodied, highly mobile marine fauna (Boerder et al., 2019). VLMPAs may protect core habitats or key life stages of highly migratory taxa or offer some respite from overfishing to species that exhibit predictable behaviors, such as philopatric blue (Prionace glauca), shortfin mako (Isurus oxyrinchus) and common thresher sharks (Alopias vulpinus) (Boerder et al., 2019). However, studies of – and empirical evidence for – the efficacy of large and very large marine protected areas (MPAs) in protecting highly mobile, large-bodied pelagic species, including threatened, endangered and protected species, are scarce (Ban et al., 2017; Gilman et al., 2019; Curnick et al., 2020a).
The offshore waters of Palau contain a diversity of far-ranging pelagic species, including tunas, billfishes such as swordfish, spearfish, sailfish, and marlin, elasmobranchs, cetaceans and sea turtles. While small-scale fishing on the archipelago’s resource-rich barrier and fringing reefs is an important part of Palauan culture, industrial offshore fishing for tuna was pioneered by the Japanese, who introduced pole-and-line fishing for skipjack tuna (Katsuwonus pelamis) to Micronesia during their occupation of Palau in the 1920s (Gillett and Tauati, 2018). Industrial fishing was suspended during World War II and did not resume until 1964, when the US seafood company Van Camp established a transhipment base in Koror (Figure 1) to support a locally based pole-and-line fleet. The 1960s also saw the advent of Japanese distant-water tuna longline fishing for yellowfin tuna (Thunnus albacares) in Palau’s EEZ. This fishery continues to this day, currently supporting a small fleet of around 20 longliners based out of the port of Ishigaki on Okinawa. During the Japanese fishery’s presence in Palau’s EEZ, its operations underwent two main changes: (1) vessels began targeting the higher value bigeye tuna (Thunnus obesus) by setting longlines deeper, and (2) in response to consumer demand for fresh fish over frozen product, smaller vessels started making shorter trips, chilling their catch in refrigerated seawater or brine until they returned to Okinawa (IPNLF, 2019). Beginning in the late 1980s, three longline fishing companies were established: Palau International Traders Incorporated (PITI), Palau Marine Industries Corporation (PMIC; closed in 2008) and Kuniyoshi Fishing Company (KFC). All three companies brought in foreign vessels from Taiwan and/or the People’s Republic of China (PRC) to supply fish, nearly all of which was exported to Japan (higher quality product) or Taiwan (lower quality fish). In the last two decades, PITI established itself as the main company, with KFC operating a smaller export business and supplying the local market.
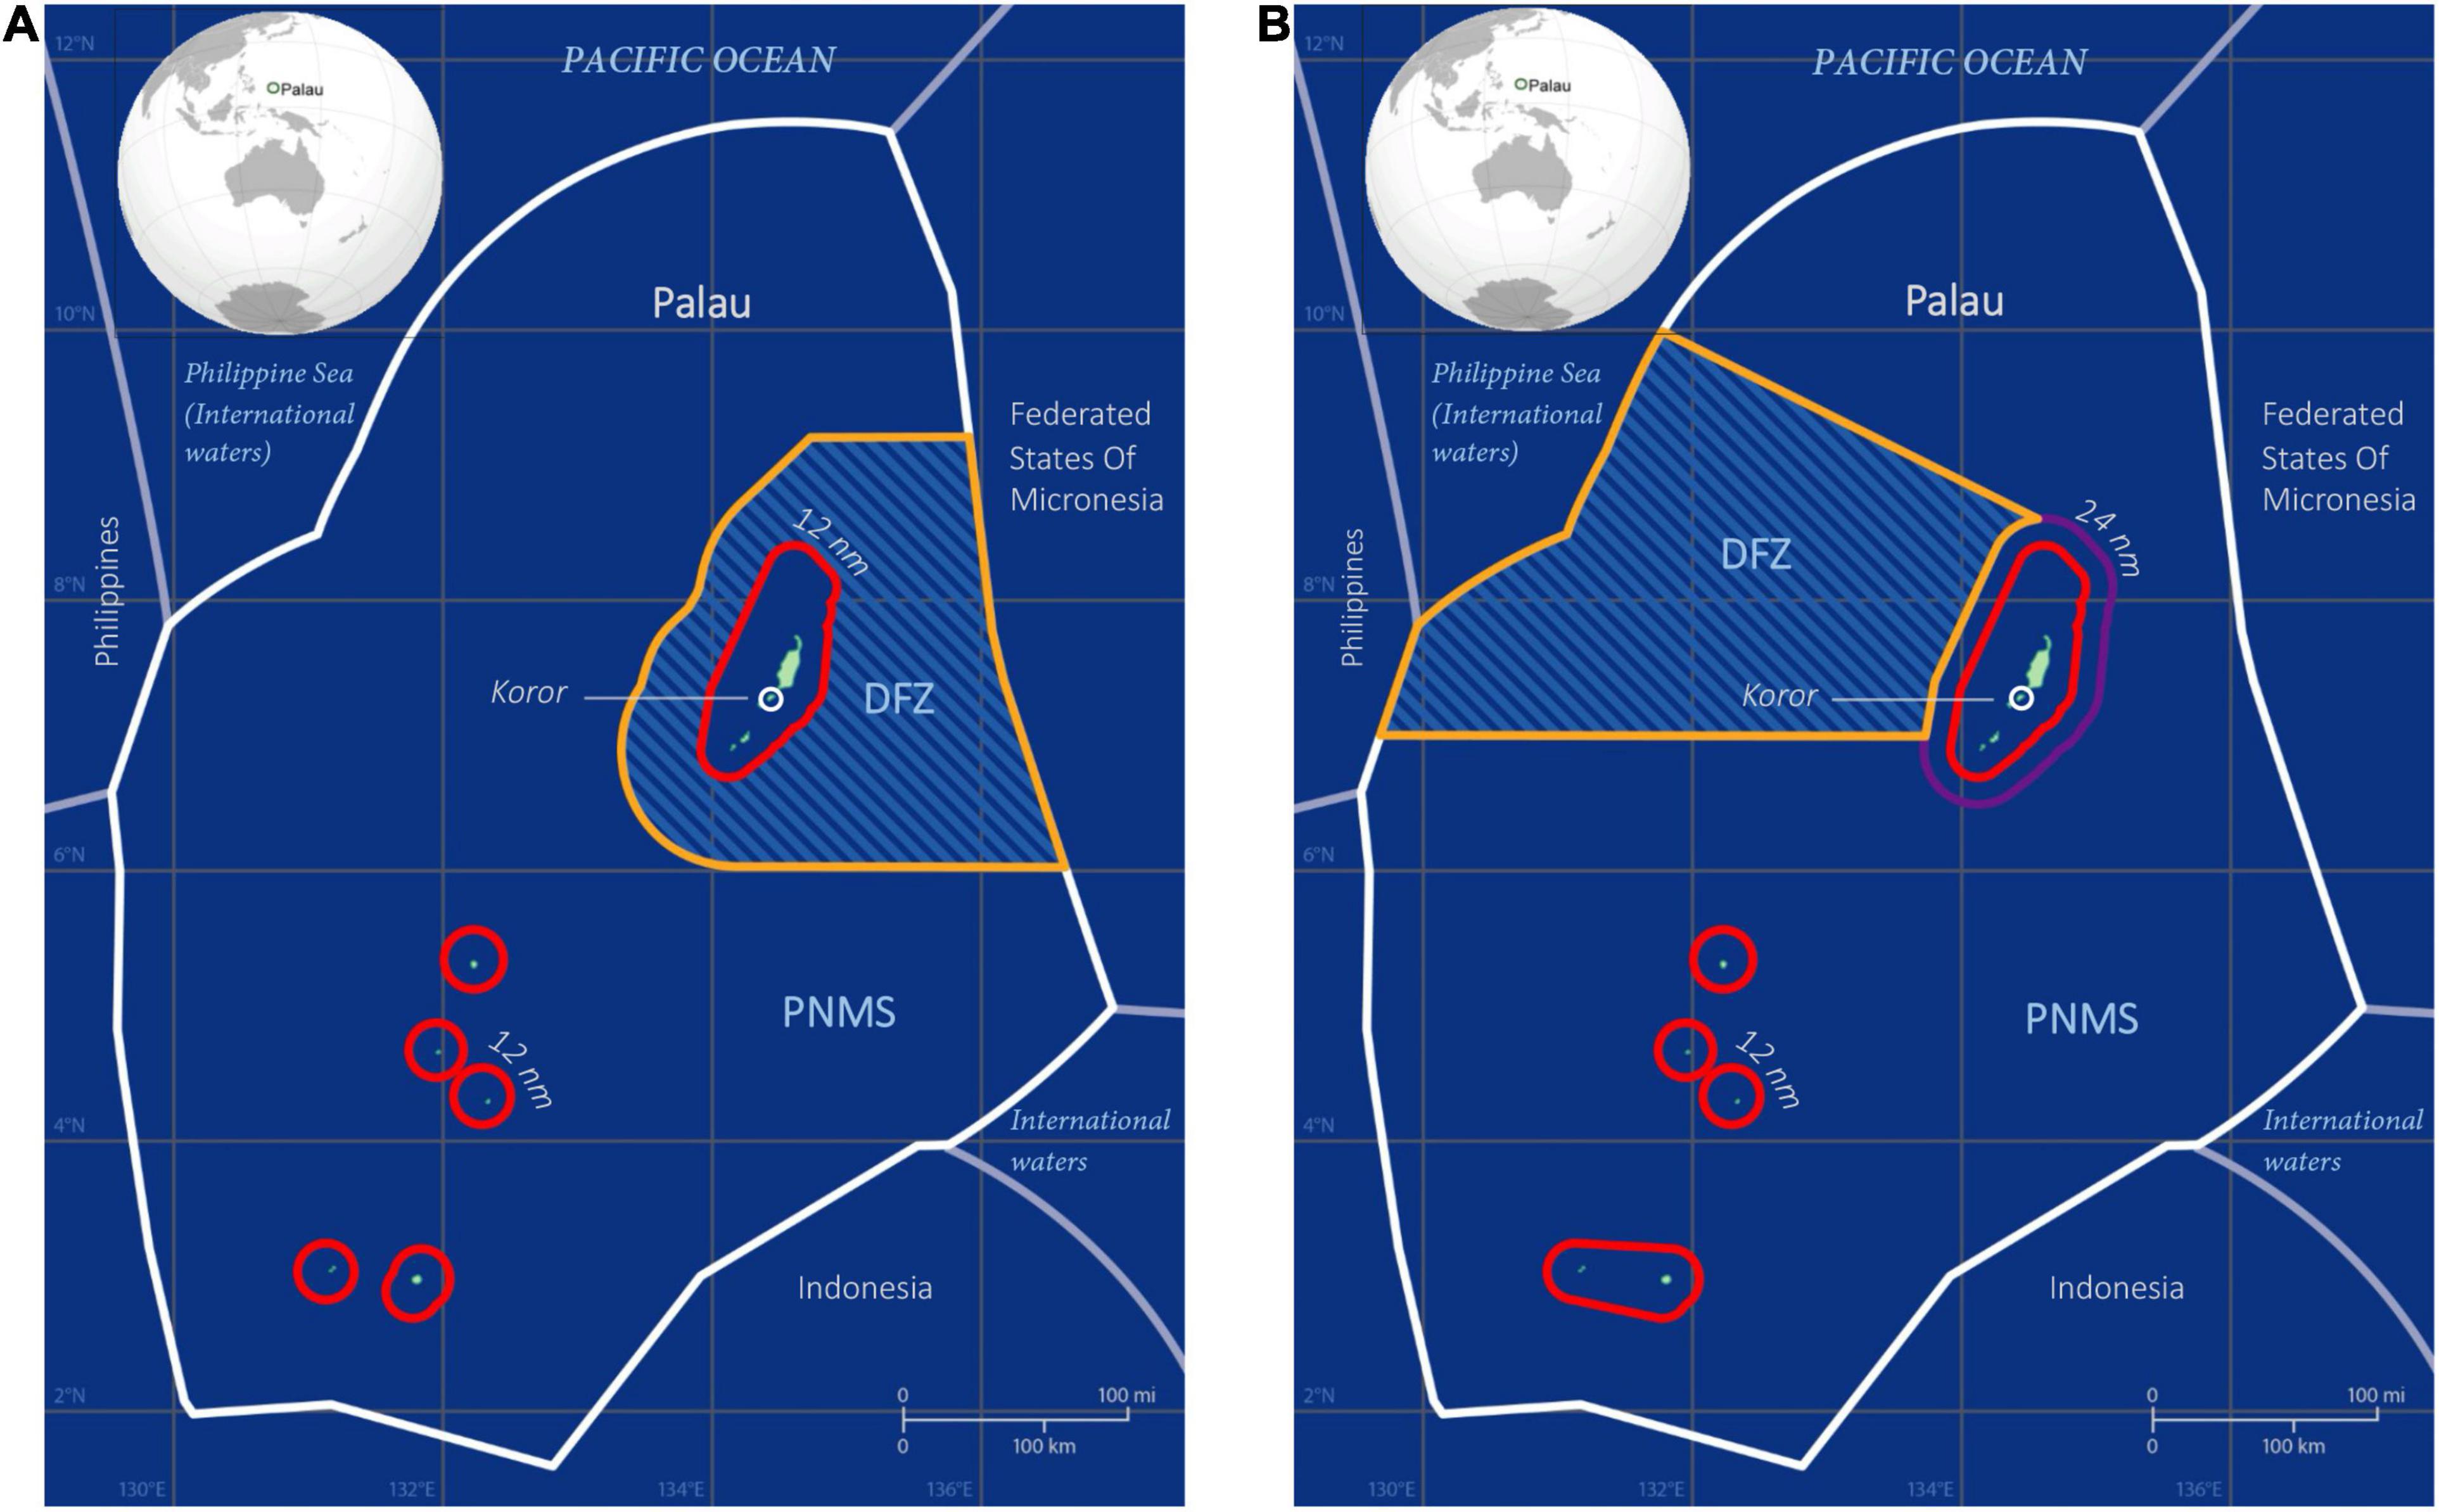
Figure 1. Map of the Palau National Marine Sanctuary (PNMS) and Domestic Fishing Zone (DFZ), (A) as designated in the original PNMS Act 2015 and (B) as revised in the 2019 amendment to the PNMS Act, and implemented in January 2020. Red lines represent the 12 nm territorial seas boundary. Only pole-and-line and small personal vessels are permitted to fish within the 24 nm contiguous zone boundary (purple) around the main island group, which belongs to the DFZ. The orange boundary line denotes that part of the DFZ where longline fishing is permitted. The PNMS extends from the 12 and 24 nm boundary, respectively, to the edge of the Exclusive Economic Zone (EEZ) (white line). Malakal fishing port is situated near Koror.
Tuna fishing in Palau is managed at the regional level by the WCPFC and at the sub-regional level by the Parties to the Nauru Agreement (PNA; est. 1992). Additionally, Palau has passed legislation to mitigate the effects of pelagic fishing in its waters. A 2003 Republic of Palau Public Law (Rppl 6-36, 2003) banned wire leaders and the retention of sharks, including their fins, by foreign fishing vessels. In 2009, then-President Toribiong declared his country’s waters the world’s first shark sanctuary and established Palau as a leader in marine conservation. However, despite being widely cited in the scientific literature (Vianna et al., 2012, 2016; Ward-Paige, 2017; Ward-Paige and Worm, 2017), the shark sanctuary does not have legal status: the Shark Haven Act (Senate Bill 8-105), proposed in 2009, was never adopted.
In 2015 the Olbiil Era Kelulau (OEK; Palau National Congress), concerned over the ecological and socio-economic impacts of foreign fishing activity in its waters, passed the Palau National Marine Sanctuary (PNMS) Act (Rppl 9-49, 2015). It established ∼80% (500,000 km2) of Palau’s EEZ as a no-take reserve, banning all extractive activities from 1st January 2020 (Figure 1A). The remaining ∼20% of the EEZ were declared a domestic fishing zone (DFZ; Figure 1A) where fishing by licensed vessels would be allowed, subject to the following specifications: (i) fishing by fishing vessels (the Act’s definition of “fishing vessel” excluded most personal fishing boats) was prohibited within a boundary of 12 nm (the territorial seas) from a baseline of each island or island group, and within a 50 nm radius extending eastward from the reef entrance of Malakal fishing port near Koror; (ii) from 1st January 2020, 100% observer coverage would be mandatory for all fishing vessels operating in the DFZ; (iii) fish caught in the DFZ was to be made available for local sale only and its commercial export prohibited, with the exception of free-school purse-seine catches. These were to be landed in Palau before being exported – which, given the lack of purse-seine landing infrastructure at Malakal port, effectively countervailed their exemption to the export ban.
The PNMS Act also gave sweeping protections to sharks through an amendment of § 1204 (“Prohibited Acts”) of the Marine Protection Act of 1994, prohibiting any person to fish for, remove the fins of or otherwise intentionally mutilate or injure, or possess any part of any shark within Palau’s waters. This new provision, which effectively afforded the shark sanctuary legal standing, was superseded 2 days later by RPPL 9-50, a law regulating reef fish exports which also amended § 1204 of the Marine Protection Act, but without a provision for sharks. This presumably accidental cross-over of the two laws mainly affects sharks within the coastal waters of Palau, meaning they are not legally protected from injury, mutilation or taking through fishing or other means.
Following negotiations with various stakeholders, the OEK amended the PNMS Act in 2019 (RPPL 10-35). The amendments meant that: (i) fish caught on longlines in the DFZ were no longer subject to the export ban; (ii) longline and purse-seine catches could be exempted from the landing requirement through regulations promulgated by the Minister of Natural Resources, Environment and Tourism; (iii) the DFZ was reoriented to the west, bordering a high seas pocket to the northwest of Palau (Figure 1B); and (iv) the 50 nm exclusion area was replaced with a 24 nm contiguous zone surrounding the main island group, within which only pole-and-line and small personal vessels may fish, and only for domestic sale. Although this zone forms part of the DFZ, from here on we refer to the DFZ as the zone in which longline fishing is allowed (Figure 1B), which coincides with the fishing grounds of the Japanese distant water longline fleet.
Citing economic losses from the reduction in fishing grounds and the re-orientation of the DFZ, the two remaining locally based fishing companies closed down in late 2019, effectively ending locally based longline fishing by Taiwanese and Palau-chartered vessels. Japanese vessels, having historically landed their catch in Okinawa, were exempted from the landing requirement and continue to fish in the DFZ.
The PNMS Act lists the protection of overexploited fishery species as a primary objective in promoting their recovery and reproduction, claiming that “[c]urrently, Palau’s fishing stocks, including tuna and other bycatch, are being depleted by foreign fishing vessels […]” (Rppl 9-49, 2015). Given that the tuna stocks in the WCPO are not overfished and no overfishing is occurring (Hare et al., 2020), any benefits of protection afforded by the sanctuary are more likely to accrue for at-risk bycatch species. Measuring their responses to spatial protection will require an understanding of previous levels of incidental capture and resulting fishing mortality.
In light of criticisms of large and very large MPAs being politically driven (Leenhardt et al., 2013), with little scientific evidence backing their utility in conserving highly mobile pelagic fauna (Game et al., 2009; Boerder et al., 2019), we set out to establish a baseline of historical longline effort and catch in Palau’s waters to allow for causal inference in future performance assessments of the PNMS. Using three sources of longline catch data we describe, with particular focus on bycatch species, the extent of fishing effort, catch rates, and estimated total bycatch in Palau’s EEZ in the decade preceding the implementation of the PNMS. We examine whether bycatch mitigation measures at the regional and national level are reflected in changes in the fishing strategies and catch compositions of longline fleets operating in Palau. Finally, we explore how differences in fishing strategy and fishing grounds between fleets affect species composition, catch rates, and fishing mortality. Based on these findings, we discuss the potential benefits of static spatial protection afforded to fishery-associated species through the PNMS, recognizing that multiple factors will ultimately determine the sanctuary’s impact on different species.
Materials and Methods
Study Location
The Republic of Palau (hereafter “Palau”) is the westernmost archipelago of the Caroline Islands in the western Pacific Ocean (Figure 1). Surrounded by an EEZ of 629,000 km2, Palau’s administrative and economic capitals, Ngerulmud and Koror, are located within the country’s main island group (∼7°N and 134°E). Five small oceanic islands, collectively known as the Southwest Islands, and a coral atoll, Helen Reef, lie 300–500 km southwest of Koror.
In contrast to many of its Micronesian neighbors, Palau was never home to a large purse-seine fishery, probably due to its location at the western limits of the regional fishery and its distance from ports with purse-seine landing facilities. Since the cessation of its pole-and-line fishery in 1982, the majority of tuna catches in Palau’s waters have been made by longline fleets from Japan and Taiwan, and – until the early 2000s – Korea and the PRC.
During the time span of this study (2010–2019), the longline fleets that fished in Palau’s EEZ consisted primarily of (i) a foreign-owned, distant-water fleet (DWF) of mainly Japan-flagged vessels operating out of Okinawa; (ii) a foreign-owned, locally based fleet (LBF) comprised of Taiwan-flagged, owned and operated vessels, and chartered (Palau-flagged, Taiwan-owned and operated) vessels, which closed down in late 2019; and (iii) a small locally based national fleet, with 1–3 domestically owned vessels licensed to fish since 2017. The main target species of all fleets were yellowfin and bigeye, the vast majority of which were air-freighted fresh to the Japanese sashimi market. Albacore Thunnus alalunga and skipjack tuna as secondary target species, and various billfish species were more commonly sold locally or shipped frozen. The LBF and national vessels landed their catch locally, at their base in Malakal harbor, with a small proportion of the catch retained and sold locally. The DWF has operated in Palau’s waters under access agreements that exempt it from unloading its catch in Palau before exporting to Japan.
Datasets
We analyzed three non-public domain datasets comprising a decade of logbook data (2010–2019), 17 years of observer data (2003–2019) and 2 years of electronic monitoring data (2016–2018) collected in the national waters of Palau. Logbook data are collected by vessel captains and crew, and include information about the fishing vessel, the positions, timing and gear details of longline sets, and species caught. Although vessel crew are required to record tuna, billfish and shark species in their catch record, logbook reporting of shark catches and other species of scientific interest is often incomplete and may not be provided at a species-level (Rice, 2018). Logbook data are, however, the most complete source for calculating total fishing effort, and were used in conjunction with the other datasets to estimate total catch levels.
Human observers have been deployed on longline vessels fishing in Palau since the 1980s (WCPFC, 2017), initially through a Pacific Islands observer program that was later incorporated into the WCPFC’s ROP, established in 2007. With an overall historical coverage of <1%, longline fleets within the convention area were required to increase their observer coverage to 5% as of June 2012. While compliance with this requirement has improved in recent years, it has not been met in some parts of the convention area, including Palau’s LBF, in recent years (Peatman and Nicol, 2020; Williams and Ruaia, 2020).
In 2016, the Government of Palau agreed to trial an electronic monitoring system to assess its utility and potential to complement and augment observer coverage through the ROP. Three DWF and four LBF vessels participated in the trial, which ran until the end of 2018 and was coordinated by The Nature Conservancy, with Satlink providing technical services. Of 375 sets completed during 54 trips with EM, 261 sets from 39 trips were reviewed. The video footage collected during the trial was reviewed by fisheries observers in Palau (for DWF footage) and by scientific observers at Digital Observer Services (DOS) in Spain (for LBF footage).
The following links provide descriptions of the data collection forms and information fields for logbook, observer and EM data. The curator of these and other regional fisheries data is the scientific services provider and data manager of the WCPFC, the Oceanic Fisheries Programme of the Pacific Community (SPC).
Fishing Effort and Catch Composition
Due to the spatial overlap in their fishing effort and other fishery-specific similarities, the national fleet and the LBF were combined (hereafter collectively termed the LBF) for all analyses. Fishing effort was estimated from the entire available record of logbook data for Palau’s EEZ. Throughout the paper we refer to reported (recorded in logbooks) vs. observed (recorded by human observers) effort and catch, respectively. Where observed catch includes EM data, this is noted. It was not possible to include time of day in this or other analyses, because set times in coordinated universal time (UTC) are not a minimum standard data field in the WCPFC ROP and observers often use vessel time (as opposed to local time).
To compare the catch composition between the three datasets, we calculated the percentage contribution of each species or species group to the total catch recorded in each data source. Teleosts with<10 records were excluded (Supplementary Table 5). For plotting, we selected species that contributed to at least 99% of the observations within each species grouping, with the exception of teleost fishes where we selected the top 80% of species. Two shark genera, thresher (Alopias spp.) and mako sharks (Isurus spp.), were pooled to the genus level because they were variously identified at species and genus groupings depending on the data source.
Definitions
Throughout this paper, the term “sharks” includes all sharks and rays, and “tunas” includes the four main target species (yellowfin, bigeye, skipjack, and albacore tuna) and seven additional species from the family Scombridae, unless stated otherwise. The 20 WCPFC “key shark” species are blue, oceanic whitetip, mako (two species), thresher (three species), silky, porbeagle, hammerhead (four species) and whale sharks, and mobulid rays (six species) (WCPFC, 2019a,b). The WCPFC lists marine turtles, seabirds, marine mammals, and key shark species as Species of Special Interest (SSI). We also added pelagic stingrays Pteroplatytrygon violacea to the SSI category in our analyses of bycatch condition. Given a lack of regional red list assessments for many species, we define species of conservation concern as any species classified within one of the IUCN Red List’s threatened categories (VU, EN, and CR).
Catch Estimates
Total catch estimates were obtained using a stratified ratio estimation approach (Cochran, 1963). First, observer data were used to estimate catch per unit of effort (CPUE; the number of individuals caught per thousand hooks). Since longline observers record catch data specific to individuals, we used numbers of individuals as the unit for estimating catches. We did not convert catch numbers to weight to obtain biomass estimates. Given that only a small proportion of individuals were weighed or measured, this additional step would have likely rendered catch weight estimates less reliable than estimated catch numbers (Peatman et al., 2018). Data were then stratified by fleet, i.e., the LBF and DWF were separated to account for variation in catch rates and catch compositions due to fishing strategy. Additionally, data for the DWF were further stratified for fishing events inside the area that is now the DFZ vs. the PNMS to account for any spatial variation in catch rates. CPUE was estimated for each stratum, species code and individuals’ fate, i.e., retained or discarded. These strata-specific estimates of catch rates were then applied to total reported effort in each stratum, to obtain estimates of total catch specific to each species code and fate. Higher-level estimates were then obtained by summing across species codes, e.g., to obtain total catch estimates of sharks. Estimates of uncertainty in catches and catch rates were obtained using a non-parametric bootstrap procedure, by first resampling at random from observer trips, and then for each trip resampling from observed sets. This approach was used as fishing events from the same trip are unlikely to be independent. We used 1,000 bootstrap replicates and obtained 95% confidence intervals using the 2.5 and 97.5% quantiles. Observer data from 2007 to 2019 were used to generate catch rate estimates. Observer data from earlier years were excluded due to differences in domestic regulations on shark retention. Available EM data were not used to estimate catch rates, as exploratory data analysis revealed lower taxonomic resolution in the EM dataset, particularly for shark species which were often only identified to genus or higher levels. There were insufficient observed sets to estimate catch rates inside the DFZ for the LBF, which has historically expended relatively little effort within that area (Figure 2).
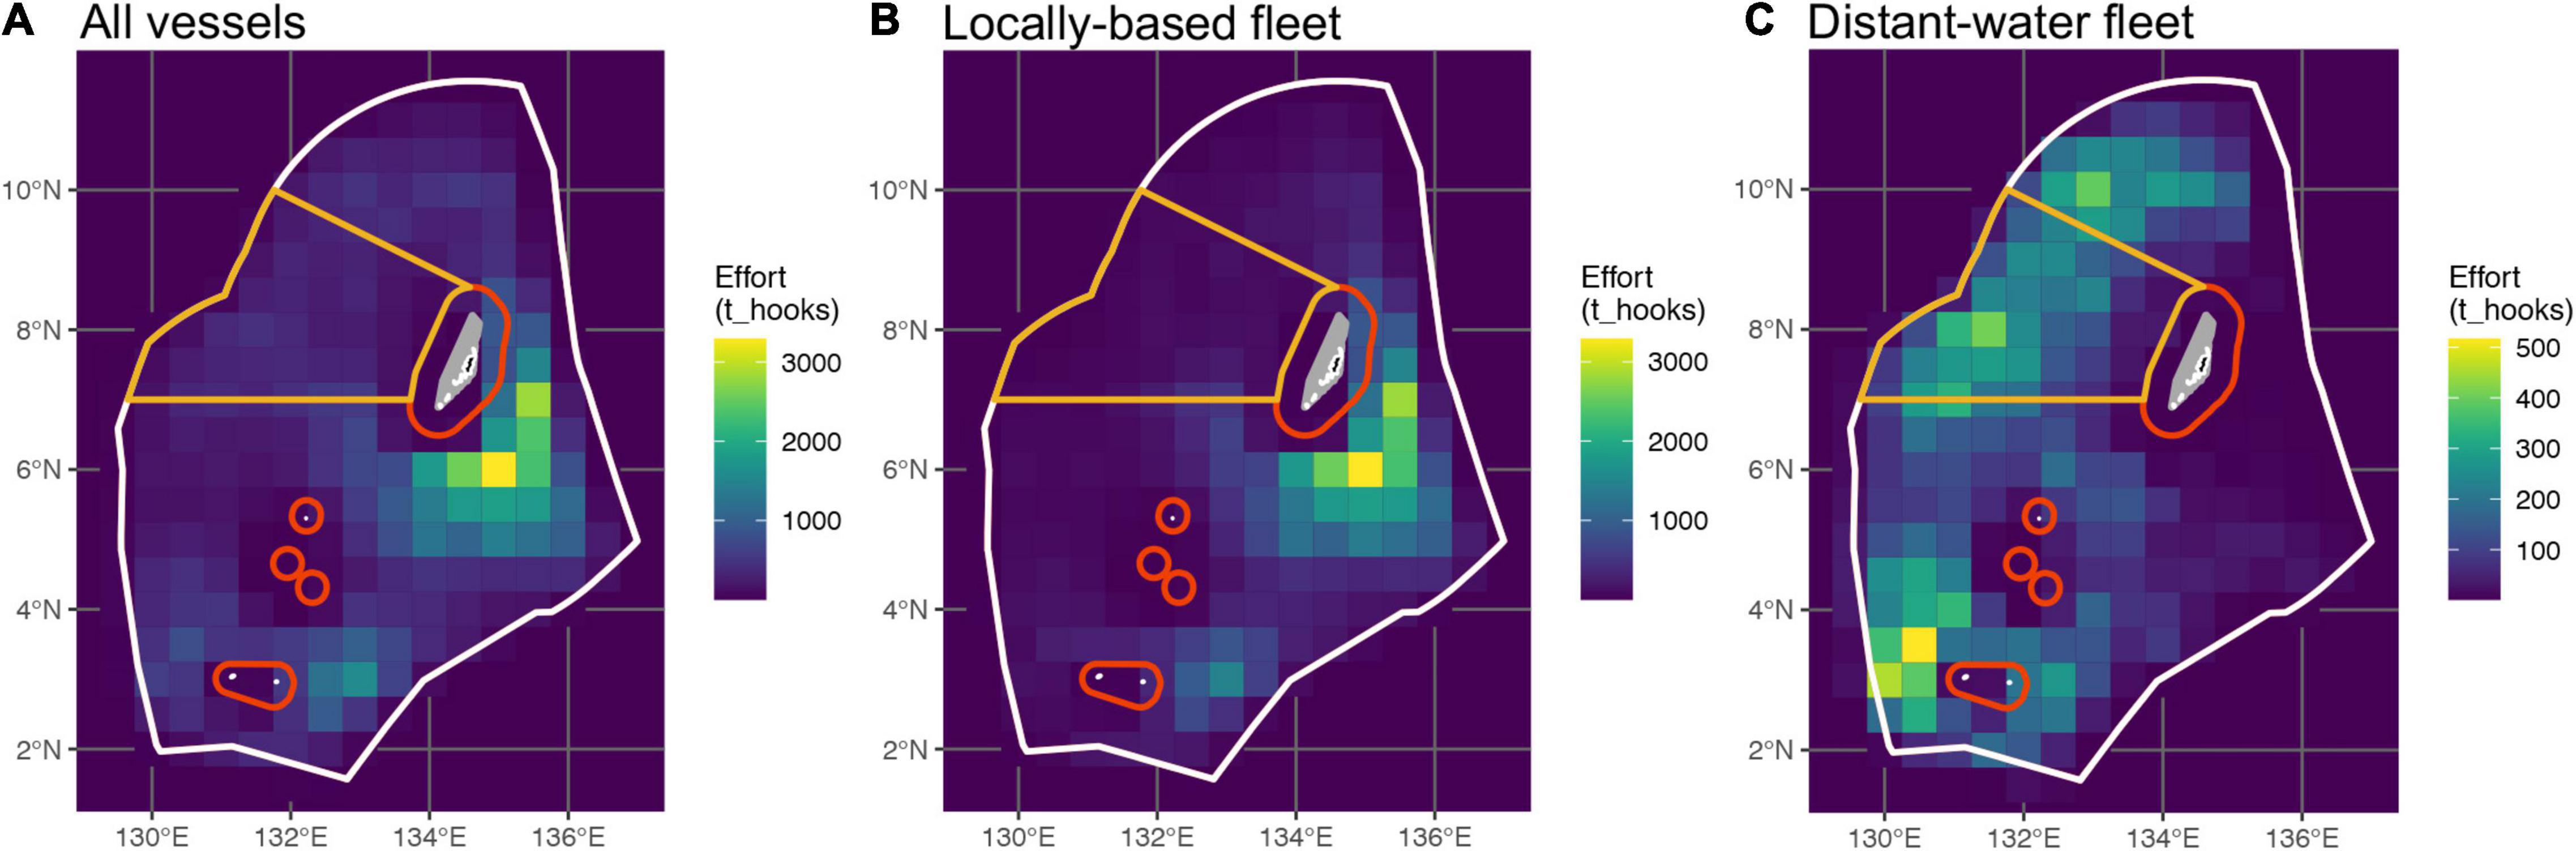
Figure 2. Total fishing effort in Palau’s EEZ from 2010 to 2019, expended by panel (A) all vessels combined, (B) vessels of the locally based fleet (LBF), and (C) vessels of the distant-water fleet (DWF; note different effort scale). Colored lines denote the boundaries of the DFZ (orange) as it pertains to longline fishing, and the PNMS (red to white). Only local fishing for domestic consumption is permitted within the red 12 and 24 nm boundaries. Note that the DFZ and PNMS were implemented after the timeframe of this study; their boundaries are shown here to illustrate subsequent results and their discussion.
Catch Clustering
To assess the extent to which species compositions have varied through time, we applied k-means clustering to catch compositions from both logbook and the combined observer and EM dataset. The clustering analysis was applied to catch proportions by number at a fishing trip resolution, with the number of clusters set at the point of inflection in variance explained as the number of clusters is increased. Trips with limited numbers of sets were excluded, i.e., logbook data with three sets or less, and observer trips with only one observed set. The clustering analysis of logbook data was applied to catch proportions of three species categories – bigeye, yellowfin, and total billfish catch. It was not possible to include shark catches in the logbook analysis, as these were not reported for all trips. The clustering analysis of observer data was applied to catch proportions of five categories – bigeye, yellowfin, total billfish catch, pelagic stingray, and total shark catch. We used the number of hooks between consecutive floats (HBF) as a proxy for relative gear depth, which can have a substantial impact on species’ catch rates and therefore, catch composition.
Catch Rate Models
Species-specific catch rate models were constructed using the R package mgcv (Wood, 2011), focusing on elasmobranch species that were observed in sufficient numbers to allow robust statistical modeling: pelagic stingrays, blue (Prionace glauca) and silky sharks (Carcharhinus falciformis). We were specifically interested in spatial, temporal and fleet effects on catch rates, e.g., seasonal trends, differing catch rates across Palau’s EEZ, and the effects of fishing strategy, particularly following the implementation of bycatch reduction measures. A negative-binomial likelihood was used, with a log link function. The response variable was numbers caught, and the natural log of observed hooks was included as an offset. Explanatory variables included in the model were: year, to account for temporal variation; month, to account for seasonal variation; fleet, to account for differences in fishing strategies; and a 2D gaussian process with a Matern covariance function, to account for spatial variation. Splines were used to account for potentially non-linear relationships between catch rates, and year and month. The model was:
where Yi denotes observed bycatch rate (individuals per thousand hooks), subscript i refers to set id, fleet is a categorical variable for the LBF and DWF, function f represents a thin plate regression spline, function g represents a cyclic cubic regression spline, function h represents the 2D gaussian process, and θ is an overdispersion parameter. All explanatory variables were included in each catch rate model. Models were fitted to observer data only, as exploratory data analysis suggested lower rates of species-specific catch records in the EM dataset for shark species. It was not possible to include HBF in the catch rate models along with fleet effects as the two variables were highly correlated.
Results
Fishing Effort
Between 2010 and 2020, a reported 104′814′811 hooks were deployed during 70′959 longline sets by 183 vessels fishing in Palau’s EEZ. Observer data were available for 980 (1.4%) of these sets, with 1,545,100 hooks observed. EM data were available from an additional 306 sets, with 458,100 hooks observed. Observations from the DWF accounted for 76 and 18% of the available observer and EM data, respectively. There was a marked difference in both the spatial distribution and the amount of fishing effort expended by the DWF and the LBF (Figure 2). The LBF expended 72% of the two fleets’ combined effort and operated primarily to the south-east of Palau’s main island group, in the area that was originally designated as the DFZ (Rppl 9-49, 2015; Figure 2), and east of Hatohobei State in the EEZ’s south-west (Figures 2A,B). The DWF accounted for 28% of total effort and had a broader distribution along the western half of the EEZ. This included the area now encompassed by the DFZ (Figures 2A,C), where the DWF expended 29% of its effort, which accounted for two-thirds of the total effort in that area.
The two fleets also differed in terms of the depth at which they fished. Almost all observed effort (72% of reported effort) of the LBF were shallow sets with four to eight HBF (∼50–200 m), while 98% of the reported effort and all observed effort of the DWF were deep sets (20–24 HBF, ∼450–600 m). Furthermore, the majority of the LBF’s observed effort was from pre-2015, whereas all observed effort of the DWF was from 2015 onward. The EM and observer datasets were imbalanced with respect to temporal and spatial coverage, with relatively limited overlap between the two.
Species Composition
A total of 117 taxa (species level or higher) were recorded in the longline catch of Palau, with the highest number (101) recorded by human observers, followed by EM (65) and logbooks (41) (Supplementary Table 5). Reported catches and species-level identification across all species except target tunas were proportionally lower in logbook data than those recorded by observers and EM (Figure 3 and Supplementary Table 5). Comparing the EM and observer records, the pelagic stingray Pteroplatytrygon violacea was the most abundant bycatch species and the third most frequently recorded species in both datasets, although its percentage contribution to total catch was higher in the EM reported catch (Figure 3). Conversely, three of the key shark species, blue Prionace glauca, silky Carcharhinus falciformis and thresher sharks (Alopias spp.) were recorded in higher proportions by observers. The resolution of species identifications was lower in EM data, in particular for species that were predominantly not retained, with individuals more frequently identified to higher levels, e.g., “Carcharhinidae” for sharks and “Unknown teleost” for a majority of finfish. Differences were also pronounced for turtles, where olive ridley turtles Lepidochelys olivacea were the dominant species recorded by observers, while the majority of turtles recorded on EM were placed in the reptilian order Testudinata.
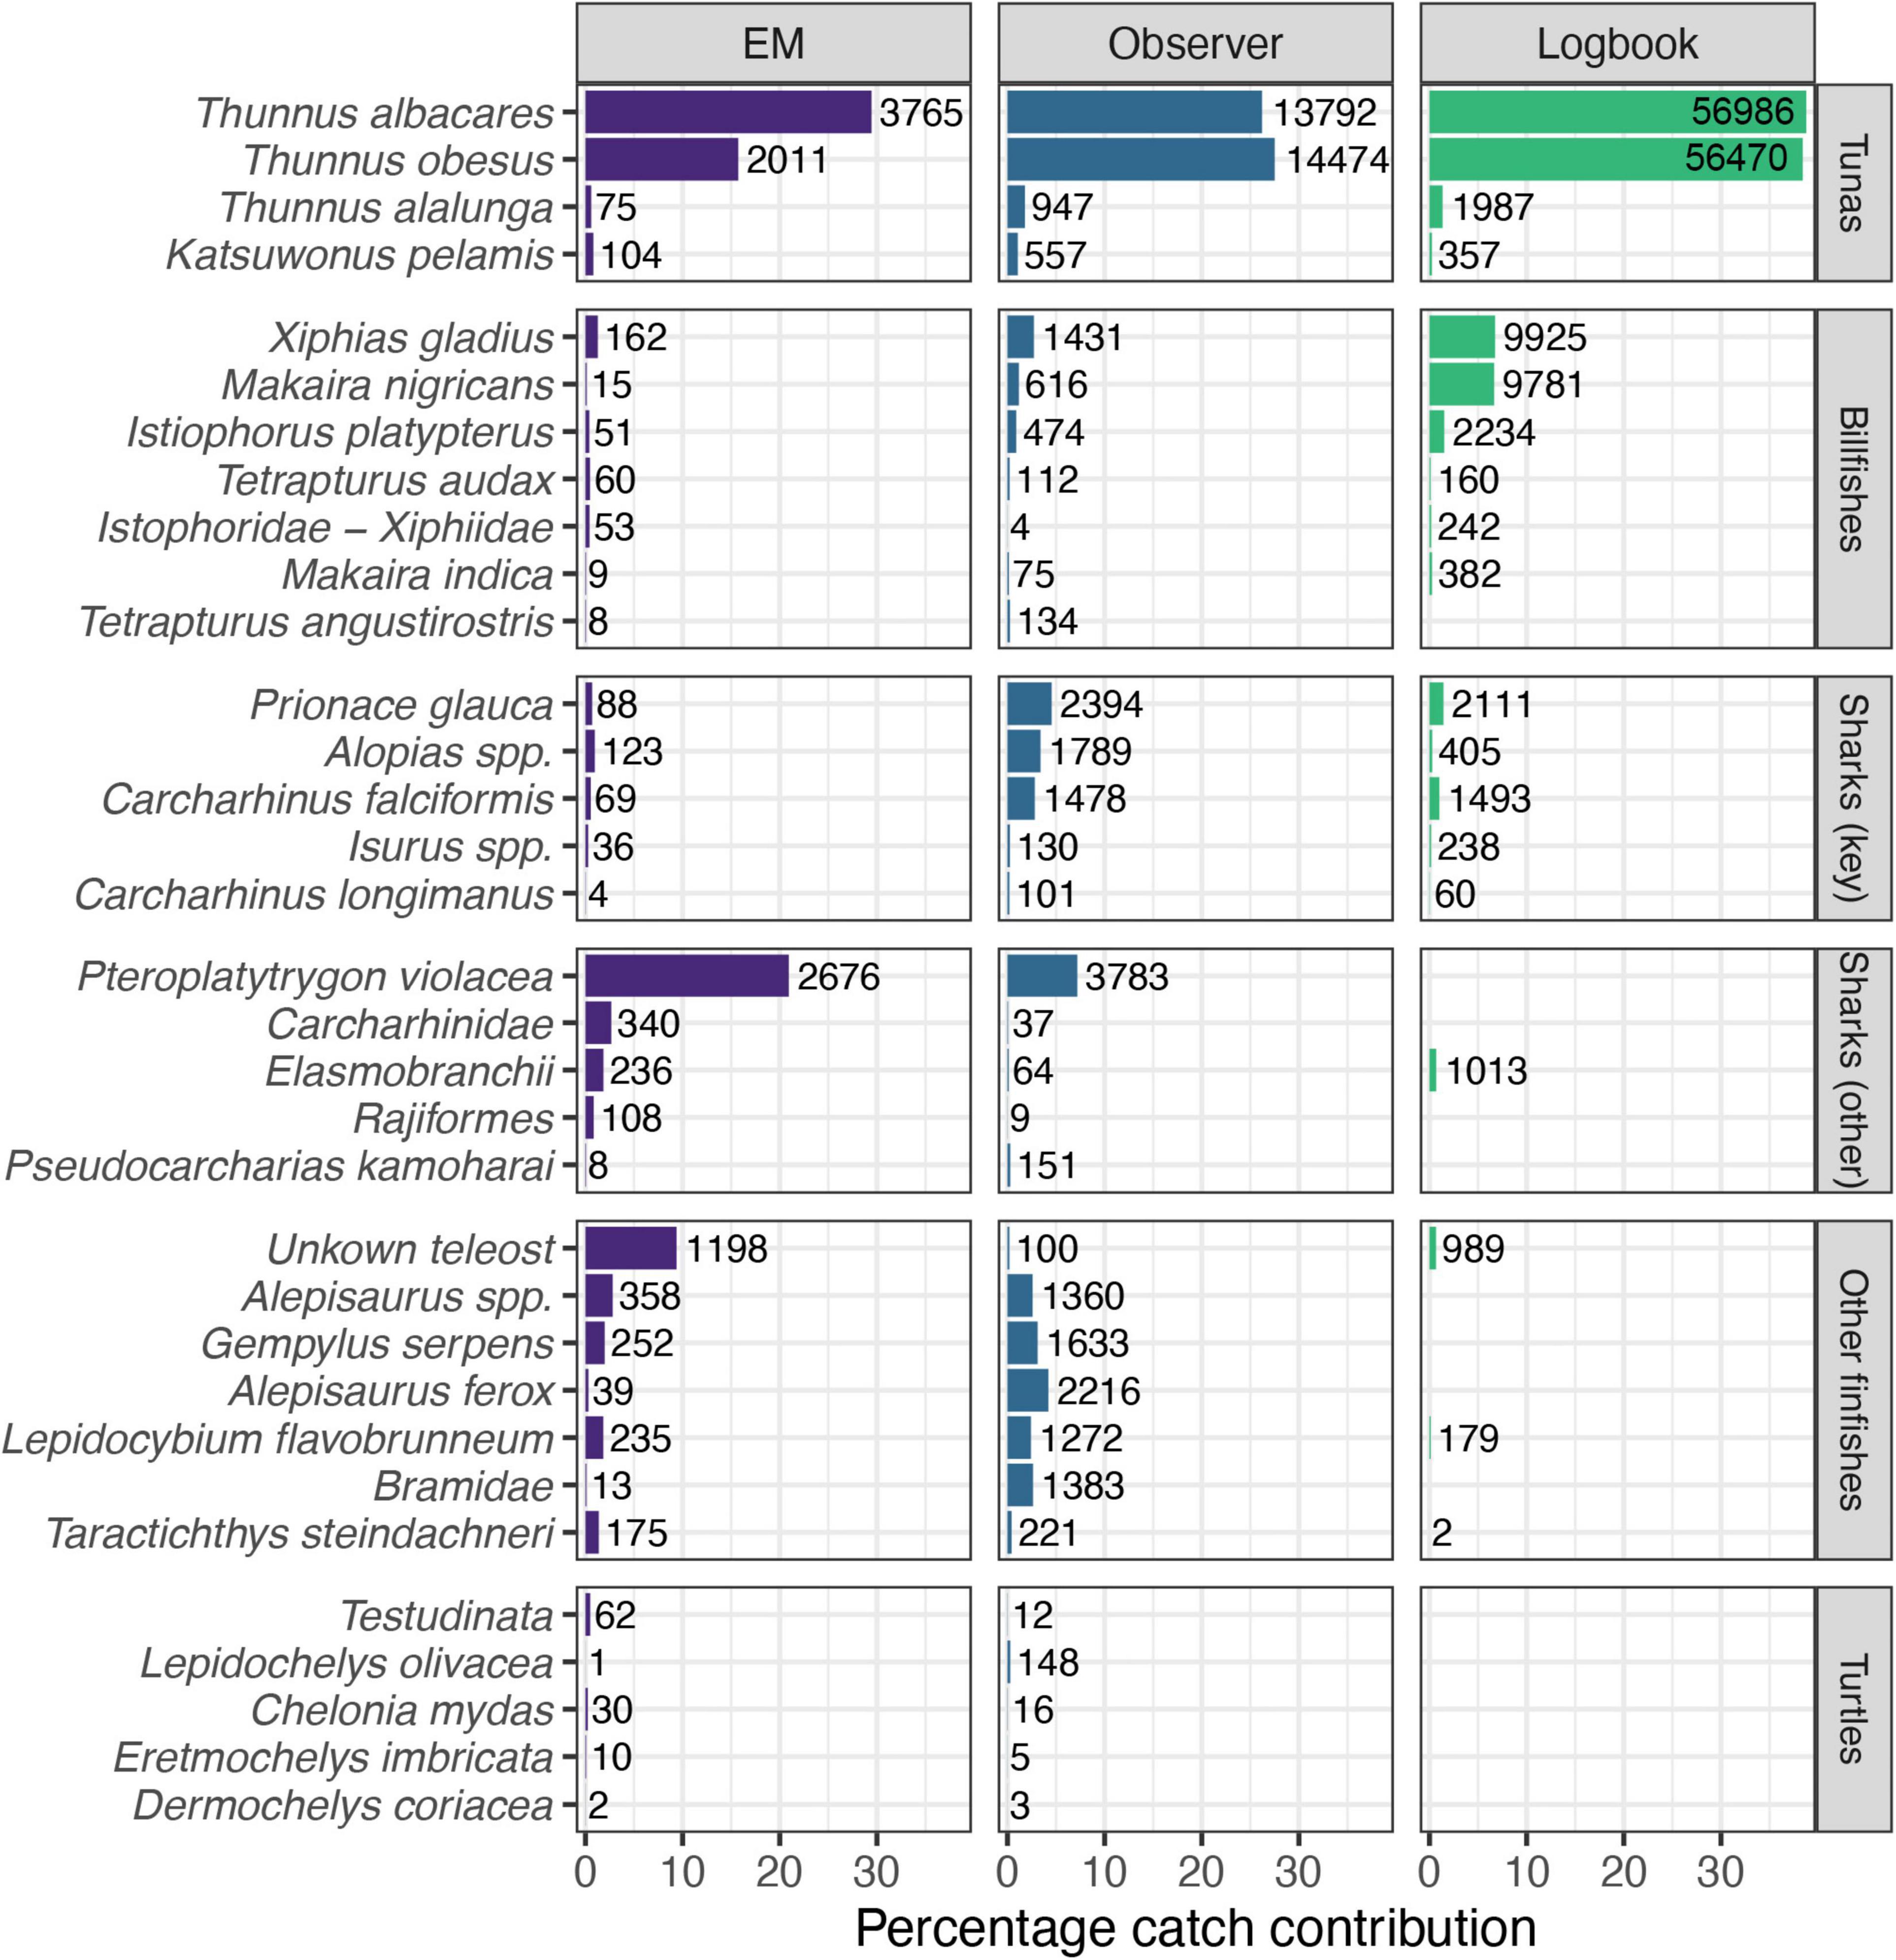
Figure 3. Percentage contribution of target and bycatch species observations to total catch (number of individuals) as recorded in each data source [Electronic Monitoring (EM), Observer and Logbook]. Number labels next to each record show the total number of observations recorded from 2016 to 2018 (EM) and 2010–2019 (Observer and Logbook). Figure shows a subset of selected species (see Methods for selection criteria; note varying resolution of taxa). Key sharks as identified by the Western and Central Pacific Fisheries Commission (WCPFC).
Catch Estimates
We estimated total catch of all species across both fleets between 2010 and 2020 at 2′122′279 individuals, of which 51% were tunas and the remainder was bycatch, equating to a target:bycatch ratio of ∼1:1. The ratio of retained:discarded individuals was 1.55:1, with an estimated 62% of all caught individuals being retained. Catch estimates based on logbook records accounted for 79% of the target catch and 8% of the bycatch estimated from observer records.
The difference between the estimated annual catch of the four main tunas (n = 107′786) and all tunas combined (n = 108′800) was 1,014 individuals. Of all bycatch species caught, just under half (49%) were SSI or of conservation concern. Sharks were the most abundant bycatch species group, with 48,400 individuals estimated to be caught annually, followed by the “other finfish” group (n = 32,600), billfish (n = 20,450), turtles (n = 2,350), marine mammals (n = 43) and seabirds (n = 34; Table 1).
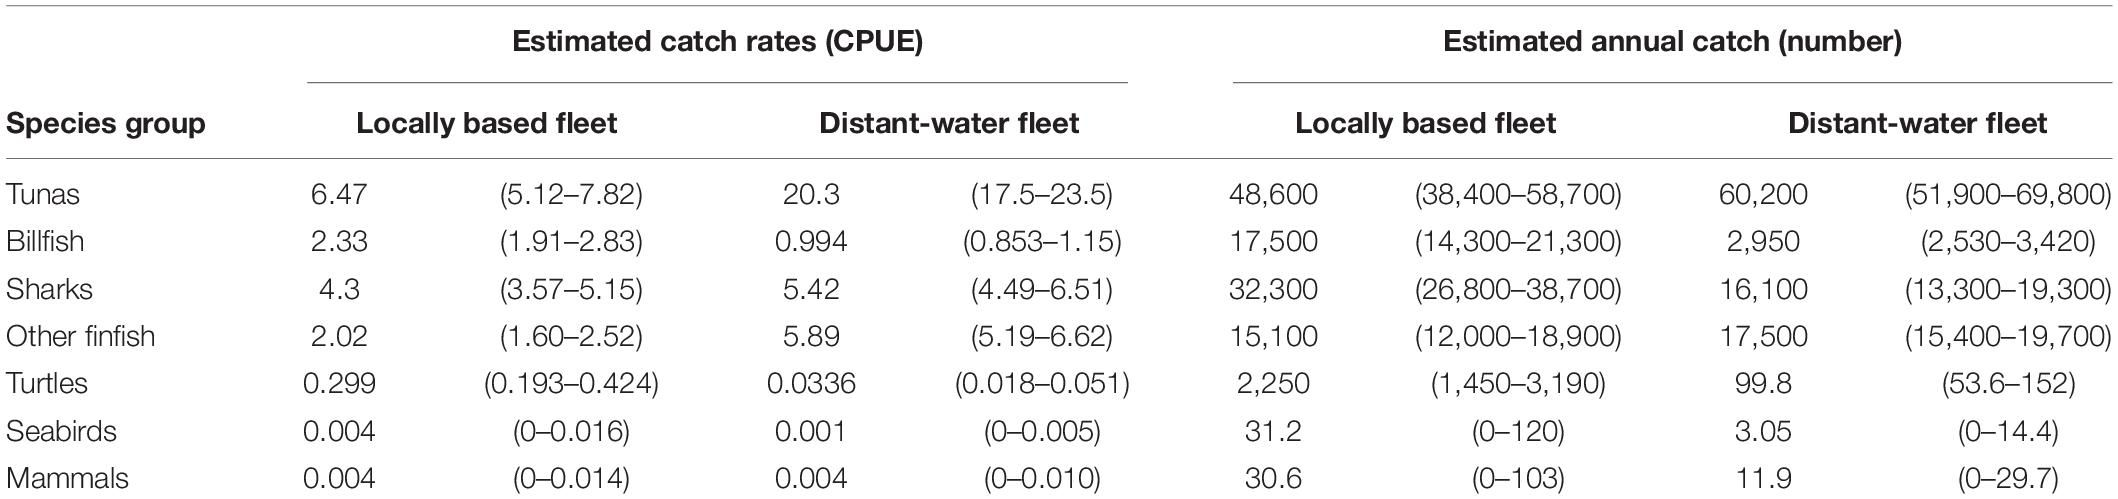
Table 1. Estimated catch rates (numbers per ‘000 hooks, 95% confidence interval (CI) in parentheses) and annual catch (numbers; 95% CI in parentheses) for the locally based and distant-water longline fleets by species group, based on observer data from 2007 to 2019.
Catch rates demonstrated strong between-fleet variation at both a species group and species level. Overall catch rates were lower for the LBF than for the DWF, with the exception of billfish and sea turtles (Table 1). Tunas were caught at 20.3 vs. 6.5 individuals per 1,000 hooks in the DWF and LBF, respectively. Compared to the target:bycatch ratio of the DWF for sharks (4:1), that of the LBF was nearly three times lower (1.5:1). For turtles, the LBF’s ratio (22:1) was 27 times lower than in the DWF (592:1; Table 1). The retained:discarded ratio for the LBF (1.8:1) was higher than for the DWF (1.5:1), with retained proportions of 64.4% (95% CI 59.3 – 69.2%) and 59.5 % (95% CI 56.0 – 63.1%), respectively. The ratios of SSI to other species was higher for the LBF (0.23:1) than the DWF (0.1:1). Of the discarded portion of catch, the ratio of SSI to other species was 1.1:1 for the LBF, and 0.3:1 for the DWF.
Catch rates of pelagic stingray, blue shark, and thresher shark species were higher for the DWF, whereas catch rates of silky sharks were higher for the LBF (Figure 4A and Supplementary Table 2). The LBF had lower catch rates of yellowfin and bigeye tuna; swordfish catch rates were comparable between the fleets.
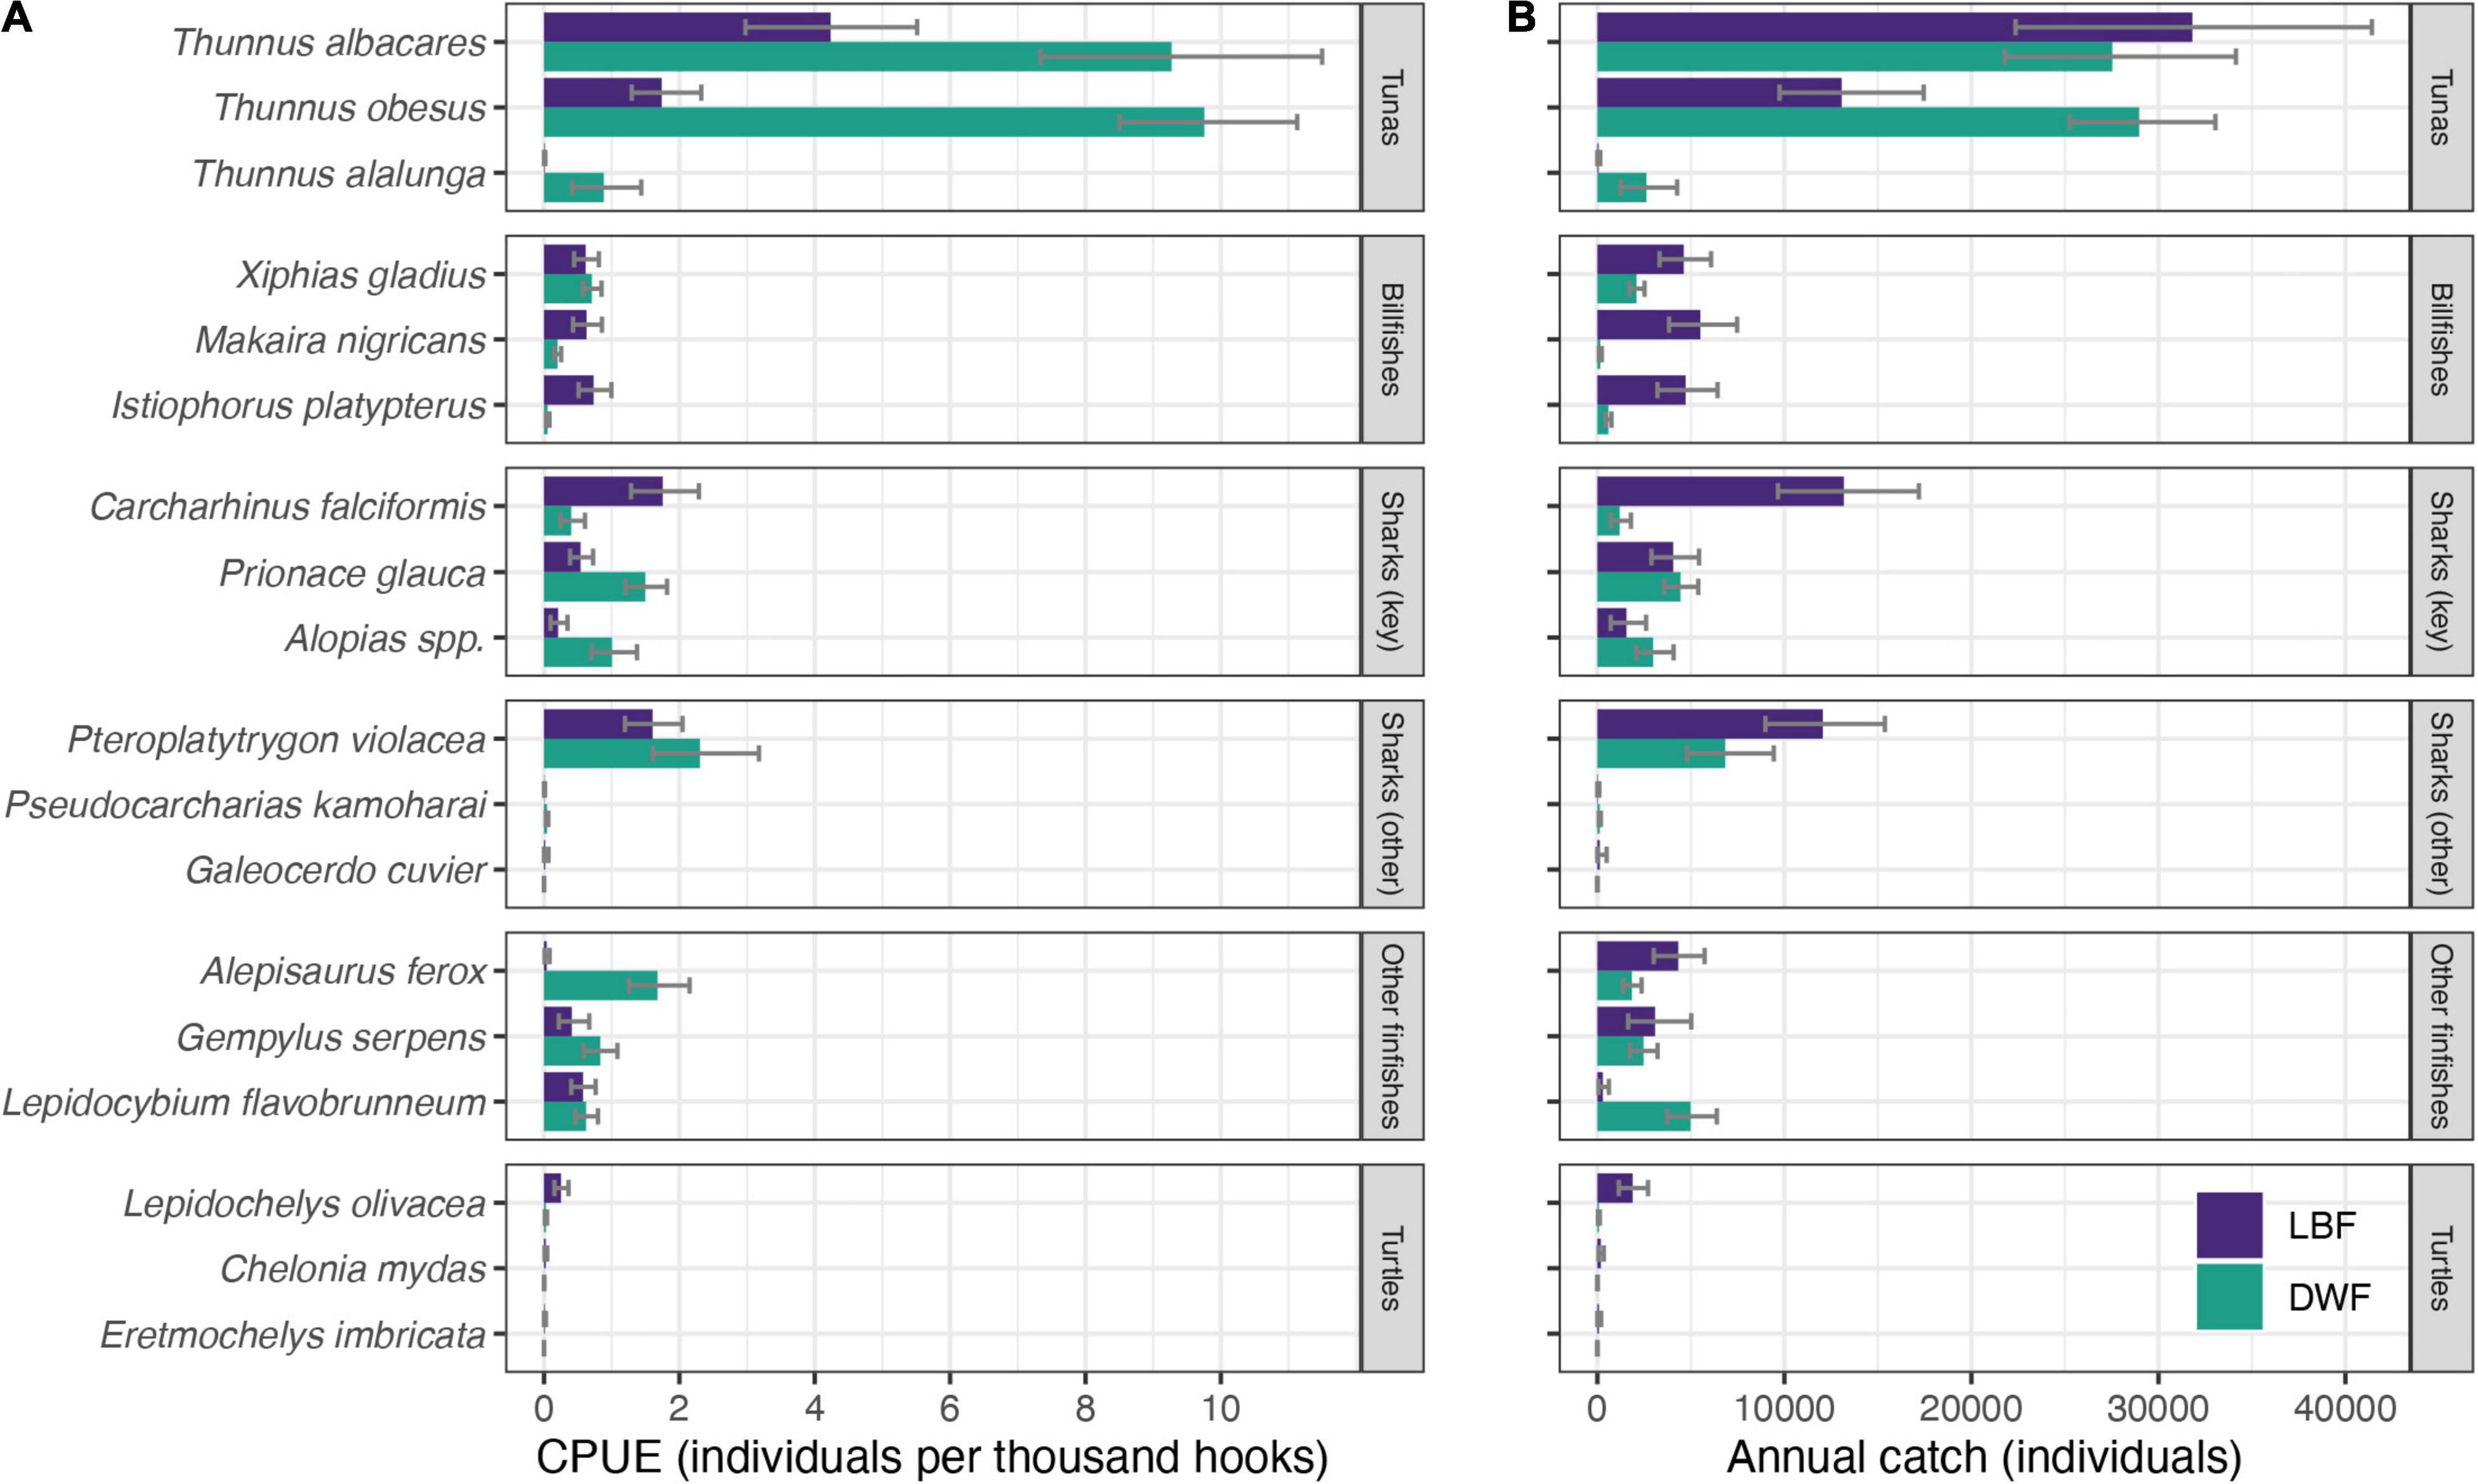
Figure 4. Estimated (A) catch rates (individuals per thousand hooks) and (B) mean annual catch (individuals) of selected species for the LBF (purple) and the DWF (green), based on observer data collected from 2007 to 2019. Error bars represent 95% confidence intervals (CI).
The DWF, despite expending only a third of the LBF’s effort and operating smaller vessels, caught over twice the estimated annual number of bigeye tuna (n = 28,900), and higher numbers of most sharks, rays and several teleost species (Figure 4B and Supplementary Table 3). The LBF’s higher effort was reflected in nearly twice the catch of pelagic stingrays, six times more billfish and 25 times more olive ridley turtles compared to the DWF. Estimated annual catches of silky sharks (n = 13,200), the third-most caught species in the LBF (after yellowfin, n = 31,900 and bigeye tuna, n = 13,300), were 11 times lower in the DWF (n = 1,200; Supplementary Table 3).
The majority of estimated retained individuals was accounted for by scombrid and billfish species. Approximately one-third of the catch of other teleost species was retained, including escolar Lepidocybium flavobrunneum, mahi-mahi Coryphaena hippurus, and great barracuda Sphyraena barracuda. The majority of the retained catches of these teleosts was accounted for by the LBF, with minimal rates of retention for the DWF.
Sufficient observer data were available (2015–2019) to stratify the DWF catch rates spatially, i.e., inside and outside of what now constitutes the DFZ. Target:bycatch ratios for the DWF were lower inside the DFZ (∼1.2:1) than outside (∼1.8:1), predominantly driven by lower catch rates of yellowfin tuna inside the DFZ (see Supplementary Table 4). Retained:discarded ratios for the DWF were also lower inside the DFZ (∼1.2:1) than outside (∼1.5:1). SSI overall accounted for a higher proportion of total catch (0.15:1) and discarded catch (0.43:1) inside the DFZ compared to outside (0.09:1 and 0.26:1, respectively). Although catch rates of most species were lower in the DFZ, notably those of bigeye and yellowfin tuna, pelagic stingray and silky shark, the catch rates of thresher sharks (Alopias spp.) were almost twice as high inside the DFZ than outside (Figure 5 and Supplementary Table 4). Catch rates of blue shark were comparable inside and outside the DFZ (Figure 5 and Supplementary Table 4).
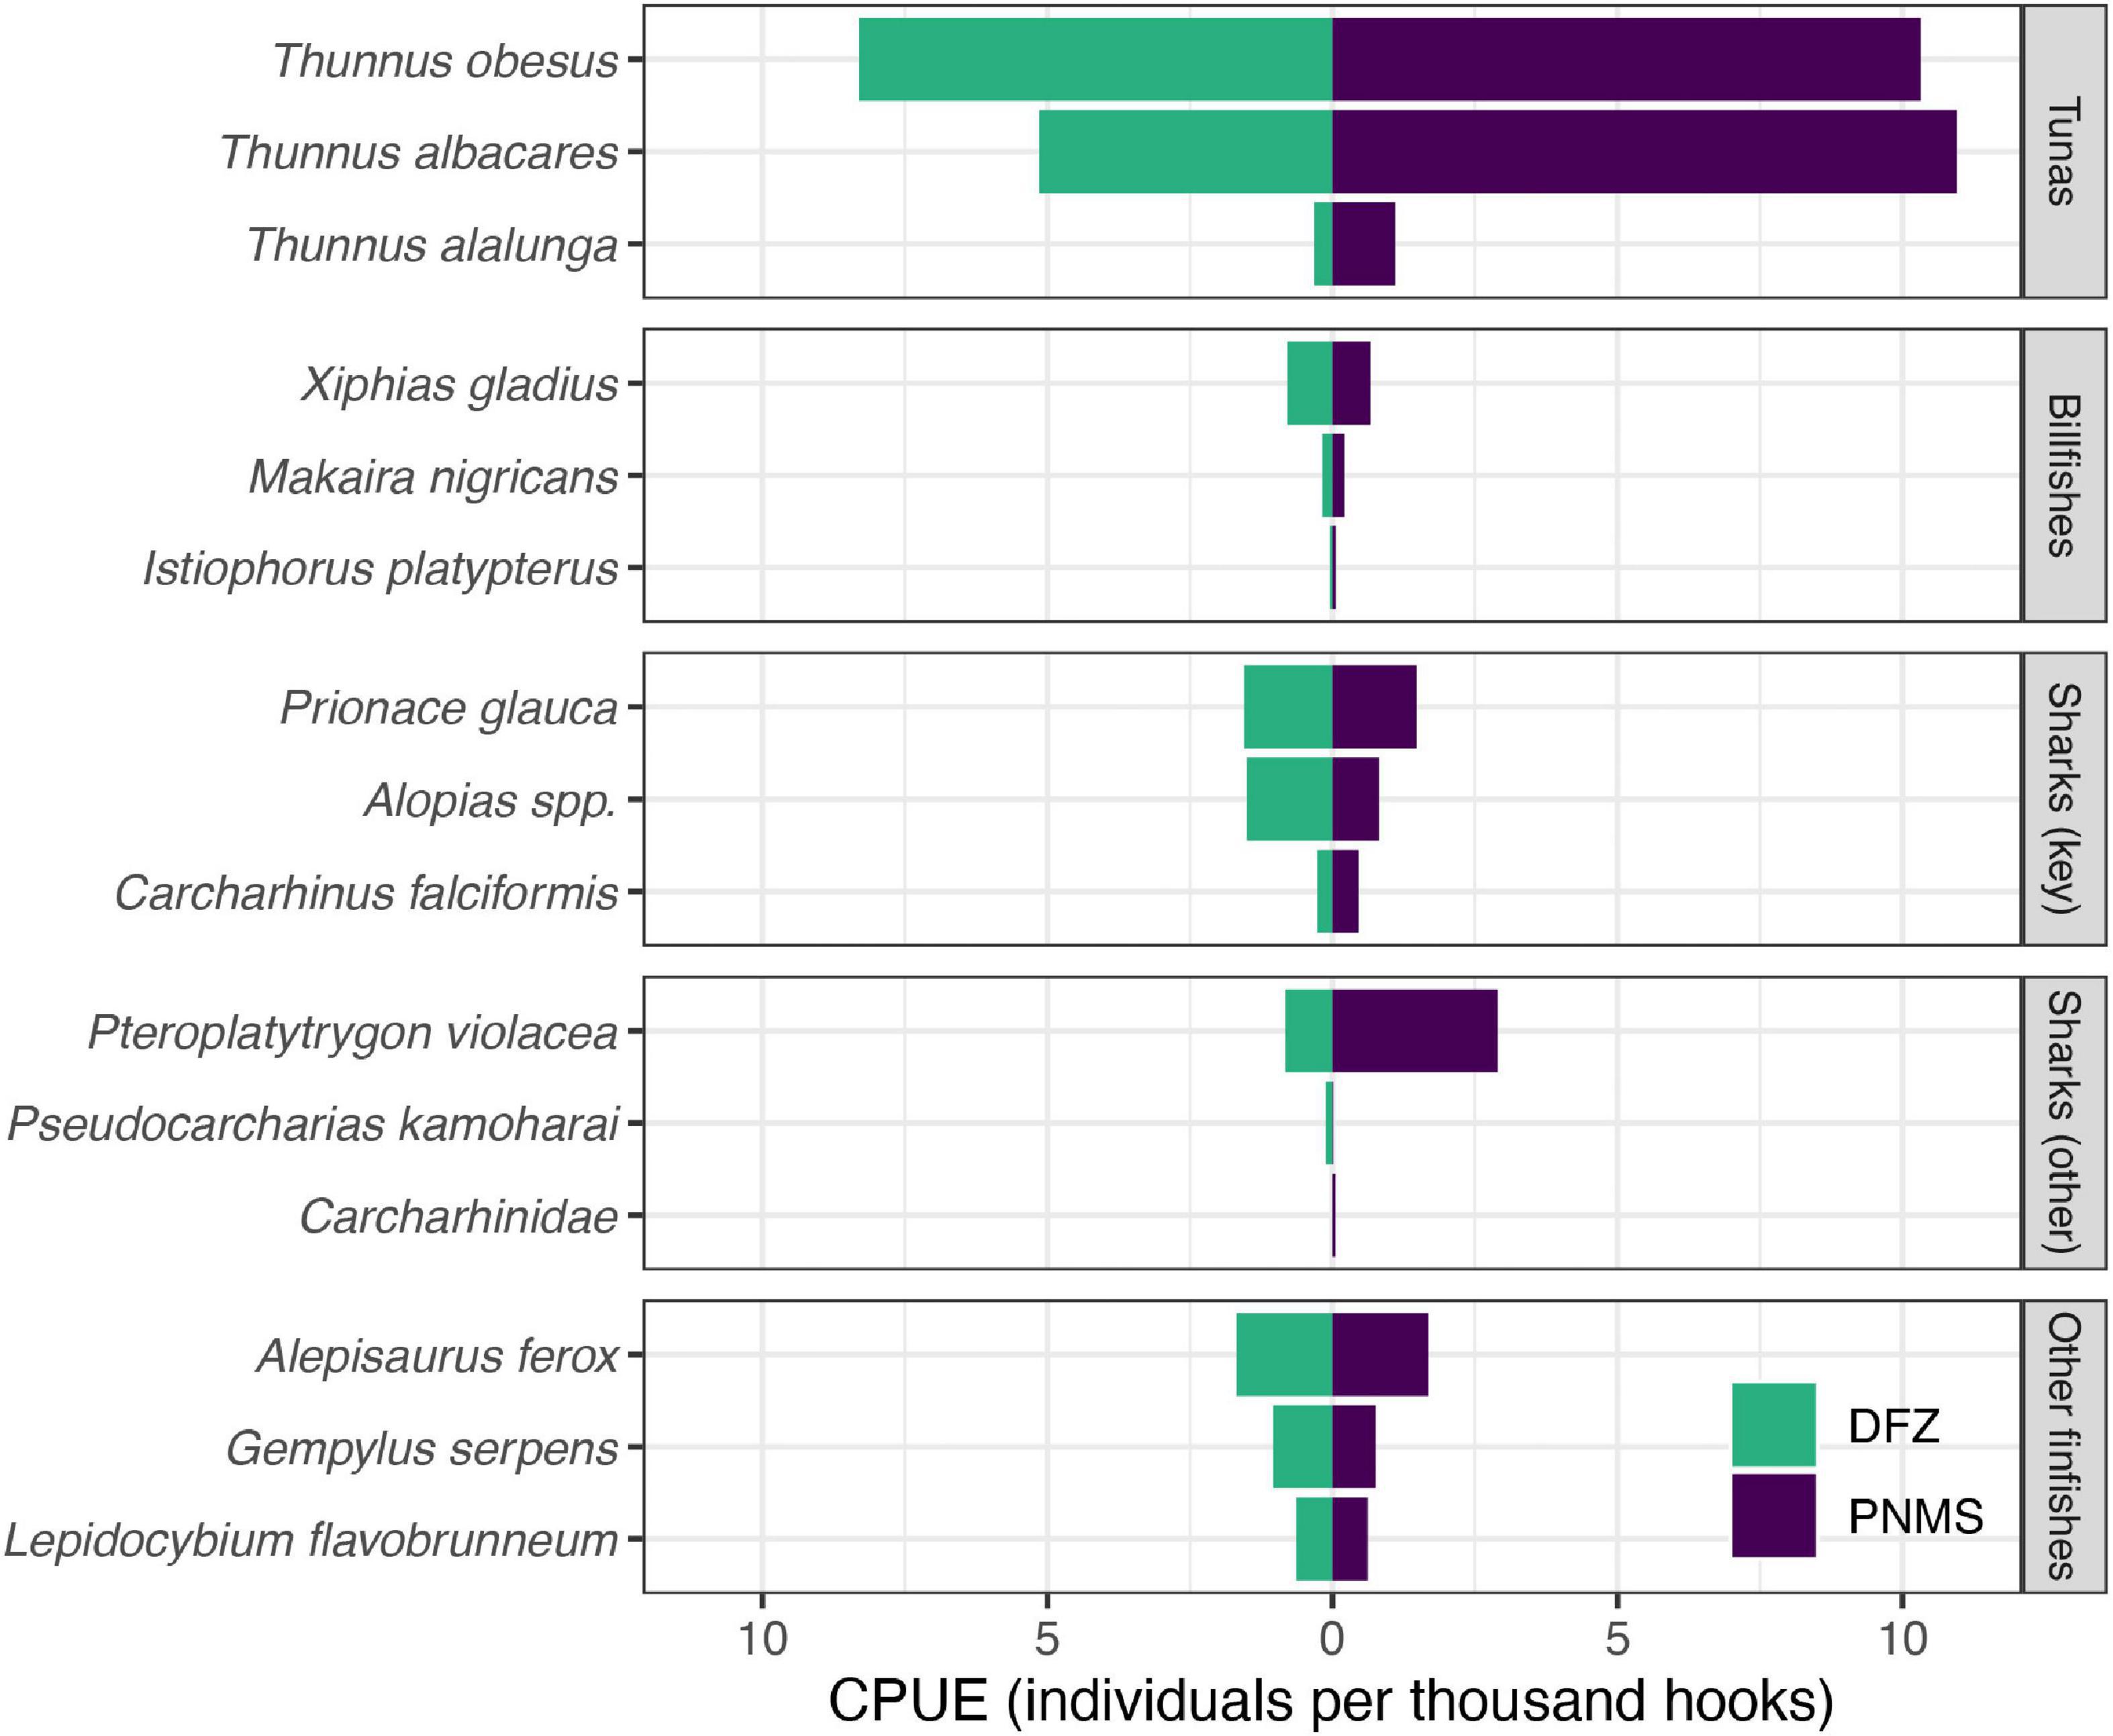
Figure 5. Estimated catch rates catch per unit of effort (CPUE) of selected species caught by the DWF operating in what is now the DFZ (green) and the PNMS (purple). Catch rates were estimated using observer data collected from 2015 to 2019, i.e., the time between the signing into law of the PNMS Act (October 2015) and its full implementation (January 2020). Estimates for additional species are provided in Supplementary Table 4.
Catch Clustering
Catch clustering of observer data identified six clusters (Supplementary Figure 2). Yellowfin, as well as shark and billfish-dominated clusters tended to have fewer HBF, indicating shallower sets, while clusters with high proportions of bigeye tuna tended to reflect deeper sets with more HBF (Supplementary Figure 2). This was also reflected in assigned clusters for the different fleets, with the DWF having a higher observed effort assigned to target tuna clusters than the LBF.
There was also some suggestion of temporal trends in clusters for the LBF; a mean proportion of 0.42 of annual effort was assigned to the “SHK-BIL” and “BIL-SHK” clusters from 2004 to 2015, compared with 0.15 for 2016–2018. This suggests a shift away from sharks in the LBF’s catch composition, though the limited number of observer trips for which data are available made it difficult to pinpoint the timing and extent of this apparent reduction in shark catches. It was not possible to assess temporal trends in assigned clusters for the DWF due to the relatively short time series of available observer data (2015–2019).
Catch clustering of logbook data identified four clusters and suggested that in 2014, the LBF’s catch composition saw a further change with a shift from bigeye to yellowfin tuna. Sharks were not included when assigning logbook catch composition clusters due to very limited reported shark catch by both fleets.
Bycatch Condition
In both fleets, the majority of bycatch was discarded (dead, dying, healthy/injured, or in unknown condition based on a visual assessment by the observer), although billfishes and several other species of finfish were generally retained. The LBF discarded a substantially higher proportion of dead SSI (56%) than the DWF (23%), although this difference was less pronounced when dying individuals (6% vs. 27% in the LBF and DWF, respectively) were assumed not to have recovered, which would equate to a 62% and 50% mortality in SSI caught in the LBF and DWF, respectively (Figure 6). Furthermore, the DWF discarded a substantially higher proportion (although much lower number) of dead sea turtles than the LBF. The majority of pelagic stingrays, comprising the most frequently caught SSI, were discarded dead in the LBF (71%), and either dead (11%) or dying (58%) in the DWF (Figure 6).
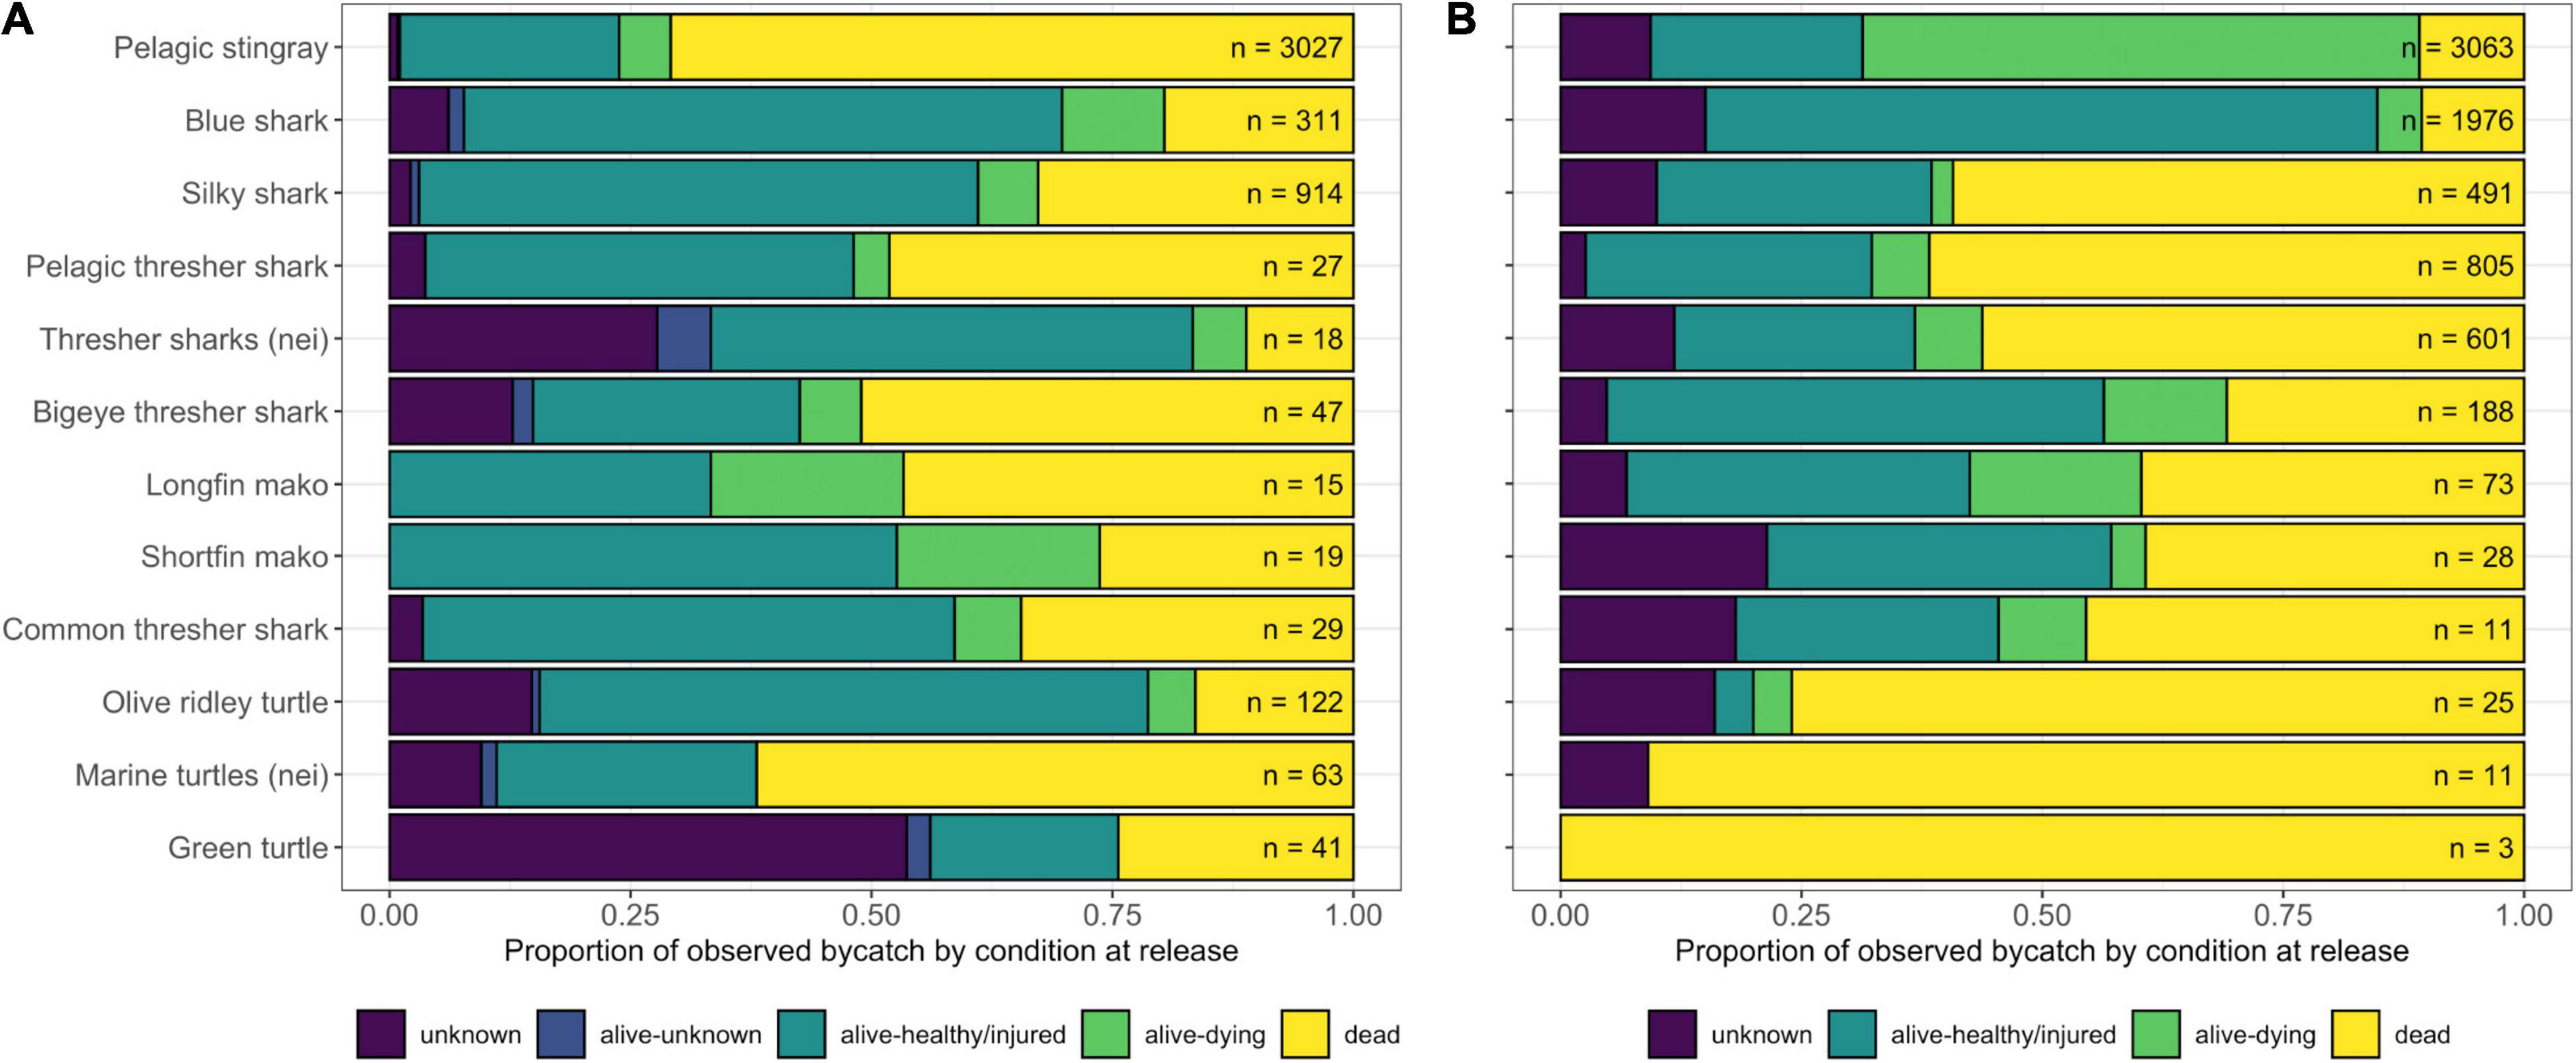
Figure 6. Condition at release of selected Species of Special Interest (SSI) as a proportion of total observed catch (n = ) of each species or taxon as recorded by observers in panel (A) the LBF and (B) the DWF. Species with at least 40 records were included. Nei (not elsewhere indicated) was used for individuals that were not identified to species level.
Across all species and especially for SSI, observers recorded higher proportions of retained individuals and unknown fate outcomes than EM analysts, who recorded a higher proportion of discards. Individuals’ condition at haulback and release also differed between the two datasets, with EM generally noting more “unknown” incidents (Supplementary Figure 1).
Catch Rate Models
Visual examination of quantile residuals did not suggest violation of assumed error distributions. Estimates of fleet effects were relatively imprecise for all models, which may result from the relatively distinct areas of operation for the different fleets (Figure 2). Chi squared statistics and approximate p-values are provided in Supplementary Table 1. All terms were significant except for the fleet effect for the pelagic stingray.
The DFZ was associated with lower catch rates of pelagic stingrays (Figure 7). No significant difference in pelagic stingray catch rates was detected between fleets (p = 0.62). The year effect for pelagic stingray catch rates demonstrated an increasing trend through time, though with variation. The month effect for pelagic stingray catch rates was complex and highly non-linear.

Figure 7. Effect plots of the catch rate models for panel (A) pelagic stingray (Pteroplatytrygon violacea), (B) blue shark (Prionace glauca) and (C) silky shark (Carcharhinus falciformis). Darker and lighter colors on the maps (top row) indicate lower and higher catch rates, respectively. Black lines on the maps indicate contours of the spatial surface, and small black dots represent observations. In the second row, solid lines and dashed lines represent the parameter estimate and its standard error, respectively. For the year and month effects (bottom two rows), gray contours are provided for 95% confidence intervals (CI). Note that y-axis scale varies across plots.
The spatial effect for blue shark catch rates demonstrated a generally increasing trend northward, though with an area of higher catch rates south of the DFZ (Figure 7). Blue shark catch rates for the DWF were estimated to be higher than for the LBF. The year effect for blue shark catch rates demonstrated a strong decline from 2004 to 2007 followed by a weaker increase from 2008 through to 2019, with no observer coverage available for 2005 and 2006. Blue shark catch rates were estimated to increase from November through to May, then decrease through to October.
The spatial effect for silky shark catch rates had lower catch rates at the latitudinal limits of Palau’s EEZ, with catch rates declining from 8°N northward and 4°N southward (Figure 7). Silky shark catch rates were significantly higher for the LBF than the DWF. The year effect for silky shark catch rates was relatively imprecise from 2005 throughto 2015, with an increasing trend through time from 2015 onward. The month effect for silky shark was relatively imprecise, though catch rates were estimated to increase from March throughto September, before decreasing through to March.
Discussion
The goal of this study was to establish a baseline of historical catches and catch rates, species composition, and effort distribution of longline fleets operating in the waters of Palau in the decade preceding the implementation of the PNMS in January 2020. This baseline is primarily intended to support future evaluations of the sanctuary’s ecological performance. From a total longline effort of 104.8 million hooks deployed in Palau’s waters between 2010 and 2020, 2′122′279 individuals from 117 taxa were estimated to have been caught. Target tuna species constituted 51% of the catch, resulting in a target:bycatch ratio of 1:1. The ratio of retained to non-retained catch for the combined fleets was 1.55:1, reflecting mainly the retention of billfishes as a seasonal byproduct in the LBF, but not the DWF. In terms of annual estimated catch, pelagic stingrays were the most frequently caught bycatch species (n = 18,890), while key sharks were the most abundant bycatch group (n = 48,400). With the exception of billfish and some finfishes, most bycatch was discarded, reflecting the generally high discard rates of pelagic longline fisheries: globally, longline fisheries contribute the majority (64%) of all tuna fishery discards, with discard rates of up to 40% of their catch in numbers (Gilman et al., 2017). In the LBF and DWF, respectively, 62% and 50% of all SSI were discarded dead or dying, with unknown levels of post-release mortality for individuals released alive and healthy or injured (but see Musyl and Gilman, 2018). Although Palau had implemented bycatch measures since 2003, this rate of mortality suggests that the impacts of fishing may have been continuing on vulnerable SSI populations, supporting the decision to implement the PNMS for species conservation.
In light of these findings and the ecological expectations of the PNMS, the question arises whether the sanctuary, which bans fishing in 80% (∼500,000 km2) of Palau’s EEZ, is likely to provide conservation benefits to target and/or bycatch species. To answer this question, future assessments will be able to build on this baseline in part with data collected from fishing vessels operating in what is now the DFZ. However, given the historical differences in catch rates, species composition and spatial overlap between the LBF and DWF, future assessments of the PNMS may benefit, alongside other methods of census, from dedicated research fishing trips by the LBF in areas of the PNMS where fishing effort was once concentrated. Alternatively, a counterfactual approach could be used to assess the responses of various species to the PNMS by predicting what the LBF’s catch would have been, had the designation of the sanctuary and the re-location of the DFZ not eliminated its fishing grounds (Gilman et al., 2020).
Fleet and Spatial Effects
We found strong between-fleet variation in catch rates and species composition, which were mostly explained by differences in fishing strategies and spatial distribution of effort. This implies that both how and where vessels fish matters in terms of fishery interactions with species. A key difference in fishing strategy between the two fleets was the depth at which their gear was set, whereby the LBF tended to fish in shallower waters (HBFs normally 4–8) while the DWF consistently set its gear deeper (20–24 HBF). While we could not include time of set (in UTC) in our analyses, an earlier assessment of the LBF’s fishing strategy demonstrated that the locally based Taiwanese vessels used two strategies with different times of day, which also differed slightly in fishing depth (Gilman et al., 2015). Overall, these findings imply that differences in catch composition between fleets were primarily explained by differences in fishing strategy, rather than differences in the spatial distribution of their respective fishing effort. Nevertheless, it was not possible to clearly discern the effects of fishing strategy – in particular HBF – from spatial effects. For instance, the LBF caught 25 times more olive ridley turtles compared to the DWF. This difference could have arisen from an overlap of the fleet’s preferred fishing grounds with important habitat for olive ridley turtles, or from the LBF’s shallow sets. The latter may provide the more likely explanation, given analyses of the effects of hook position on catch rates have shown that some species, including turtles and silky sharks, tend to be caught on the hooks nearest to the float (Watson and Bigelow, 2014; Huang et al., 2016).
Across all species, catch rates of the DWF were higher than those of the LBF, but lower in the DFZ than in the area that now constitutes the PNMS. In contrast, overall SSI catch was higher in the DFZ than outside, although this varied at the species-level: modeled catch rates for blue sharks, although higher in the DWF than the LBF, were also higher to the north, south and northwest of the DFZ, which suggests that the current ban on fishing in those areas could be beneficial to this species. Catch rates of vulnerable thresher sharks were almost twice as high inside the DFZ than outside, while those of several other at-risk species including endangered turtles and vulnerable silky sharks were lower in the DFZ. Likewise, catch rates for pelagic stingrays were lower in the DFZ. Although this species was not treated as an SSI in the catch rate analysis due to its large contribution to total catch, its risk status seems to warrant closer examination (see next paragraph). It is unclear whether the lower estimated catch rates of pelagic stingrays in the DFZ compared to the remaining EEZ are indicative of naturally lower abundance of this species, or of fleet- specific fishing strategies in that area.
Catches of target species were also lower in the DFZ. This could eventually result in intensified fishing effort or prompt political pressure to open a larger area for industrial fishing in Palau, potentially increasing risks to vulnerable bycatch species. However, at least in the short term these risks are outweighed by the benefits accrued to SSI through the re-orientation of the DFZ from east- to west-facing in 2019, which presented an unacceptable economic loss for the LBF and led to its departure. The LBF’s catch rate for SSI relative to other species, as well as its shark:target and turtle:target ratios were substantially higher than that of the DWF. SSI also constituted a nearly four times higher proportion of discards in the LBF than the DWF, and the estimated annual catches of some of these species, such as silky sharks, olive ridley and green turtles, were magnitudes higher than those of the DWF. This suggests that the current location of the DFZ – if only by the fact that it effected the departure of the LBF – may offer a higher level of protection than if the DFZ had remained in its original location (it is assumed that in this case, the LBF would have remained in Palau, at least in reduced capacity). Compared to the LBF, the DWF was characterized by generally lower proportions of dead discards, particularly of SSI. This may be due to differences in bycatch handling techniques, depth, time of day or other fishing strategies (Poisson et al., 2019). Though more likely to be an unintended effect of techniques aimed at maximizing target catch rather than an attempt at lowering bycatch mortality rates, this characteristic of the DWF could be beneficial for bycatch species still at risk of fishing mortality in the DFZ. By example, pelagic stingrays are a widely distributed species and a common bycatch component of longline fisheries (Mollet, 2002). Although pelagic stingrays have long been regarded as a low risk species based on low mortality rates (Cortés et al., 2010), recent risk assessments of the effects of pelagic longline fisheries assign high relative risk to this species (Gilman et al., 2021). We treated this species as an SSI in our bycatch condition analysis, given the increasing trend in catch rates over the last 15 years indicated by the catch rate model, and their high mortality levels: in the DWF and LBF, respectively, 69 and 75% of discarded individuals of this species were dead or dying. Sea turtles were the exception to the fleet trend described here: they were caught at much lower rates, but discarded dead at substantially higher rates, in the DWF compared to the LBF. These results are consistent with those of an earlier study, where changing from shallow to deep sets was shown to reduce catch rates, but increase haulback mortality rates, for turtles (Gilman et al., 2015). Finally, given that the majority of observed sets in both fleets used Japanese tuna hooks, turtles might benefit from the use of circle hooks.
Effectiveness of Bycatch Mitigation Measures
Broadly, fisheries management agencies have been slow to implement effective bycatch mitigation practices, presumably due to a lack of political will (Soykan et al., 2008; Gilman and Lundin, 2010). We asked whether bycatch mitigation measures implemented at the national or regional level produced distinct changes in catch composition, and identified changes in the LBF on two occasions: first, a distinct reduction in blue shark and overall shark catches after 2003 and second, a shift away from sharks between 2012 and 2016. It is likely that the former was a consequence of a shift in fishing strategy in response to Palau’s ban on wire leaders and shark retention (Rppl 6-36, 2003), passed in 2003 (Gilman et al., 2015) and to date the country’s most important shark protection law. However, the year 2003 was also identified as the global peak of pelagic shark catches (Clarke et al., 2015), suggesting that the decline observed here could also be due, at least in part, to factors other than Palau’s domestic legislation. The second shift away from sharks appears to have coincided with the adoption of several CMMs for sharks by members of the WCPFC, e.g., the silky shark retention ban of 2014 (WCPFC, 2013). No discernible change in catch composition was reflected in the data after Palau declared its waters the world’s first shark sanctuary in 2009.
While it appears that these bycatch reduction measures had a discernible impact on longline catches, such measures can also have unintended effects. Retention bans, designed to reduce incentives to catch and retain certain species, might give a false sense of reduced mortality, but they mitigate neither at-vessel mortality nor post-release mortality rates, both of which can be high in some species (Musyl and Gilman, 2018; Braccini and Waltrick, 2019). Because retention bans often result in increased discard rates, they can undermine coastal states’ food security and prevent them from fully realizing the benefits from the fisheries in their waters (Gilman et al., 2017). Furthermore, mitigation measures may be insufficient in improving the status of some sensitive species caught in the longline fisheries in Palau, such as critically endangered oceanic whitetip sharks. A 2012 stock assessment identified bycatch in longline fisheries as the greatest impact on the WCPO stock of this species, and found it to be overfished, with overfishing occurring (Rice and Harley, 2012). All three species of thresher shark (pelagic, bigeye, and common) were recorded in this study, collectively forming the third most abundant key shark taxon across all data sources. All are classified as vulnerable on the IUCN Red List, and are listed on CMS Appendix II and in the CMS MoU for sharks. Globally, the outlook for far-ranging elasmobranchs is grim: a recent study attributed an 18-fold increase in fishing pressure to a 71% decline in the global abundance of oceanic sharks and rays since 1970, which corresponds to three-quarters of the species in this group being threatened with extinction (Pacoureau et al., 2021). More comprehensive measures, such as fishery closures or fishing bans, may be required to halt rapid and ongoing population declines of these and other fishery-associated species, while avoiding some of the unintended outcomes of fisheries management approaches.
Static Pelagic Marine Protected Areas and Displacement of the Locally Based Fleet
A localized reduction in fishing pressure and the protection of important habitat has been shown to benefit populations interacting with fisheries, particularly those of threatened species (Jaiteh et al., 2016; Ban et al., 2017). VLMPAs are increasingly popular with NGOs and governments as a conservation tool for ecological issues that resist conventional fisheries management interventions. Yet VLMPAs are rarely designed for highly mobile marine fauna (O’Leary et al., 2018). The purported benefits of their large size, an important factor in MPA efficacy, has been questioned for these species, given that even the largest of MPAs are unlikely to fully encompass their home ranges (Agardy et al., 2011; Kaplan et al., 2014; Curnick et al., 2020b). There has been limited research and evidence of the ecological responses to static pelagic MPAs that are fixed in space and time, like the PNMS. Two studies provide relevant empirical evidence. First, small MPAs adjacent to African penguin (Spheniscus demersus) colonies that removed purse seine fishing for pelagic forage fishes may have improved penguin foraging efficiency, chick survival and condition, and increased population growth at one of the colonies. The local abundance of prey resources may have increased within the MPAs as a result of the cessation of fishing mortality, while at a “control” penguin colony with no MPA there may have been increased fishing mortality due to displaced fishing effort from the MPAs (Sherley et al., 2018). Second, a counterfactual assessment found that the U.S. Pacific Remote Islands Marine National Monument caused a reduction in blue shark catch rates by Hawaii’s pelagic longline fishery (Gilman et al., 2020). The Monument was also found to have protected bycatch hotspots for some at-risk species (oceanic whitetip, silky and blue sharks, and olive ridley sea turtle) but cold spots for others (albatrosses, shortfin mako shark and striped marlin). Studies from other ocean basins suggest that protective benefits could accrue for species whose ranges, vulnerable life stages or critical habitats are highly concordant with the PNMS (Koldewey et al., 2010; Mee et al., 2017). For example, a tracking study of three species recorded in this study – blue marlin Makaira nigricans, sailfish Istiophorus platypterus, and silky sharks – indicated that they were effectively protected within the British Ocean Territory MPA, a sanctuary similar in size to the PNMS (Carlisle et al., 2019). Additionally, the PNMS might protect some core use areas of other frequently caught species, including parts of the foraging grounds or nesting routes of endangered green turtles Chelonia mydas and vulnerable olive ridley turtles, which were disproportionately caught by the LBF. While these studies suggest that the ban on fishing within the PNMS could result in some population-level benefits for certain species of conservation concern (Koldewey et al., 2010), they also highlight the need for robust assessments of the performance of pelagic MPAs, and to account for multispecies conflicts and other effects, such as displaced fishing effort.
Effort displacement in response to MPAs, if it occurs, affects ecological responses and can prevent MPAs from achieving objectives (Gilman et al., 2019). In Palau, the DFZ’s re-orientation and consequent departure of the LBF might have tangible beneficial effects on some of the species that were frequently caught by its vessels. For example, the catch rate models suggested that silky sharks were caught at a significantly higher rate by the LBF than the DWF, with an increasing trend since 2015 and even catch rates throughout the DFZ and PNMS. As such, any benefits that may accrue for silky sharks through the PNMS are likely linked to the departure of the LBF rather than the location of the DFZ. However, movements and aggregations of pelagic fish and oceanic megafauna tend to be associated with particular environmental conditions upon which national boundaries have little or no influence (Harrison et al., 2018; Dunn et al., 2019). While the departure of the LBF reduced fishing effort in Palau’s waters, it almost certainly did not cause a reduction in regional fishing effort, meaning that the displaced vessels are likely to have moved to neighboring EEZs (any reduction in regional fishing effort since early 2020 would likely be due to the COVID-19 pandemic). With regards to very highly migratory species whose home ranges are not wholly encompassed by the PNMS, the protective effects afforded by it may therefore be offset by the displacement of fishing effort out of Palau’s waters or other coinciding external circumstances, such as the pandemic (see also Curnick et al., 2020b). Understanding to what – if any – extent these stocks may experience intensified fishing pressure in neighboring EEZs would be an interesting future research direction.
Outlook
With several countries struggling to meet the 10% protected national marine area requirement of Aichi Target 11, more large and very large MPAs are likely to be established in the coming decade (Failler et al., 2019). However, their anticipated benefits can raise unrealistic local expectations, divert attention and resources away from other means of addressing marine conservation targets, and demand substantial socioeconomic costs (Klein et al., 2008; Jones and De Santo, 2016; Christie et al., 2017). Mitigating these challenges warrants thorough assessments of LMPAs’ effectiveness in delivering both conservation and socioeconomic outcomes. Ultimately, the benefits of protection potentially afforded to highly migratory species through the PNMS are inextricably linked to the sanctuary’s future, which will be shaped in large part by the efficacy of its management and enforcement, sustainable financing, and local support for the sanctuary.
Unlike its neighboring Pacific Island economies, whose tuna fisheries constitute a primary source of revenue, Palau’s economy relied heavily on (eco)tourism prior to the COVID-19 pandemic (Wabnitz et al., 2018). This was clearly reflected in ex-President Remengesau’s introduction of the PNMS Act, which stated that “our future is in tourism, not tuna.” The PNMS was intended to boost tourism, and a pre-implementation survey found that although most visitors were not aware of the PNMS, 43% of those who knew about it cited it as an important factor in their decision to visit Palau (Oleson et al., 2019). As it turned out, the pandemic had a devastating effect on Palau’s tourism industry, potentially eroding the tourism-forward basis on which the PNMS was declared (EconMAP, 2020). It remains to be seen whether and how this unexpected development will affect continued political support for the PNMS.
Prior to 2020, one of the benefits to Palau from longline fishing in its waters was the supply of fresh tuna for the local market, an important contribution to local food security. Of note, in 2016 Palau was identified as one of four Pacific Island Countries in which landings from locally based tuna fisheries contributed the most to food security (Tolvanen et al., 2019). Following the implementation of the PNMS, an acute lack of locally available tuna and increased consumption of reef fish quickly became a point of contention, leading to claims that the sanctuary had “backfired” (Carreon, 2020). Disappointed residents expressed an unmet expectation of the PNMS resulting in higher, not lower, availability of pelagic fish. Indeed, one of the premises of the PNMS was that the transition from a foreign-dominated tuna fishery to a predominantly domestic one would reserve pelagic resources for Palauans. While a joint assessment by FFA and SPC deemed a domestic longline fishery unviable (Skirtun and Hare, 2017), a subsequent rapid assessment of Palau’s tuna fishery development options identified a locally operated pole-and-line fishery as a promising alternative (IPNLF, 2019). A strategic plan for a nationwide network of anchored fish aggregating devices (FADs) within Palau’s 12 nm territorial waters was developed in 2018–2019 and previously deployed FADs received maintenance in a bid to encourage pelagic fishing on local vessels. A Presidential Directive issued on World Tuna Day 2018 was meant to encourage Palauans to “Choose Pelagics” over reef fish, providing a further incentive for pelagic fishers. However, the beginning of 2020 saw the implementation of the sanctuary without a domestic pelagic fishery having been established. Spurred by the shortage of fresh tuna following the implementation of the PNMS, efforts to develop a domestic pelagic fishery have since been revived: one of the three locally owned longline vessels recommenced fishing in early 2021, supplying the newly formed fishers’ association Belau Offshore Fishers, Incorporated (BOFI) with fish from the DFZ. Plans for a locally owned pole and line vessel, in discussion since 2019, are also expected to come to fruition in 2021. One advantage of focusing on local, relatively small-scale fisheries for pelagics is that bycatch events are likely to occur at much lower scales compared to industrial fishing operations. However, the likelihood of bycatch events is not negated, and well-managed local fisheries will need to be reliably documented, such as the 100% observer coverage called for in the PNMS Act and regulations.
Conclusion
A primary, although not grounded, expectation of the PNMS is the recovery of fish stocks and other oceanic megafauna that, prior to 2020, interacted with longline vessels throughout Palau’s EEZ. We found that in the decade preceding the sanctuary’s implementation, almost half of the longline catch constituted bycatch species (species other than the primary target tunas), and most of those were discarded, possibly resulting in high mortality levels. Annual catches of species of conservation concern, including an estimated 50,000 sharks provide a sobering perspective on sustainability in the world’s first shark sanctuary, but also highlight the potential for population segments of these species to benefit from localized spatial protection through the PNMS, particularly if core use areas or key life history stages are demonstrably protected. While several studies have identified the design of a sanctuary as a key factor in its effectiveness, we could not clearly discern the effects of sanctuary location – and, by extension, the placement of the DFZ – from fleet effects, particularly differences in fishing strategies, on catch rates and composition. Our results identified the DFZ as an area of overall lower catch rates, while the fishing strategies of the fleet that continues to fish there seem to result in higher target:bycatch ratios and lower bycatch mortality levels compared to the LBF. Thus, the re-orientation of the DFZ in 2019 and the resulting changes in fleet presence may hold greater promise of potential conservation benefits than the original placement of the DFZ. The understanding that fishery interactions with species are influenced both by where and how vessels fish can be leveraged in the design and management of fishing zones contained within, or adjoining, LMPAs. As observer coverage on a reduced longline fleet in Palau’s DFZ becomes more robust and representative, future studies might consider the effects of changes in the concentration of fishing effort within Palau’s waters as well as neighboring EEZs as an effect of the PNMS. Coupled with an exploration of fishery-associated species’ movements in Palau’s waters and adjoining areas, such analyses could help to better discern the potential protective effects of the sanctuary on far-ranging species. Our results, as well as early local responses to some unexpected growing pains of the PNMS, illustrate that LMPA placement and implementation ought to be considered carefully to maximize potential benefits and manage local expectations.
Data Availability Statement
The data analyzed in this study is subject to the following licenses/restrictions. The data used in this study are classified country data, which precludes their provision in a publicly accessible repository. Requests to access these datasets should be directed to the corresponding author. Aggregate catch and effort data for the WCPFC area are available from https://www.wcpfc.int/public-domain, and publicly available bycatch data can be downloaded from https://www.wcpfc.int/public-domain-bycatch.
Author Contributions
VJ designed the study, obtained funding, analyzed the data, and wrote the manuscript. TP advised on data analysis, analyzed the data, and wrote the manuscript. SL analyzed the data and edited the manuscript. EG and SN advised on study design and edited the manuscript, and SN also provided logistical support. All authors approved of the version to be published and agreed to be accountable for all aspects of the work.
Funding
This study was funded through an Early Postdoc.Mobility grant to VJ (project P2SKP3_184044) by the Swiss National Science Foundation. TP was supported by the European Union’s Pacific-European Union Marine Partnership Programme.
Conflict of Interest
The authors declare that the research was conducted in the absence of any commercial or financial relationships that could be construed as a potential conflict of interest.
Publisher’s Note
All claims expressed in this article are solely those of the authors and do not necessarily represent those of their affiliated organizations, or those of the publisher, the editors and the reviewers. Any product that may be evaluated in this article, or claim that may be made by its manufacturer, is not guaranteed or endorsed by the publisher.
Acknowledgments
We thank F. U. Sengebau, former Minister of Natural Resources, Environment and Tourism in Palau, for permission to access Palau’s longline fishery data, and J. Hampton for facilitating VJ’s attachment to SPC. Sincere appreciation to P. Williams for the provision of data extracts and troubleshooting data queries. Special thanks also go to U. K. Sisior, Y. Ueda, E. Sengebau, and A. McQuiston Temol for helpful discussions about Palau’s longline fishery, EM trial and the PNMS. We are grateful to M. Zweifel and P. de Senarclens for help in producing Figure 1, and to C. Wabnitz for constructive comments on the manuscript. Sincere thanks to our three reviewers for their time and helpful suggestions.
Supplementary Material
The Supplementary Material for this article can be found online at: https://www.frontiersin.org/articles/10.3389/fmars.2021.720603/full#supplementary-material
References
Agardy, T., di Sciara, G. N., and Christie, P. (2011). Mind the gap: addressing the shortcomings of marine protected areas through large scale marine spatial planning. Mar. Policy 35, 226–232. doi: 10.1016/j.marpol.2010.10.006
Ban, N. C., Davies, T. E., Aguilera, S. E., Brooks, C., Cox, M., Epstein, G., et al. (2017). Social and ecological effectiveness of large marine protected areas. Glob. Environ. Change 43, 82–91. doi: 10.1016/j.gloenvcha.2017.01.003
Bigelow, K., Musyl, M. K., Poisson, F., and Kleiber, P. (2006). Pelagic longline gear depth and shoaling. Fish. Res. 77, 173–183. doi: 10.1016/j.fishres.2005.10.010
Boerder, K., Schiller, L., and Worm, B. (2019). Not all who wander are lost: improving spatial protection for large pelagic fishes. Mar. Policy 105, 80–90. doi: 10.1016/j.marpol.2019.04.013
Braccini, M. J., and Waltrick, D. (2019). Species-specific at-vessel mortality of sharks and rays captured by demersal longlines. Mar. Policy 99, 94–98. doi: 10.1016/j.marpol.2018.10.033
Carlisle, A. B., Tickler, D., Dale, J. J., Ferretti, F., Curnick, D. J., Chapple, T. K., et al. (2019). Estimating space use of mobile fishes in a large marine protected area with methodological considerations in acoustic array design. Front. Mar. Sci. 6:256. doi: 10.3389/fmars.2019.00256
Carreon, B. (2020). Palau’s Marine Sanctuary Backfires, Leading to Increased Consumption of Reef Fish. The Guardian, 27th February.
Christie, P., Bennett, N. J., Gray, N. J., Aulani Wilhelm, T., Lewis, N., Parks, J., et al. (2017). Why people matter in ocean governance: incorporating human dimensions into large-scale marine protected areas. Mar. Policy 84, 273–284. doi: 10.1016/j.marpol.2017.08.002
Clarke, S., Sato, M., Small, C., Sullivan, B., Inoue, Y., and Ochi, D. (2015). Bycatch in Longline Fisheries for Tuna and Tuna-Like Species; A Global Review of Status and Mitigation Measures. Report No. 588. Rome: FAO.
Cortés, E., Arocha, F., Beerkircher, L., Carvalho, F., Domingo, A., Heupel, M., et al. (2010). Ecological risk assessment of pelagic sharks caught in Atlantic pelagic longline fisheries. Aquat. Living Resour. 23, 25–34. doi: 10.1051/alr/2009044
Curnick, D. J., Andrzejaczek, S., Jacoby, D. M. P., Coffey, D. M., Carlisle, A. B., Chapple, T. K., et al. (2020a). Behavior and ecology of silky sharks around the chagos archipelago and evidence of Indian Ocean wide movement. Front. Mar. Sci. 7:596619. doi: 10.3389/fmars.2020.596619
Curnick, D. J., Collen, B., Koldewey, H. J., Jones, K. E., Kemp, K. M., and Ferretti, F. (2020b). Interactions between a large marine protected area, Pelagic Tuna and associated fisheries. Front. Mar. Sci. 7:318. doi: 10.3389/fmars.2020.00318
Davidson, L. N. K., Krawchuk, M. A., and Dulvy, N. K. (2015). Why have global shark and ray landings declined: improved management or overfishing? Fish Fish. 17, 438–458. doi: 10.1111/faf.12119
Dunn, D. C., Harrison, A. L., Curtice, C., DeLand, S., Donnelly, B., Fujioka, E., et al. (2019). The importance of migratory connectivity for global ocean policy. Proc. R. Soc. B Biol. Sci. 286:20191472. doi: 10.1098/rspb.2019.1472
EconMAP (2020). Where do we go from here? Updating the Economic Impact of COVID-19 and Strategies for Mitigation in the Republic of Palau. EconMAP Technical Note. Honolulu: Graduate School USA Pacific and Virgin Islands Training Initiative (PITI-VITI).
Failler, P., Touron-Gardic, G., and Traore, M. S. (2019). Is Aichi target 11 progress correctly measured for developing countries? Trends Ecol. Evol. 34, 875–879. doi: 10.1016/j.tree.2019.07.007
Fu, D., Roux, M.-J., Clarke, S., Francis, M., Dunn, A., and Hoyle, S. (2017). Pacific-Wide Sustainability Risk Assessment of Bigeye Thresher Shark (Alopias superciliosus). Technical Report No. WCPFC-SC13-2017/SA-WP-11. Kolonia: WCPFC, 63.
Game, E. T., Grantham, H. S., Hobday, A. J., Pressey, R. L., Lombard, A. T., Beckley, L. E., et al. (2009). Pelagic protected areas: the missing dimension in ocean conservation. Trends Ecol. Evol. 24, 360–369. doi: 10.1016/j.tree.2009.01.011
Gillett, R., and Tauati, M. I. (2018). Fisheries in the Pacific: Regional and National Information. Apia: FAO.
Gilman, E., Chaloupka, M., Fitchett, M., Cantrell, D. L., and Merrifield, M. (2020). Ecological responses to blue water MPAs. PLoS One 15:e0235129. doi: 10.1371/journal.pone.0235129
Gilman, E., Chaloupka, M., Merrifield, M., Malsol, N. D., and Cook, C. (2015). Standardized catch and survival rates, and effect of a ban on shark retention, Palau pelagic longline fishery: catch and survival in Palau Longline Fishery. Aquat. Conserv. Mar. Freshw. Ecosyst. 26, 1031–1062. doi: 10.1002/aqc.2599
Gilman, E., Chaloupka, M., and Musyl, M. (2018). Effects of pelagic longline hook size on species- and size-selectivity and survival. Rev. Fish Biol. Fish. 28, 417–433. doi: 10.1007/s11160-017-9509-7
Gilman, E., Chaloupka, M., and Sieben, C. (2021). Ecological risks of a data-limited fishery using an ensemble of approaches. Mar. Policy 133:104752. doi: 10.1016/j.marpol.2021.104752
Gilman, E., Kaiser, M. J., and Chaloupka, M. (2019). Do static and dynamic marine protected areas that restrict pelagic fishing achieve ecological objectives? Ecosphere 10:e02968. doi: 10.1002/ecs2.2968
Gilman, E., Passfield, K., and Nakamura, K. (2014). Performance of regional fisheries management organizations: ecosystem-based governance of bycatch and discards. Fish Fish. 15, 327–351. doi: 10.1111/faf.12021
Gilman, E., Suuronen, P., and Chaloupka, M. (2017). Discards in global tuna fisheries. Mar. Ecol. Prog. Ser. 582, 231–252. doi: 10.3354/meps12340
Gilman, E. L., and Lundin, C. G. (2010). “Minimizing bycatch of sensitive species groups in marine capture fisheries: lessons from tuna fisheries,” in Handbook of Marine Fisheries Conservation and Management, eds Q. Grafton, R. Hilborn, D. Squires, M. Tait, and M. Williams (Oxford: Oxford University Press), 150–164.
Gray, C. A., and Kennelly, S. J. (2018). Bycatches of endangered, threatened and protected species in marine fisheries. Rev. Fish Biol. Fish. 28, 521–541. doi: 10.1007/s11160-018-9520-7
Hall, M., Gilman, E., Minami, H., Mituhasi, T., and Carruthers, E. (2017). Mitigating bycatch in tuna fisheries. Rev. Fish Biol. Fish. 27, 881–908. doi: 10.1007/s11160-017-9478-x
Hare, S., Williams, P., Ducharme-Barth, N., Hamer, P., Hampton, W., Scott, R., et al. (2020). The Western and Central Pacific Tuna Fishery: 2019 Overview and Status of Stocks. Tuna Fisheries Assessment Report No. 20. Noumea: Pacific Community.
Harley, S., and Rice, J. (2012). A Progress Report on the Shark Research Plan. Technical report No, WCPFC-SC8-2012/EB-WP-03 Rev 1. Kolonia: WCPFC.
Harrison, A.-L., Costa, D. P., Winship, A. J., Benson, S. R., Bograd, S. J., Antolos, M., et al. (2018). The political biogeography of migratory marine predators. Nat. Ecol. Evol. 2, 1571–1578. doi: 10.1038/s41559-018-0646-8
Huang, H. W., Swimmer, Y., Bigelow, K., Gutierrez, A., and Foster, D. G. (2016). Influence of hook type on catch of commercial and bycatch species in an Atlantic tuna fishery. Mar. Policy 65, 68–75. doi: 10.1016/j.marpol.2015.12.016
IPNLF (2019). Rapid Assessment of Palau’s Tuna Fishery Development Options. London: International Pole and Line Foundation.
Jaiteh, V. F., Lindfield, S. J., Mangubhai, S., Warren, C., Fitzpatrick, B., and Loneragan, N. R. (2016). Higher abundance of marine predators and changes in fishers’ behavior following spatial protection within the world’s biggest shark fishery. Front. Mar. Sci. 3:43. doi: 10.3389/fmars.2016.00043
Jones, P. J. S., and De Santo, E. M. (2016). Viewpoint – is the race for remote, very large marine protected areas (VLMPAs) taking us down the wrong track? Mar. Policy 73, 231–234. doi: 10.1016/j.marpol.2016.08.015
Juan-Jordá, M. J., Murua, H., Arrizabalaga, H., Dulvy, N. K., and Restrepo, V. (2018). Report card on ecosystem-based fisheries management in tuna regional fisheries management organizations. Fish Fish. 19, 321–339. doi: 10.1111/faf.12256
Kaplan, D. M., Chassot, E., Amandé, J. M., Dueri, S., Demarcq, H., Dagorn, L., et al. (2014). Spatial management of Indian Ocean tropical tuna fisheries: potential and perspectives. ICES J. Mar. Sci. 71, 1728–1749. doi: 10.1093/icesjms/fst233
Klein, C. J., Chan, A., Kircher, L., Cundiff, A. J., Gardner, N., Hrovat, Y., et al. (2008). Striking a balance between biodiversity conservation and socioeconomic viability in the design of marine protected areas. Conserv. Biol. 22, 691–700. doi: 10.1111/j.1523-1739.2008.00896.x
Koldewey, H. J., Curnick, D., Harding, S., Harrison, L. R., and Gollock, M. (2010). Potential benefits to fisheries and biodiversity of the Chagos Archipelago/British Indian Ocean Territory as a no-take marine reserve. Mar. Pollut. Bull. 60, 1906–1915. doi: 10.1016/j.marpolbul.2010.10.002
Leenhardt, P., Cazalet, B., Salvat, B., Claudet, J., and Feral, F. (2013). The rise of large-scale marine protected areas: conservation or geopolitics? Ocean Coast. Management. Manage. 85, 112–118. doi: 10.1016/j.ocecoaman.2013.08.013
Marine Conservation Institute (2020). Marine Protection Atlas. Available online at: https://mpatlas.org/ (accessed June 3, 2021).
Mee, J. A., Otto, S. P., and Pauly, D. (2017). Evolution of movement rate increases the effectiveness of marine reserves for the conservation of pelagic fishes. Evol. Appl. 10, 444–461. doi: 10.1111/eva.12460
Mollet, H. F. (2002). Distribution of the pelagic stingray, Dasyatis violacea (Bonaparte, 1832), off California, Central America, and worldwide. Mar. Freshw. Res. 53, 525–530. doi: 10.1071/MF02010
Musyl, M. K., and Gilman, E. L. (2018). Post-release fishing mortality of blue (Prionace glauca) and silky shark (Carcharhinus falciformes) from a Palauan-based commercial longline fishery. Rev. Fish Biol. Fish. 28, 567–586. doi: 10.1007/s11160-018-9517-2
O’Leary, B. C., Ban, N. C., Fernandez, M., Friedlander, A. M., García-Borboroglu, P., Golbuu, Y., et al. (2018). Addressing criticisms of large-scale marine protected areas. BioScience 68, 359–370. doi: 10.1093/biosci/biy021
Oleson, K., Dacks, R., Lewis, S., Ferrini, S., Fezzi, C., and James, P. (2019). Palau National Marine Sanctuary – Socioeconomic Baseline Project. PICRC Technical Report No. 19-07. Koror: PICRC, 39.
Pacoureau, N., Rigby, C. L., Kyne, P. M., Sherley, R. B., Winker, H., Carlson, J. K., et al. (2021). Half a century of global decline in oceanic sharks and rays. Nature 589, 567–571. doi: 10.1038/s41586-020-03173-9
Peatman, T., Bell, L., Allain, V., Caillot, S., Williams, P., Tuiloma, I., et al. (2018). “Summary of longline fishery bycatch at a regional scale, 2003-2017,” in Proceedings of the 14th Regular Session of the Western and Central Pacific Fisheries Commission Scientific Committee, Busan, 1–60.
Peatman, T., and Nicol, S. (2020). Updated Longline Bycatch Estimates in the WCPO. Technical Report No. WCPFC-SC16-2020/ST-IP-11. Kolonia: WCPFC.
Poisson, F., Catteau, S., Chiera, C., and Groul, J.-M. (2019). The effect of hook type and trailing gear on hook shedding and fate of pelagic stingray (Pteroplatytrygon violacea): new insights to develop effective mitigation approaches. Mar. Policy 107:103594. doi: 10.1016/j.marpol.2019.103594
Rice, J. (2018). Report for Project 78: Analysis of Observer and Logbook Data Pertaining to Key Shark Species in the Western and Central Pacific Ocean. Technical Report No, WCPFC-SC14-2018/EB-WP-02. Kolonia: WCPFC.
Rice, J., and Harley, S. (2012). Stock Assessment of Oceanic Whitetip Sharks in the Western and Central Pacific Ocean. Technical Report No. WCPFC-SC8-2012/SA-WP-06 Rev 1. Kolonia: WCPFC.
Rice, J. S., Tremblay-Boyer, L., Scott, R., Hare, S., and Tidd, A. (2015). Analysis of Stock Status and Related Indicators for Key Shark Species of the Western Central Pacific Fisheries Commission. Technical Report No. WCPFC-SC11-2015/EB-WP-04-Rev 1. Kolonia: WCPFC.
Rppl 6-36 (2003). Title 27 Palau National Code, Republic of Palau Public Law. Available online at: https://palaulegal.org/rppls-2/rppls-6th-oek/6-30-to-6-39/rppl-no-6-36/ (accessed June 3, 2021).
Rppl 9-49 (2015). Title 27 Palau National Code, Republic of Palau Public Law. Available online at: https://palaulegal.org/palau-national-code/titles-20-29/title-27-fishing/ (accessed June 3, 2021).
Sherley, R. B., Barham, B. J., Barham, P. J., Campbell, K. J., Crawford, R. J. M., Grigg, J., et al. (2018). Bayesian inference reveals positive but subtle effects of experimental fishery closures on marine predator demographics. Proc. R. Soc. B Biol. Sci. 285:20172443. doi: 10.1098/rspb.2017.2443
Skirtun, M., and Hare, S. (2017). Review of the Biological and Economic Impacts of the Proposed Marine Sanctuary in Palau.
Soykan, C., Moore, J., Zydelis, R., Crowder, L., Safina, C., and Lewison, R. (2008). Why study bycatch? An introduction to the theme section on fisheries bycatch. Endanger. Species Res. 5, 91–102. doi: 10.3354/esr00175
Tolvanen, S., Thomas, K., Lewis, T., and McCoy, M. (2019). FFA Study: Assessing the Contribution of Landings From Locally Based Commercial Tuna Fishing Vessels to Food Security. Honiara: Forum Fisheries Agency.
Vianna, G. M. S., Meekan, M. G., Pannell, D. J., Marsh, S. P., and Meeuwig, J. J. (2012). Socio-economic value and community benefits from shark-diving tourism in Palau: a sustainable use of reef shark populations. Biol. Conserv. 145, 267–277. doi: 10.1016/j.biocon.2011.11.022
Vianna, G. M. S., Meekan, M. G., Ruppert, J. L. W., Bornovski, T. H., and Meeuwig, J. J. (2016). Indicators of fishing mortality on reef-shark populations in the world’s first shark sanctuary: the need for surveillance and enforcement. Coral Reefs 35, 973–977. doi: 10.1007/s00338-016-1437-9
Wabnitz, C. C. C., Cisneros-Montemayor, A. M., Hanich, Q., and Ota, Y. (2018). Ecotourism, climate change and reef fish consumption in Palau: benefits, trade-offs and adaptation strategies. Mar. Policy 88, 323–332. doi: 10.1016/j.marpol.2017.07.022
Ward-Paige, C. A. (2017). A global overview of shark sanctuary regulations and their impact on shark fisheries. Mar. Policy 82, 87–97. doi: 10.1016/j.marpol.2017.05.004
Ward-Paige, C. A., and Worm, B. (2017). Global evaluation of shark sanctuaries. Glob. Environ. Change 47, 174–189. doi: 10.1016/j.gloenvcha.2017.09.005
Watson, J. T., and Bigelow, K. A. (2014). Trade-offs among catch, bycatch, and landed value in the american samoa longline fishery. Conserv. Biol. 28, 1012–1022. doi: 10.1111/cobi.12268
WCPFC (2010). Conservation and Management Measure for Sharks. Report No. CMM 2010-07. Kolonia: WCPFC.
WCPFC (2013). Conservation and Management Measure for Silky Sharks. Report No. CMM 2013-08. Kolonia: WCPFC.
WCPFC (2017). Annual Report to the Commission, Part I: Information on Fisheries, Research and Statistics. Republic of Palau – 2016. Technical Report No. WCPFC-SC13-AR/CCM-18. Kolonia: WCPFC.
WCPFC (2018). Conservation and Management Measure for the Regional Observer Programme. Report No. CMM 2018-05. Kolonia: WCPFC.
WCPFC (2019a). Conservation and Management Measure for Sharks. Report No. CMM 2019-04. Kolonia: WCPFC.
WCPFC (2019b). Conservation and Management Measure on Mobulid Rays Caught in Association With Fisheries in the WCPFC Convention Area. Report No. CMM 2019-05. Kolonia: WCPFC.
Williams, P., and Ruaia, T. (2020). Overview of Tuna Fisheries in the Western and Central Pacific Ocean, Including Economic Conditions – 2019. Technical Report No. WCPFC-SC16-2020/GN IP-1 rev 3. Kolonia: WCPFC.
Keywords: large scale marine protected area, CPUE, protected species, WCPO, elasmobranchs, marine turtles, access agreement, VLMPA
Citation: Jaiteh V, Peatman T, Lindfield S, Gilman E and Nicol S (2021) Bycatch Estimates From a Pacific Tuna Longline Fishery Provide a Baseline for Understanding the Long-Term Benefits of a Large, Blue Water Marine Sanctuary. Front. Mar. Sci. 8:720603. doi: 10.3389/fmars.2021.720603
Received: 04 June 2021; Accepted: 17 September 2021;
Published: 08 October 2021.
Edited by:
Ana M. M. Sequeira, University of Western Australia, AustraliaReviewed by:
Samantha Andrzejaczek, Stanford University, United StatesAppukuttannair Biju Kumar, University of Kerala, India
Humberto Gomes Hazin, Federal Rural University of the Semi-arid Region, Brazil
Copyright © 2021 Jaiteh, Peatman, Lindfield, Gilman and Nicol. This is an open-access article distributed under the terms of the Creative Commons Attribution License (CC BY). The use, distribution or reproduction in other forums is permitted, provided the original author(s) and the copyright owner(s) are credited and that the original publication in this journal is cited, in accordance with accepted academic practice. No use, distribution or reproduction is permitted which does not comply with these terms.
*Correspondence: Vanessa Jaiteh, vanessa.jaiteh@outlook.com