 Yundong Li
 Falin Zhou
- Key Laboratory of South China Sea Fishery Resources Exploitation and Utilization, Ministry of Agriculture and Rural Affairs, South China Sea Fisheries Research Institute, Chinese Academy of Fishery Science, Guangzhou, China
Introduction
The black tiger shrimp (Penaeus monodon) has high economic and nutritional value, and is the second widely cultured penaeid shrimp species worldwide (FAO, 2018). Extensive researches and development programs of the black tiger shrimp have focused on understanding its various biological processes, improving farming practices, and advancing selective breeding programs to achieve the sustainable shrimp farming industry. Through the genetic breeding research conducted by our team on P. monodon in China, we have cultivated two new varieties of P. monodon, “Nanhai No. 1” and “Nanhai No. 2,” which have solved problems related to their growth and survival rates. However, despite breakthroughs in shrimp breeding, salinity remains an impeding factor for the development of shrimp aquaculture.
Salinity is an important environmental factor related to the physiological function, growth, and survival of shrimp (Li et al., 2017). P. monodon is primarily cultured in coastal areas with estuarine and oceanic water, while the production of euryhaline shrimp has expanded to inland recently, where have the advantage of the economic development and clean environment with sufficient groundwater supply (Roy et al., 2010). P. monodon is to be a promising aquaculture species for low salinity farming in inland worldwide. However, long-term low salinity cultivation is associated with multiple problems, including slow growth and increased susceptibility to pathogens. These problems restrict the large-scale promotion of P. monodon cultures in low salinity areas.
Previous studies on the responses of shrimp to salinity stress have primarily been concentrated on several important genes (Shekhar et al., 2013; Zhao et al., 2015; Xu et al., 2016), but the molecular mechanisms underlying the responses of shrimp to salinity stress, in relation to other salinity-regulated genes, remains unclear. Recently, a transcriptome regulation mechanism of the rapid and reversible post-transcription, via the action of non-coding RNA molecules, has been reported to be involved in environmental stress survival responses (Ebert and Sharp, 2012; Biggar and Storey, 2015). Various studies have shown that miRNAs were involved in many biochemical and physiological processes and played important roles in stress responses in aquatic organisms (Burgos-Aceves et al., 2018; Wang et al., 2018, 2020). However, to the best of our knowledge, few studies focused on stress-responsive miRNAs in P. monodon.
Transcriptomic profiling using next-generation sequencing technologies addresses this gap by providing a new approach to study stress response mechanisms in shrimp. For example, the transcriptome analysis of three different salinities cultivation conditions for Litopenaeus vannamei revealed numerous potential genes related to the responses of osmose (Zhang et al., 2016). In a transcriptome analysis of L. vannamei under chronic low-salinity stress, 855 genes showed significant expression changes, and these were enriched in lipid metabolism, the phosphonate and phosphinate metabolism pathways, and steroid hormone biosynthesis (Chen et al., 2015). Transcriptomic profiling has also elucidated potentially novel miRNAs or stress-related miRNAs. There were 4,524 known miRNAs and 73 novel miRNAs reported to be significantly differentially expressed after copper exposure by small RNA sequencing analysis in shrimp under copper stress (Guo et al., 2018). A miRNA analysis of the hepatopancreas of L. vannamei using high-throughput sequencing, examined the potential regulatory mechanisms of cold adaptation and revealed 68 known mature miRNAs, 47 novel miRNAs, and 34 miRNAs that were related to cold adaptation (He et al., 2018). Overall, these transcriptomic and miRNA analyses of stress responses in shrimp allow us to understand their molecular mechanisms and identify novel genes or miRNAs related to environmental stress.
Here, we performed RNA sequencing analysis and detected differential expression genes and miRNAs in the gills of P. monodon at different groups with high, medium, and low salinity culture conditions, respectively. The quality control of sequencing data was conducted to present a high-quality dataset. We also performed an integrative comparative analysis of mRNA and miRNA at three salinities, to screen for key genes and miRNAs associated with salinity stress. These transcriptomic and miRNA data could provide a valuable resource for further shrimp studies on screening genes related to salinity stress responses and understanding the molecular mechanism of salinity stress.
Methods
Ethics Statement
The study was approved by the Animal Care and Use Committee of South China Sea Fisheries Research Institute, Chinese Academy of Fishery Sciences (No. SCSFRI96-253). Sampling and all experiments strictly complied with the guidelines and regulations established by the committee.
Shrimp Rearing and Stress Treatment
In the present study, healthy black tiger shrimp with 7.25 ± 0.26 g weights were collected from the experimental base of the South China Sea Fisheries Research Institute (SCSFRI, Shenzhen, China). All shrimp were cultured in laboratory tanks for 1 week and fed by shrimp diet for four times a day. The laboratory tanks were filled with filtered seawater (pH, 7.8–8.2; temperature, 27–29°C; salinity, 18 psu) and aerated constantly. To maintain water quality, we changed about 1/3 of the tanks' water daily. Then, all individuals were randomly divided into three groups which would be cultivated in three different environments for 30 days: high salinity [HC, 30 psu (practical salinity units)], medium salinity (MC, 18 psu), and low salinity (LC, 3 psu). Before the start of the experiment, the salinity of tanks' water was changed gradually (3 psu per day) to make the shrimp acclimate the 3 psu and 30 psu. A total of three thanks (500 L per tank) with 40 shrimp per tank for each group, and the gill tissues of the shrimp were collected from each tank and stored in liquid nitrogen at −80°C immediately until further RNA extraction. A total of nine samples (HC1, HC2, HC3; MC1, MC2, MC3; and LC1, LC2, LC3) were used for the subsequent transcriptome and small RNA sequencing (Tables 1, 2). The experimental design and analysis pipeline was shown in Supplementary Figure 1.
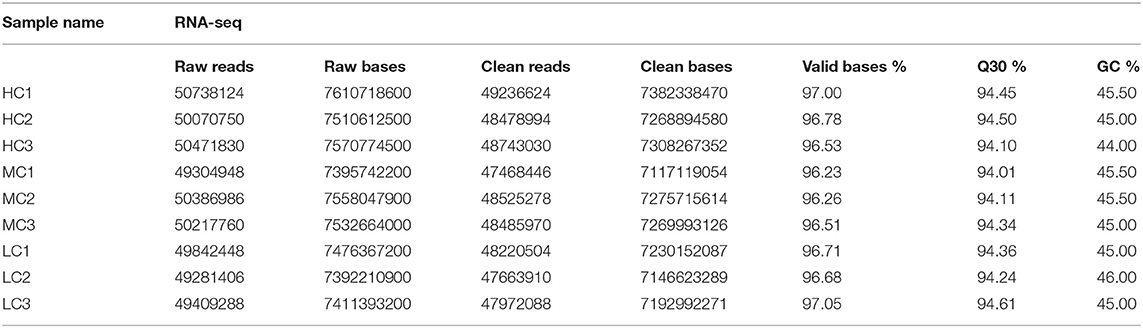
Table 1. The statistics summary for the RNA-seq data of the nine samples.
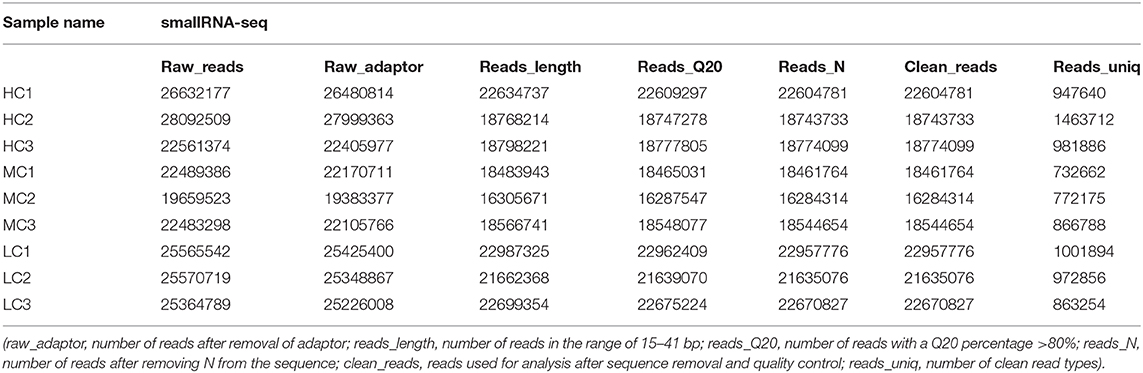
Table 2. The statistics summary for the smallRNA-seq data of the nine samples.
RNA Extraction, Library Construction, and Sequencing
The TRIzol reagent (Invitrogen, Shanghai, China) was used to perform the total RNA extraction, according to the manufacturer's instructions. The 0.8% agarose gel electrophoresis and NanoDrop (Thermo Fisher Scientific, Waltham, MA, USA) were used to assess the RNA integrity and concentration, repetitively. There were three biological replicates for each group, and the construction of mRNA and small RNA were performed for all samples by Shanghai OE Biotech (Shanghai, China). Based on the protocol, the TruSeq Stranded mRNA LT Sample Prep Kit (Illumina) and TruSeq Small RNA Library Prep Kit (Illumina) was used to construct mRNA and small RNA libraries, respectively. To construct the Small RNA sequencing libraries, the 3′ end of the miRNA was specifically ligated with 3′ SR Adaptor. The excess 3′ SR Adaptor was hybridized with SR RT Primer, and the M-MuLV Reverse Transcriptase (Shanghai Sangon Biotech, China) was used to synthesis the first strand cDNA. It was used for PCR amplification with index (X) primer, SR Primer (Illumina) and LongAmp Taq 2× Master Mix. The DNA fragments within 140–150 bp of these amplification products were recovered by denaturing 12% polyacrylamide gel electrophoresis. To ensure the corresponding relationship between the mRNA and miRNA, we simultaneously constructed the transcriptome and mRNA libraries for each sample. All libraries were sequenced using Illumina HiseqTM 2500 instruments (Illumina).
Quality Validation, Data Cleaning, and Normalization
The quality of the raw sequencing data was validated by FastQC software (Andrews, 2010) (Table 1). Next, we used the paired-end splicing method in the Trinity (Grabherr et al., 2011) software to obtain the transcript sequence and designated the longest sequence as the unigene according to the sequence similarity and length. We then used the TGICL (Pertea et al., 2003) software to cluster and extend redundantly, to obtain a set of final unigenes, that served as the reference sequence for the subsequent analysis (Supplementary Figures 2C,D). For the small RNA sequencing data, the primer and adapter sequences were removed from the original data, and a sequenced fragment with reliable quality was selected after quality inspection and length screening of the bases. The adapter sequence was removed using cutadapt (version 1.14) software (Marcel, 2011), and the sequence with a length of 15–41 bp was retained. Reads containing N bases were filtered out using the NGSQCToolkit (version 2.3.3) software (Patel and Jain, 2012). The clean reads with high quality were finally obtained for the subsequent analysis (Table 2, Supplementary Figure 3A). The statistics summary of the sequencing data is presented in Table 2. The FPKM was calculated to assess the expression levels of the unigenes, and the miRNA expression was normalized to transcripts per million.
Downstream Analysis
The differential expression analysis was conducted by the DESeq2 package (Anders and Huber, 2010), and the genes (or miRNA) with fold changes (FC) ≥ 2 (|log2 ratio| ≥ 1) and adjusted p < 0.05 were considered as differentially expressed genes (DEGs) or differentially expressed miRNAs (DEMs). Bowtie software was used to perform a mismatch-free alignment with the mature sequences of the miRNAs in miRBase (version 21.0) (Griffiths-Jones et al., 2006), and the sequences on the alignment were considered to be known miRNAs (Supplementary Figure 3B). Novel miRNAs with a sequence length of at least 18 bp were identified using Mirdeep2 software and were mapped onto the reference genome (Friedlaender et al., 2012). The secondary structure of the novel miRNAs was predicted by RNAfold software (Denman, 1993), and the target genes of the identified miRNAs were performed by MiRanda with the parameters S ≥ 150 and Δ G ≤-30 kcal/mol (John et al., 2004). The analysis workflow was shown in Supplementary Figure 1.
Analysis of Quantitative Real-Time Polymerase Chain Reaction (qRT-PCR)
Twelve DEGs and six DEMs were randomly selected from the HC and LC groups, and the qRT-PCR was performed using the extracted total RNA to validate the selected DEGs and DEMs. The LightCycler® 480 II Real-time PCR Instrument (Roche, Basel, Switzerland) was used for the qRT-PCR reactions. The miRNA expression level was determined by a 10-μL PCR mixture which was mixed of 1 μL of cDNA, 0.2 μL of miRNA-specific primer, 0.2 μL of universal primer (Qiagen), 5 μL of 2× QuantiFast® SYBR® Green PCR Master Mix (Qiagen, Hilden, Germany), and 3.6 μL of nuclease-free water. The mixture was incubated in a 384-well optical plate (Roche) at 95°C for 5 min, and then performed 95°C for 10 s with 40 cycles, followed by at 60°C for 30 s. For mRNA expression, the PCR mixtures, including 2 mL of real-time PCR-ready cDNA, 0.5 mL of specific primer (10 mM), 6.3 mL of SYBR Premix Ex Taq (2×), and 2.7 mL of ddH2O, for a total volume of 12 mL, were performed 30 s denaturation at 95°C, followed by 95°C for 5 s with 40 cycles, and 62°C for 20 s. The Supplementary Table 1 shown the primers used for these genes and miRNAs. The internal control for normalization was defined by Elongation factor 1a (EF-1a), and the 2−ΔΔCT method was performed to calculated the expression levels of relative genes (Livak and Schmittgen, 2001).
Technical Validation
For the importance of the total RNA quality in the libraries construction and the downstream analyses, the 260:280 ratios of all extracted RNA samples used in our study were ≥2, and the RNA integrity number (RIN) ≥7.0. We totally constructed nine mRNA and nine miRNA libraries for three groups (HC, MC, and LC) in which three biological replicates for each group (Supplementary Figure 1).
Results
The obtained data were tested for contamination. For comparison, the most suitable result with coverage >80% and an e-value < 1e−10 was obtained. The top 10 species in each sample were either the same species or related species between samples, and it was preliminarily judged that the samples were contamination-free. The top five species were P. monodon (50,946 reads; 62.14%), L. vannamei (8,870 reads; 10.82%), Cyprinus carpio (3,759 reads; 4.59%), Fenneropenaeus chinensis (3,032 reads; 3.7%), and Marsupenaeus japomicus (1,569 reads; 1.91%) (Supplementary Figure 2A). By applying FastQC to the entire dataset, we successfully obtained high-quality clean data with 94% of the bases scoring Q30 and above (Table 1). Then, a total of 64,475 unigenes were assembled. The range of these unigenes was from 301 bp to 38,289 bp with 1,275 bp of the average length. The length of most transcripts was between 300 to 600 bp, and 11,771 transcripts were larger than 2,000 bp (Supplementary Figure 2D). We identified 20,990 (32.56%), 16,505 (25.60%), 15,488 (24.02%) 14,284 (22.15%), and 7,508 (11.64%) genes homologous to the sequences in the Nr, Swiss-Prot, GO, KOG, and KEGG databases, respectively. All unigenes were functionally annotated, with 6,281 (9.74%) unigenes could match to all databases, and 21,997 (34.12%) could match to at least one database (Supplementary Figure 2B). The distribution of GC content frequency of the assembled unigenes was shown in Supplementary Figure 2C. We identified 2,671, 1,317, and 2,062 DEGs and 50, 69, and 55 DEMs, respectively, in three pairwise comparisons (HC vs. LC, MC vs. LC, and HC vs. MC) (Supplementary Figures 4A,C). These DEGs were mainly involved in energy metabolism, immune system, transport and signal transduction, and genetic information process. We totally identified 1,740 known miRNAs and predicted 111 novel miRNAs. These miRNAs greatly enriched the miRNA database of P. monodon, and more research are needed to verify and explore its functions. The data on these miRNAs were deposited in figshare. Although the log2fold change values of the sequencing data analysis were different from the qPCR analysis, the expression levels of these selected DEGs and DEMs were highly consistent between these two analyses (Supplementary Figures 4B,D). These DEGs and DEMs were valuable for understanding the molecular mechanism of shrimp response to salinity stress.
In conclusion, our findings provide a high-quality transcriptome and miRNA dataset characterizing how P. monodon responds to long-term salinity stress. Additionally, we screened multiple genes and miRNAs related to the salinity stress response. The dataset provides a valuable resource for screening genes related to salinity stress responses, which will contribute to improve our understanding of the molecular mechanisms of salinity stress in shrimp.
Code Availability
The software utilized in this study, including the specific versions used, were described in the part of methods and the following list:
1. FastQC version0.11.6 was used for the quality assessment of the FASTQ data: http://www.bioinformatics.babraham.ac.uk/projects/fastqc/
2. Trinity software versionr20131110 was used to assemble the transcript sequence: https://sourceforge.net/projects/trinityrnaseq/
3. TGICL17 software version2.1 was used to cluster and extend redundantly in order to obtain a set of final unigenes: https://sourceforge.net/projects/tgicl/files/
4. Cutadapt version1.14 was used to remove the adapter sequence: http://code.google.com/p/cutadapt/
5. NGSQCToolkit version2.3.3 was used to filter out reads containing N bases: http://www.nipgr.res.in/ngsqctoolkit.html
6. Mirdeep2 software was used to identify novel miRNAs: https://github.com/rajewsky-lab/mirdeep2
7. MiRanda software was used to predict the target genes of the identified miRNAs: http://www.microrna.org/microrna/getDownloads.do
8. DESeq2 package v1.8.2 was used for the differential expression analysis: https://www.rdocumentation.org/packages/DESeq2.
Data Availability Statement
The raw FASTQ files for this study can be found in the NCBI Sequence Read Archive (SRA) [http://identifiers.org/ncbi/insdc.sra:SRP262105] with accession number SRP262105 (Bioproject ID: PRJNA631809) (NCBI Sequence Read Archive., 2020). The annotation information of the transcripts in this study was deposited in figshare (Li, 2020a). In addition, the quality assessment data of raw reads and differentially expressed genes were deposited in figshare (Li, 2020b,c). The differentially expressed miRNAs, predicted novel miRNAs, and corresponding heatmaps were deposited in figshare (Li, 2020d,e). The assembled unigenes, novel miRNA structures, and predicted target genes were also deposited in figshare (Li, 2020f).
Ethics Statement
The animal study was reviewed and approved by Animal Care and Use Committee of South China Sea Fisheries Research Institute, Chinese Academy of Fishery Sciences (No. SCSFRI96-253).
Author Contributions
ShJ conceived the project and supervised the work. YL performed the bioinformatics analysis and prepared the manuscript. FZ and JH conducted the experiment. LY, SoJ, and QY collected the samples and performed sequencing. All authors read and approved the final manuscript.
Funding
This work was supported by grants from the National Key R & D Program of China (2018YFD0900303), Central Public-interest Scientific Institution Basal Research Fund, CAFS (2020TD30), China Agriculture Research System-48 (CARS-48), and Central Public-interest Scientific Institution Basal Research Fund, South China Sea Fisheries Research Institute, CAFS (Grant Nos. 2019TS25 and 2020ZD01).
Conflict of Interest
The authors declare that the research was conducted in the absence of any commercial or financial relationships that could be construed as a potential conflict of interest.
Supplementary Material
The Supplementary Material for this article can be found online at: https://www.frontiersin.org/articles/10.3389/fmars.2020.579381/full#supplementary-material
References
Anders, S., and Huber, W. (2010). Differential expression analysis for sequence count data. Genome Biol. 11:R106. doi: 10.1186/gb-2010-11-10-r106
Andrews, S. (2010). FastQC: A Quality Control Tool for High Throughput Sequence Data. Available online at: https://www.bioinformatics.babraham.ac.uk/projects/fastqc/ (accessed November 20, 2018).
Biggar, K. K., and Storey, K. B. (2015). Insight into post-transcriptional gene regulation: stress-responsive microRNAs and their role in the environmental stress survival of tolerant animals. J. Exp. Biol. 218, 1281–1289. doi: 10.1242/jeb.104828
Burgos-Aceves, M. A., Cohen, A., Smith, Y., and Faggio, C. (2018). MicroRNAs and their role on fish oxidative stress during xenobiotic environmental exposures. Ecotox. Environ. Safe. 148, 995–1000. doi: 10.1016/j.ecoenv.2017.12.001
Chen, K., Li, E., Li, T., Xu, C., Wang, X., Lin, H., et al. (2015). Transcriptome and molecular pathway analysis of the hepatopancreas in the Pacific white shrimp Litopenaeus vannamei under chronic low-salinity stress. PLoS ONE 10:e0131503. doi: 10.1371/journal.pone.0131503
Denman, R. B. (1993). Using RNAFOLD to predict the activity of small catalytic RNAs. BioTechniques 15, 1090–1095.
Ebert, M. S., and Sharp, P. A. (2012). Roles for microRNAs in conferring robustness to biological processes. Cell 149, 515–524. doi: 10.1016/j.cell.2012.04.005
FAO (2018) The State of World Fisheries and Aquaculture 2018. Rome: Food and Agriculture Organization of the United Nations (FAO) Press.
Friedlaender, M. R., Mackowiak, S. D., Li, N., Chen, W., and Rajewsky, N. (2012). miRDeep2 accurately identifies known and hundreds of novel microRNA genes in seven animal clades. Nucleic Acids Res. 40, 37–52. doi: 10.1093/nar/gkr688
Grabherr, M. G., Haas, B. J., Yassour, M., Levin, J. Z., Thompson, D. A., Amit, I., et al. (2011). Full-length transcriptome assembly from RNA-Seq data without a reference genome. Nat. Biotechnol. 29, 644–52. doi: 10.1038/nbt.1883
Griffiths-Jones, S., Grocock, R. J., van Dongen, S., Bateman, A., and Enright, A. J. (2006). miRBase: microRNA sequences, targets and gene nomenclature. Nucleic Acids Res. 34, D140–D144. doi: 10.1093/nar/gkj112
Guo, H., Lu, Z., Zhu, X., Zhu, C., Wang, C., Shen, Y., et al. (2018). Differential expression of microRNAs in hemocytes from white shrimp Litopenaeus vannamei under copper stress. Fish Shellfish Immun. 74, 152–161. doi: 10.1016/j.fsi.2017.12.053
He, P., Wei, P., Zhang, B., Zhao, Y., Li, Q., Chen, X., et al. (2018). Identification of microRNAs involved in cold adaptation of Litopenaeus vannamei by high-throughput sequencing. Gene 677, 24–31. doi: 10.1016/j.gene.2018.07.042
John, B., Enright, A. J., Aravin, A., Tuschl, T., Sander, C., and Marks, D. S. (2004). Human microRNA targets. PLoS Biol. 2, 1862–1879. doi: 10.1371/journal.pbio.0020363
Li, E., Wang, X., Chen, K., Xu, C., Qin, J. G., and Chen, L. (2017). Physiological change and nutritional requirement of Pacific white shrimp Litopenaeus vannamei at low salinity. Rev. Aquacult. 9, 57–75. doi: 10.1111/raq.12104
Li, Y. (2020a). Data From: Transcriptome and miRNA Profiles of Black Tiger Shrimp, Penaeus Monodon, Under Different Salinity Conditions. Annotation. Lasi: Figshare.
Li, Y. (2020b). Data From: Transcriptome and miRNA Profiles of Black Tiger Shrimp, Penaeus Monodon, Under Different Salinity Conditions. 1.Fast,QC, zip. Lasi: Figshare.
Li, Y. (2020c). Data From: Transcriptome and miRNA Profiles of Black Tiger Shrimp, Penaeus Monodon, Under Different Salinity Conditions. 3.Gene_diff.zip. Lasi: Figshare.
Li, Y. (2020d). Data From: Transcriptome and miRNA Profiles of Black Tiger Shrimp, Penaeus Monodon, Under Different Salinity Conditions. different_expressed_miRNA. Lasi: Figshare.
Li, Y. (2020e). Data From: Transcriptome and miRNA Profiles of Black Tiger Shrimp, Penaeus Monodon, Under Different Salinity Conditions. Novel miRNA. Lasi: Figshare.
Li, Y. (2020f). Data From: Assembled unigene_Novle miRNA, Structure and Target Gene Predicted. Lasi: Figshare.
Livak, K. J., and Schmittgen, T. D. (2001). Analysis of relative gene expression data using real-time quantitative PCR and the 2-ΔΔCT method. Methods 25, 402–408. doi: 10.1006/meth.2001.1262
Marcel, M. (2011). Cutadapt removes adapter sequences from high-throughput sequencing reads. EMBnet J. 17, 10–12. doi: 10.14806/ej.17.1.200
NCBI Sequence Read Archive. (2020). Available online at: http://identifiers.org/ncbi/insdc.sra:SRP262105 (accessed May 11, 2020).
Patel, R. K., and Jain, M. (2012). NGS QC toolkit: a toolkit for quality control of next generation sequencing data. PLoS ONE 7:e30619. doi: 10.1371/journal.pone.0030619
Pertea, G., Huang, X., Liang, F., Antonescu, V., Sultana, R., Karamycheva, S., et al. (2003). TIGR gene indices clustering tools (TGICL): a software system for fast clustering of large EST datasets. Bioinformatics 19, 651–652. doi: 10.1093/bioinformatics/btg034
Roy, L. A., Davis, D. A., Saoud, I. P., Boyd, C. A., Pine, H. J., and Boyd, C. E. (2010). Shrimp culture in inland low salinity waters. Rev. Aquacult. 2, 191–208. doi: 10.1111/j.1753-5131.2010.01036.x
Shekhar, M. S., Kiruthika, J., and Ponniah, A. G. (2013). Identification and expression analysis of differentially expressed genes from shrimp (Penaeus monodon) in response to low salinity stress. Fish Shellfish Immun. 35, 1957–1968. doi: 10.1016/j.fsi.2013.09.038
Wang, H., Wei, H., Tang, L., Lu, J., Mu, C., and Wang, C. (2018). Identification and characterization of miRNAs in the gills of the mud crab (Scylla paramamosain) in response to a sudden drop in salinity. BMC Gen. 19:609. doi: 10.1186/s12864-018-4981-6
Wang, Z., Feng, Y., Li, J., Zou, J., and Fan, L. (2020). Integrative microRNA and mRNA analysis reveals regulation of ER stress in the Pacific white shrimp Litopenaeus vannamei under acute cold stress. Comp. Biochem. Phys. D Gen. Proteom. 33:100645. doi: 10.1016/j.cbd.2019.100645
Xu, C., Li, E., Xu, Z., Wang, S., Chen, K., Wang, X., et al. (2016). Molecular characterization and expression of AMP-activated protein kinase in response to low-salinity stress in the Pacific white shrimp Litopenaeus vannamei. Comp. Biochem. Physiol. B Biochem. Mol. Biol. 198, 79–90. doi: 10.1016/j.cbpb.2016.04.005
Zhang, D., Wang, F., Dong, S., and Lu, Y. (2016). De novo assembly and transcriptome analysis of osmoregulation in Litopenaeus vannamei under three cultivated conditions with different salinities. Gene 578, 185–193. doi: 10.1016/j.gene.2015.12.026
Keywords: transcriptome, miRNA, salinity, Penaeus monodon, penaeid shrimp
Citation: Li Y, Zhou F, Huang J, Yang L, Jiang S, Yang Q and Jiang S (2020) Transcriptome and miRNA Profiles of Black Tiger Shrimp, Penaeus monodon, Under Different Salinity Conditions. Front. Mar. Sci. 7:579381. doi: 10.3389/fmars.2020.579381
Received: 02 July 2020; Accepted: 07 September 2020;
Published: 07 October 2020.
Edited by:
Kit Yue Kwan, Beibu Gulf University, ChinaCopyright © 2020 Li, Zhou, Huang, Yang, Jiang, Yang and Jiang. This is an open-access article distributed under the terms of the Creative Commons Attribution License (CC BY). The use, distribution or reproduction in other forums is permitted, provided the original author(s) and the copyright owner(s) are credited and that the original publication in this journal is cited, in accordance with accepted academic practice. No use, distribution or reproduction is permitted which does not comply with these terms.
*Correspondence: Shigui Jiang, amlhbmdzZyYjeDAwMDQwOzIxY24uY29t