 Bárbara C. Franco
 Vincent Combes
 Victoria González Carman
95% of researchers rate our articles as excellent or good
Learn more about the work of our research integrity team to safeguard the quality of each article we publish.
Find out more
ORIGINAL RESEARCH article
Front. Mar. Sci., 25 September 2020
Sec. Marine Conservation and Sustainability
Volume 7 - 2020 | https://doi.org/10.3389/fmars.2020.563394
This article is part of the Research TopicSolving Complex Ocean Challenges Through Interdisciplinary Research: Advances from Early Career Marine ScientistsView all 42 articles
In the southwest South Atlantic Ocean (SWAO) strong ocean surface warming hotspots have been observed mainly along the path of the Brazil Current (BC), Brazil-Malvinas Confluence (BMC), and in the Río de la Plata (RdlP). However, there is no knowledge about the signature of ocean hotspots below the surface and the potential effects of ocean warming on marine biota. In this work, we provide initial evidence of how deep the hotspots of the SWAO extend in the water column, in particular at mid-water and bottom layers where two marine species - the green turtle (Chelonia mydas) and the Patagonian scallop (Zygochlamys patagonica) - inhabit. We compare 15 years (2003–2017) of Copernicus Marine Environment Monitoring Service (CMEMS) ARMOR3D high−resolution (1/4°) 3-D temperatures reprocessed from combined satellite and in situ observations with high−resolution (1/12°) Mercator ocean reanalysis. We also use location data of C. mydas and Z. patagonica to discuss the potential impacts of warming on these species in terms of geographic distribution, phenological shifts and thermal tolerance. The potential distribution of C. mydas changes in relation to the sea surface temperature (SST) and the bathymetry. The warming of the whole water column in the RdlP (>0.4°C/decade) and the southward movement of the mean surface isotherms, which likely drove turtle displacements, could enable the opening up of novel optimal thermal habitats and/or a longer seasonal residency for the species. At the BMC, warming is driven by the southward displacement of the BC during the past decades. Ocean model temperature indicates cooling/warming in deep waters along the outer shelf and shelf break regions, which vary according the displacements of the BMC. The expected warming of the waters over the Patagonian scallop largest bed could exceed the thermal tolerance of this species and its survival. Given the lack of long-term monitoring programs to address the impacts of climate change on marine biota in the SWAO, our results provide the first effort to call the attention of stakeholders and decision makers on marine conservation and fishery management to work toward better management strategies in the context of climate change.
During the past decades, a consistent poleward shift of the major subtropical ocean gyres driven by climate change has been reported, and a stronger surface ocean warming trend has occurred over the western boundary currents of the oceans (Wu et al., 2012; Yang et al., 2016, 2020). In the South Atlantic Ocean, a poleward displacement of the subtropical gyre at a rate of 0.11°/decade has been observed (Yang et al., 2020), and the western boundary current - the Brazil Current (BC) - has been reported as one of the most extensive and intense surface warming hotspots in the global ocean (Hobday and Pecl, 2014). Although changes in the distribution and productivity of marine species have been recorded over faster ocean warming regions worldwide (Burrows et al., 2014; Sunday et al., 2015; Pecl et al., 2017), potential changes remain largely unexplored in the southwest South Atlantic Ocean (SWAO, see Franco et al., 2020).
The SWAO extends from ∼22°S (Brazil) to the tip of Tierra del Fuego (55°S, Argentina) (Figure 1). The dynamics in the SWAO is dominated by the Brazil-Malvinas Confluence (BMC), which is the region of convergence of two distinct western boundary currents: the Brazil and Malvinas currents (MCs) (Figure 1). The MC transports cold and nutrient-rich waters northward along the continental slope and shelf-break of Argentina, while the BC transports warm and salty waters southward along the continental slope and outer shelf of Brazil and Uruguay. Changes in sea surface temperature (SST), sea surface height (SSH) and numerical simulations indicate that the BC is shifting southwards 0.81–0.39°/decade driven by the poleward displacement of the subtropical gyre (Goni et al., 2011; Lumpkin and Garzoli, 2011; Combes and Matano, 2014; Yang et al., 2020). Intense surface ocean warming hotspots in the SWAO have been observed mainly along the BC path and at the BMC (Yang et al., 2016, 2020; Oliver et al., 2018). While surface ocean warming hotspots and marine heatwaves are relatively well studied based on the availability of satellite data, subsurface temperature changes remain poorly described, despite their possible impact on neritic, pelagic and benthic ecosystems.
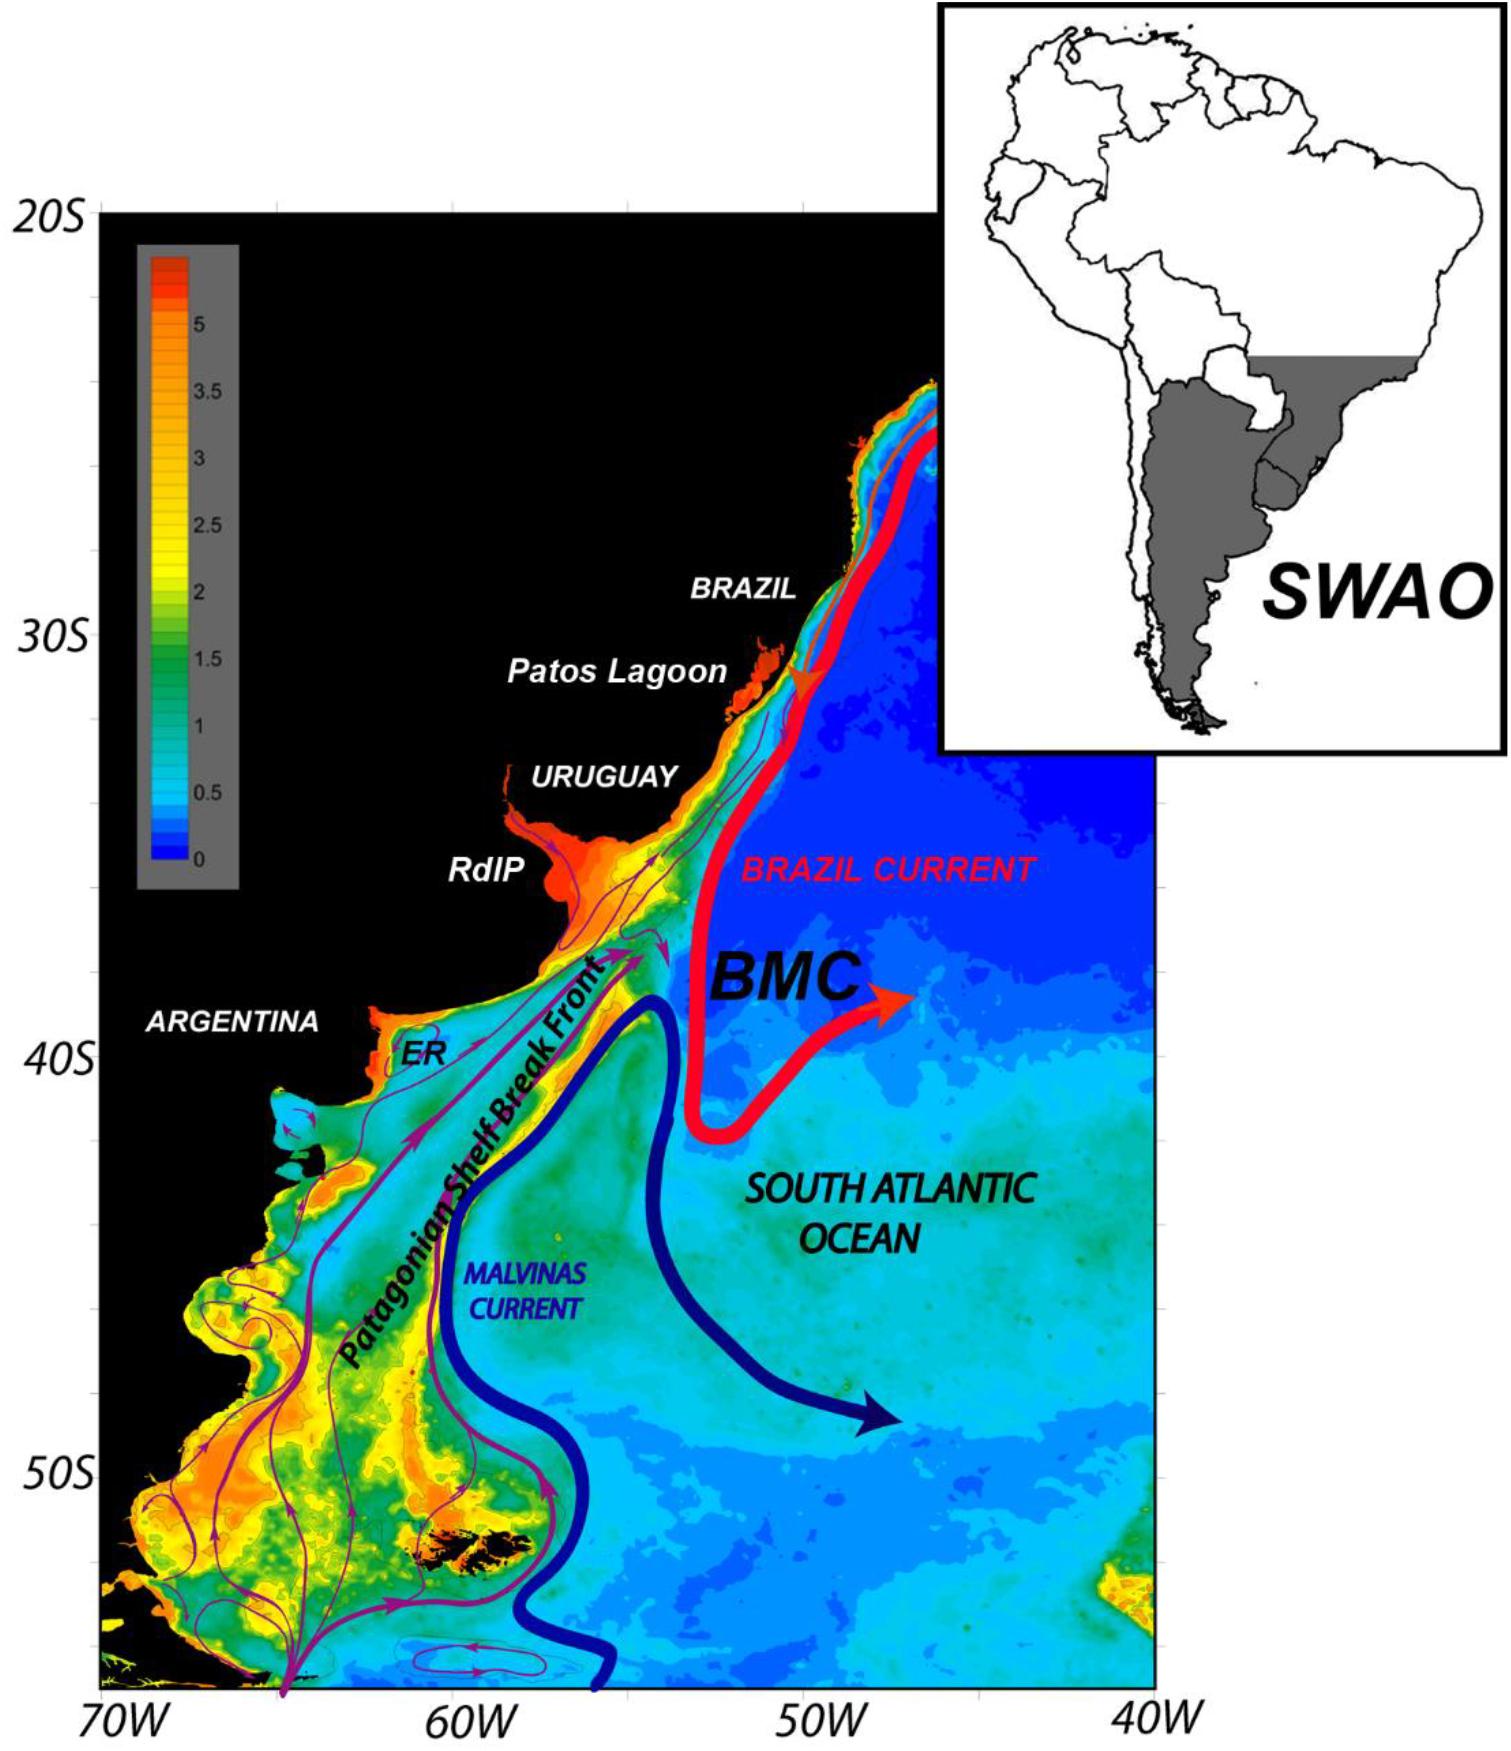
Figure 1. Schematic circulation in the southwest South Atlantic Ocean (SWAO). Concentration of surface chlorophyll-a (mg m– 3) from the SeaWIFs radiometer (austral summer average) is shown in the background colors. The magenta lines indicate the schematic shelf circulation. The Brazil-Malvinas confluence (BMC) region is shown. El Rincón estuary is shown as ER. From Franco et al. (2017), with permission.
In the SWAO, the northern shelf is occupied by waters of subtropical origin and the southern shelf by waters of subantarctic origin (Piola et al., 2000). Subantarctic shelf waters are exported offshore mainly near the BMC region (Franco et al., 2018). In the northern SWAO shelf, tropical waters are observed in upper layers (Campos et al., 1995). The Río de la Plata (RdlP, 35°–36°S) discharge is the major freshwater inflow, with annual averages of ∼23,300 m3 s–1 (Möller et al., 2008). The RdlP discharge modulates the input and distribution of freshwater and nutrients, impacting the marine food web and the feeding of the most abundant pelagic fishes and several marine species over the shelf (Acha et al., 2012). Although a relatively weak surface warming has been observed in the RdlP (Oliver et al., 2018), a long-term shift from cold-water to warm-water species in industrial fisheries of Uruguay suggests the impact of climate change (Gianelli et al., 2019). Whether ocean warming affects other components of the ecosystem is unknown. In this study, we provide the first evidence of the vertical extension of the warming hotspots of the SWAO and discuss the potential impacts of ocean warming on two marine species: an ectothermic vertebrate species of conservation concern and a benthic cold-water invertebrate species of great economic importance.
Sea turtles are a useful case study for understanding the impacts of ocean warming on wild populations of conservation concern (Hawkes et al., 2009; Fuentes et al., 2013; Hamann et al., 2013). As ectotherms, sea turtles are likely to have range distributions largely defined by temperature, which is the most important environmental factor affecting sea turtles from eggs to adults (Spotila et al., 1997). However, more is known about the effects of changing temperatures on the reproductive phase − e.g., loss of nests due to sea level rise, shifts in the timing of nesting season, altered hatchling sex ratio and survival of incubating eggs − than to other stages of sea turtle life cycle (Hawkes et al., 2007; Fuentes et al., 2009; Mazaris et al., 2015). The effects of ocean warming on sea turtle ecology in foraging grounds are less understood (Hawkes et al., 2009; Fuentes et al., 2013; Hamann et al., 2013).
The RdlP is a seasonal, highly used foraging ground for at least three sea turtle species within their southern boundary range (Frazier, 1984; González Carman et al., 2011, 2012, 2016a; Vélez-Rubio et al., 2013). The green turtle (Chelonia mydas) distribution is mainly associated with tropical and sub-tropical warm waters, which sustain the bulk of the species nesting colonies and foraging grounds (Pritchard, 1997; Campos and Cardona, 2019). However, C. mydas has also been recorded south of the RdlP, in the El Rincón (ER) estuary (39°–41°S, see Figure 1) and sporadically over the northern Patagonian shelf to ∼42°S (González Carman et al., 2011, 2012). Whether these southernmost records are related to ocean warming that has occurred during the past decades is difficult to assess since no sea turtle systematic records exist in this region before 2003 (González Carman et al., 2011). Nonetheless, if current C. mydas satellite tracking is coupled with distribution modeling, the species austral distribution - and its potential changes due to ocean warming - could be explored in the region.
A second example is the Patagonian scallop (Zygochlamys patagonica), a useful case study for understanding the impacts of ocean warming on wild populations of economic interest. The species is an important economic resource in Argentina, whose fishery is certified by the Marine Stewardship Council1 (Ciocco et al., 2006; Soria et al., 2016). This cold-water affinity bivalve feeds by filtering phytoplankton and organic matter (Schejter et al., 2002; Bogazzi et al., 2005; Mauna et al., 2011; Cragg, 2016). Since the survival of the Patagonian scallop beds along the Argentine shelf-break ground is highly dependent on the productivity of the Patagonian Shelf Break Front (SBF) and benthic-pelagic coupling processes (Franco et al., 2017), the southward displacement of the warm, nutrient-poor BC along the outer shelf and shelf break could have negative impacts on the productivity of the SBF, and hence reduce the sustainability of Z. patagonica fishery.
The physical ocean model used here is the 1/12° global Mercator Ocean reanalysis (hereafter, GLORYS12). GLORYS12 provides monthly mean sea temperature for the period 1993–2017 on 50 verticals levels. The model also provides monthly mean mixed-layer depth (MLD) outputs. However, the model presents an unrealistic water mass structure and a cold bias prior to 2003. The introduction of more temperature and salinity profiles from Argo floats in the model assimilation after 2003 led to more realistic water mass vertical structure. Our conclusion is based on the comparison of model data with historical in situ data (more than 20,000 in situ observations available from World Ocean Database2) for the study region. Therefore, in this study we have restricted the analyses of model outputs to the 2003–2017 period. GLORYS12, available from Copernicus Marine Environment Monitoring Service3 (CMEMS), is based on the current real−time global high−resolution forecasting CMEMS system PSY4V3 (Lellouche et al., 2018). The model assimilates observations with a 7−day assimilation cycle (Lellouche et al., 2013), including along−track satellite altimetry data from CMEMS (Pujol et al., 2016), satellite SST from NOAA, sea−ice concentration, and in situ temperature and salinity vertical profiles from the latest CORA in situ databases (Szekeley et al., 2016). GLORYS12 provides a realistic representation of the general circulation of the SWAO and the location of the BMC (Artana et al., 2018, 2019).
The physical ocean model will be compared to the ARMOR3D dataset which is based on observations. The ARMOR3D dataset provide the 3-D temperature, salinity, and velocity fields derived from satellite (sea level anomalies, geostrophic surface currents, and SST) and in situ (temperature and salinity profiles) observations (Guinehut et al., 2012). ARMOR3D data is provided on a 1/4° resolution grid and is available from CMEMS (see text footnote 3). The monthly mean temperature for the period 2003–2017 will be used in the following analyses.
To explore potential changes in C. mydas austral distribution likely driven by the warming of inner shelf waters, we used satellite tracking of nine juveniles during the period (2008–2011) (González Carman et al., 2012). The species mostly occurs from late austral spring (October) to the fall (May). By the end of the fall, C. mydas start migrating to the southern Brazil shelf to winter in warmer waters. Some juveniles performed a round-trip migration using offshore waters to return to different parts of the RdlP in consecutive years (González Carman et al., 2012). Thus, we divided the year in four periods resembling C. mydas behavior in the SWAO: 1) arriving (October to December), 2) remaining (January to March), 3) leaving (April to June), and 4) absent (July to September).
Green turtle tracking data were collected using the Argos satellite system and downloaded with the Satellite Tracking and Analysis Tool (STAT; Coyne and Godley, 2005). Argos locations are classified as 3, 2, 1, 0, A, B and Z, according to accuracy. Location classes 3, 2, 1, 0 are categorized to lie within 150 m, 150–350 m, 350–1,000 m or >1,000 m of the tag’s true position, respectively. Locations classes A and B have no location error estimate. Routes were reconstructed using locations 3, 2, 1, 0, A, and B. Duplicated locations, locations class Z, locations on land and those implying high rate of travel >5 km/h were removed from analysis. We also removed locations from the first 48 h of transmission after deployment to avoid abnormal turtle behavior after release.
After filtering the data, we developed maximum entropy (MaxEnt) species distribution modeling (Phillips et al., 2006) to identify the potential distribution of C. mydas in relation to two predictor variables: SST and bathymetry. SST is derived from GLORYS12 data for the period 2008–2011, and bathymetry is obtained from the GEBCO Digital Atlas and ETOPO2 Global 2′ Elevations datasets (British Oceanographic Data Centre and NOAA’s National Geophysical Data Center). Bathymetry is a good predictor variable in marine species distribution modeling, and it is important for green turtles given their coastal habits and benthic foraging behavior (Meylan et al., 2011).
Compared to other distribution modeling approaches MaxEnt is much less sensitive to sample size (Hernandez et al., 2006; Wisz et al., 2008); which make it suitable for small sample sizes (in terms of number of individuals and years) like ours. To reduce the effect of spatial autocorrelation of consecutive locations on short time intervals, we selected the best position (according to Argos accuracy) for each turtle every 48 h, as done in other studies (e.g., Edrén et al., 2010; Pikesley et al., 2013, 2015) using R (R 3.5.0; R Development Core Team, 2018) (see Supplementary Table S1). MaxEnt modeling was implemented in MaxEnt version 3.4.1. We obtained a mean response model after running 15 models for each month. Each time, a random sample of 25% of the dataset was saved to test the model. To ensure convergence of the model, the number of iterations was set to 5,000 (Young et al., 2011; see Supplementary Table S2 for further modeling details). We then generated 12 maps of habitat suitability (HS) scaled from lowest (blue) to highest (red) suitability (Phillips et al., 2006; Elith et al., 2011). The area under the curve (AUC) was used to provide a measure of model performance. An AUC value of 0.5 indicates that the performance of the model is not better than random, while values closer to 1.0 indicate better model performance (Phillips et al., 2006; Supplementary Table S3). To identify the mean SST that is likely to drive the austral distribution of C. mydas we also used MaxEnt response curves − showing the SST at which HS for C. mydas is ≥0.5 (Supplementary Figure S1). We then overlapped those identified monthly mean SST isotherms with turtle HS. Relative contribution of SST and bathymetry to the models were obtained from MaxEnt outputs (Supplementary Figure S2).
After identifying the surface isotherms likely to drive C. mydas distribution through the year, we chose the middle month of the periods “arriving,” “remaining,” and “leaving” to explore changes in the thermally accessible range of C. mydas (i.e., changes in the location of the identified isotherms) during three 5-years periods: 2003–2007, 2008–2012, and 2013–2017. Given our limited sample size and tracking years, our main assumption is that green turtle behavior observed during 2008–2011 is representative of the GLORYS12 period analyzed (2003–2017).
The MLD represents the lower limit of the surface layer at which variables are nearly constant with depth due to turbulent mixing processes. Therefore, there is no important changes in temperature throughout the water column until the depth of the MLD. The MLD along the Brazilian shelf, the RdlP, and the northern shelf of Argentina is shallower than 10–15 m depth. There is a sharp increase of MLD along the path of the BC between ∼32° and 36°S, and a slight deepening along the southern shelf of Argentina (Figure 2A). GLORYS12 results show a sharp shoaling trend of the MLD (>5 m/decade) along the middle shelf and shelf break of Argentina. The highest shoaling trend of the MLD occurs along the BC path between ∼34° and 38°S, where values reach up to >15 m/decade, extending toward the open ocean (Figure 2B).
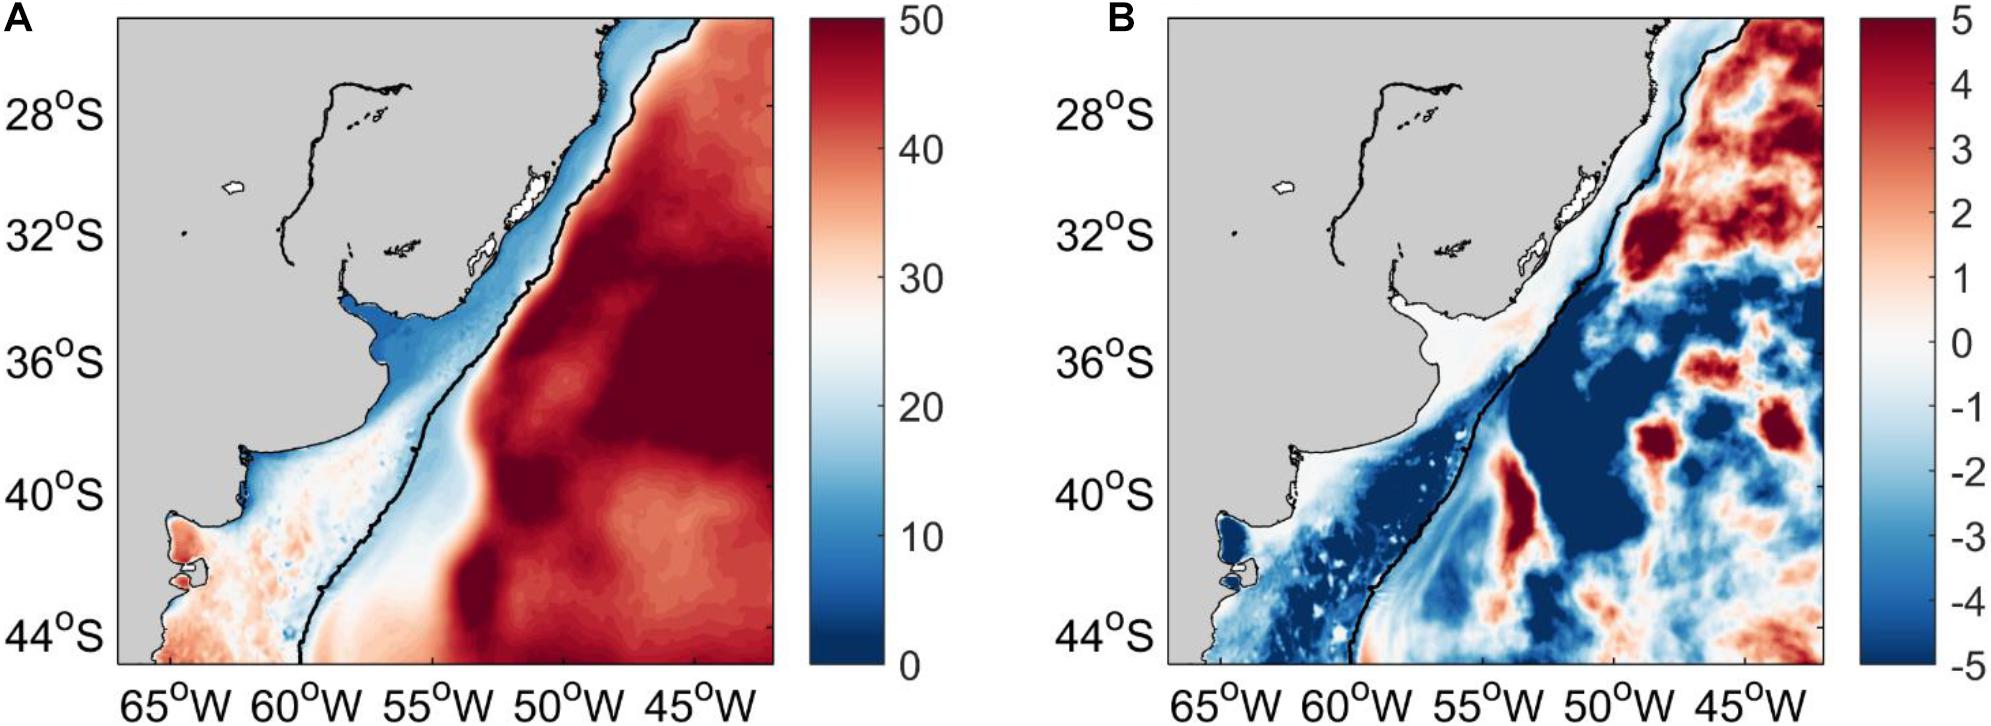
Figure 2. (A) Mean mixed layer depth (MLD) in meters. (B) Trend of MLD in m/decade during 2003–2017. The 200 m isobath is shown in black.
To characterize how deep the main hotspots of the SWAO extend in the water column we compare the temperature trends from both GLORYS12 and ARMOR3D at the surface and selected subsurface levels. At the surface, the larger positive temperature trends (°C/decade) from GLORYS12 are located over the path of BC up to ∼36°S with the highest values along the southernmost extension of BC (south of ∼38°S). Negative temperature trends are observed along the BC path, between ∼36°–38°S with the highest negative values located over the slope. Over the shelf warming stronger than 0.4°C/decade occurs along the southern mid shelf of Brazil, Uruguay, RdlP, and inner-mid shelf of Argentina (Figure 3A). ARMOR3D reports similar warming trends along the BC path and BMC regions. In the RdlP, both datasets exhibit trends higher than 0.4°C/decade (Figures 3A,B).
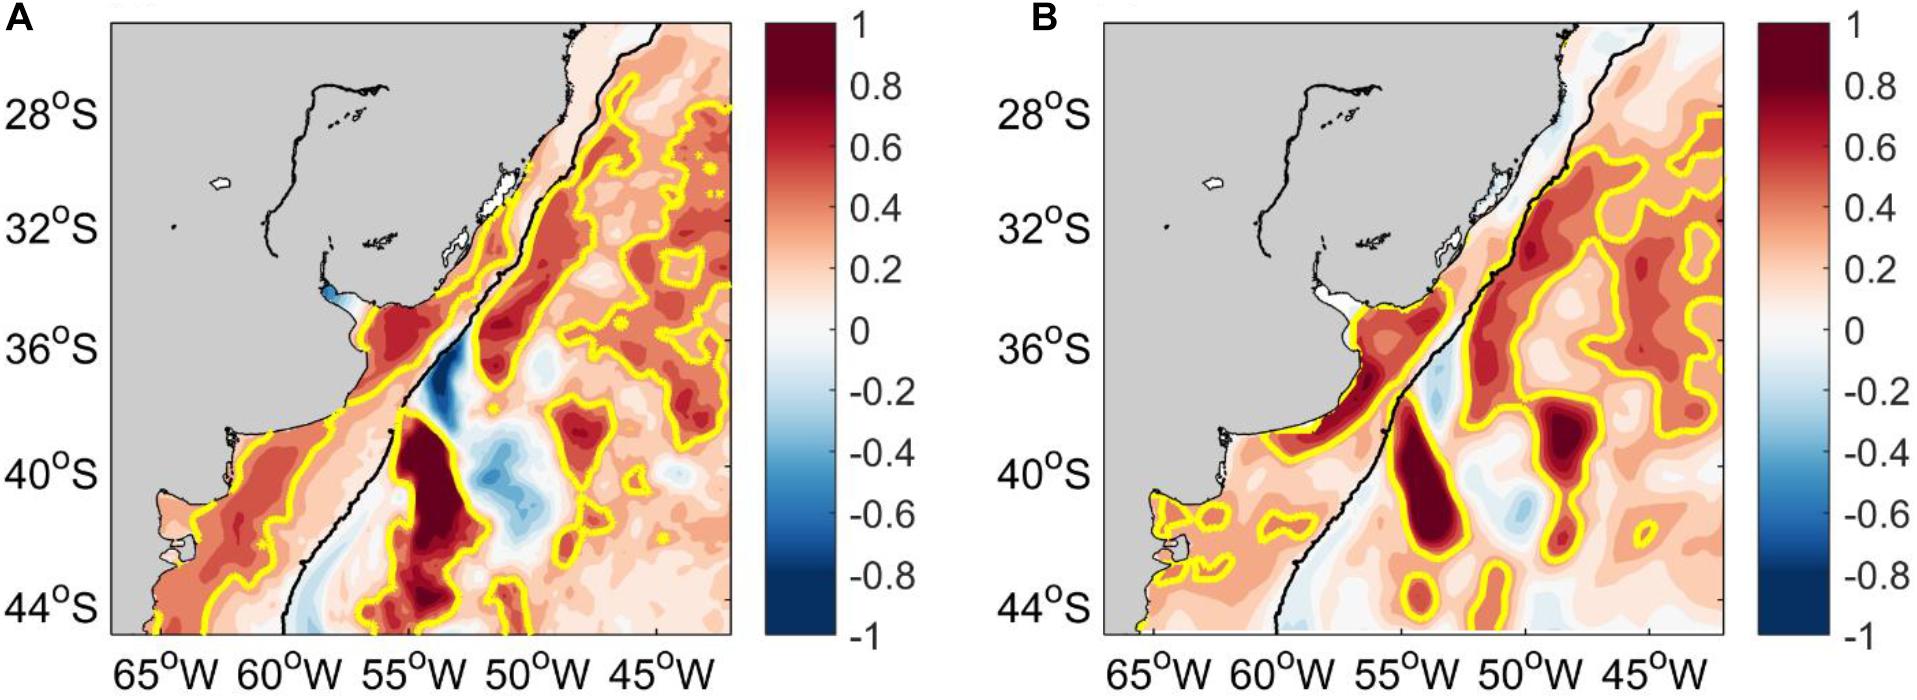
Figure 3. (A) GLORYS12 and (B) ARMOR3D surface temperature trend (°C/decade) during 2003–2017. The yellow contour corresponds to the 0.4°C/decade isoline. The 200 m isobath is shown in black.
Temperature trends from both GLORYS12 and ARMOR3D reported at 20 m depth are quite similar to the surface trends (Figures 4A,B). Most intense positive temperature trends from GLORYS12 are located over the path of BC up to ∼36°S with maxima along the southernmost extension of BC (south of ∼38°S), while negative trends are observed along the BC path between ∼36° and 38°S. Over the shelf, trends higher than 0.4°C/decade are reported from GLORYS12 over the northern coast of Brazil, in the RdlP, and along the inner-mid shelf of Argentina. A similar warming pattern along the BC path is observed from the surface down to 50 and 100 m depth in GLORYS12 (Figures 4C,E). Unlike the GLORYS12 subsurface trends, the ARMOR3D trends along the BC path present maxima along the southernmost extension of BC and over distinct areas in the open ocean (Figures 4D,F). Over the Argentina (∼36°S) outer shelf, negative temperature trends are reported by GLORYS12 while positive trends are reported by ARMOR3D at 50 and 100 m depth.
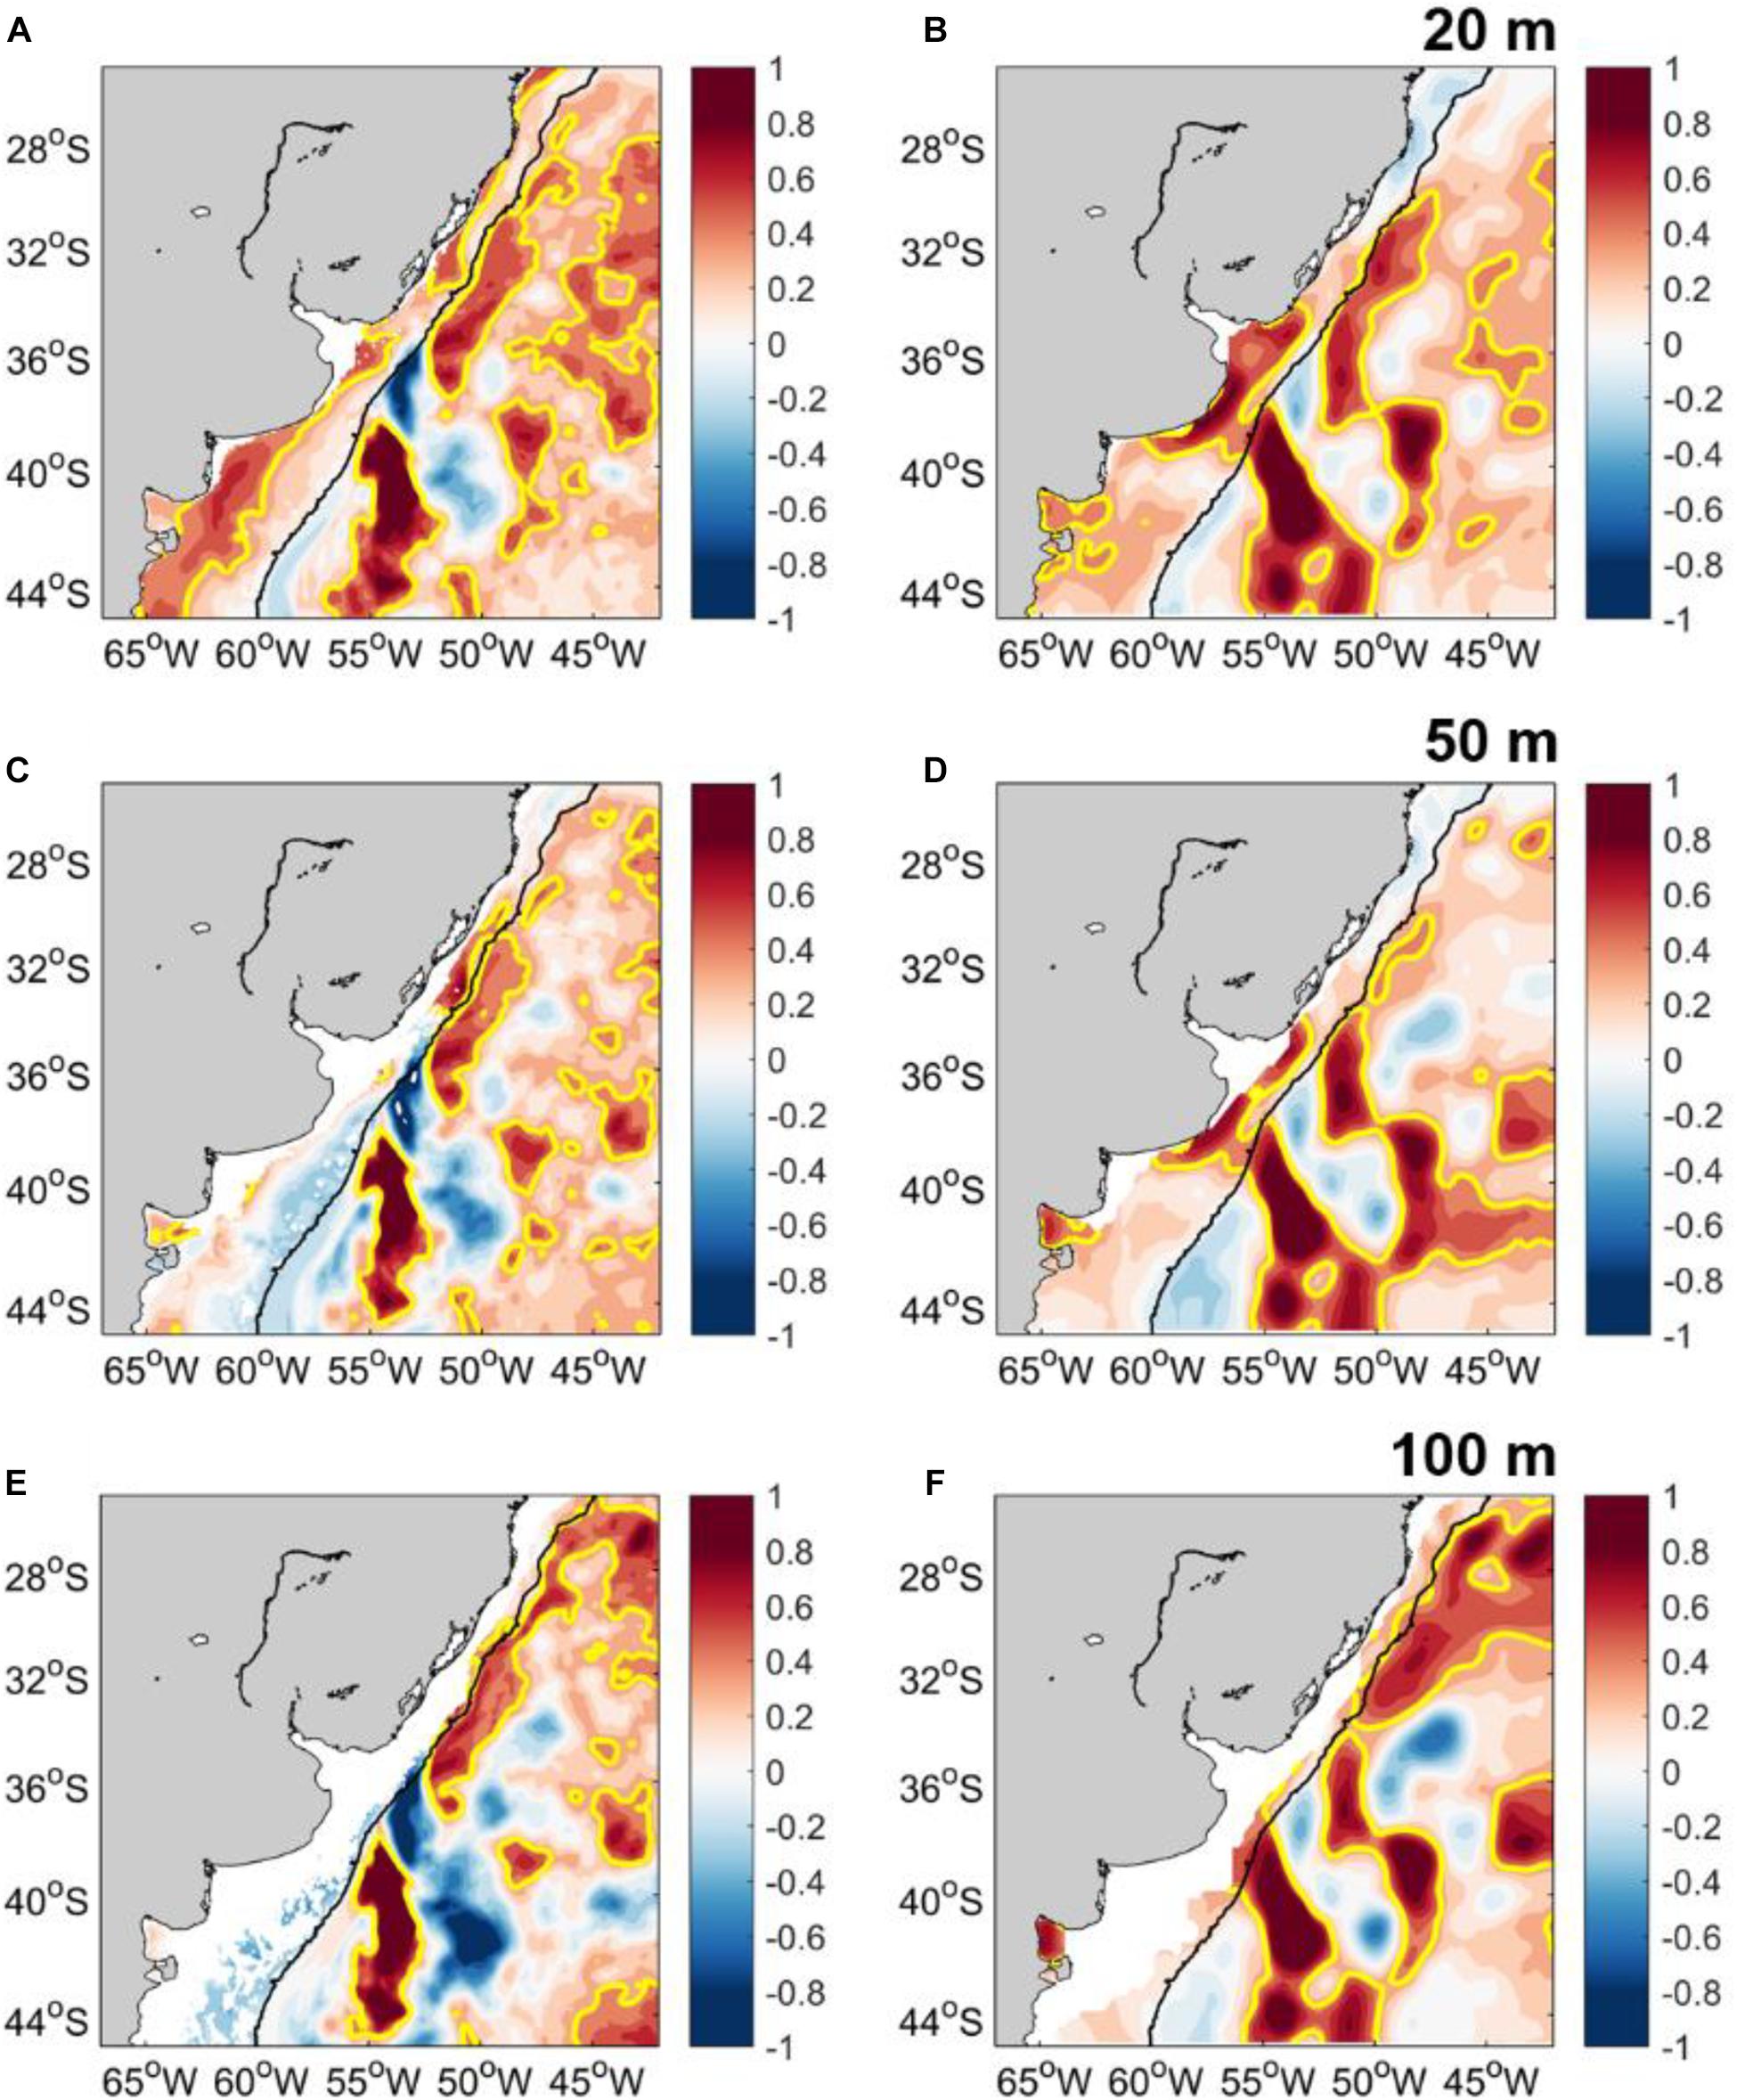
Figure 4. GLORYS12 temperature trend (°C/decade) during 2003–2017 at (A) 18 m, (C) 47 m, and (E) 92 m. ARMOR3D trend (°C/decade) at (B) 20 m, (D) 50 m, and (F) 100 m. The yellow contour corresponds to the 0.4°C/decade isoline. The 200 m isobath is shown in black.
A total of 1.456 locations of C. mydas occurrence was used to run the models. Monthly distribution models returned AUC values higher than 0.86, indicating a good model performance for all months (Supplementary Table S3).
Our modeling exercise shows that the potential distribution of the species in the SWAO is driven by SST and bathymetry, though the contribution of SST changes during different seasons (Figure 5, Supplementary Figure S2). During the “arriving” period, highest (red) suitable areas occur in shelf waters of southern Brazil (south of 25°S) and offshore waters (∼36°S) (Figure 5A), and then shift southward, reaching the ER estuary at ∼39°S (Figures 1, 5C). The mean SST isotherms likely drive the species distribution (i.e., HS ≥ 0.5) also increase during this period: from 16 to 20°C as austral spring progresses (Figures 5A–C). During the “remaining” period, highest suitable areas are restricted to shelf waters mainly off Uruguay and Argentina, and SST isotherms range from 20 to 22°C (Figures 5D–F). During both periods, bathymetry has the higher relative contribution to the model (from 77.8 to 88.3%) compared to SST (Supplementary Figure S2).
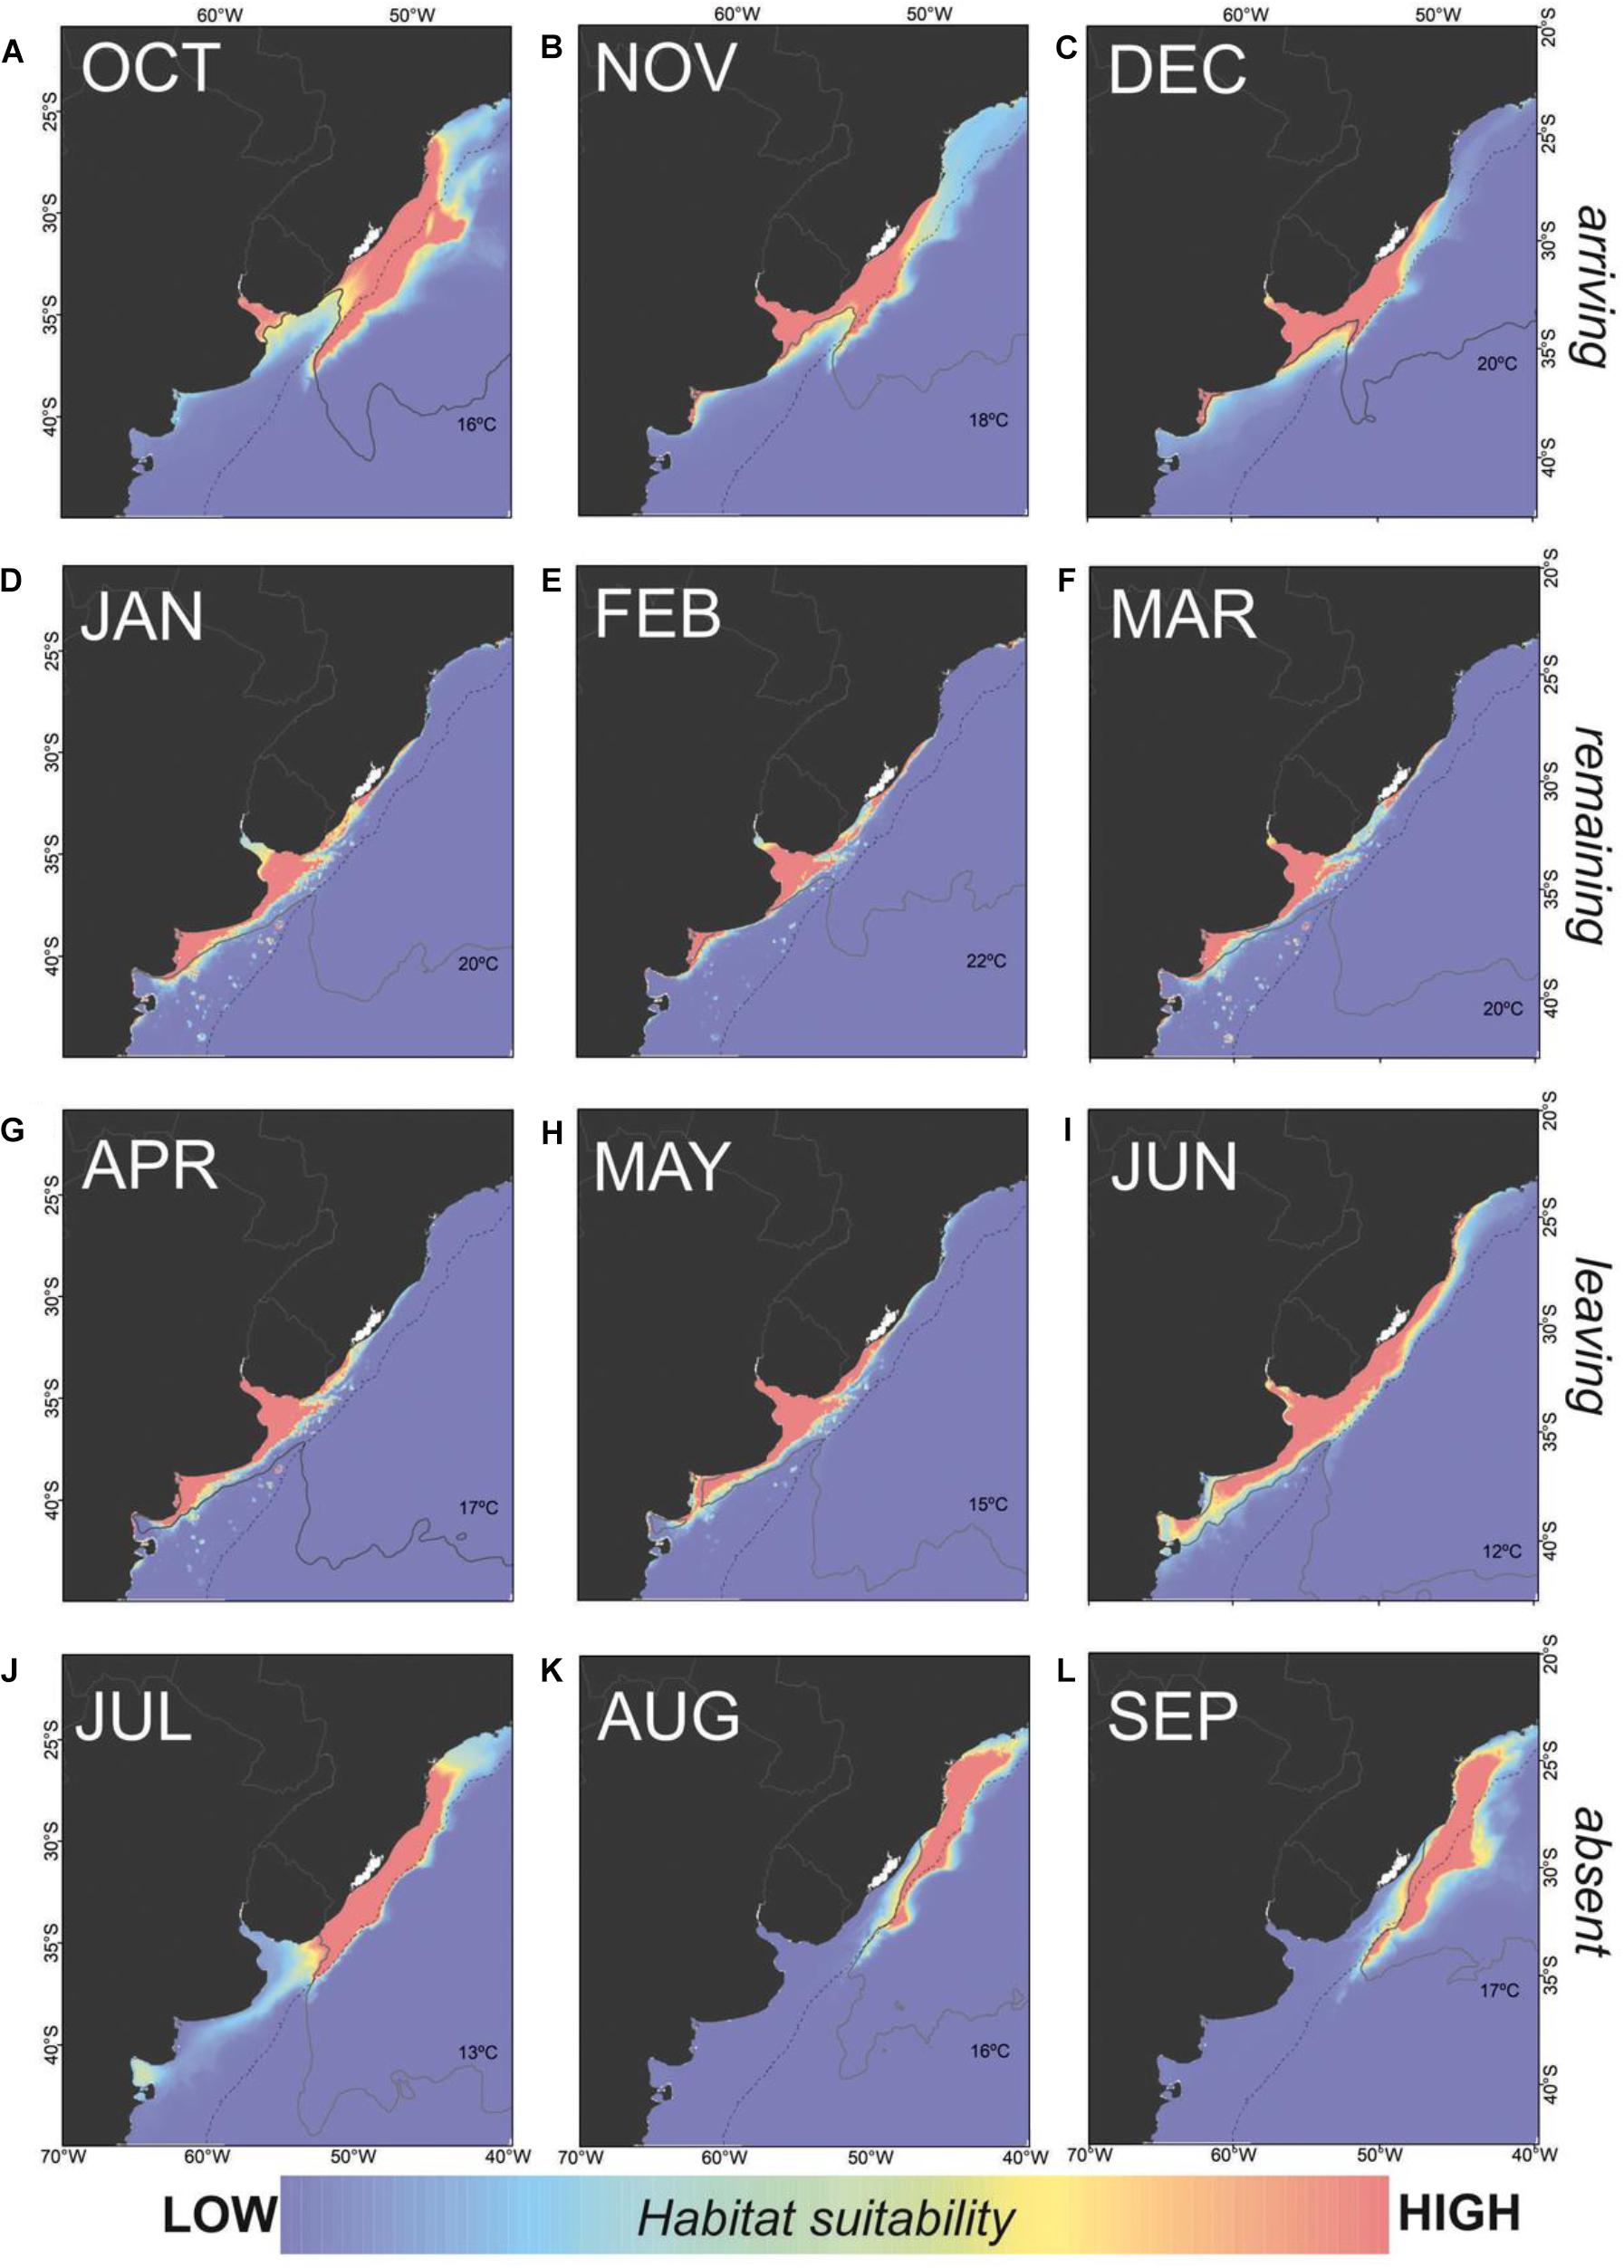
Figure 5. Green sea turtle (Chelonia mydas) monthly habitat suitability throughout the year in its boundary range of the SWAO. C. mydas behavior is divided in periods as: (A–C) arriving, (D–F) remaining, (G–I) leaving, and (J–L) absent. Dashed black line indicates 200 m isobath.
During the “leaving” period, however, highest suitable areas begin to shift northwards reaching the southern Brazilian shelf, accompanied by a decrease in the mean SST isotherms (from 17–18° to 12–13°C; Figures 5G–J, Supplementary Figure S1). During the “absent” period, high suitable areas are restricted to shelf waters off northern Uruguay and southern Brazil. Offshore high suitable areas shift northward reaching similar latitudes in October (∼36°S, Figures 5J–L). In contrast to the previous two periods, SST increases and equals its relative contribution compared to bathymetry (from 37.8 to 50.0%) during both “leaving” and “absent” periods (Supplementary Figure S2).
The thermally accessible range of C. mydas changes throughout the years (Figure 6). When the species arrives (November) and leaves (May), its thermal range seems to be associated with the 18 and 15°C isotherms, respectively. In February, the species thermal range is associated with the 22°C isotherm. The mean monthly location of these isotherms shifted southwards along the three 5-year periods (2003–2007, 2008–2012, and 2013–2017) at rates of −0.08, −0.12, and −0.14 degree of latitudes per year, respectively (Figure 6).
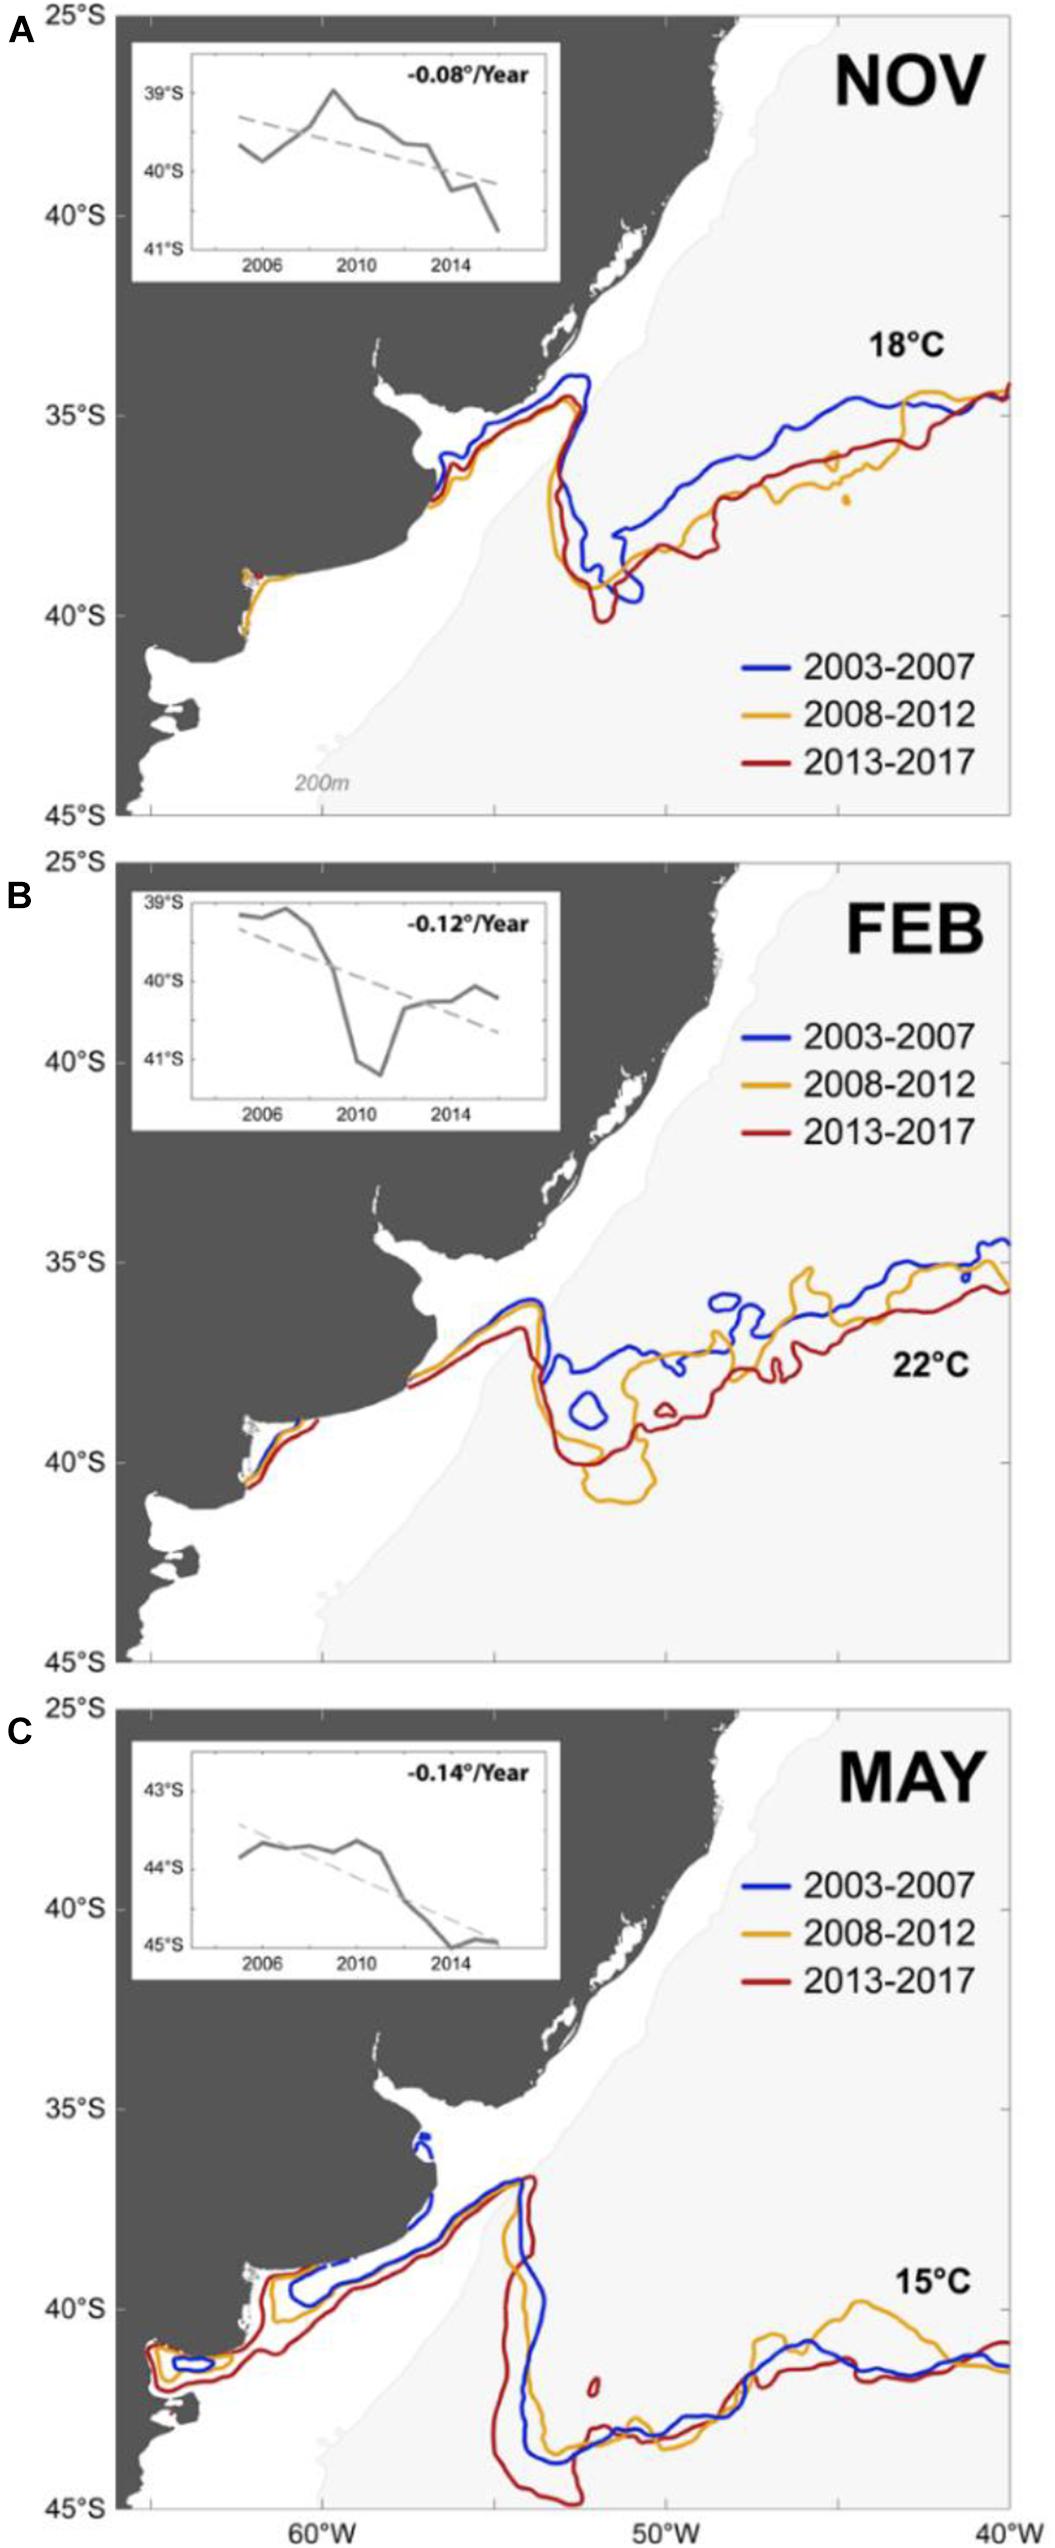
Figure 6. Changes in the thermally accessible habitat range of the green sea turtle (Chelonia mydas) from 2003 to 2017 in the SWAO. The southward displacement of the surface isotherms likely drove the species distribution is shown for the representative months of the (A) “arriving,” (B) “remaining,” and (C) “leaving” periods. The inset shows the southward movement (latitude/year) of the mean isotherms for each period.
GLORYS12 displays a large variability of the southern position of the BC over the slope between 2005 and 2014 at the surface (Figures 7A,B). The mean surface temperature during 2014 shows warmer BC waters (T > 20°C) reaching latitudes further south than observed during 2005. The BC reaches the Argentina-Uruguay Common Fishing Zone (AUCFZ) during 2014 (until ∼40°S; Figure 7B). A similarly large variability of the southern position of the BC over the slope is also observed at 92 m depth (Figures 7C,D).
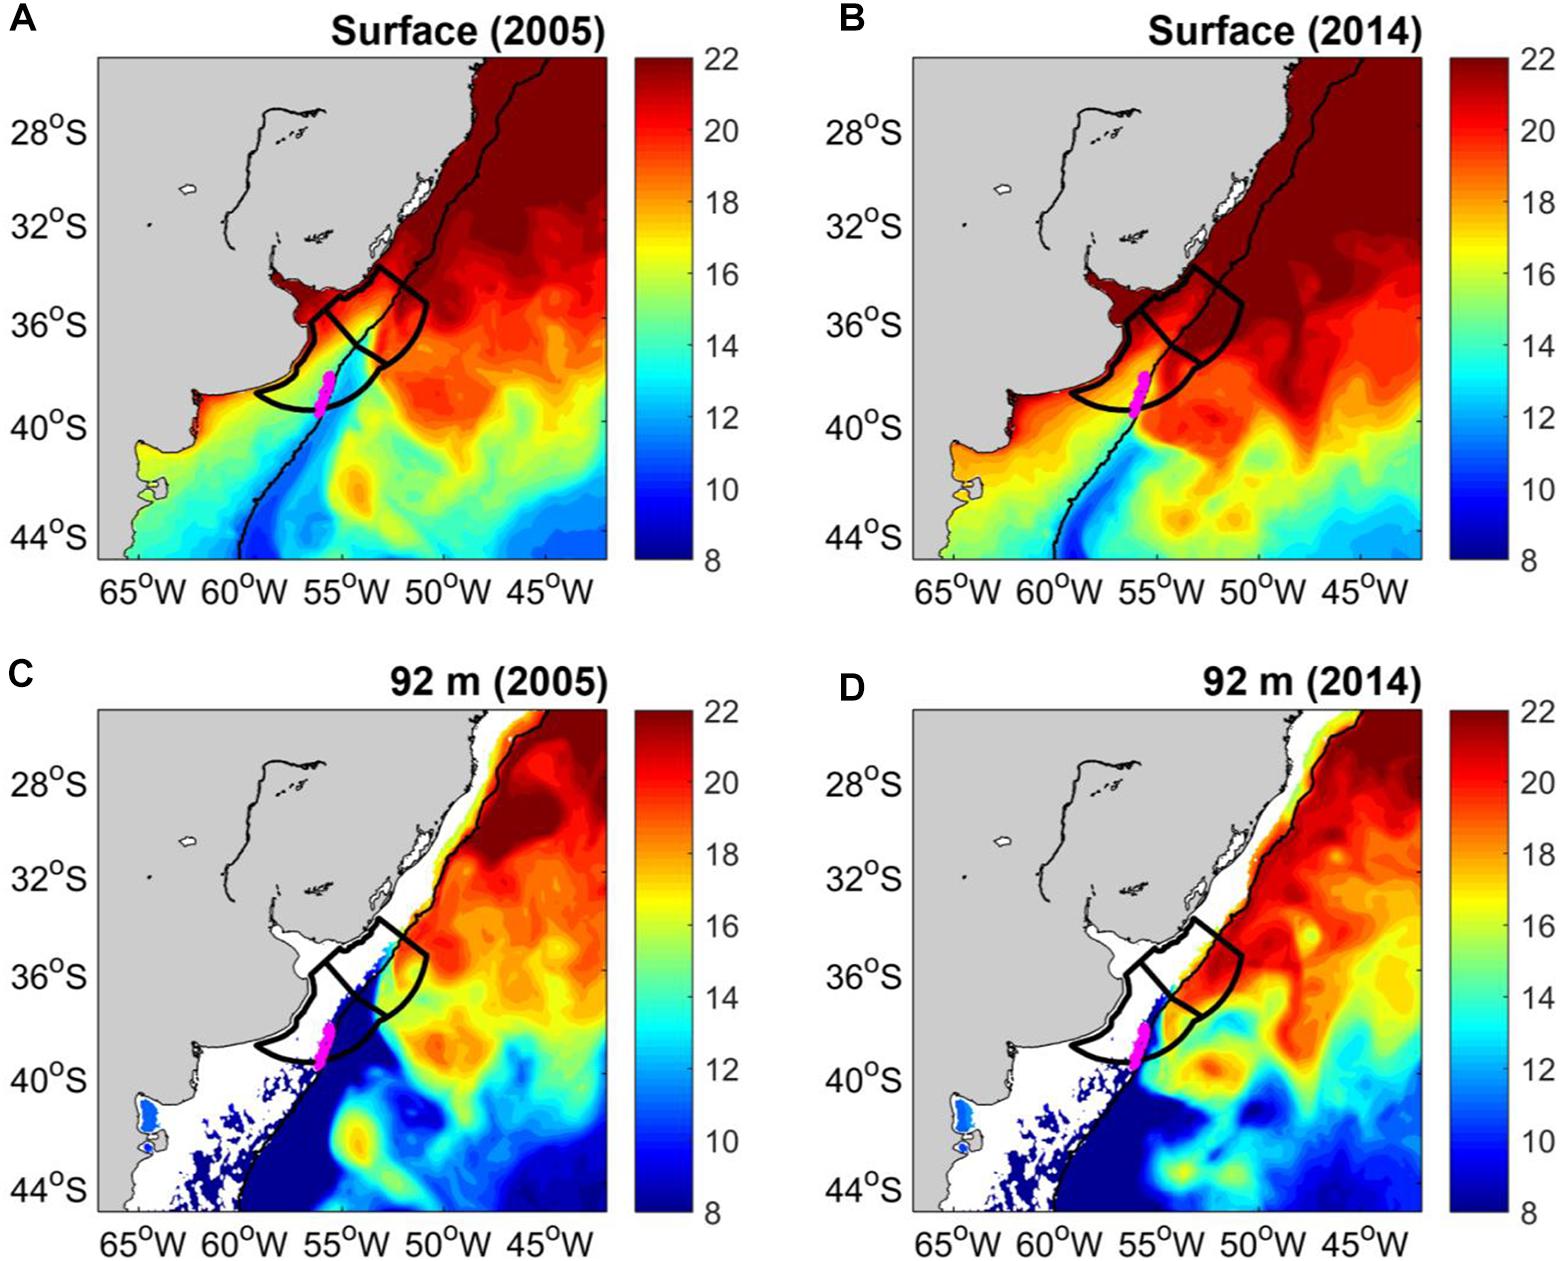
Figure 7. GLORYS12 mean temperature at surface during (A) 2005 and (B) 2014. GLORYS12 mean temperature at 92 m depth during (C) 2005 and (D) 2014. The Argentina-Uruguay Common Fishing Zone (AUCFZ) is shown by two polygons with black heavy lines. The northernmost and largest Patagonian scallop bed is shown by a magenta polygon. The 200 m isobath is shown.
The Figure 7 is useful to show how upper ocean cooling/warming trends are modulated by BMC displacements. Since cold waters are transported by MC and warmer waters by BC cooling/warming trends may be induced by displacements of the BMC (Figure 8). The dynamical connection (coupling) between the high surface phytoplankton concentration along the SBF (overlying water) and the largest bed of the Patagonian scallop (bottom) is promoted by benthic-pelagic coupling processes which are particularly strong in austral spring (Franco et al., 2017). Therefore, we focus on the temperature trend in spring (October–November–December).
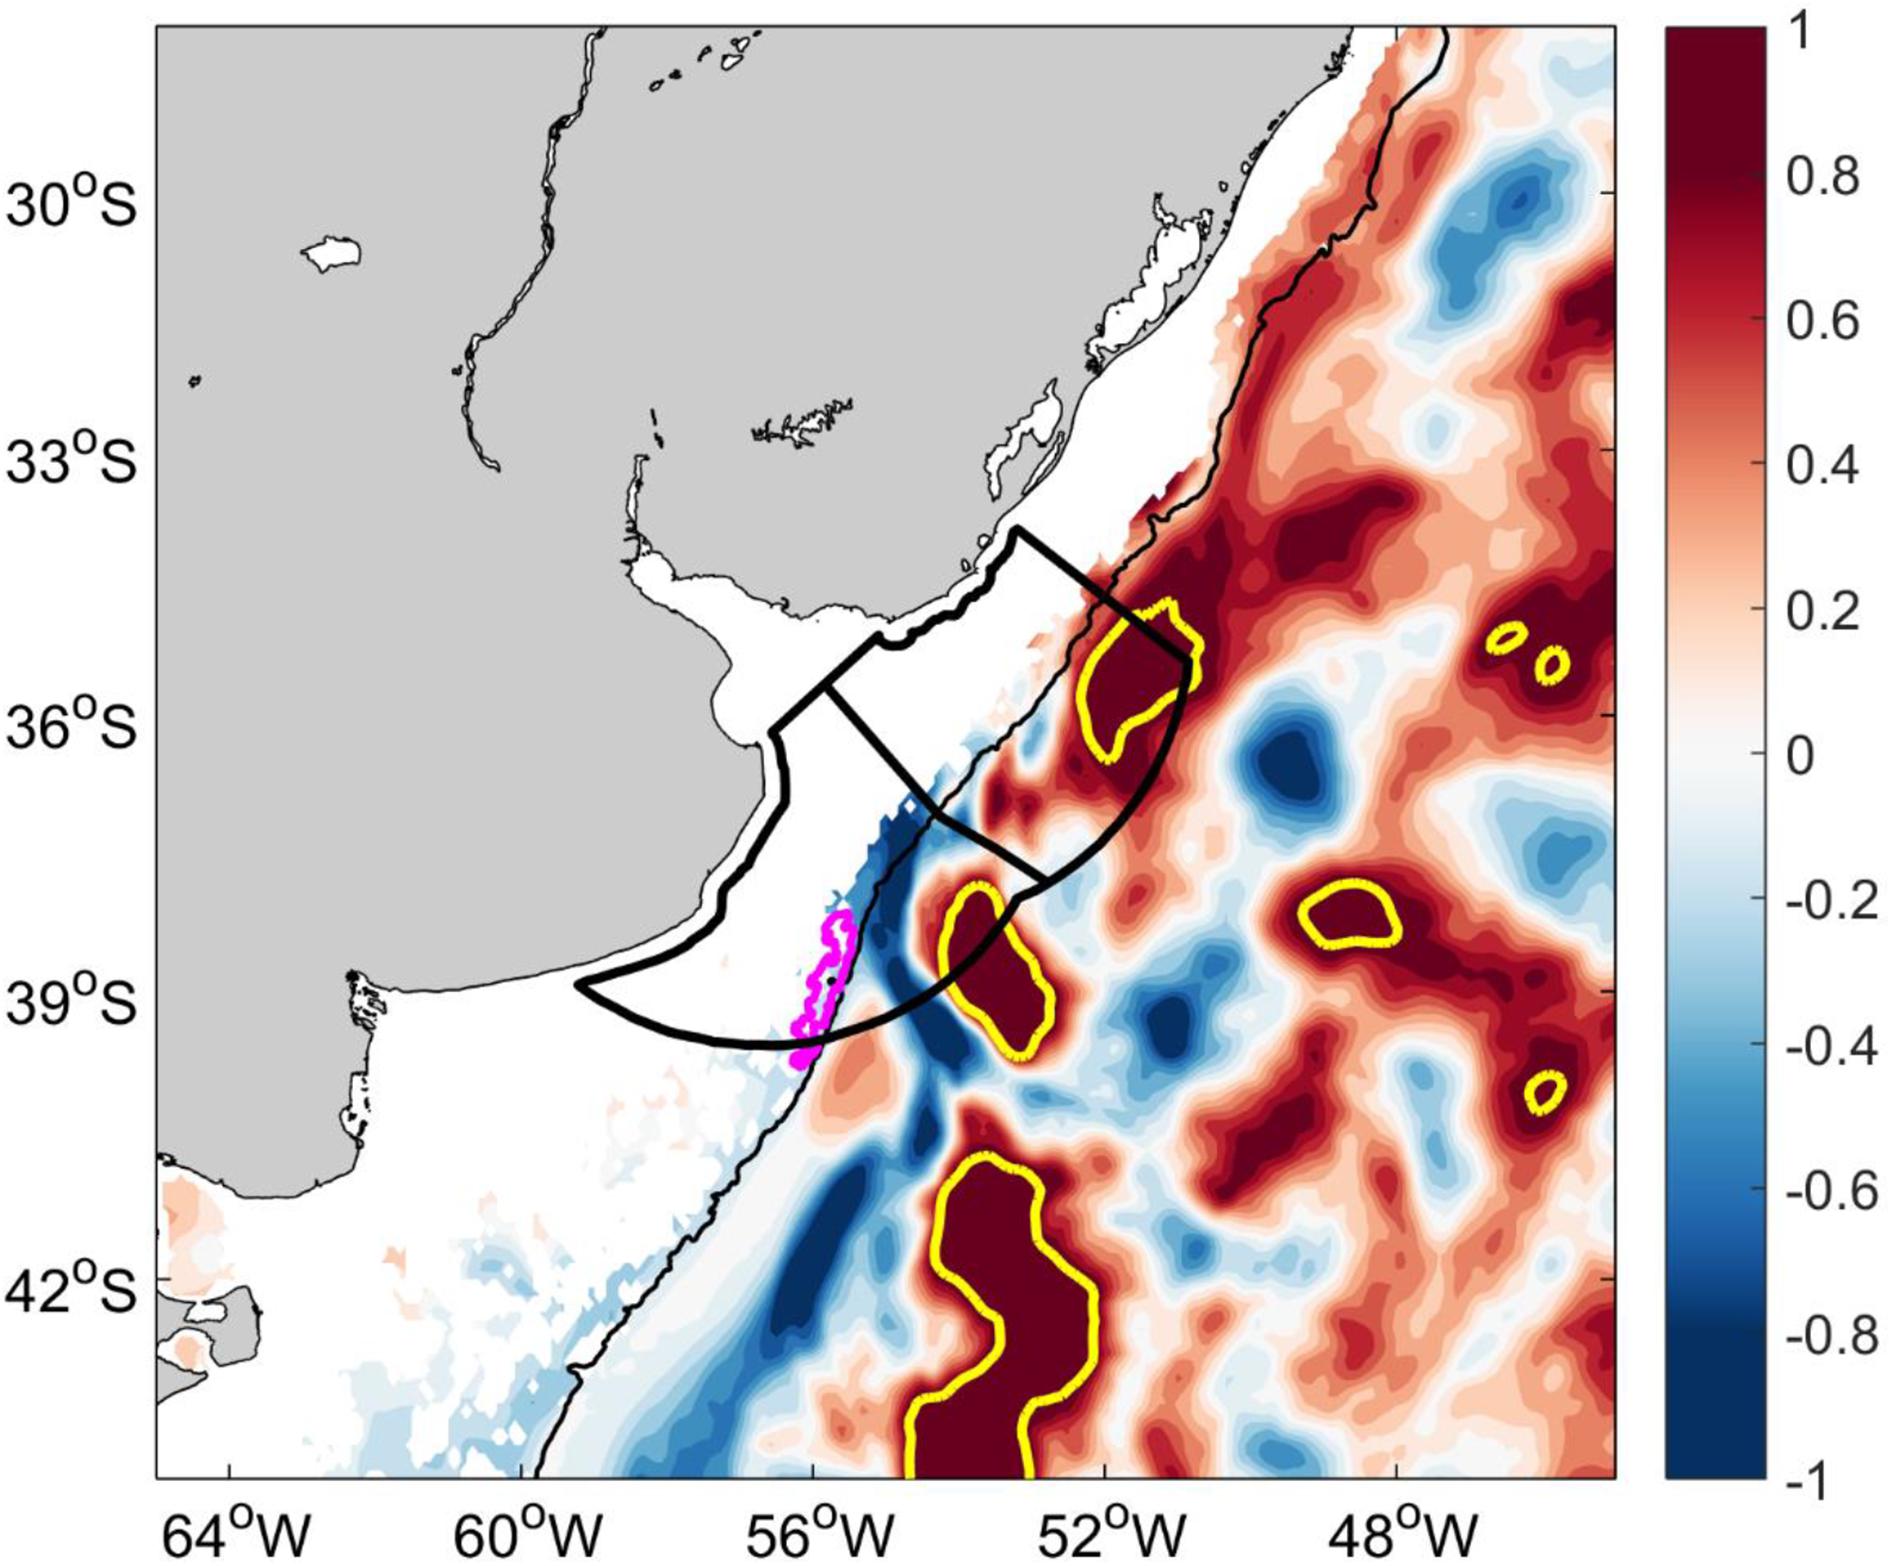
Figure 8. GLORYS12 temperature trend (°C/decade) during spring of 2003–2017 at 92 m. The Argentina-Uruguay Common Fishing Zone (AUCFZ) is shown by two heavy-black polygons. The northernmost and largest Patagonian scallop bed is shown by a magenta polygon. Trends higher than 1°C/decade are depicted by a heavy yellow line. The 200 m isobath is shown in black.
The model shows a clear warming trend along the path of the BC north of 37°S over the past 15 years with positive trends over the outer shelf, shelf break, slope and oceanic regions north of 37°S at 92 m depth in spring (Figure 8). As Patagonian scallop is a cold-water affinity species this warming trend and its projected southward displacement implies a trend toward unfavorable thermal conditions for the species. While this study focuses on the kinematics of the region, the dynamics of the driving mechanisms of those trends will be addressed in a separate study.
It is widely recognized that climate change must be incorporated into species conservation and management (Hannah et al., 2002; Grémillet and Boulinier, 2009; Evans et al., 2010; Hamann et al., 2010; O’Brien et al., 2013). Satellite derived surface chlorophyll-a distributions indicate that the SWAO, and the Argentine shelf in particular, present abundant phytoplankton concentrations (Gregg et al., 2005). Nonetheless, there are limited in situ observations of plankton composition and primary productivity observations (e.g., Lutz et al., 2018) and therefore the detection of ocean warming-driven impacts is constrained. Our results indicate negative trends of MLD over the Argentine mid-shelf and shelf break, which could alleviate light limitation and result in an increase in primary productivity (Figures 2A,B). This is in accordance with the 2% increase in annual surface chlorophyll-a concentration observed in the mid- and outer shelf regions of the SWAO (Marrari et al., 2017) during 1998–2017. These changes in surface chlorophyll-a concentration are likely associated with changes in the cold, nutrient-rich water supplied by MC onto the adjacent, seasonally stratified waters of the outer shelf (Valla and Piola, 2015).
In the SWAO, surface warming induced by climate change is reported from GLORYS12 along the BC path, the BMC, the RdlP, and over the Patagonian inner and mid-shelf (Figure 3A). Higher positive temperature trends reported from GLORYS12 throughout the whole water column (surface to 100 m depth) along the path of the BC and BMC regions are consistent with the southward shift of the BC (Figures 3A, 4A,C,E). Subsurface warming over the continental shelf is reported from the southern of Brazil, RdlP, and over the Patagonian inner and mid-shelf (Figures 4A,C). Our study provides initial evidence on the vertical extent of the main hotspots of the SWAO.
We also explored the potential impacts of ocean warming on two thermally constrained species. Water temperature plays a key role in the seasonal occurrence of sea turtles in high-latitude foraging grounds in the SWAO (González Carman et al., 2012, 2016a; Vélez-Rubio et al., 2018). The potential distribution of C. mydas in the region is explained by both, SST and bathymetry. SST increases its relative contribution to the model during the “leaving” and “absent” periods of turtle behavior, when individuals are most likely to be spatially constrained by temperature (Figure 5, Supplementary Figure S2). The warming implied by the displacement of mean surface isotherms likely drove the southward displacement of the species in the region during the period 2003–2017 (Figure 6). This is in agreement with the observed and projected poleward displacement of the thermal habitat of loggerhead turtles (Caretta caretta) reported by Witt et al. (2010).
Potential impacts of ocean warming on C. mydas in the SWAO are diverse. First, an increase in SST could imply an expansion of the optimal thermal habitat available for the species. For example, if the mean 18°C isotherm − critical for C. mydas when arriving to and remaining at Argentine shelf waters − continues displacing southward (Figure 6), the potential distribution of the species could also extend poleward. This seems a plausible hypothesis given that similar poleward displacements have been suggested for other sea turtle species such as loggerheads and leatherbacks (Dermochelys coriacea) in the North Atlantic (McMahon and Hays, 2006; Hawkes et al., 2007). In addition, subsurface ocean warming observed at 20 m depth in areas highly used by C. mydas (Figure 4), suggest a vertical expansion of the optimal thermal habitat.
However, the sea turtle distribution is likely driven by factors other than temperature. Sea turtles − especially C. mydas− show high fidelity to foraging areas (see Hart and Fujisaki, 2010 for a review), which may constrain exploration and settlement in alternative foraging grounds. Nevertheless, at least some juveniles of C. mydas in the SWAO show more behavioral plasticity compared to individuals of populations at lower latitudes. They are neither strictly herbivore nor neritic, as the canonical knowledge on the species claims. In summer and fall, juveniles forage most of the time in estuarine areas where no submerged macrophytes are found. In winter and spring, they either migrate northward to warm coastal areas where macroalgae and seagrass are available or inhabit deep-water areas (>200 m) compatible with a pelagic feeding behavior on gelatinous plankton (González Carman et al., 2012, 2014). Therefore, this behavioral plasticity exhibited by C. mydas could favor the exploration of new foraging areas.
Another factor driving sea turtle distribution is food availability (Witt et al., 2010). Brazilian seagrass communities are being affected by eutrophication, increased storm frequency, and sediment shifts associated with climate change (Short et al., 2006). Increased temperatures negatively affect growth and calcification of subtropical macroalgae, posing a great threat to macroalgal populations (Koch et al., 2013; Graba-Landry et al., 2018). But compelling evidence suggests that jellyfish abundances fluctuate with climatic cycles (Condon et al., 2013), with the majority of the temperate species studied increasing their abundance in warm temperatures due to increased asexual reproduction (Purcell, 2005; Purcell et al., 2007). Ocean warming may increase many populations of gelatinous species and trigger changes in its distribution and timing (Purcell, 2005; Purcell et al., 2007). This can be beneficial for C. mydas feeding on jellyfish in the SWAO, although trends in jellyfish abundance are ambiguous (Brotz et al., 2012; Condon et al., 2012).
An additional potential impact of ocean warming on C. mydas in the SWAO is a shift in the timing of seasonal movements (i.e., arriving earlier and leaving later). The southward displacement of the 15°C isotherm, critical for C. mydas when leaving Argentine shelf waters in May (Figure 5H), could potentially trigger a longer seasonal residency in these relatively high latitudes, along with increased foraging times if food availability is unchanged.
Besides the species considered in this study, the SWAO - especially the Argentine and Uruguayan shelves up to 20–50 m of depth - is a key ecological area for several megafaunal species of conservation value such as the loggerhead and leatherback turtles, the Brown-eyed albatross (Thalassarche melanophris), two sea lions (Otaria flavescens and Arctocephalus australis), among others (González Carman et al., 2016b). The potential impacts of ocean warming on some of these species might not be directly related to availability of optimal thermal habitats/periods or thermal tolerance, but to changes in the populations of their main prey species.
A key question emerging from our study is how climate change will impact the distribution and thermal tolerance of marine species in the SWAO. To answer this question and to overcome the high uncertainty levels associated with global predictive climate models (Franco et al., 2020), outputs from future regional models with higher horizontal resolution than Coupled Model Intercomparison Project (CMIP5)-class models (1° × 1°) will be necessary to better resolve changes in the circulation over the SWAO shelf and then the changes in marine species distribution.
The poleward displacement of warm tropical and subtropical waters of the BC (Figure 7) may have a strong impact on the productivity of SBF and the sustainability of the northernmost scallop beds. These benthic cold-water affinity communities that inhabit the outer shelf and shelf break region along the MC benefit from shelf-break upwelling and benthic-pelagic processes induced by MC. The southward shift of the BC could trigger significant changes on productivity of northern extent of the SBF. The resilience capacity of the benthic communities dependent on SBF productivity is also a key issue which requires further investigation. Stronger warming trends in subsurface waters reported by our study (Figure 8) are consistent with observations from Artana et al. (2019), who report a long-term trend of BC intensification and warming at 36°S in the upper 1,000 m (see their Figures 13A,C). The southward displacement of the tropical BC waters and the induced changes in the advection of BC deeper waters are suggested to induce such changes in the warming trend of deeper waters (their Figures 2, 13). In a climate change scenario, warming of the BC and BMC is expected to continue during the 21st century, driven by the southward shift of the BC and the weakening of the MC transport (Yang et al., 2016, 2020; de Souza et al., 2019). This southward shift of water masses may induce a gradual warming over outer shelf and shelf break regions. The shelf break region currently under the influence of the northernmost extent of the MC (south of ∼38°S), where the largest Patagonian scallop bed is located, may be particularly vulnerable to such poleward displacement of warm waters.
A poleward shift of the subtropical gyres of the oceans and a fast warming of western boundary currents like the BC have been reported during the past decades (Yang et al., 2016, 2020). In addition, large changes in the strength and position of the western boundary currents have already been observed (Van Gennip et al., 2017). Therefore, we suggest that future impacts of climate change could affect import commercial fisheries and the conservation of several marine species in other regions located near poleward extension of western boundary currents.
Planning of analytical techniques in response to the increasing vulnerability of targeted fish stocks and affected communities to climate driven effects is required to support decision making (Ogier et al., 2020). Level of feasibility, risk of negative effects, and expected benefit in responding to a specific climate challenge should be evaluated based on a selected sub-set of options. Regional network between scientists, fisheries managers, and government stakeholder groups are required to plan the first steps to identify and evaluate the implications of temporal and distributional effects of implementing adaptation options (Ogier et al., 2020).
Surface and subsurface warming in the SWAO has been occurring at least during the past four decades, particularly in highly productive areas such as the RdlP, the BMC and the SBF. Given the high uncertainty levels associated with predictions of global climate models (Franco et al., 2020), outputs from future regional models with higher horizontal resolution will be necessary to better resolve the potential changes in the circulation over the SWAO shelf and their potential impact on species distributions.
Ocean warming in the SWAO has potential impacts on the ecology of two thermally restricted species - C. mydas and Z. patagonica. Selection of case studies - as done here - to assess species exposure and sensitivity to ocean warming, and modeling of species response to climate changes are necessary to advance our understanding of the biological impact of climate change. These actions will be useful on the implementation of conservation programs (such as the National Plans of Action) and stock assessments of commercially important species.
Given the lack of long-term monitoring programs to address the impacts of climate change on marine biota in the SWAO, our results provide evidence to call the attention of stakeholders and decision makers on marine conservation and fishery management. These results are a useful basis toward better management strategies in the context of climate change.
In rapidly warming regions urgent efforts are needed to establish inter-disciplinary networks to set management and adaptation pathways, promote global learning, and implement adaptation options to cope with future changes in climate, the oceans, the marine species they host, their ecosystem services and the socioecological systems they conform.
Publicly available datasets were analyzed in this study. This data can be found here: Copernicus Marine Environment Monitoring Service (CMEMS) (https://marine.copernicus.eu/).
BF conceived and developed the idea and design of the original manuscript, led sections 1, 3.1, 3.2, 3.4, 4, and 5, prepared the original manuscript, critically revised all versions of manuscript, and adapted Figure 1 and prepared Figures 2, 3, 4, 7, and 8. VGC led sections 2.1, 2.2, contributed with the temperature trends calculation, made substantial contributions and revised critically all versions of manuscript. VC led sections 2.3 and 3.3, refined the content and scope of the original manuscript, made substantial contributions, critically revised all versions of the manuscript, prepared Figures 5 and 6, Supplementary Tables S1–S3, and Supplementary Figures S1, S2. All authors contributed according to their expertise to section 4 and approved the final manuscript.
VC acknowledges the financial support of NASA through grants NNX17AH20G and National Science Foundation through grants OCE-1559550, OCE-1357530, and OCE-1830856. VGC received funding from Wildlife Conservation Society, Inter-American Institute for Global Change Research (IAI) CRN 2076, Fondo para la Conservación Ambiental from Banco Galicia, the Cleveland Metroparks Zoo–Scott Neotropical Fund, and FONCyT (PICT 2099-2013) and (PICT 1575-2017). This is INIDEP contribution no. 2227.
The authors declare that the research was conducted in the absence of any commercial or financial relationships that could be construed as a potential conflict of interest.
BF and VGC are supported by Consejo Nacional de Investigaciones Científicas y Técnicas (CONICET). The temperature data, from observations and model outputs, are available at Copernicus Marine Environment Monitoring Service (CMEMS) (https://marine.copernicus.eu/). We are grateful for the insightful and constructive suggestions and comments made by two reviewers.
The Supplementary Material for this article can be found online at: https://www.frontiersin.org/articles/10.3389/fmars.2020.563394/full#supplementary-material
Acha, E. M., Simionato, C. G., Carozza, C., and Mianzan, H. (2012). Climate-induced year-class fluctuations of whitemouth croaker Micropogonias furnieri (Pisces, Sciaenidae) in the Río de la Plata estuary, Argentina–Uruguay. Fish. Oceanogr. 21, 58–77. doi: 10.1111/j.1365-2419.2011.00609.x
Artana, C., Ferrari, R., Koenig, Z., Sennéchael, N., Saraceno, M., Piola, A. R., et al. (2018). Malvinas Current volume transport at 41 S: a 24 yearlong time series consistent with mooring data from 3 decades and satellite altimetry. J. Geophys. Res. Oceans 123, 378–398. doi: 10.1002/2017jc013600
Artana, C., Provost, C., Lellouche, J. M., Rio, M. H., Ferrari, R., and Sennéchael, N. (2019). The Malvinas current at the confluence with the brazil current: inferences from 25 Years of Mercator Ocean reanalysis. J. Geophys. Res. Oceans 124, 7178–7200. doi: 10.1029/2019jc015289
Bogazzi, E., Baldoni, A., Rivas, A., Martos, P., Reta, R., Orensanz, J. M., et al. (2005). Spatial correspondence between areas of concentration of Patagonian scallop (Zygochlamys patagonica) and frontal systems in the southwestern Atlantic. Fish. Oceanogr. 14, 359–376. doi: 10.1111/j.1365-2419.2005.00340.x
Brotz, L., Cheung, W. W., Kleisner, K., Pakhomov, E., and Pauly, D. (2012). Increasing jellyfish populations: trends in large marine ecosystems. Hydrobiologia 690, 3–20. doi: 10.1007/978-94-007-5316-7_2
Burrows, M. T., Schoeman, D. S., Richardson, A. J., Molinos, J. G., Hoffmann, A., and Buckley, L. B. (2014). Geographical limits to species-range shifts are suggested by climate velocity. Nature 507, 492–496. doi: 10.1038/nature12976
Campos, E. J. D., Gonçalves, J. E., and Ikeda, Y. (1995). Water mass characteristics and geostrophic circulation in the South Brazil Bight – Summer of 1991. J. Geophys. Res. 100, 18537–18550. doi: 10.1029/95jc01724
Campos, P., and Cardona, L. (2019). Individual variability in the settlement of juvenile green turtles in the western South Atlantic Ocean: relevance of currents and somatic growth rate. Mar. Ecol. Progr. Ser. 614, 173–182. doi: 10.3354/meps12909
Ciocco, N. F., Lasta, M. L., Narvarte, M., Bremec, C., Bogazzi, E., Valero, J., et al. (2006). “Fisheries and aquaculture: Argentina,” in Scallops: Biology, Ecology and Aquaculture, eds S. E. Shumway and G. J. Parsons (Amsterdam: Elsevier), 1251–1283. doi: 10.1016/s0167-9309(06)80053-0
Combes, V., and Matano, R. P. (2014). A two-way nested simulation of the oceanic circulation in the southwestern Atlantic. J. Geophys. Res. Oceans 119, 731–756. doi: 10.1002/2013jc009498
Condon, R. H., Duarte, C. M., Pitt, K. A., Robinson, K. L., Lucas, C. H., Sutherland, K. R., et al. (2013). Recurrent jellyfish blooms are a consequence of global oscillations. PNAS 110, 1000–1005.
Condon, R. H., Graham, W. M., Duarte, C. M., Pitt, K. A., Lucas, C. H., Haddock, S. H. D., et al. (2012). Questioning the Rise of Gelatinous Zooplankton in the World’s Oceans. Bioscience 62, 160–169. doi: 10.1525/bio.2012.62.2.9
Coyne, M. S., and Godley, B. J. (2005). Satellite Tracking and Analysis Tool (STAT): an integrated system for archiving, analyzing and mapping animal tracking data. Mar. Ecol. Progr. Ser. 301, 1–7. doi: 10.3354/meps301001
Cragg, S. M. (2016). “Biology and ecology of scallop larvae,” in Developments in Aquaculture and Fisheries Science, eds S. E. Shumway and G. J. Parsons (Amsterdam: Elsevier), 31–83. doi: 10.1016/b978-0-444-62710-0.00002-x
de Souza, M. M., Mathis, M., and Pohlmann, T. (2019). Driving mechanisms of the variability and long-term trend of the Brazil–Malvinas confluence during the 21st century. Clim. Dyn. 53, 6453–6468. doi: 10.1007/s00382-019-04942-7
Edrén, S. M. C., Wisz, M. S., Teilmann, J., Dietz, R., and Söderkvist, J. (2010). Modelling spatial patterns in harbour porpoise satellite telemetry data using maximum entropy. Ecography 33, 698–708. doi: 10.1111/j.1600-0587.2009.05901.x
Elith, J., Phillips, S. J., Hastie, T., Dudík, M., Chee, Y. E., and Yates, C. J. (2011). A statistical explanation of MaxEnt for ecologists. Divers. Dist. 17, 43–57. doi: 10.1111/j.1472-4642.2010.00725.x
Evans, P. G. H., Pierce, G. J., and Panigada, S. (2010). Climate change and marine mammals. J. Mar. Biol. Ass. UK 90, 1483–1487.
Franco, B. C., Defeo, O., Piola, A. R., Barreiro, M., Yang, H., Ortega, L., et al. (2020). Climate change impacts on the atmospheric circulation, ocean, and fisheries in the southwest South Atlantic Ocean: a review. Climatic Change doi: 10.1007/s10584-020-02783-6
Franco, B. C., Palma, E. D., Combes, V., Acha, E. M., and Saraceno, M. (2018). Modeling the offshore export of Subantarctic Shelf Waters from the Patagonian shelf. J. Geophys. Res.: Oceans 123, 4491–4502. doi: 10.1029/2018jc013824
Franco, B. C., Palma, E. D., Combes, V., and Lasta, M. L. (2017). Physical processes controlling passive larval transport at the Patagonian Shelf Break Front. J. Sea Res. 124, 17–25. doi: 10.1016/j.seares.2017.04.012
Frazier, J. (1984). Las tortugas marinas en el océano Atlántico Sur Occidental. Asoc. Herpetol. Argentina 2, 2–21.
Fuentes, M. M. P. B., Maynard, J. A., Guinea, M., Bell, I. P., Werdell, P. J., and Hamann, M. (2009). Proxy indicators of sand temperature help project impacts of global warming on sea turtles in northern Australia. Endang. Spec. Res. 9, 33–40. doi: 10.3354/esr00224
Fuentes, M. M. P. B., Pike, D. A., Dimatteo, A., and Wallace, B. P. (2013). Resilience of marine turtle regional management units to climate change. Glob. Change Biol. 19, 1399–1406. doi: 10.1111/gcb.12138
Gianelli, I., Ortega, L., Marín, Y., Piola, A. R., and Defeo, O. (2019). Evidence of ocean warming in Uruguay’s fisheries landings: the mean temperature of the catch approach. Mar. Ecol. Progr. Ser. 625, 115–125. doi: 10.3354/meps13035
Goni, G. J., Bringas, F., and DiNezio, P. N. (2011). Observed low frequency variability of the Brazil current front. J. Geophys. Res. Oceans 116:C10. doi: 10.1029/2011JC007198
González Carman, V., Botto, F., Gaitán, E., Albareda, D., Campagna, C., and Mianzan, H. (2014). A jellyfish diet for the herbivorous green turtle Chelonia mydas in the temperate SW Atlantic. Mar. Biol. 161, 339–349. doi: 10.1007/s00227-013-2339-9
González Carman, V., Álvarez, K. C., Prosdocimi, L., Inchaurraga, M. C., Dellacasa, R. F., Faiella, A., et al. (2011). Argentinian coastal waters: a temperate habitat for three species of threatened sea turtles. Mar. Biol. Res. 7, 500–508. doi: 10.1080/17451000.2010.528772
González Carman, V., Bruno, I., Maxwell, S., Álvarez, K., Albareda, D., Acha, E. M., et al. (2016a). Habitat use, site fidelity and conservation opportunities for juvenile loggerhead sea turtles in the Río de la Plata, Argentina. Mar. Biol. 163:20.
González Carman, V., Mandiola, A., Alemany, D., Dassis, M., Seco Pon, J. P., Prosdocimi, L., et al. (2016b). Distribution of megafaunal species in the Southwestern Atlantic: key ecological areas and opportunities for marine conservation. ICES J. Mar. Sci. 73, 1579–1588. doi: 10.1093/icesjms/fsw019
González Carman, V., Falabella, V., Maxwell, S., Albareda, D., Campagna, C., and Mianzan, H. (2012). Revisiting the ontogenetic shift paradigm: the case of juvenile green turtles in the SW Atlantic. J. Exp. Mar. Biol. Ecol. 429, 64–72. doi: 10.1016/j.jembe.2012.06.007
Graba-Landry, A., Hoey, A. S., Matley, J. K., Sheppard-Brennand, H., Poore, A. G., Byrne, M., et al. (2018). Ocean warming has greater and more consistent negative effects than ocean acidification on the growth and health of subtropical macroalgae. Mar. Ecol. Progr. Ser. 595, 55–69. doi: 10.3354/meps12552
Gregg, W. W., Casey, N. W., and McClain, C. (2005). Recent trends in global ocean chlorophyll. Geophys. Res. Lett. 32:L03606. doi: 10.1029/2004GL021808
Grémillet, D., and Boulinier, T. (2009). Spatial ecology and conservation of seabirds facing global climate change: a review. Mar. Ecol. Progr. Ser. 391, 121–137. doi: 10.3354/meps08212
Guinehut, S., Dhomps, A.-L., Larnicol, G., and Le Traon, P.-Y. (2012). High resolution 3-D temperature and salinity fields derived from in situ and satellite observations. Ocean Sci. 8, 845–857. doi: 10.5194/os-8-845-2012
Hamann, M., Fuentes, M. M. P. B., Ban, N., and Mocellin, V. (2013). “Climate change and marine turtles,” in The biology of sea turtles, Vol. 3, eds J. Wyneken, K. J. Lohmann, and J. A. Musick (Boca Raton: Taylor & Francis Group), 353–378. doi: 10.1201/b13895-14
Hamann, M., Godfrey, M. H., Seminoff, J. A., Arthur, K., Barata, P. C. R., Bjorndal, K. A., et al. (2010). Global research priorities for sea turtles: informing management and conservation in the 21st century. Endang. Spec. Res. 11, 245–269. doi: 10.3354/esr00279
Hannah, L., Midgley, G. F., and Millar, D. (2002). Climate change-integrated conservation strategies. Glob. Ecol. Biogeograph. 11, 485–495.
Hart, K. M., and Fujisaki, I. (2010). Satellite tracking reveals habitat use by juvenile green sea turtles Chelonia mydas in the Everglades, Florida, USA. Endang. Spec. Res. 11, 221–232. doi: 10.3354/esr00284
Hawkes, L. A., Broderick, A. C., Godfrey, M. H., and Godley, B. J. (2007). Investigating the potential impacts of climate change on a marine turtle population. Glob. Change Biol. 13, 923–932. doi: 10.1111/j.1365-2486.2007.01320.x
Hawkes, L. A., Broderick, A. C., Godfrey, M. H., and Godley, B. J. (2009). Climate change and marine turtles. Endang. Spec. Res. 7, 137–154. doi: 10.3354/esr00198
Hernandez, P. A., Graham, C. H., Master, L. L., and Albert, D. L. (2006). The effect of sample size and species characteristics on performance of different species distribution modeling methods. Ecography 29, 773–785. doi: 10.1111/j.0906-7590.2006.04700.x
Hobday, A. J., and Pecl, G. T. (2014). Identification of global marine hotspots: sentinels for change and vanguards for adaptation action. Rev. Fish. Biol. Fisher. 24, 415–425. doi: 10.1007/s11160-013-9326-6
Koch, M., Bowes, G., Ross, C., and Zhang, X. H. (2013). Climate change and ocean acidification effects on seagrasses and marine macroalgae. Glob. Change Biol. 19, 103–132. doi: 10.1111/j.1365-2486.2012.02791.x
Lellouche, J.-M., Greiner, E., Le Galloudec, O., Garric, G., Regnier, C., Drevillon, M., et al. (2018). Recent updates to the Copernicus Marine Service global ocean monitoring and forecasting real-time 1/12° high-resolution system. Ocean Sci. 14, 1093–1126. doi: 10.5194/os-14-1093-2018
Lellouche, J.-M., Le Galloudec, O., Drévillon, M., Régnier, C., Greiner, E., Garric, G., et al. (2013). Evaluation of global monitoring and forecasting systems at Mercator Ocean. Ocean Sci. 9, 57–81. doi: 10.5194/os-9-57-2013
Lumpkin, R., and Garzoli, S. (2011). Interannual to decadal changes in the western South Atlantic’s surface circulation. J. Geophys. Res. 116:C01014. doi: 10.1029/2010JC006285
Lutz, V., Segura, V., Dogliotti, A., et al. (2018). “Overview on primary production in the Southwestern Atlantic,” in Plankton Ecology of the Southwestern Atlantic, eds M. Hoffmeyer, M. Sabatini, F. Brandini, et al. (Cham: Springer), 101–126. doi: 10.1007/978-3-319-77869-3_6
Marrari, M., Piola, A. R., and Valla, D. (2017). Variability and 20-Year Trends in Satellite-Derived Surface Chlorophyll Concentrations in Large Marine Ecosystems around South and Western Central America. Front. Mar. Sci. 4:372. doi: 10.3389/fmars.2017.00372
Mauna, A. C., Botto, F., Franco, B. C., Schwartz, J. M., Acha, E. M., Lasta, M. L., et al. (2011). Shifts in an epibenthic trophic web across a marine frontal area in the southwestern Atlantic (Argentina). J. Sea Res. 66, 248–255. doi: 10.1016/j.seares.2011.08.005
Mazaris, A. D., Vokou, D., Almpanidou, V., Türkozan, O., and Sgardelis, S. P. (2015). Low conservatism of the climatic niche of sea turtles and implications for predicting future distributions. Ecosphere 6, 1–12.
McMahon, C. R., and Hays, G. C. (2006). Thermal niche, large-scale movements and implications of climate change for a critically endangered marine vertebrate. Glob. Change Biol. 12, 1330–1338. doi: 10.1111/j.1365-2486.2006.01174.x
Meylan, P. A., Meylan, A. B., and Gray, J. A. (2011). The ecology and migrations of sea turtles 8. Test of the developmental habitat hypothesis. Bull. Am. Mus. Nat. Hist. 357, 1–70. doi: 10.1206/357.1
Möller, O. O., Piola, A. R., Freitas, A. C., and Campos, E. J. (2008). The effects of river discharge and seasonal winds on the shelf off southeastern South America. Cont. Shelf Res. 28, 1607–1624. doi: 10.1016/j.csr.2008.03.012
O’Brien, S. M., Gallucci, V. F., and Hauser, L. (2013). Effects of species biology on the historical demography of sharks and their implications for likely consequences of contemporary climate change. Conserv. Gen. 14, 125–144. doi: 10.1007/s10592-012-0437-8
Ogier, E., Jennings, S., Fowler, A., Frusher, S., Gardner, C., Hamer, P., et al. (2020). Responding to Climate Change: Participatory Evaluation of Adaptation Options for Key Marine Fisheries in Australia’s South East. Front. Mar. Sci. 7:97. doi: 10.3389/fmars.2020.00097
Oliver, E. C., Donat, M. G., Burrows, M. T., Moore, P. J., Smale, D. A., Alexander, L. V., et al. (2018). Longer and more frequent marine heatwaves over the past century. Nat. Commun. 9:1324.
Pecl, G. T., Araújo, M. B., Bell, J. D., Blanchard, J., Bonebrake, T. C., Chen, I. C., et al. (2017). Biodiversity redistribution under climate change: impacts on ecosystems and human well-being. Science 355:eaai9214. doi: 10.1126/science.aai9214
Phillips, S. J., Anderson, R. P., and Schapire, R. E. (2006). Maximum entropy modeling of species geographic distributions. Ecol. Model. 190, 231–259. doi: 10.1016/j.ecolmodel.2005.03.026
Pikesley, S. K., Broderick, A. C., Cejudo, D., Coyne, M. S., Godfrey, M. H., Godley, B. J., et al. (2015). Modelling the niche for a marine vertebrate: a case study incorporating behavioral plasticity, proximate threats and climate change. Ecography 38, 803–812. doi: 10.1111/ecog.01245
Pikesley, S. K., Maxwell, S. M., Pendoley, K., Costa, D. P., Coyne, M. S., Formia, A., et al. (2013). On the front line: integrated habitat mapping for olive ridley sea turtles in the southeast Atlantic. Diver. Dist. 19, 1518–1530. doi: 10.1111/ddi.12118
Piola, A. R., Campos, E. J., Möller, O. O., Charo, M., and Martinez, C. (2000). Subtropical shelf front off eastern South America. J. Geophys. Res. Oceans 105, 6565–6578. doi: 10.1029/1999jc000300
Pritchard, P. C. H. (1997). “Evolution, phylogeny, and current status,” in The Biology of Sea Turtles, eds P. L. Lutz and J. A. Musick (Boca Raton: CRC Press), 1–28. doi: 10.1525/california/9780520250925.003.0001
Pujol, M.-I., Faugére, Y., Taburet, G., Dupuy, S., Pelloquin, C., Ablain, M., et al. (2016). DUACS DT2014: the new multi-mission altimeter data set reprocessed over 20 years. Ocean Sci. 12, 1067–1090. doi: 10.5194/os-12-1067-2016
Purcell, J. E. (2005). Climate effects on formation of jellyfish and ctenophore blooms: a review. J. Mar. Biol. Ass. UK 85, 461–476. doi: 10.1017/s0025315405011409
Purcell, J. E., Uye, S.-I., and Lo, W.-T. (2007). Anthropogenic causes of jellyfish blooms and their direct consequences for humans: a review. Mar. Ecol. Progr. Ser. 350, 153–174. doi: 10.3354/meps07093
R Development Core Team (2018). Available online at: http://cran.r-project.org (accessed April 30, 2020).
Schejter, L., Bremec, C., Akselman, R., Hernandéz, D., and Spivak, E. D. (2002). Annual feeding of the Patagonian scallop Zygochlamys patagonica (King and Broderip, 1832) in Reclutas bed (39°S–55°W). Argentine Sea. J. Shellfish. Res. 21, 549–555.
Short, F. T., Koch, E. W., Creed, J. C., Magalhaes, K. M., Fernandez, E., and Gaeckle, J. L. (2006). SeagrassNet monitoring across the Americas: case studies of seagrass decline. Mar. Ecol. 27, 277–289. doi: 10.1111/j.1439-0485.2006.00095.x
Soria, G., Orensanz, J. L., Morsán, E. M., Parma, A. M., and Amoroso, R. O. (2016). “Scallops biology, fisheries, and management in Argentina,” in Scallops: Biology, Ecology, Aquaculture, and Fisheries, eds S. E. Shumway and G. J. Parsons (Amsterdam: Elsevier), 1019–1046. doi: 10.1016/b978-0-444-62710-0.00025-0
Spotila, J. R., O’Connor, M. P., and Paladino, F. V. (1997). “Thermal biology,” in The Biology of Sea Turtles, Vol. 1, eds P. L. Lutz and J. A. Musick (Boca Raton, FL: CRC Press), 297–314.
Sunday, J. M., Pecl, G. T., Frusher, S., Hobday, A. J., Hill, N., Holbrook, N. J., et al. (2015). Species traits and climate velocity explain geographic range shifts in an ocean-warming hotspot. Ecol. Lett. 18, 944–953. doi: 10.1111/ele.12474
Szekeley, T., Gourrion, J., Pouliquen, S., and Reverdin, G. (2016). CORA, coriolis ocean dataset for reanalysis. SEANOE doi: 10.17882/46219
Valla, D., and Piola, A. R. (2015). Evidence of upwelling events at the northern Patagonian shelf break. J. Geophys. Res. Oceans 120, 7635–7656. doi: 10.1002/2015jc011002
Van Gennip, S. J., Popova, E. E., Yool, A., Pecl, G. T., Hobday, A. J., and Sorte, C. J. (2017). Going with the flow: the role of ocean circulation in global marine ecosystems under a changing climate. Glob. Change Biol. 23, 2602–2617. doi: 10.1111/gcb.13586
Vélez-Rubio, G. M., Cardona, L., López-Mendilaharsu, M., Martinez Souza, G., Carranza, A., Campos, P., et al. (2018). Pre and post-settlement movements of juvenile green turtles in the Southwestern Atlantic Ocean. J. Exp. Mar. Biol. Ecol. 501, 36–45. doi: 10.1016/j.jembe.2018.01.001
Vélez-Rubio, G. M., Estrades, A., Fallabrino, A., and Tomás, J. (2013). Marine turtle threats in Uruguayan waters: insights from 12 years of stranding data. Mar. Biol. 160, 2797–2811. doi: 10.1007/s00227-013-2272-y
Wisz, M. S., Hijmans, R., Li, J., Peterson, A. T., Graham, C., and Guisan, A. (2008). Effects of sample size on the performance of species distribution models. Divers. Dist. 14, 763–773. doi: 10.1111/j.1472-4642.2008.00482.x
Witt, M. J., Hawkes, L. A., Godfrey, M. H., Godley, B. J., and Broderick, A. C. (2010). Predicting the impacts of climate change on a globally distributed species: the case of the loggerhead turtle. J. Exper. Biol. 213, 901–911. doi: 10.1242/jeb.038133
Wu, L., Cai, W., Zhang, L., Nakamura, H., Timmermann, A., Joyce, T., et al. (2012). Enhanced warming over the global subtropical western boundary currents. Nat. Clim. Change 2, 161–166. doi: 10.1038/nclimate1353
Yang, H., Lohmann, G., Krebs-Kanzow, U., Ionita, M., Shi, X., Sidorenko, D., et al. (2020). Poleward shift of the major ocean gyres detected in a warming climate. Geophys. Res. Lett. 47:e2019GL085868. doi: 10.1029/2019GL085868
Yang, H., Lohmann, G., Wei, W., Dima, M., Ionita, M., and Liu, J. (2016). Intensification and poleward shift of subtropical western boundary currents in a warming climate. J. Geophys. Res. Oceans 121, 4928–4945. doi: 10.1002/2015jc011513
Young, N., Carter, L., and Evangelista, P. (2011). A MaxEnt Model v3.3.3e Tutorial (ArcGIS v10). Available online at: http://ibis.colostate.edu/WebContent/WS/ColoradoView/TutorialsDownloads/A_Maxent_Model_v7.pdf (accessed September 1, 2020).
Keywords: southwest South Atlantic Ocean, climate change, ocean warming, green sea turtle, Patagonian scallop, ocean governance
Citation: Franco BC, Combes V and González Carman V (2020) Subsurface Ocean Warming Hotspots and Potential Impacts on Marine Species: The Southwest South Atlantic Ocean Case Study. Front. Mar. Sci. 7:563394. doi: 10.3389/fmars.2020.563394
Received: 18 May 2020; Accepted: 07 September 2020;
Published: 25 September 2020.
Edited by:
Jon Lopez, Inter-American Tropical Tuna Commission, United StatesReviewed by:
Alistair James Hobday, Commonwealth Scientific and Industrial Research Organisation (CSIRO), AustraliaCopyright © 2020 Franco, Combes and González Carman. This is an open-access article distributed under the terms of the Creative Commons Attribution License (CC BY). The use, distribution or reproduction in other forums is permitted, provided the original author(s) and the copyright owner(s) are credited and that the original publication in this journal is cited, in accordance with accepted academic practice. No use, distribution or reproduction is permitted which does not comply with these terms.
*Correspondence: Bárbara C. Franco, YmFyYmFyYS5mcmFuY29AY2ltYS5mY2VuLnViYS5hcg==
Disclaimer: All claims expressed in this article are solely those of the authors and do not necessarily represent those of their affiliated organizations, or those of the publisher, the editors and the reviewers. Any product that may be evaluated in this article or claim that may be made by its manufacturer is not guaranteed or endorsed by the publisher.
Research integrity at Frontiers
Learn more about the work of our research integrity team to safeguard the quality of each article we publish.