- 1Laboratory of Fisheries Oceanography, Fisheries College, Ocean University of China, Qingdao, China
- 2Laboratory for Marine Fisheries Science and Food Production Processes, Pilot National Laboratory for Marine Science and Technology, Qingdao, China
- 3Frontiers Science Center for Deep Ocean Multispheres and Earth System, Ocean University of China, Qingdao, China
- 4East China Sea Fisheries Research Institute, Chinese Academy of Fishery Sciences, Shanghai, China
- 5Department of Biological Sciences, University of Bergen, Bergen, Norway
- 6Fisheries and Oceans Canada, Pacific Biological Station, Nanaimo, BC, Canada
Climate-induced ecosystem variability is an increasing concern in recent years. Integrated researches in the northeastern North Pacific have proved the ecological importance of the Pacific Decadal Oscillation (PDO), North Pacific Gyre Oscillation (NPGO), and El Niño–Southern Oscillation (ENSO) to the ecosystem variability. While in the northwestern North Pacific, researches have been independent of each other over different regional ecosystems, and identified relatively weak linkages between these climatic indices (e.g., PDO, NPGO, and ENSO) and variations in the regional ecosystems. Such disassociated researches with unidentified important climate variability patterns may have hampered a holistic understanding of climate-induced ecosystem variability in the northwestern North Pacific. Furthermore, non-stationarity in climate–biology relationships has been proven to be important for ecosystems in the northeastern North Pacific but has not yet been studied in the northwestern North Pacific. Therefore, this research compiles biological, environmental, and climatic data in ecosystems in the northwestern North Pacific and employs a suite of analytical techniques, aiming to provide a holistic understanding of the climate-induced ecosystem variability. It shows that ecosystems in the northwestern North Pacific had a leading regime shift in the late 1980s in response to climate variability. The Siberian High, Arctic Oscillation, and East Asian Monsoon exhibit greater ecological importance to ecosystem variability than the PDO, NPGO, and ENSO. Their variations contribute greatly to sea surface temperature changes and thus variations in ecosystems. Furthermore, modified models considering non-stationary relationships achieve better performances than stationary models, suggesting the existence of non-stationarity in climate–biology relationships in the northwestern North Pacific. This non-stationarity resulted from the decline in variance of the sea level pressure in Siberian High rather than the Aleutian Low as suggested by previous studies in the northeastern North Pacific. Our research provides an improved understanding of the climate-induced ecosystem variability in the northwestern North Pacific, offering implications for further research on the entire North Pacific.
Introduction
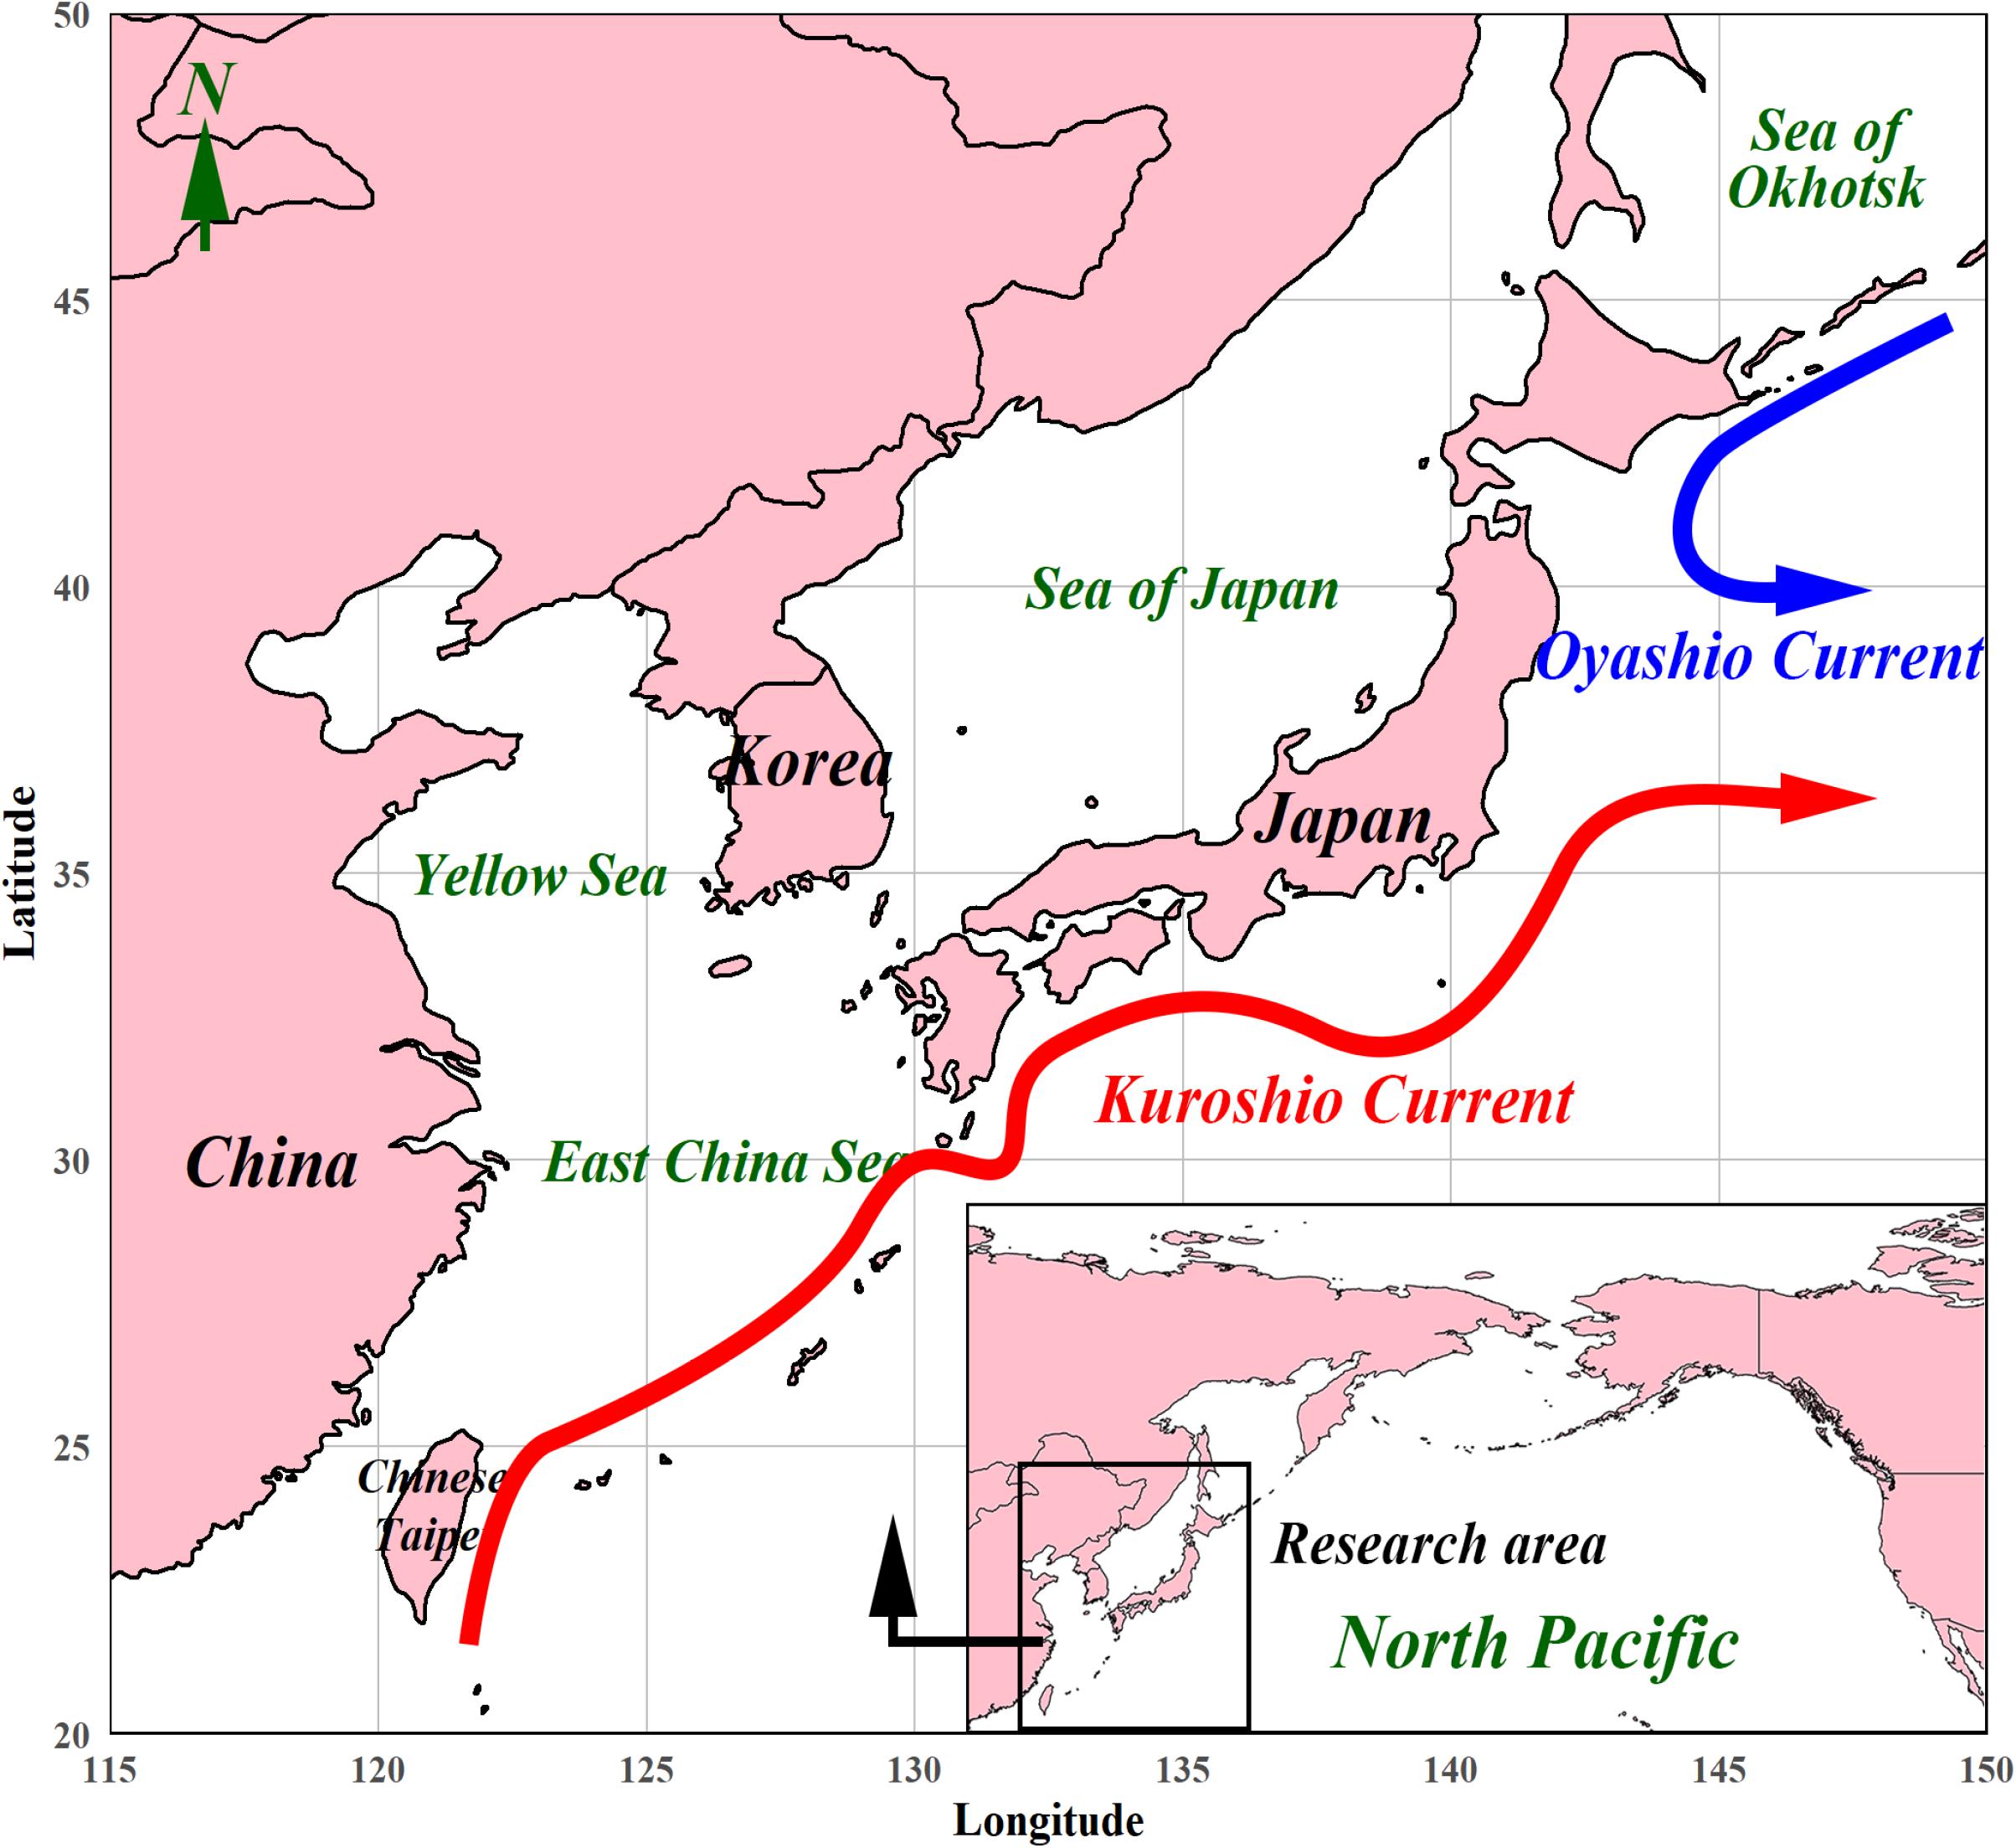
Climate-induced ecosystem variability has been one of the most noteworthy issues at a global scale in the 21st century (Doney et al., 2012). The North Pacific is characterized by pronounced decadal climate variability and has received much attention on the responses of ecosystems to changing climatic and environmental conditions (Hare and Mantua, 2000; Biondi et al., 2001; Overland et al., 2008; Yatsu et al., 2013; Reid et al., 2016). In the northeastern North Pacific, integrated studies based on the data compiled from multiple sources have provided holistic understandings of the climate-induced ecosystem variability (Benson and Trites, 2002; Mantua, 2004; Litzow and Mueter, 2014). Contrastingly, studies in the northwestern North Pacific (Figure 1) have been carried out independent of each other in different regions. Studies in Chinese (Ma et al., 2019), Korean (Zhang et al., 2000, 2007), and Japanese waters (Tian et al., 2006, 2008; Yatsu et al., 2013) have all demonstrated strong linkages between regional ecosystems and climatic/environmental conditions. However, these regional studies have not yet been integrated to show general patterns in climate–ecosystem relationships, which prevents from a holistic understanding of climate-induced ecosystem variability in the northwestern North Pacific. Therefore, an integrated study targeting at the northwestern North Pacific is in urgent need, which can promote understanding on the basin-scale climate-induced ecosystem variability in the North Pacific.
Studies have shown that low-frequency climate variability (red noise) in the North Pacific may have produced decadal-scale periods of stability separated by climatic regime shifts (Hsieh et al., 2005; Di Lorenzo and Ohman, 2013). It is also widely accepted that these shifts could result in community-level, basin-scale ecosystem regime shifts (Benson and Trites, 2002). Therefore, determining the specific climate variability pattern with ecological importance is of great necessity in understanding the climate-induced ecosystem variability and predicting ecosystem dynamics. Relevant studies in the North Pacific have proved the leading role of the Aleutian Low pressure system on regional climate and ecosystem variability (Minobe, 1999; Di Lorenzo and Ohman, 2013). In addition, the Pacific Decadal Oscillation (PDO), North Pacific Gyre Oscillation (NPGO), and El Niño–Southern Oscillation (ENSO) are presented as the primary climate variability patterns with considerable ecological importance and have been extensively used in the ecosystem variability researches in the northeastern North Pacific (Zhang et al., 1997; Mantua and Hare, 2002; Mantua, 2004; Di Lorenzo et al., 2008). However, spatial modes of these climate variability patterns exhibit weaker representation (small loadings) in the northwestern North Pacific than in the central and northeastern North Pacific. Therefore, these climate variability patterns may contribute less to ecosystem variability in the northwestern North Pacific. Aside from the patterns in the PDO, NPGO, and ENSO (SOI), studies in the northwestern North Pacific always consider the Arctic Oscillation Index (AOI), East Asian Monsoon Index (MOI), and Siberian High Index (SHI, variations in Siberian High pressure system) in order to explore more potential links between climate variability patterns and regional environment and ecosystem variability (Tian et al., 2014; Jung et al., 2017; Liu et al., 2019; Ma et al., 2019). However, the ecological importance of these climate variability patterns has not been evaluated, which may hamper predictions of climate-induced ecosystem variability in the northwestern North Pacific. Thus, it is imperative to determine the driving climate variability patterns that have ecological importance in the northwestern North Pacific for better understanding of climate-induced ecosystem variability and predicting ecosystem dynamics.
Traditionally, the relationships between ecosystem variability and environmental conditions have been modeled as a stochastic process with a fixed probability density without considering time-dependent non-stationarity (Wolkovich et al., 2014). However, time-dependent non-stationarity can be important to take into account in light of changing climatic conditions. An example of the non-stationary relationships between physical drivers and biological responses is the changing climate–salmon relationships in around 1988/89 in the Gulf of Alaska, which is attributed to the altered importance of PDO and NPGO, forced by declined variance in the sea level pressure of the Aleutian Low (Litzow et al., 2018). Consequently, traditional understanding of the stationary pressure–state relationships could be subjected to climate variability, and statistical models based on the stationary assumption tend to be biased, resulting in the loss of their predictive skills and the failure to warn of potential ecological risks (Williams and Jackson, 2007; Dormann et al., 2013). Therefore, considering the existence of non-stationary relationships and their underlying mechanisms is crucial for the better illustration of climate–ecosystem relationships and the development of adaptive management strategies.
Considering the above demands, we conducted an integrated study to explore ecologically important climate variability patterns and to determine non-stationary driver–response relationships between climate variability patterns and ecosystem variability in the northwestern North Pacific. Marine fishery catch data from China, Japan, and Korea, as well as sea surface temperature and climatic indices were compiled for this integrated study. We employed traditional statistical approaches, their modified versions for tackling non-stationarity, as well as machine learning methods to explore the possible linkages between climate/environment drivers and ecosystem responses. This study aims to: (1) explore long-term variability in ecosystem, environment, and climate in the northwestern North Pacific; (2) evaluate the ecological importance of candidate climate variability patterns; (3) identify non-stationarity in relationships between biological responses and physical drivers; and (4) compare the climate-induced ecosystem variability in the northwestern and northeastern North Pacific.
Materials and Methods
Data
Based on the availability of qualified long-term time-series, we compiled fishery catch data of various taxa (with raw catch data shown in Supplementary Figure S1) from four countries/regions (i.e., China, Chinese Taipei, Japan, and Korea) for the period of 1963–2016 (the longest time period considering both data availability and comprehensiveness). Although the taxa from different countries/regions may differ, they generally fall into three major categories, large predatory, demersal, and small pelagic (Supplementary Table S1), such that they well represent the ecosystem structures (Tian et al., 2014). Within each country/region, taxa that account for a small amount of catch (<1% of total catch) are excluded to avoid the effects of potential recording errors. Missing data (24 missing grids in a total of 3,240 data grids with a missing rate of 0.74%) were filled with the averages of two adjacent years’ data. Each catch data time-series by species and by fishing country/region were standardized with a mean of 0 and a variance of 1 such that temporal variabilities in the different data sets are comparable.
Monthly sea surface temperature (SST) grid data with a resolution of 0.5°(latitude × longitude) for the range of 20°–50°N, 115°–150°E and for the period of 1963–2010 were obtained from the Simple Ocean Data Assimilation Reanalysis (SODA) (Carton and Giese, 2008). Winter (from January to March, a period that is frequently used in relevant researches in northwestern North Pacific) (e.g., Ma et al., 2019) means in each SST grid were calculated for further analyses.
The PDO, NPGO, SOI, AOI, SHI, and MOI have been used to define climate variability in the North Pacific (Ropelewski and Jones, 1987; Thompson and Wallace, 1998; Hare and Mantua, 2000; Gong et al., 2001; Mantua and Hare, 2002; Wu and Wang, 2002; Di Lorenzo et al., 2008). All these large-scale climatic indices (short as CIs) are derived from open-access online databases and have a monthly temporal scale for the period 1963–2016. These CIs are well documented and largely associated with variations in the fish communities and ecosystems in the North Pacific (Tian et al., 2014; Liu et al., 2019; Ma et al., 2019). Large-scale climate processes, such as the Siberian High, Aleutian Low, Arctic Oscillation, and Asian Monsoon are most active in winter. Therefore, winter (from December to February, a period that is frequently used in relevant researches) average for each index was calculated to represent climatic variability. Details for CIs are provided in Supplementary Table S2.
Data Analyses
Intensive increasing trends were observed in the catch data from China (Supplementary Figure S1). Such increasing trends may have been caused by socioeconomic factors such as the growing consumption of seafoods and the increasing marine fishing effort, which can lead to biased results. Therefore, we used engine power of the total Chinese marine fishing boats (from Chinese Fishery Statistics, Supplementary Figure S2) as a surrogate for fishing effort to remove the potential socioeconomic trends in catch data from China. The detrend analyses were applied through linear regressions with catch data from China as response variables and engine power as an explanatory variable. Residuals from the linear regressions were then used as the detrended catch time-series for further analyses. The detrend analyses were not conducted for catch data from the other three countries/regions as no obvious socioeconomic trend was observed in their catch time-series (Supplementary Figure S1).
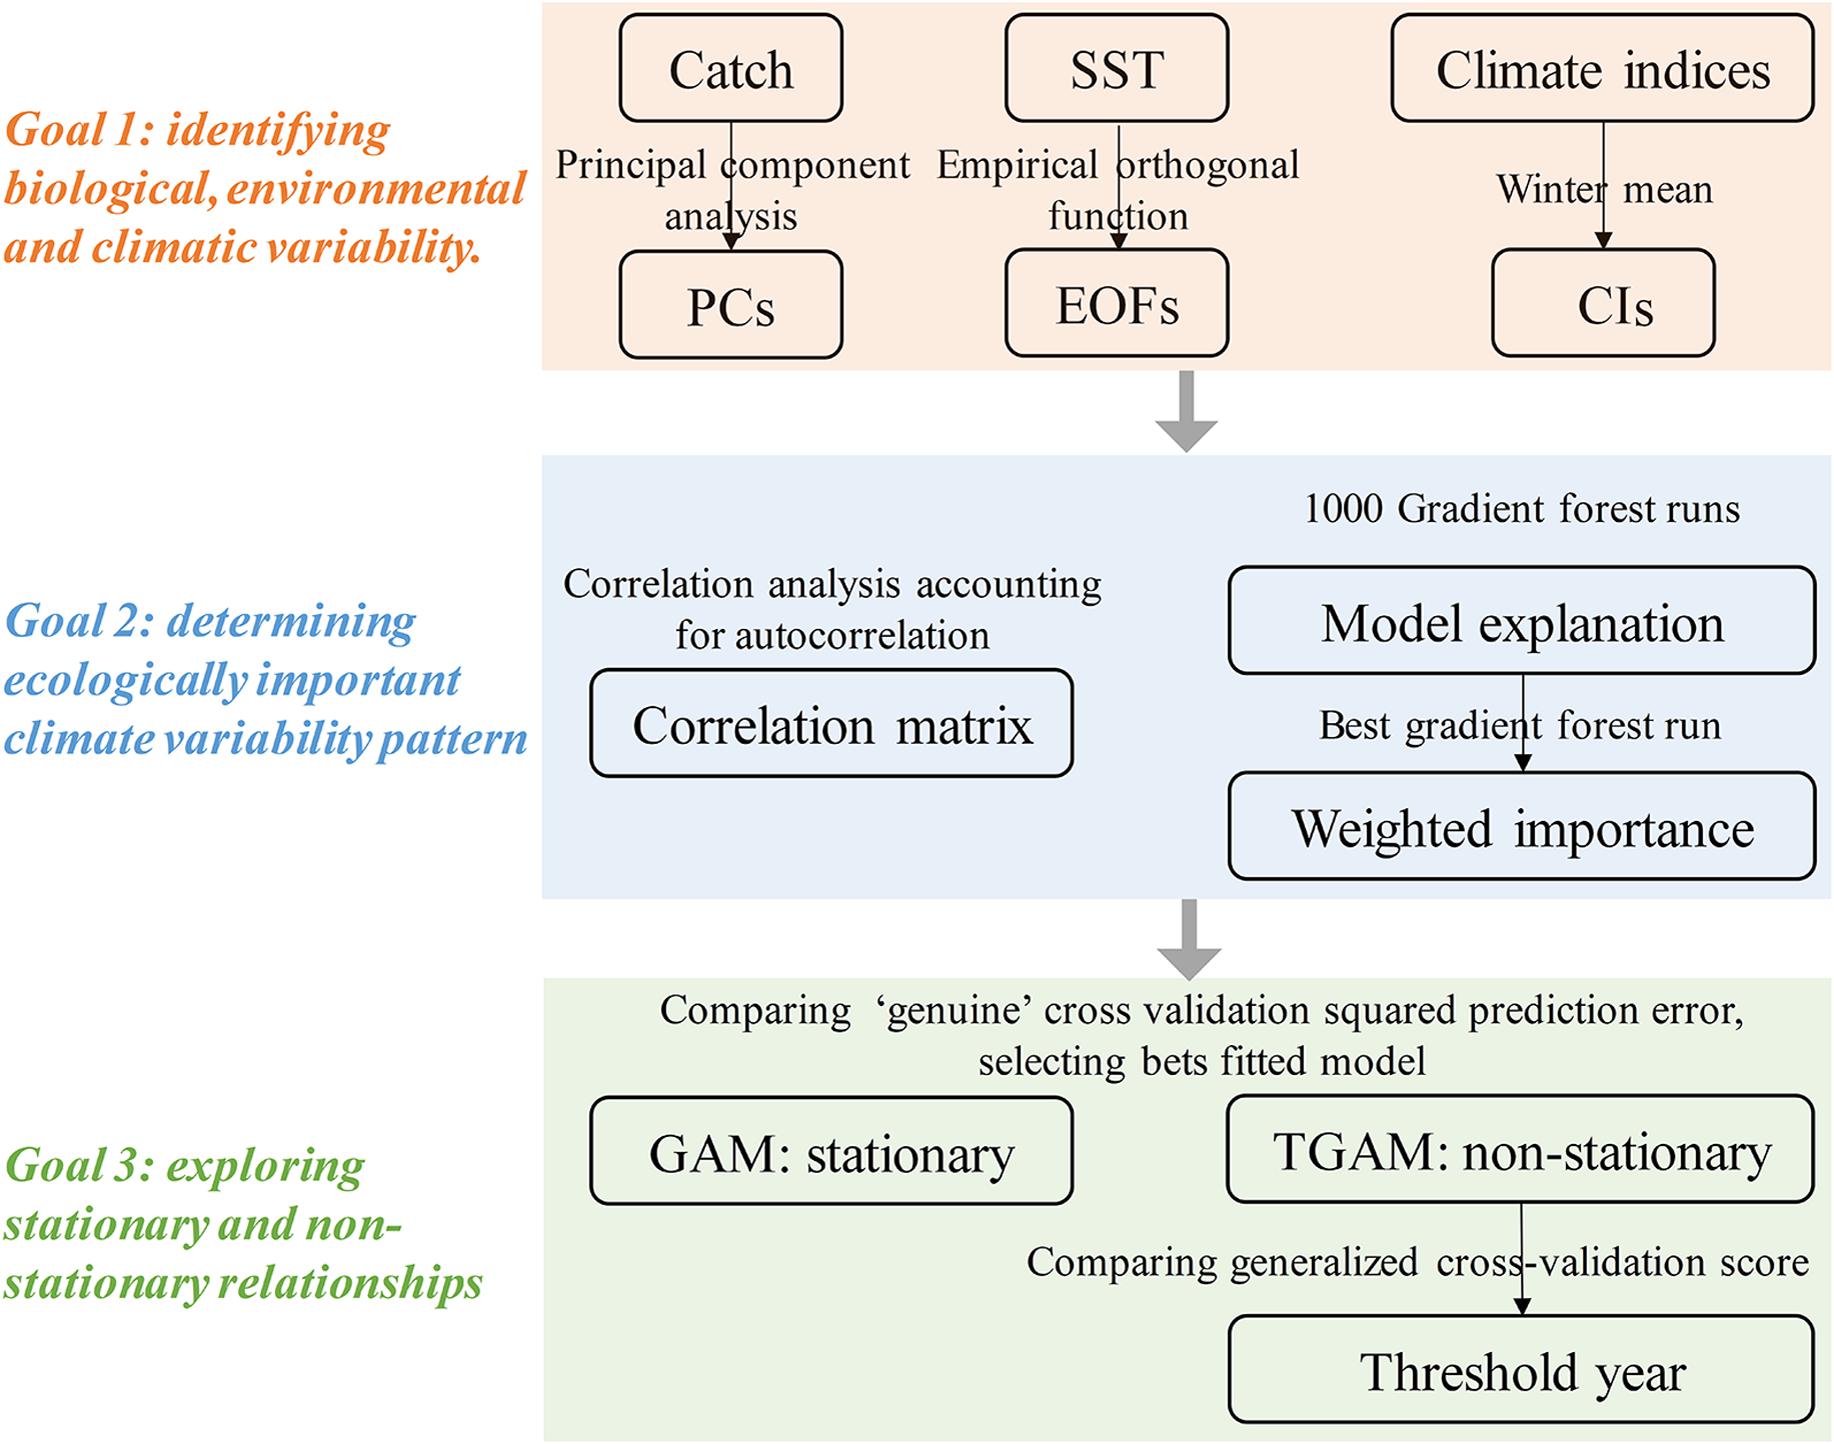
Principal component analysis (PCA) is often used to identify the most important patterns of common variability in catch data sets (e.g., Hare and Mantua, 2000; Litzow and Mueter, 2014). We applied PCA to the fishery catch data of all taxa within the four countries/regions and calculated the principal component scores (short as PCs) to represent ecosystem variability. Empirical orthogonal function (EOF) analysis is often used to identify the most important SST variability pattern in the North Pacific (Weare and Nasstrom, 1982; Litzow et al., 2018). We calculated spatial modes and time coefficients (short as EOFs) to represent the regional SST variability. Both PCA and EOF were conducted by singular value decomposition (SVD) of the centered and scaled (average 0 and variance 1) data matrix, which was considered a preferred method for numerical accuracy (Venables and Ripley, 2002). Both PCA and EOF analyses were conducted by the “prcomp” routine (psych package) in R (R Core Team, 2018).
The sequential t-test analysis of regime shift (STARS) developed by Rodionov (2004) was applied to detect trends and regime shifts in the PC scores. Because of the presence of autocorrelation in the PC scores, we used a “prewhitening” procedure before applying the STARS algorithm (ver.3) (Rodionov, 2006). STARS results are determined by the cut-off length for proposed regimes (L) and the Huber weight parameters (H), which defines the range of departure from the observed mean beyond which observations are considered as outliers. By exploratory analyses with STARS, L is set here to 15 and H to 1 with a significant level of 5%. STARS is written in Visual Basic for Application (VBA) for Microsoft Excel and is available at www.BeringClimate.noaa.gov (Rodionov and Overland, 2005).
Linear correlations among PCs, EOFs, and CIs were estimated using Pearson correlation analyses similar to those of Ma et al., 2019. The number of degrees of freedom of coefficients obtained from the significance tests was adjusted based on the potential autocorrelation in the covariates (Pyper and Peterman, 1998). Analyses were conducted using the “corr.test” routine (psych package) with supplementary scripts for the recalculation of effective degrees of freedom in R (R Core Team, 2018).
Gradient Forest (GF) analysis was employed to identify contributions of climatic (CIs) and environmental variability (EOFs) to biological variability (PCs). The gradient forest method is built upon random forests to capture complex relationships between potentially correlated predictors and multiple response variables by integrating individual random forest analyses over the different response variables (Ellis et al., 2012). In essence, random forests are regression trees that partition the response variable into two groups at a specific split value for each predictor p to maximize homogeneity. Along with other measures, gradient forests provide the goodness-of-fit, R2, for each response variable f and the importance weighted by R2. In this study, we ran the gradient forests 1,000 times to obtain the variability of R2. The run with the highest overall performance (R2) is then used for calculating weighted importance of predictors on responses. Analyses are conducted using the “gradientForest” package available online at http://gradientforest.r-forge.r-project.org/.
Generalized additive models (GAM) and threshold generalized additive models (TGAM) were applied to identify the types of relationships (stationary or non-stationary) between PCs (biological responses) and EOFs/CIs (physical drivers). A “stationary” relationship is better fitted by a single function throughout the entire period of time-series, and it is formulated using a GAM (Ciannelli et al., 2004):
where Y is the response variable PC, X is the predictor (or driver) EOF or CI, and s, α, and ε are smooth function (with k ≤ 3 to avoid overfitting), intercept, and error terms, respectively. By contrast, a “non-stationary” relationship is better fitted by different functions for different time periods, and the responses to drivers have an abrupt change over a threshold year (Litzow et al., 2018). The non-stationary relationship is formulated using a TGAM (with specific to two time periods) (Puerta et al., 2019):
where y is the threshold year that separates two periods with different responses to drivers. The y is between the 0.1 lower and the 0.9 upper quantiles of the time-series and is selected by minimizing the generalized cross validation score (GCV) of the model (Casini et al., 2009). To compare the fitness of stationary (GAMs) and non-stationary (TGAMs) models, the “genuine” cross validation squared prediction error (gCV) is computed, which accounts for the estimation of the threshold line and the estimation of the degrees of freedom for the functions appearing in all stationary and non-stationary formulations (Ciannelli et al., 2004). Analyses were conducted by the “mgcv” package in R (R Core Team, 2018).
Analyses flow is shown in Figure 2.
Results
Ecosystem, Environment, and Climate Variability
The first four PCs explain 63.19% of the total variance in ecosystem variability (Figure 3) with loadings on PCs shown in Supplementary Figure S3. PC1 has an increasing trend since the mid-1970s with a step-like change in 1986/87. PC2 decreases around the early 1970s before increasing in the late 1980s with step-like changes in 1974/75 and 1989/90. Prior to the late 1980s, PC3 was relatively stable before the late 1980s; however, it decreases till the mid-2000s with step-like changes in 1989/90 and 2004/05. PC4 has dramatic fluctuations before stabilizing in the 1980s with step-like changes in 1993/94 and 2006/07. PCs are characterized by significant multidecadal to decadal variability patterns with the most concentrated step-like changes in the late 1980s, which indicates that an ecosystem regime shift in the northwestern North Pacific may have happened in the late 1980s.
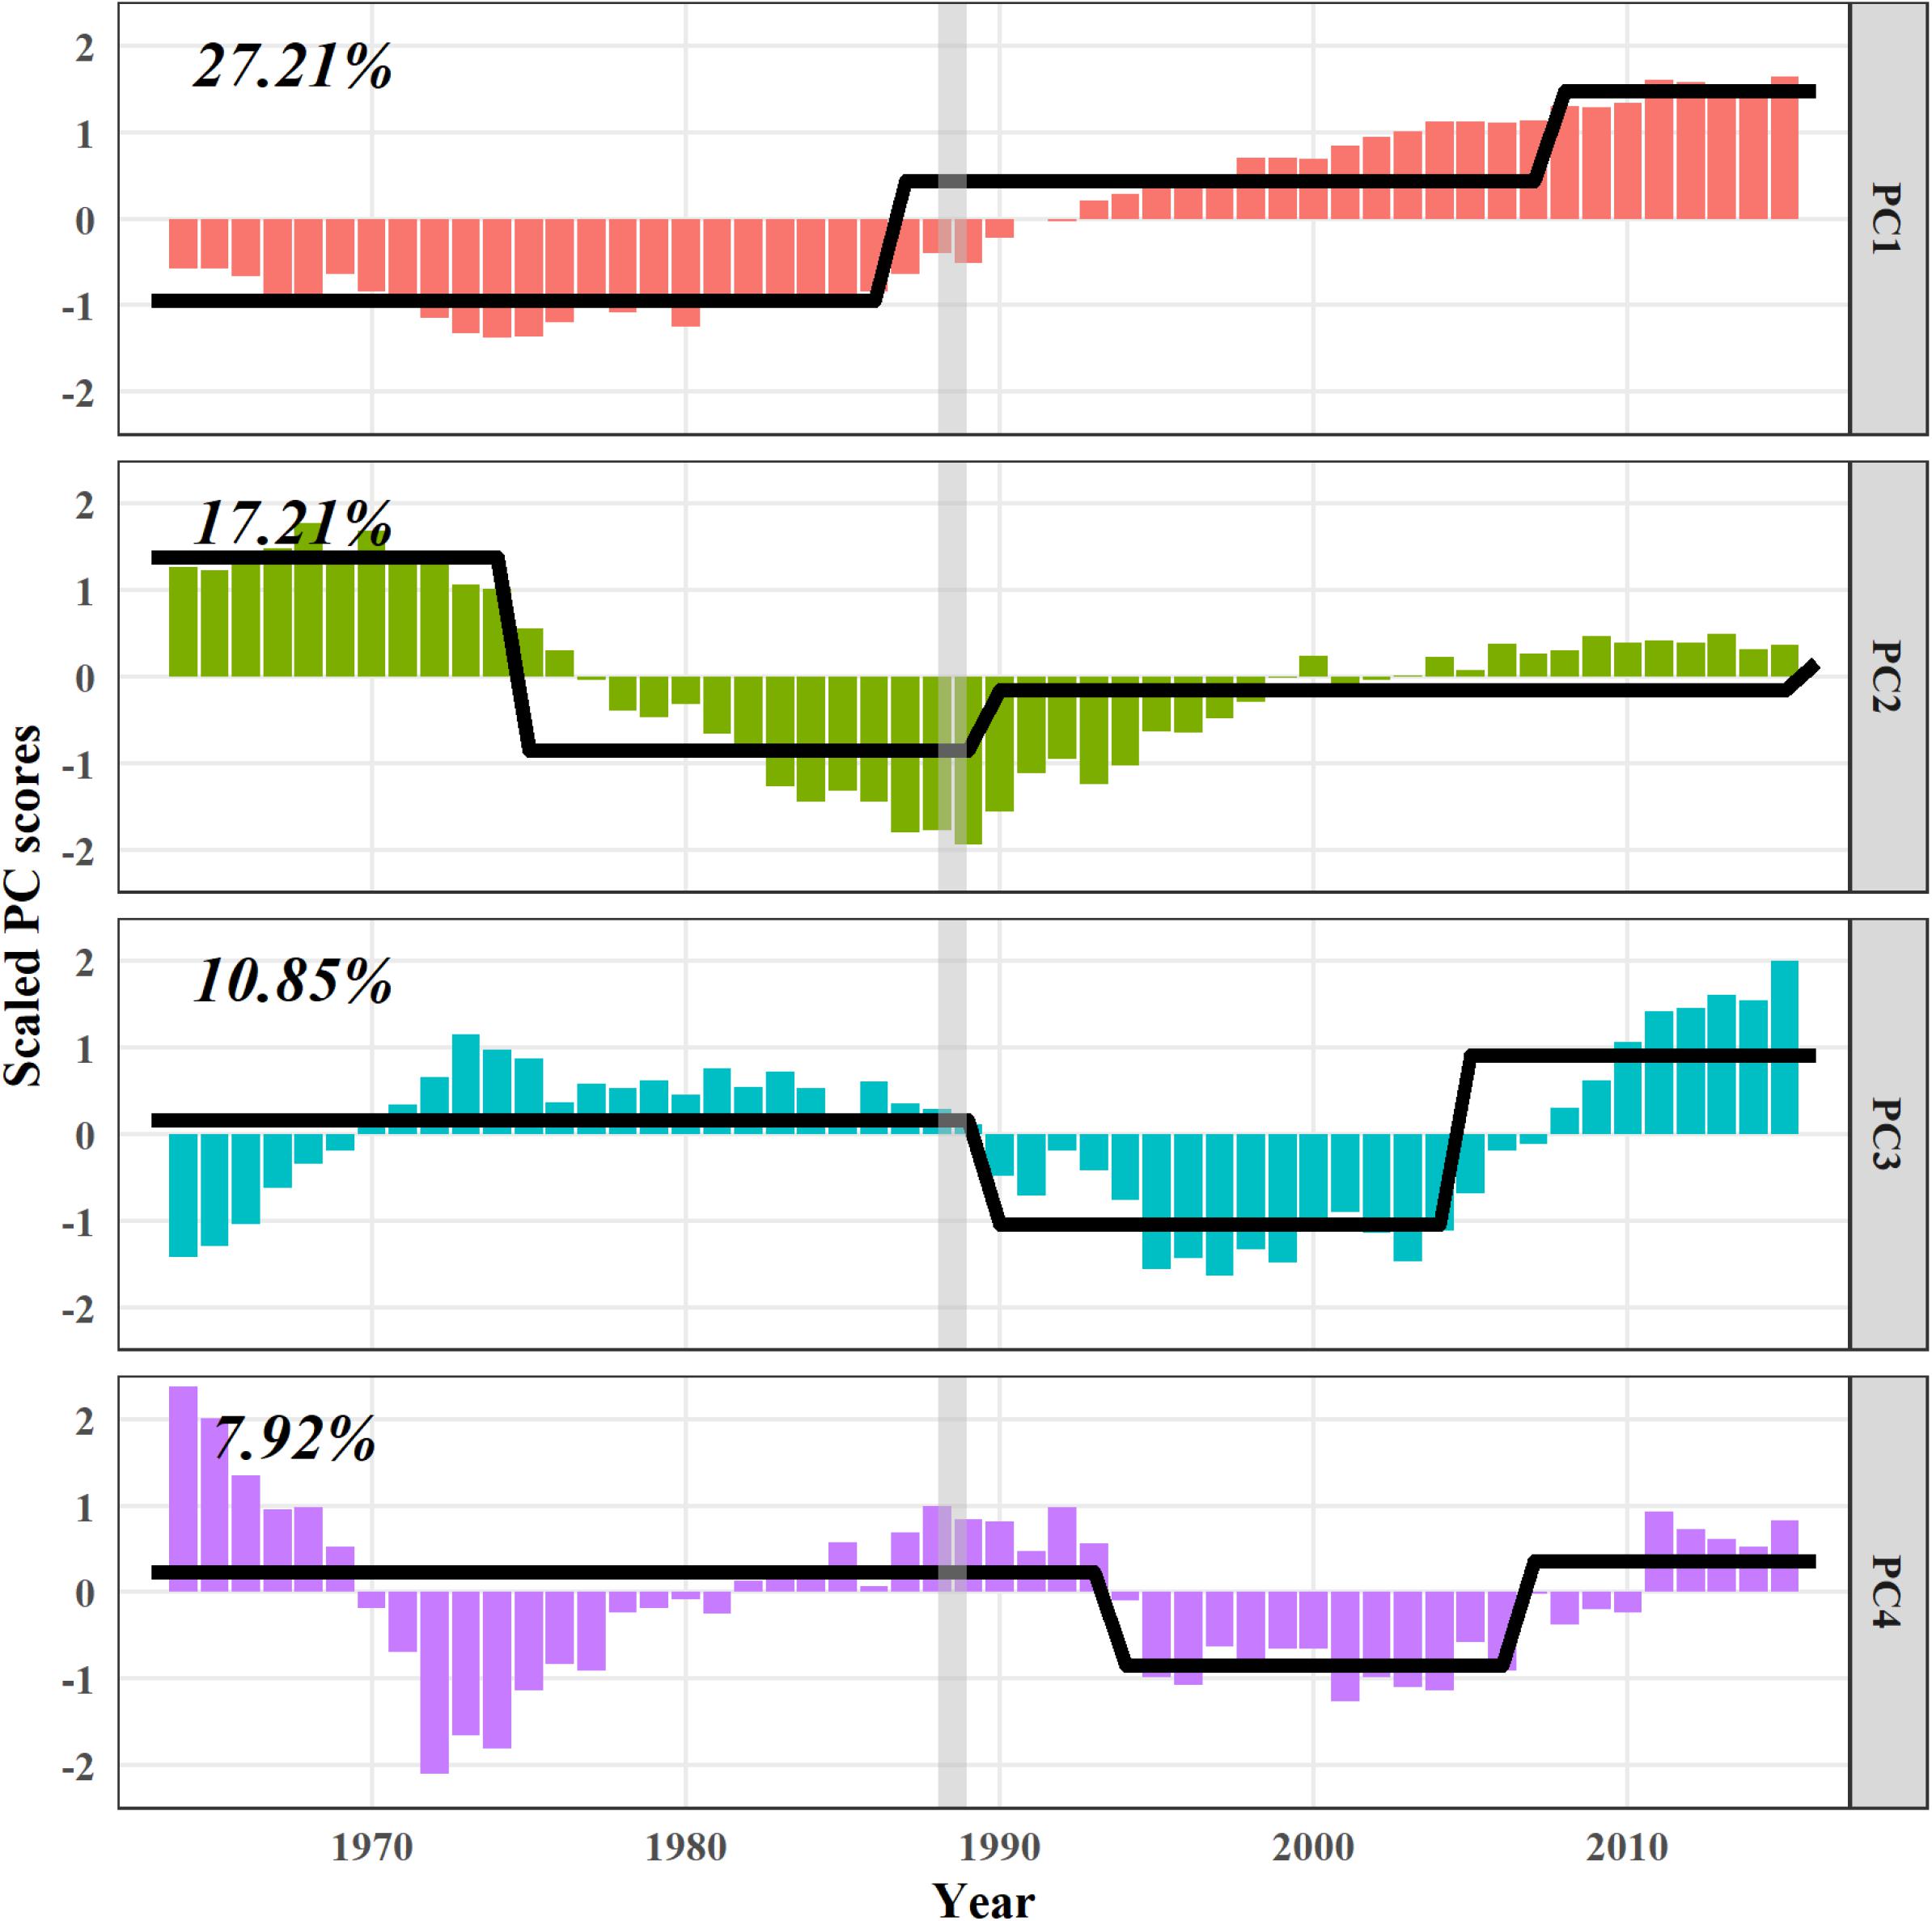
Figure 3. Trajectories of the first four principal components (PCs). Numbers indicate the percentage of variance explained by each PC. Black lines represent regime means calculated by STARS, and gray lines represent the concentrated step-like changes in the late 1980s.
The first four EOFs have an explanation of 51.65% of the total variance in SST variability (Figure 4). Spatial modes of EOFs are provided in Supplementary Figure S4. EOF1 shows an abrupt increase in the late 1980s with a step-like change in 1987/88. EOF2 decreases in the 1970s but increases in the late 1980s with step-like changes in 1989/90. EOF3 has a sharp increase in the early 1980s before showing interannual fluctuations with a step-like change in 1980/81. EOF4 shows large interannual fluctuations without any step-like change. Variability in EOFs has obvious decadal scale with step-like changes concentrated in the late 1980s, which indicates that possible regime shift in SST in the northwestern North Pacific happened in the late 1980s.
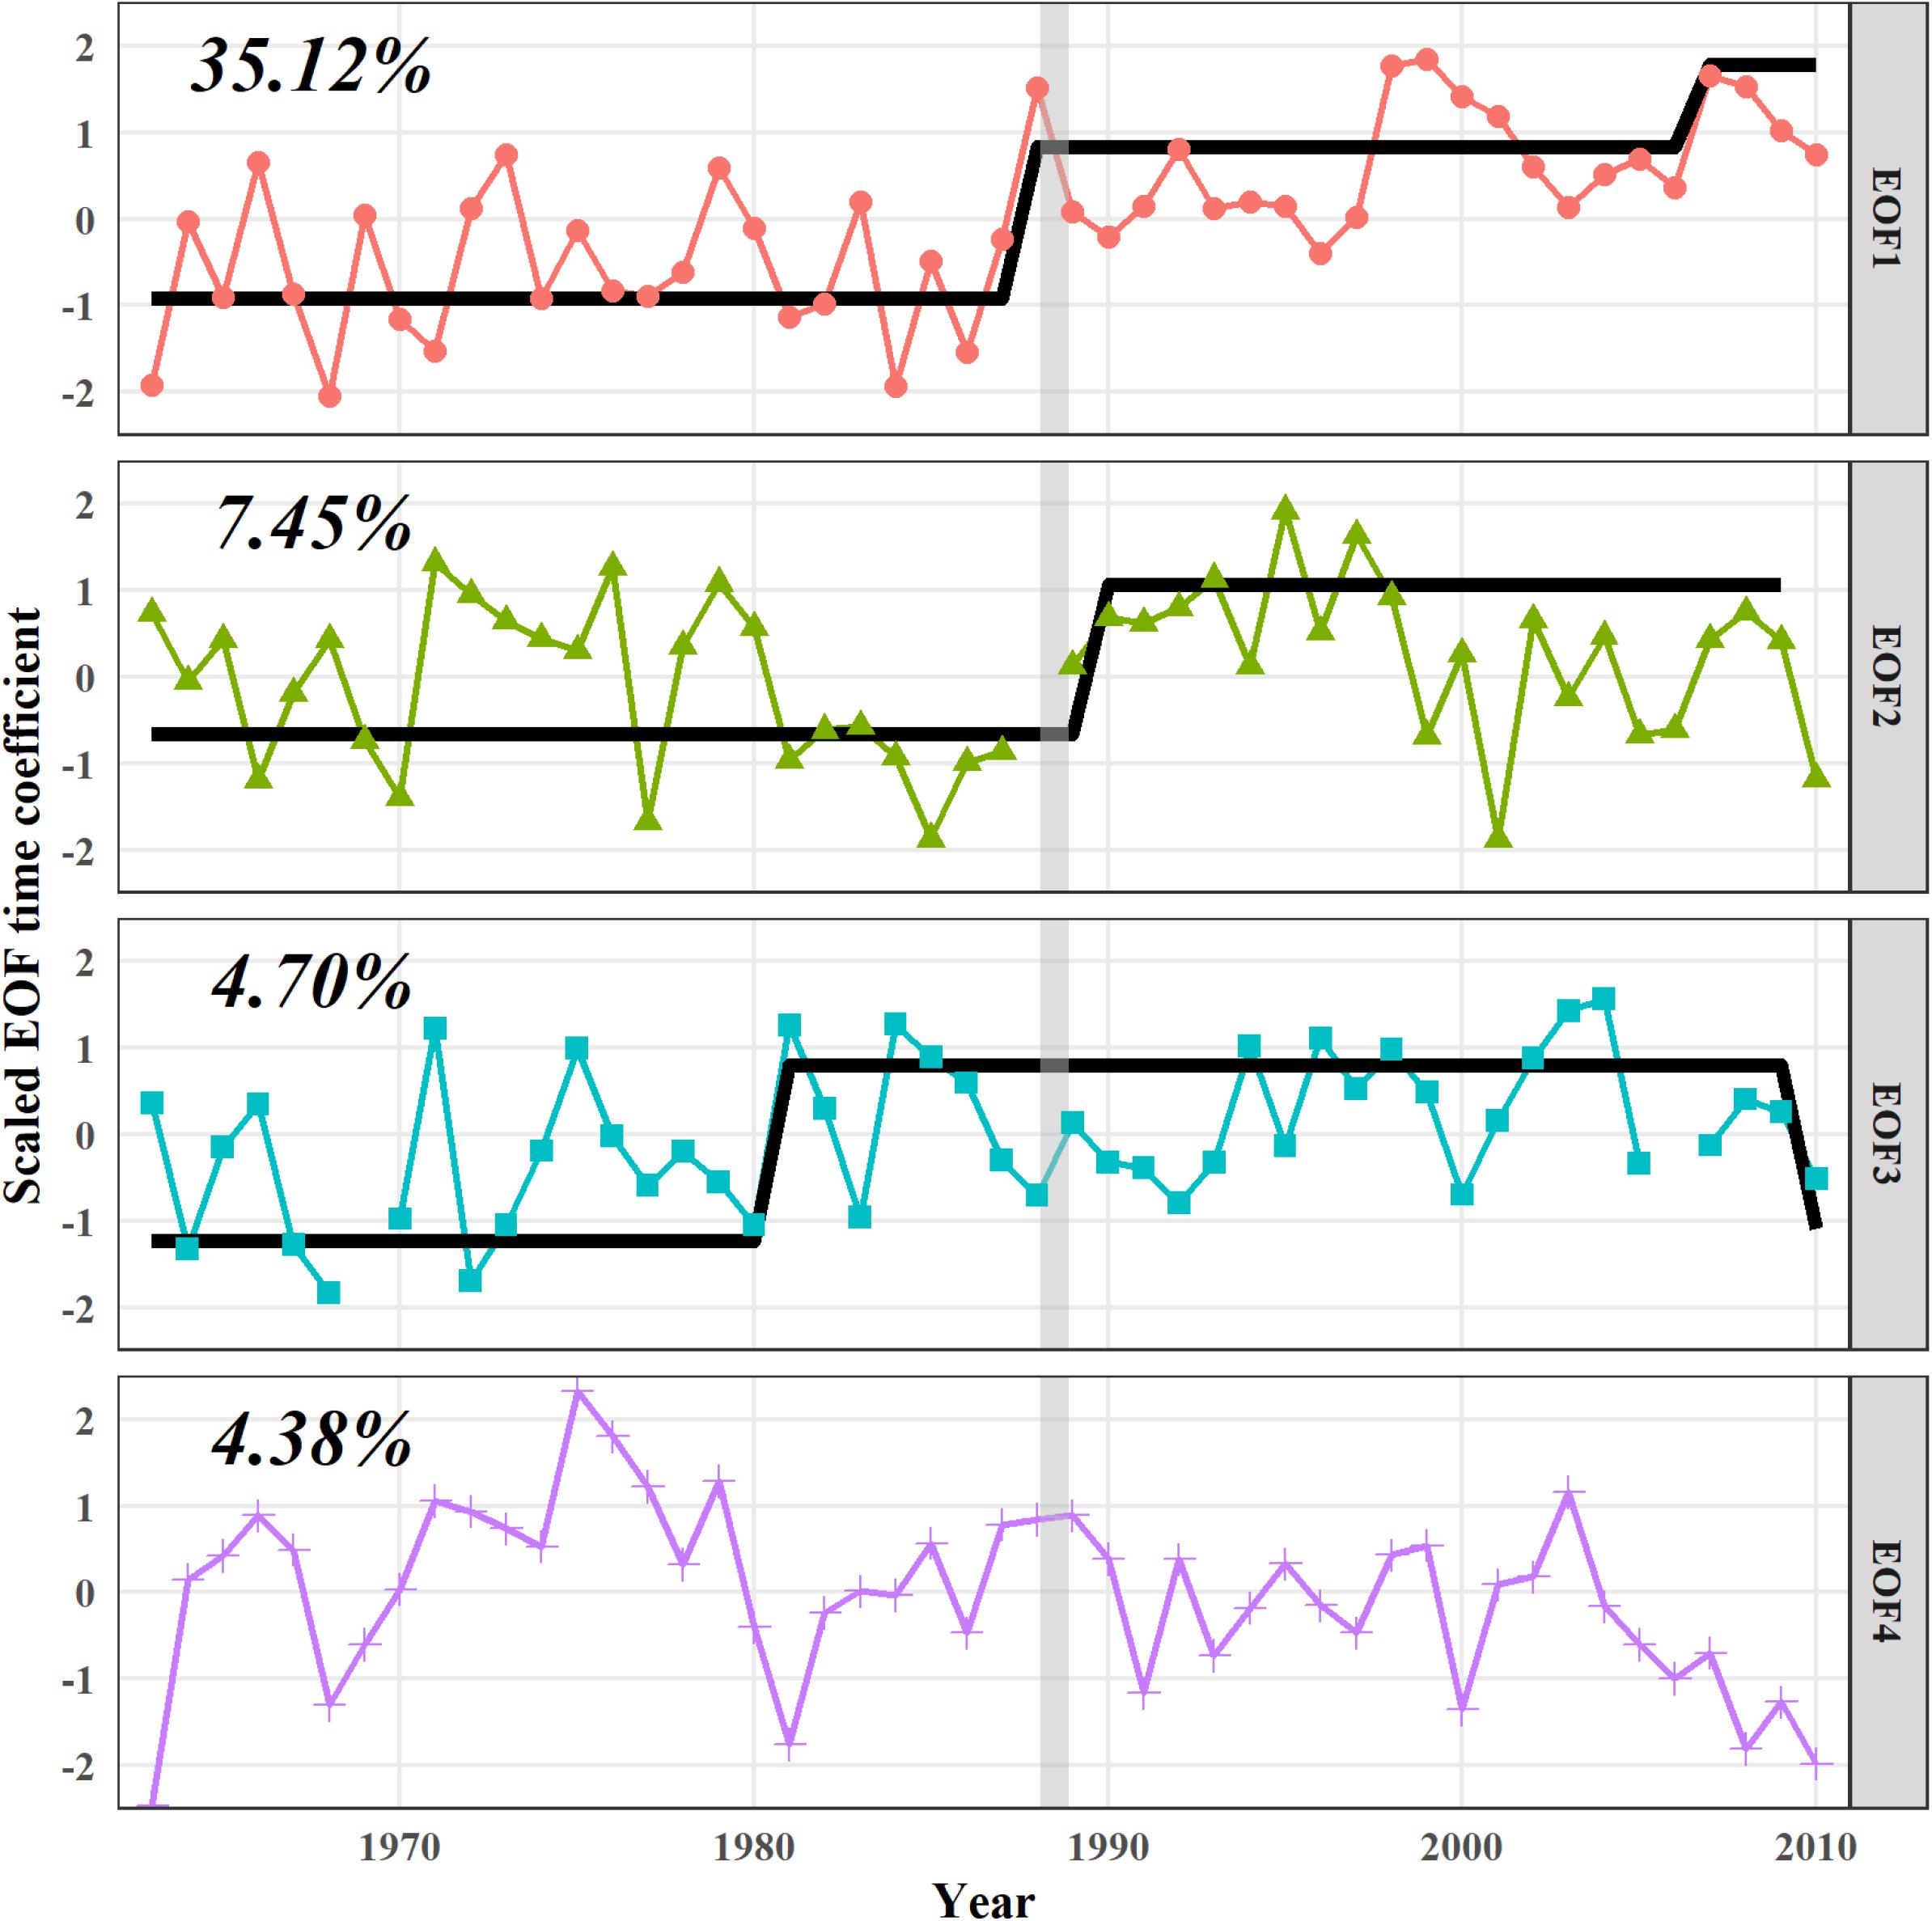
Figure 4. Trajectories of the first four modes of empirical orthogonal functions (EOFs). Numbers indicate the percentage of variance explained by each EOF. Black lines represent regime means calculated by STARS, and gray lines represent the concentrated step-like changes in the late 1980s in contrast to those in Figure 3.
The CIs clearly show decadal-scale patterns (Figure 5). The PDO shows a step-like change in 1976/77, and the NPGO shows a step-like change in 1997/98. The SOI has relatively high-frequency variations without any noticeable step-like change. The AOI, SHI, and MOI have concentrated step-like changes in 1988/89.
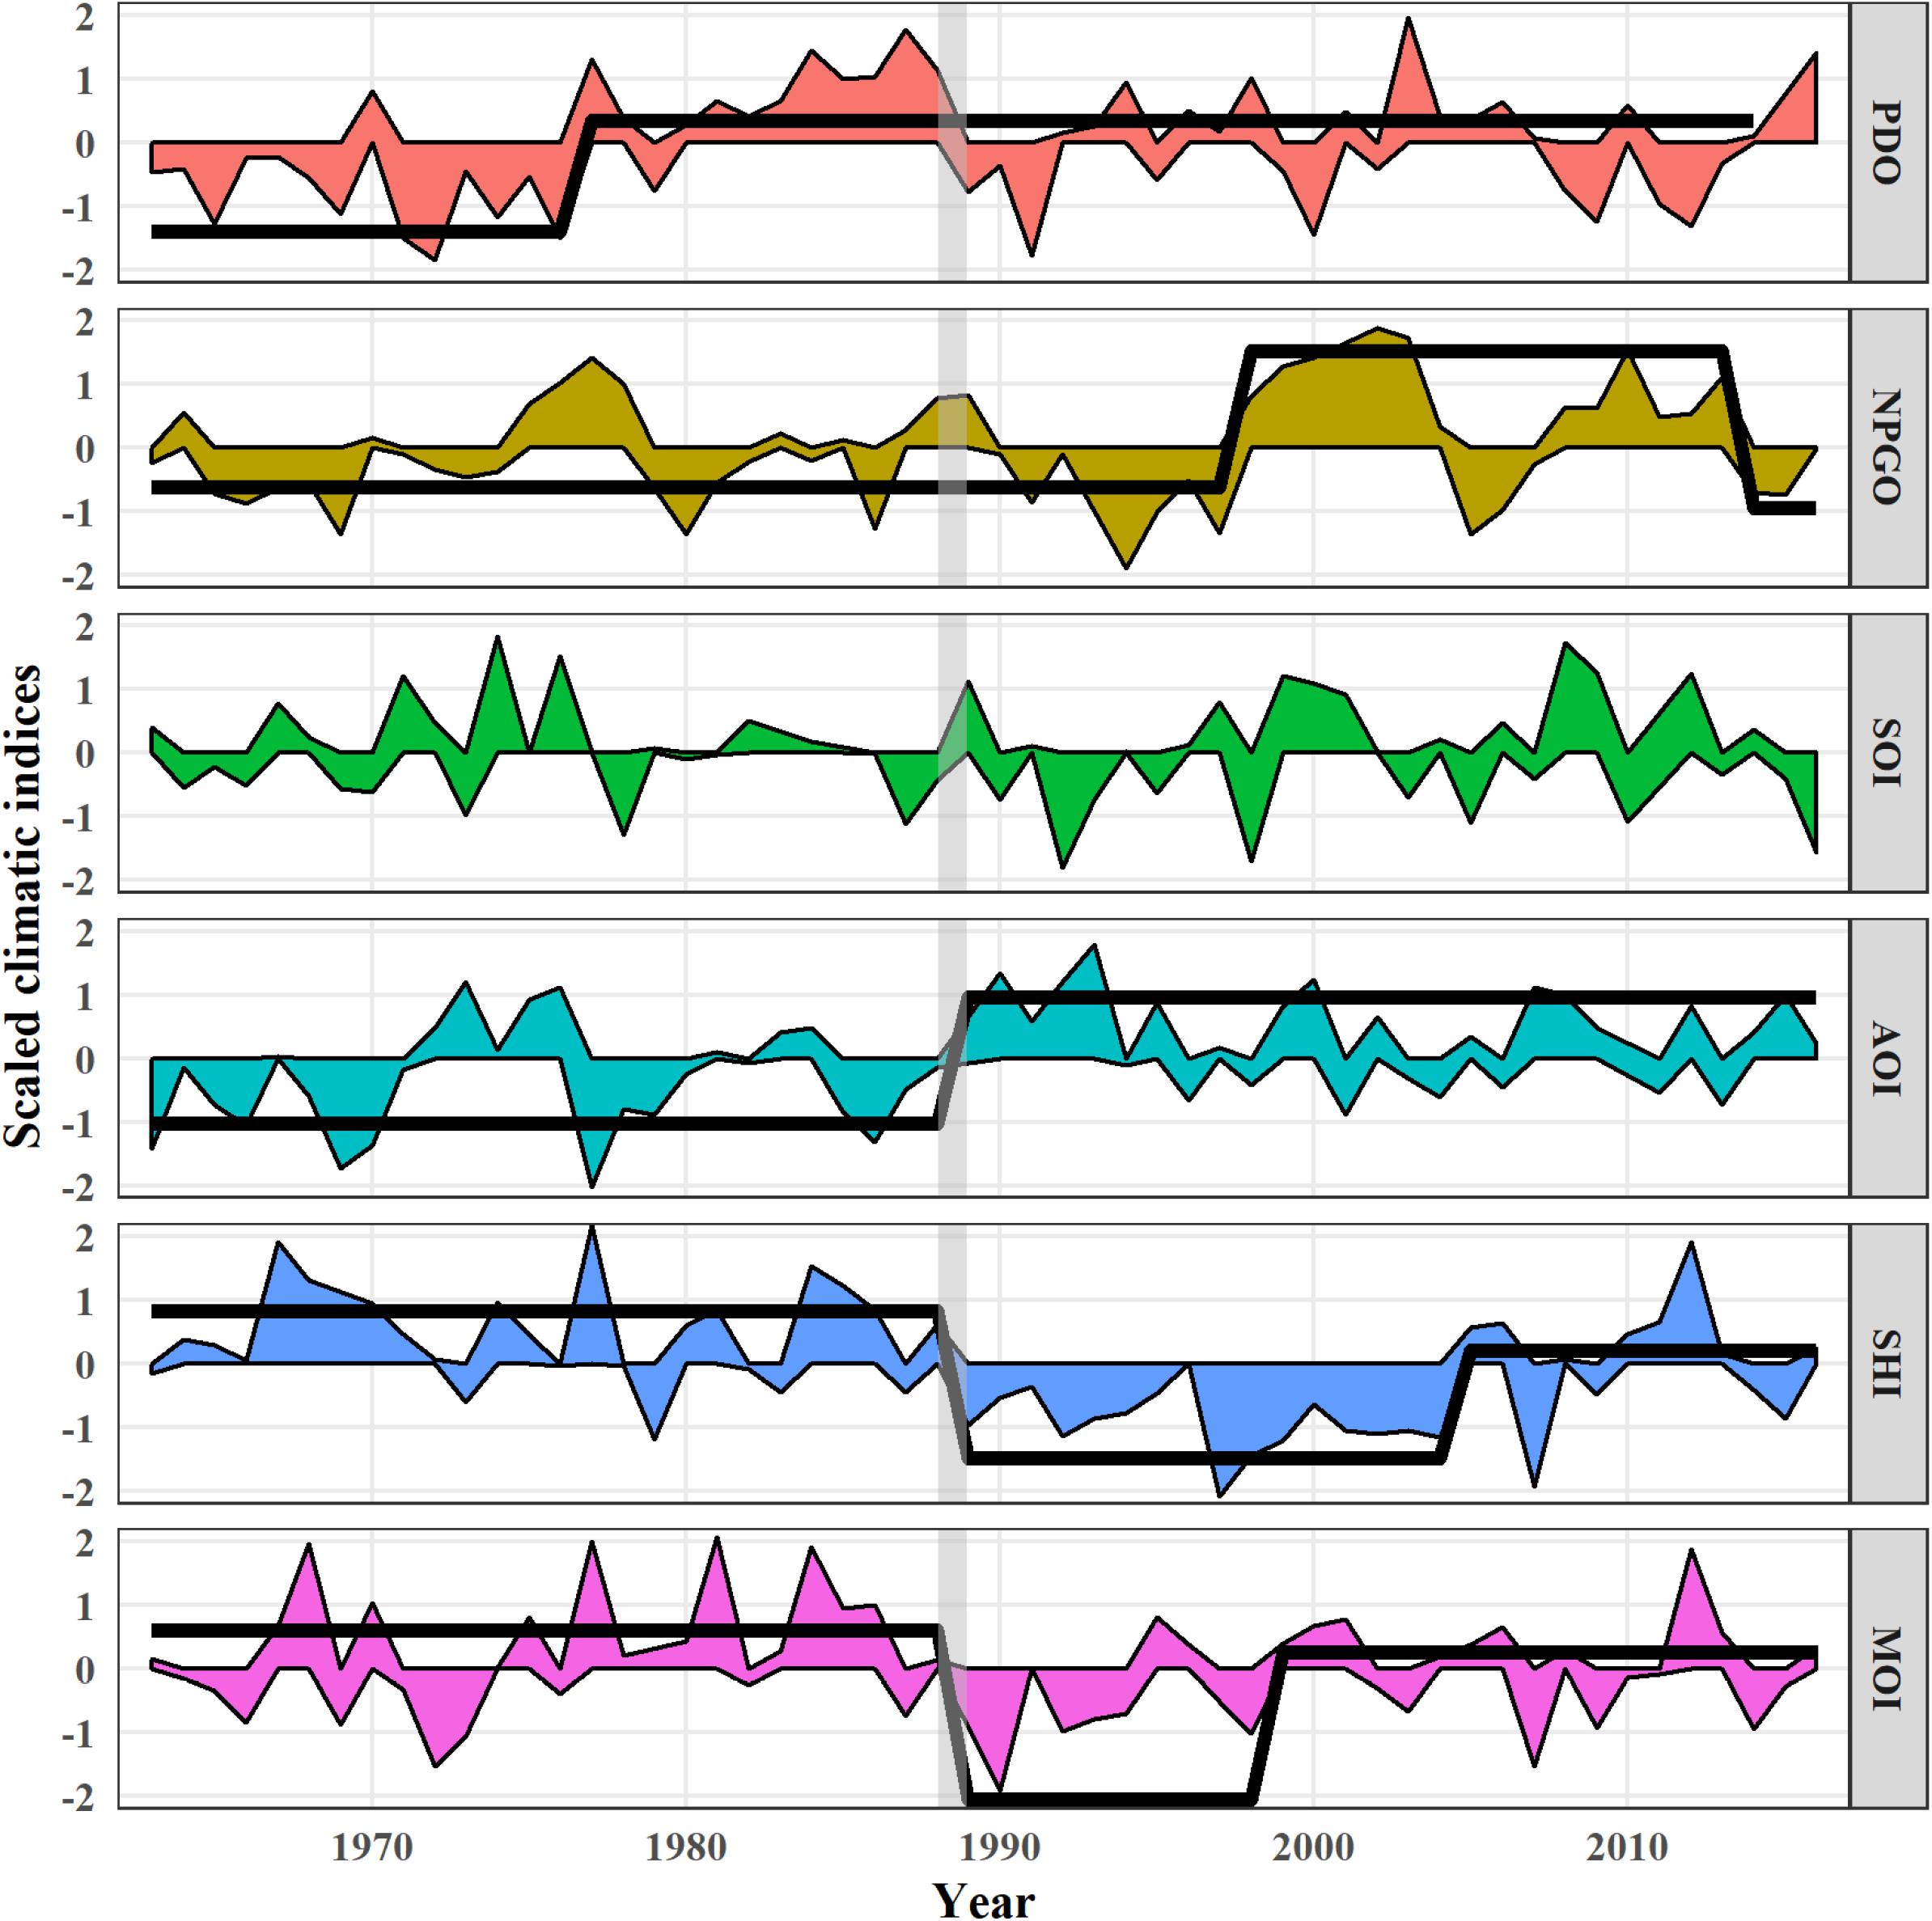
Figure 5. Trajectories of the climatic indices (CIs). Black lines represent regime means calculated by STARS, and gray lines represent the concentrated step-like changes in the late 1980s in contrast to those in Figures 3, 4.
Relationships Among Climate, Environment, and Ecosystem Variability
Correlations among CIs, EOFs, and PCs have diverse patterns (Figure 6). First, PC1 is positively correlated with EOF1 but negatively with EOF4; PC2 shows a negative correlation with PDO. Other PCs show no correlations with EOFs due to the autocorrelations. Second, EOF1 is negatively correlated with the SHI and MOI; EOF2 is negatively correlated with the PDO, SHI, and MOI, but positively with the AOI; EOF3 shows a relatively weak correlation with the PDO. Third, the SHI is negatively correlated with the AOI but positively with MOI. The PDO is negatively correlated with the SOI.
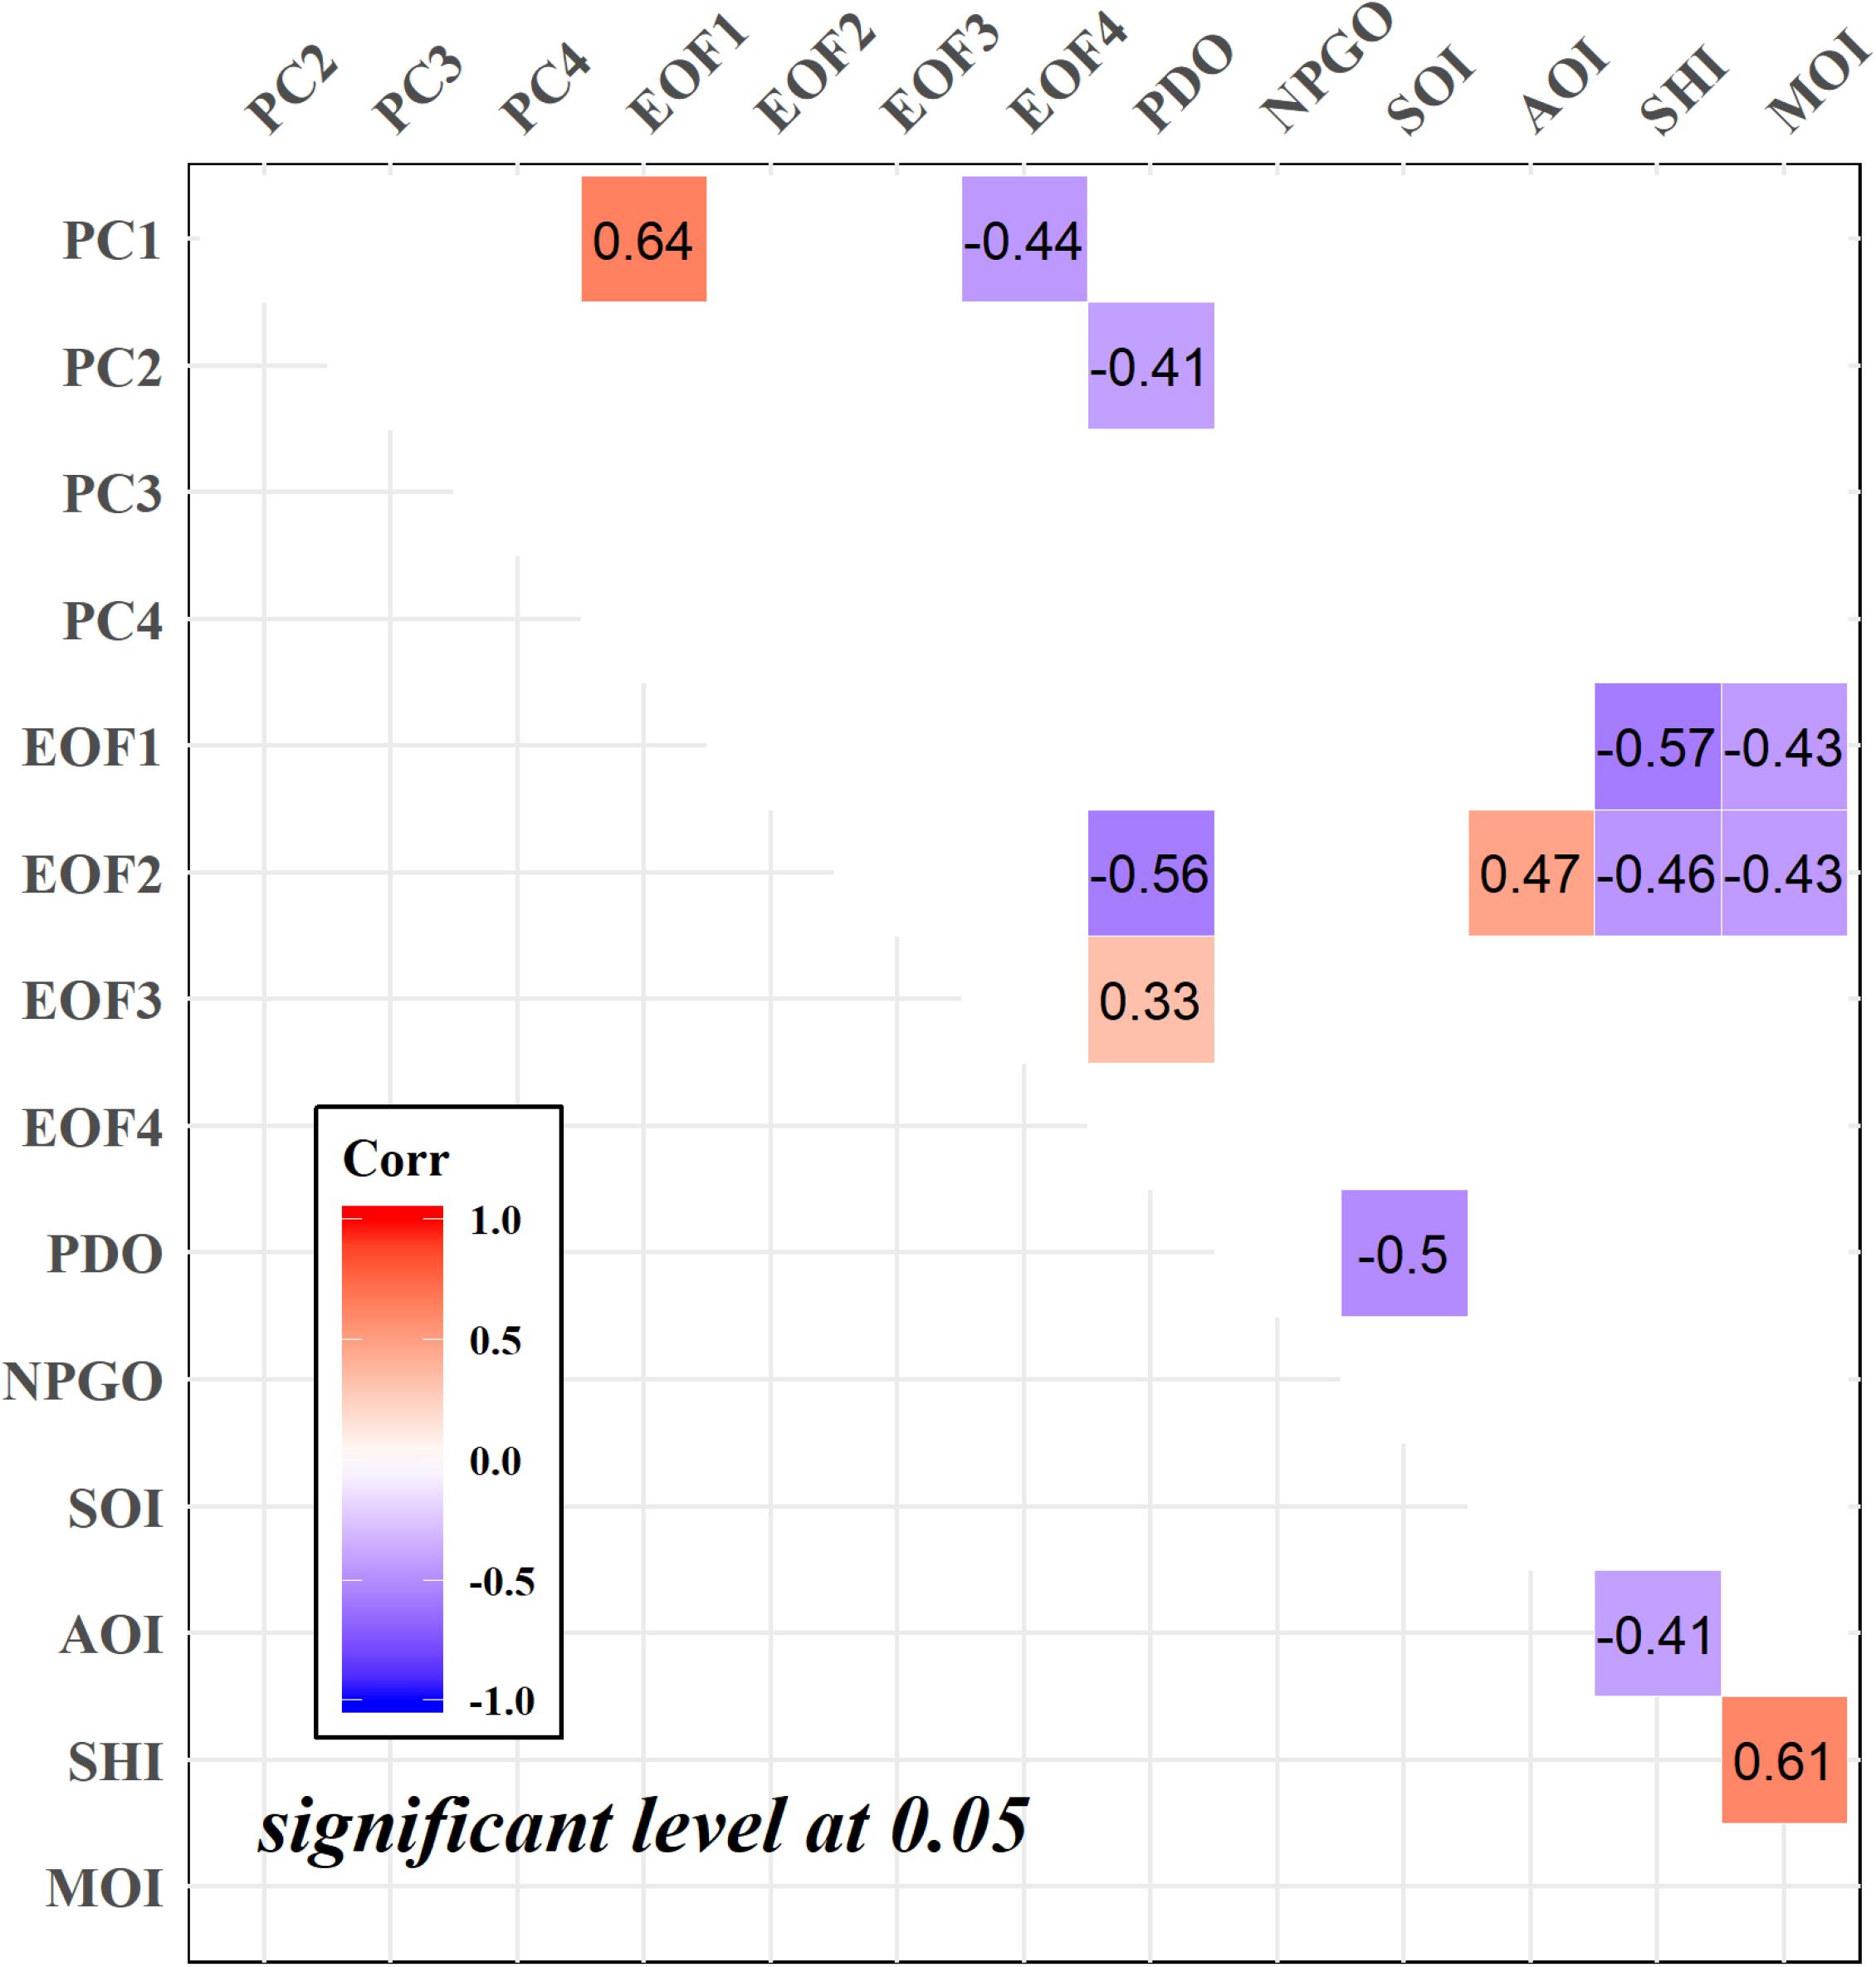
Figure 6. Correlations among principal components (PCs), modes of empirical orthogonal functions (EOFs), and climatic indices (CIs). Colored grids represent significant relationships at a significant level of 0.05 with consideration on the potential autocorrelation. Numbers are correlation coefficients (Corr).
Gradient forest analysis reveals that PC1 is best explained by EOFs and CIs followed by PC2. PC3 and PC4, on the other hand, failed to be explained by these drivers (Figure 7A). In addition, weighted importance shows that EOF1, SHI, and EOF3 are the first three contributors to the variations in PCs. The PDO shows less weighted importance than the SHI, indicating its relatively weaker effects on PCs (Figure 7B).
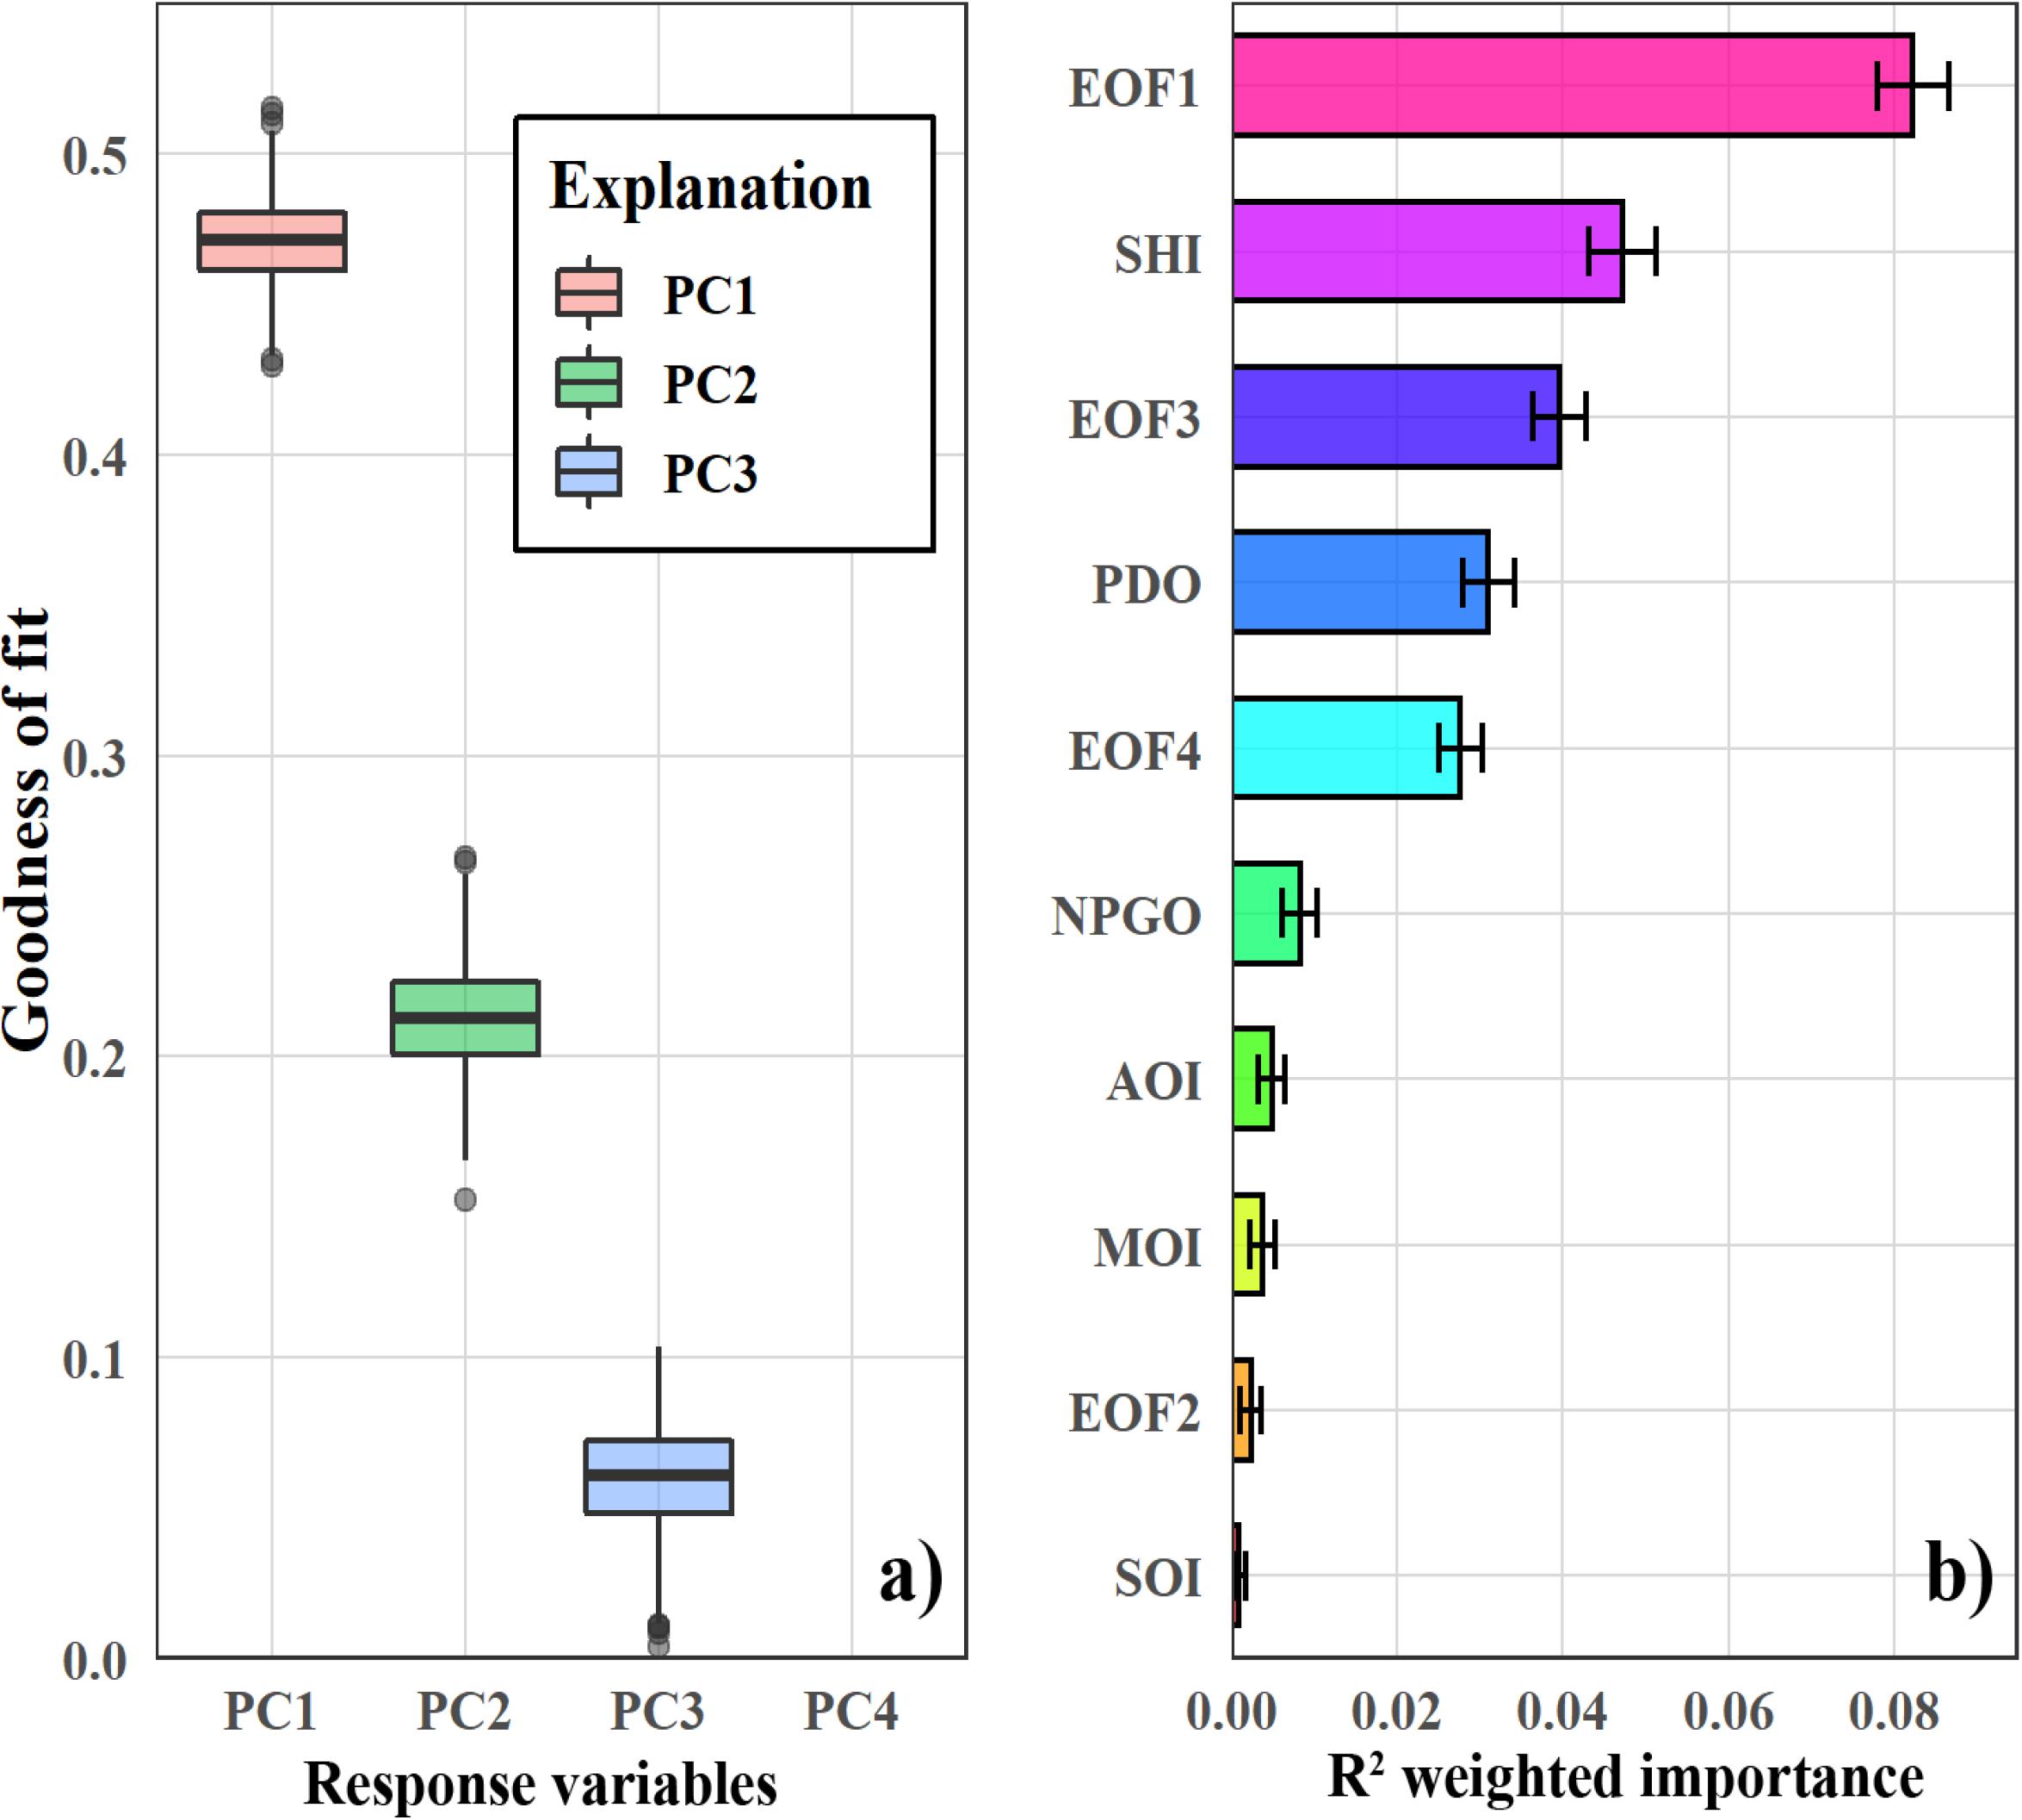
Figure 7. Gradient forest analysis shows (A) model performance (goodness-of-fit R2) for principal components (PCs) and (B) weighted importance of modes of empirical orthogonal functions (EOFs) and climatic indices (CIs) on PCs. Error bars represent standard deviations from 1,000 model runs.
Non-stationary Relationships Between CIs/EOFs and PCs
For all the models relating PCs to CIs and EOFs, the non-stationary models generally resulted in lower gCV (Figure 8), indicating better model performances compared with the stationary models. In the case of PC1, the reduction in gCV by implementing non-stationary models are the greatest compared with other PCs. The best fitted model for PC1 (with the lowest gCV) is a non-stationary model with EOF2 as the driver. In the case of PC2, a non-stationary model with EOF1 as the driver achieves the lowest gCV. In the case of PC3, the best model is non-stationary with EOF4 as the driver. For PC4, a non-stationary model with SHI as the driver has a significantly lower gCV and becomes the best fitted one.
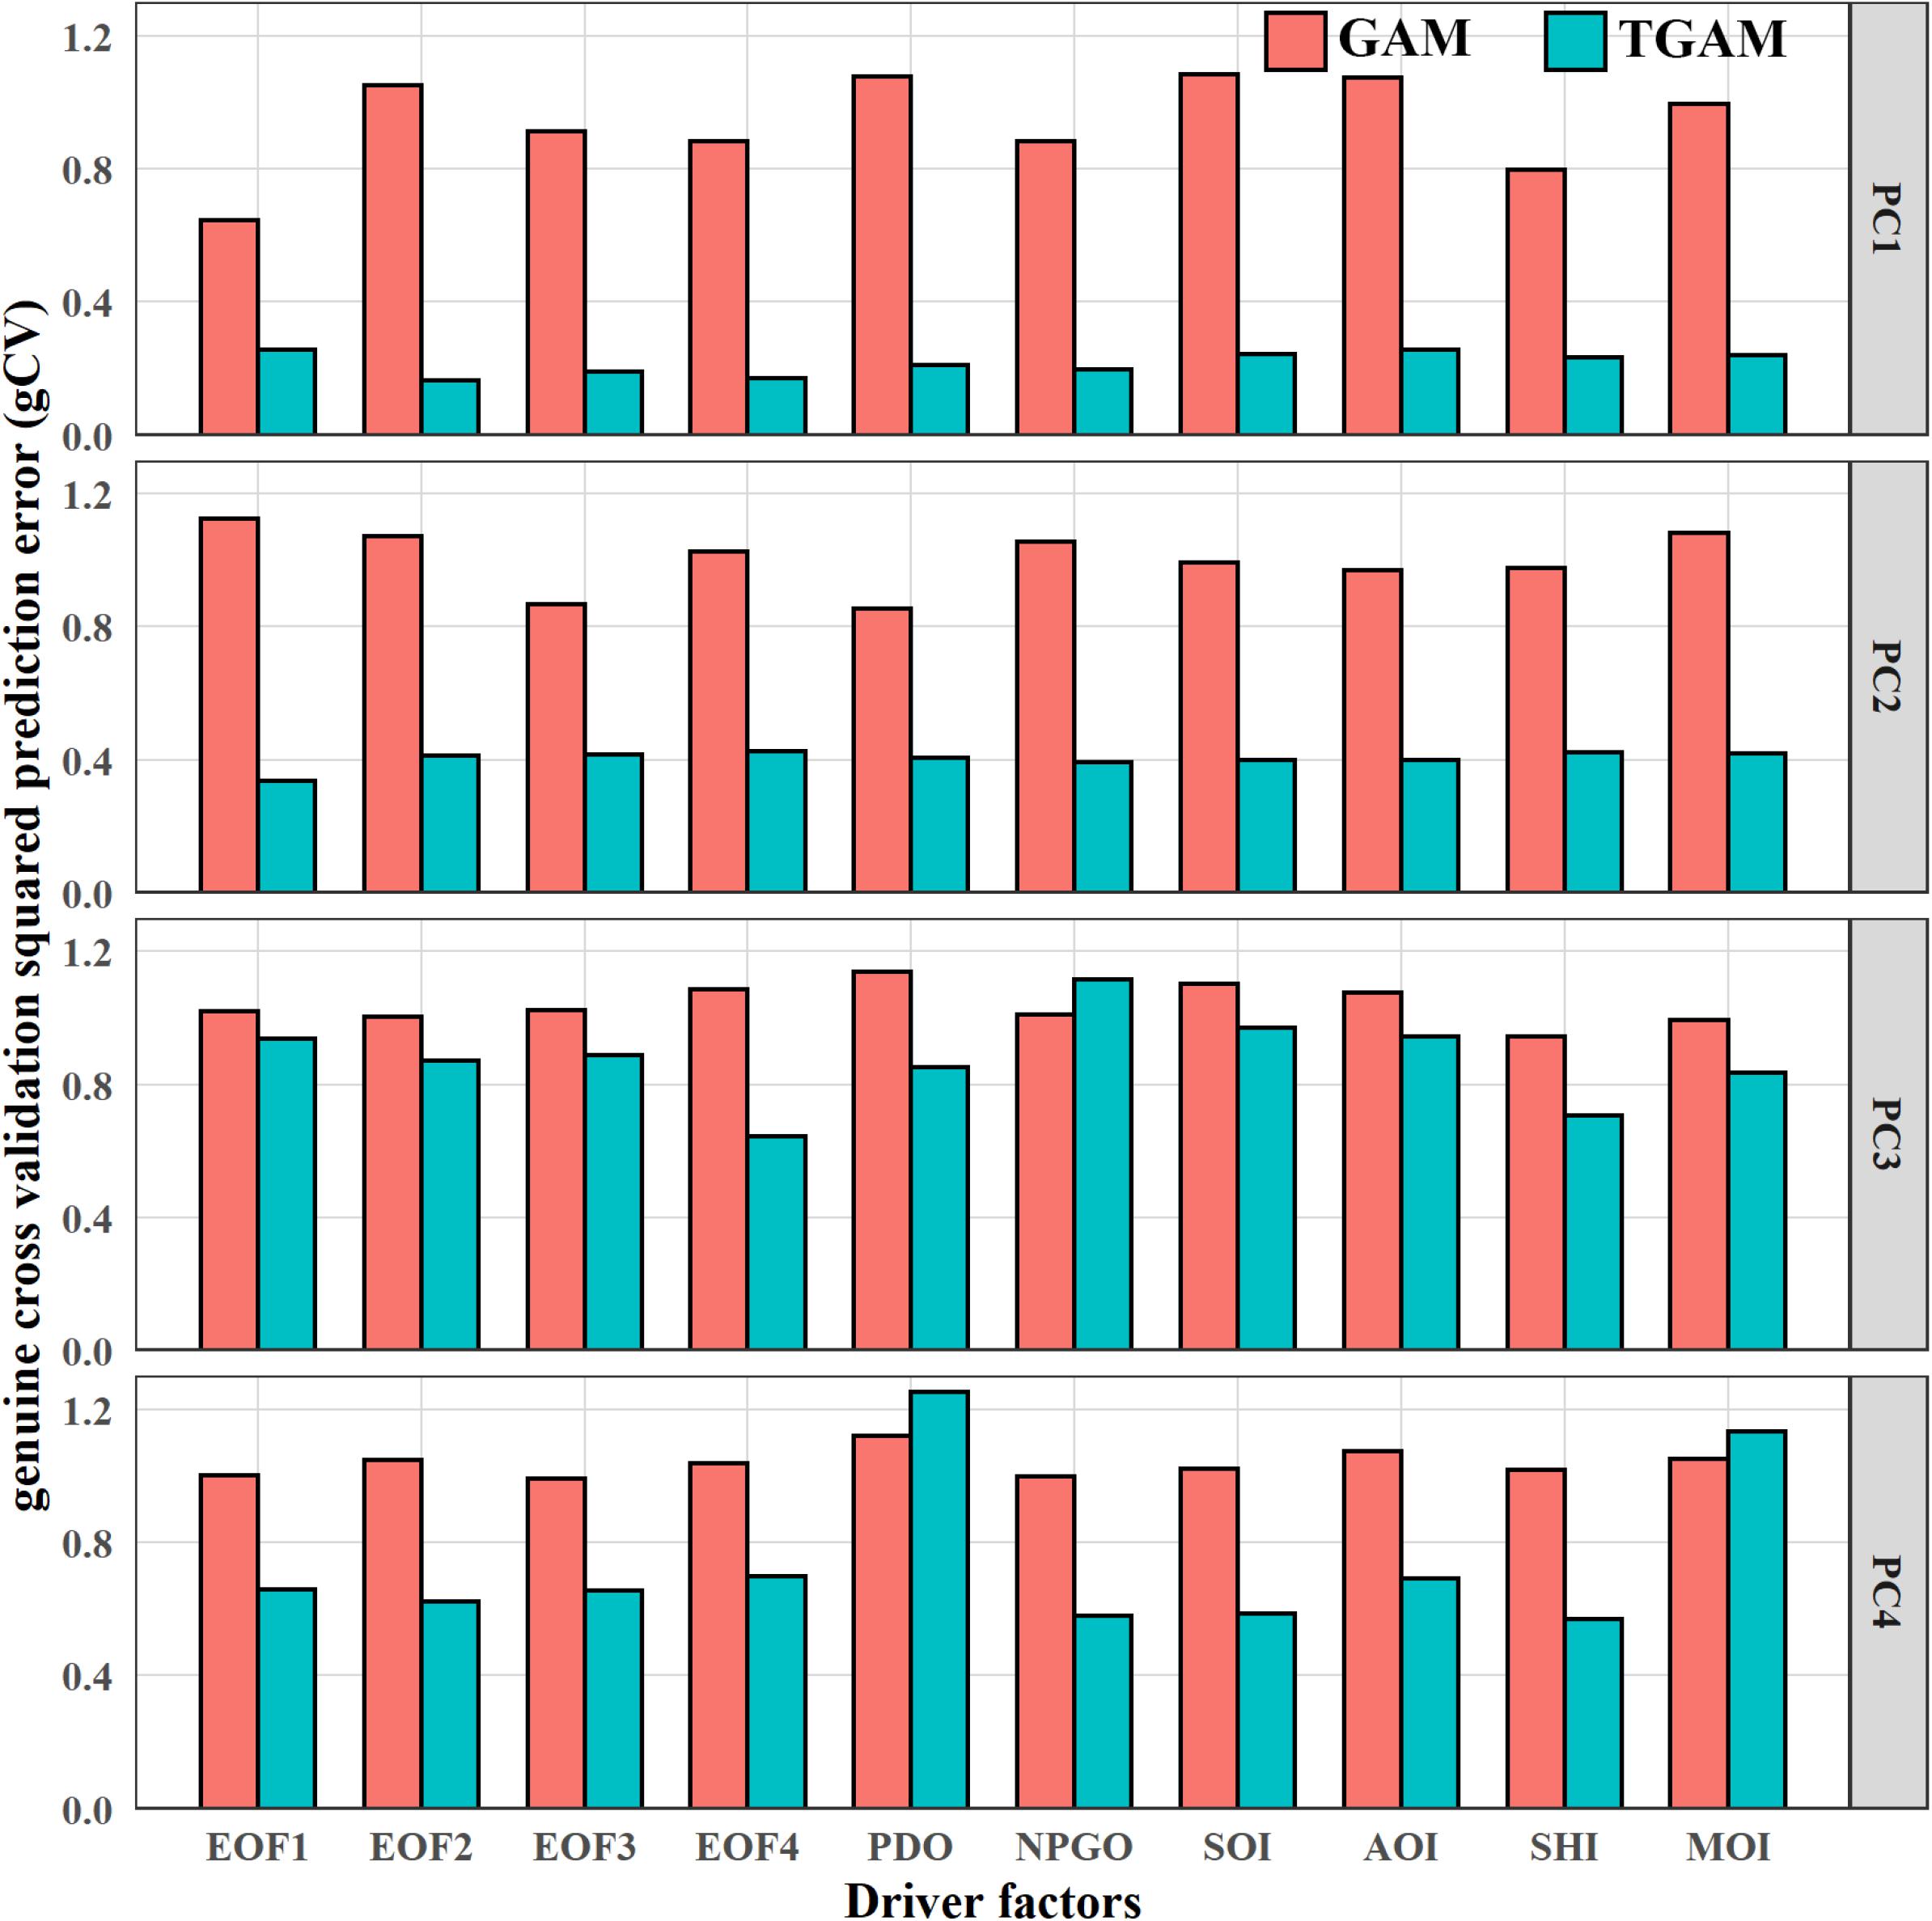
Figure 8. Model comparisons between stationary and non-stationary models. Red bars show the “genuine” cross validation squared prediction error (gCV) of stationary models (GAMs), and blue bars show gCV of non-stationary models (TGAMs).
According to variations in GCV, threshold years were selected to distinguish eras for fitting driver–response relationships separately (Supplementary Figure S5). Two or three eras were identified in the relationships between PCs and CIs/EOFs (Figure 9). In relating PC1 to EOF2, two eras were distinguished by the threshold year 1990/91 with similar negative relationships for both eras. However, PC1 is tightly aggregated with EOF2 in Era1 but dispersive in Era2, indicating a more stable relationship in Era1 than in Era2. Relationships between PC2 and EOF1 are divided into two eras by threshold years 1976/77. A positive relationship is shown in Era2 with high dispersion, and an inverted dome-shaped relationships are shown in Era1, suggesting that EOF1 is relatively weak to explain variations in PC2 after the mid-1970s. In the fitting of PC3 and EOF4, contrasting relationships are shown in the two eras with the threshold year 1992/93. Relationships between the SHI and PC4 are negative, negative and inverted dome-shaped in the three eras, with threshold years 1969/70 and 1994/95, and the weakest relationship is shown in Era2.
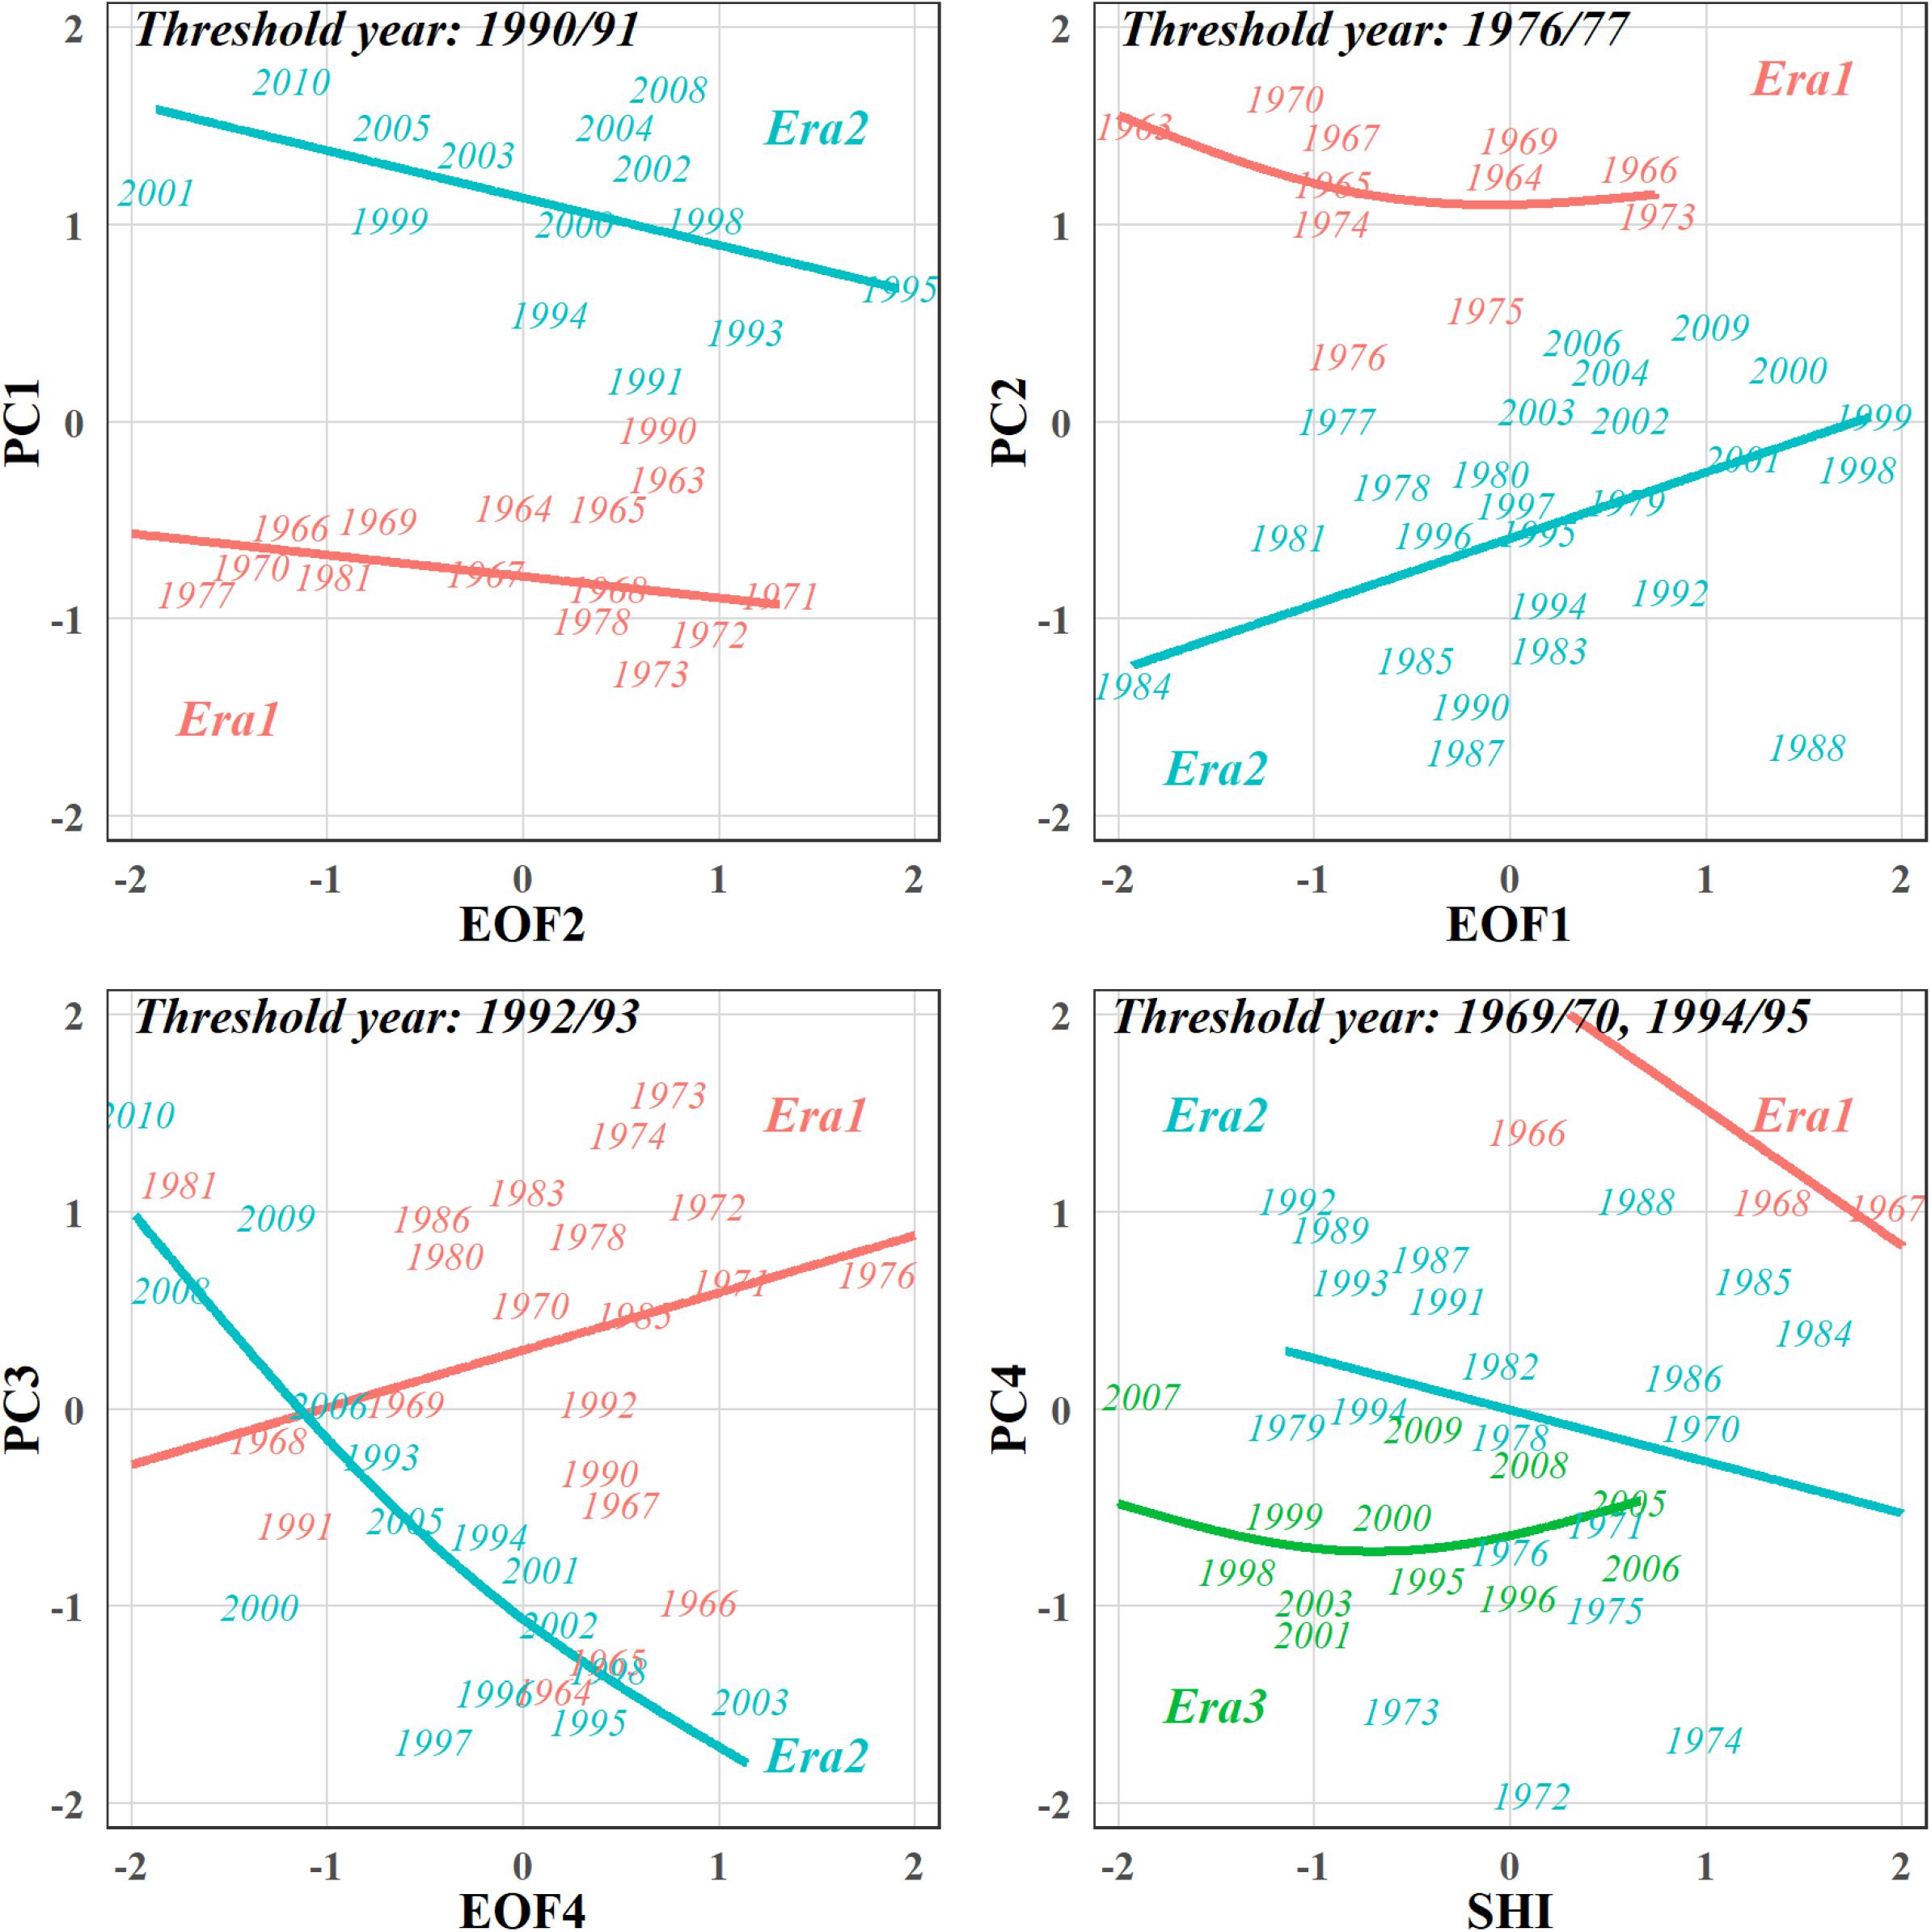
Figure 9. Fitting relationships by the best fitted models. Colors represent different eras with distinguished models.
Discussion
Climate-Induced Ecosystem Variability in the Northwestern North Pacific
In this research, catch data of various taxa from four countries/regions were compiled to provide a holistic perspective on ecosystem variability in the northwestern North Pacific. The problem of missing data always exists in researches with enormous data demands as well as ours. However, with a relatively low missing rate (0.74%), we think it would not affect our results as we focus on the long-term general patterns in ecosystem variability instead of short-term population variability. Significant socioeconomic trends were observed in catch data from China, which may lead to confused results when focusing on climate-induced variability. Therefore, it is imperative to remove the trends by detrend analysis. Although lacking taxa-specific fishing effort data, the engine power of the total Chinese fishing boats could reflect the general pattern in socioeconomic variations in China and could satisfy our demand in the detrend analysis. In addition, catch data from Japan and Korea were extensively used in relevant researches with satisfactory representatives on the biomass (e.g., Tian et al., 2014; Jung et al., 2017). Catch data from Chinese Taipei shown in Supplementary Figure S1 exhibit inconspicuous socioeconomic influences. Therefore, the detrend analyses were not conduced in catch data from the above three countries/regions.
We employed an analytical framework that integrates both traditional and advanced statistical methods. The traditional statistical methods such as PCA, EOF, STARS, and correlation analyses were extensively used in researches on climate-induced ecosystem variability in the North Pacific (e.g., Mantua and Hare, 2002; Litzow and Mueter, 2014; Ma et al., 2019). The advanced methods including GF and TGAM thrived in recent years with their unique characters that cater to the present research demands. Specifically, the GF captures complex relationships between potentially correlated predictors and multiple response variables, which greatly benefit researches focusing on obscure climate–environment–ecosystem covariations with colinearity in the predictors (e.g., climatic indices and environmental variables) (Fu et al., 2019). The TGAM considers the non-stationary driver–response relationships and has been successfully used in detecting the critical transitions and for ecosystem resilience assessment (Vasilakopoulos and Marshall, 2015; Vasilakopoulos et al., 2017). Therefore, the analytical framework serves as an effective approach in investigating climate-induced ecosystem variability.
Our integrated study across different regions of the northwestern North Pacific indicates that ecosystem variability in this part of the North Pacific is featured by significant decadal-scale and synchrony with climate variability. In particular, the climatic regime shift in the late 1980s (step-like changes in CIs and EOFs) resulted in the ecosystem regime shift (step-like changes in PCs). In the late 1980s, the SHI shifted from a positive phase to a negative phase, representing the weakening pressure in the Siberian High area. Previous research has reported that the decline in the SHI could lead to the decline in MOI (Wu and Wang, 2002). As a result, the MOI also shifted from a positive phase to a negative phase in the late 1980s, representing the weakening monsoon. In addition, the AOI shifted from a negative phase to a positive phase, indicating the strengthening of the Arctic wind vortex, which could hinder the southward intrusion of cold air and also impact the SHI and MOI (Gong et al., 2001; Wu and Wang, 2002). Consequently, the weakening monsoon and decreasing intrusion of cold air directly caused the increase in water temperature, shown as step-like changes in EOFs in the late 1980s. Increasing water temperature could be beneficial for warm-water species but harmful for cold-water species, which have caused the ecosystem regime shift in the late 1980s (Tian et al., 2008; Reid et al., 2016). Our research presents apparent evidence that supports the dominance shift from cold-water taxa to warm-water taxa in the late 1980s. For instance, PC1, PC2, and PC3 all show great changes around the late 1980s. The warm-water yellowtail (J5, positive loading on PC1), Japanese anchovy (J20 and K12, positive loadings on PC2 and PC1, respectively), and Japanese jack mackerel and Japanese scad (J16, negative loading on PC3) had abrupt increases in the late 1980s. By contrast, cold-water Japanese sardine (J19 and K11, negative loadings on PC2), Pacific cod (J8, negative loadings on PC1 and PC2), and walleye pollock (J9 and K4, negative loadings on PC1 and PC2) decreased sharply in the late 1980s. Such taxa shift has impacted fisheries that have fixed gears (such as stow-net and trap-net) or fixed fishing ground, resulting in increased (decreased) percentages of warm-water (cold-water) species (Cheung et al., 2013). Furthermore, the warming has led to north movement of target species, resulting in north movement of fishing grounds of flexible fishery and the increased percentages of low-latitude species in catches of high-latitude countries/regions (Tian et al., 2012).
In addition to the synchrony in climatic and ecosystem regime shifts, correlations among CIs, EOFs and PCs have also been identified by our results. PC1 shows primary correlations with EOF1. PC1 represents the most common variability pattern in ecosystems in the northwestern North Pacific with the highest explained variance and high loadings of most taxa. Besides, EOF1 primarily represents SST variations in the eastern part of East China Sea and variations in the Kuroshio Current path south of Kyushu, Japan (Supplementary Figure S4). These two areas have been identified as wintering and/or spawning grounds for many migratory species, such as sardine, anchovy, Japanese jack mackerel, and bluefin tuna (Kitagawa et al., 2000; Kasai et al., 2008; Yatsu et al., 2013; Sassa, 2019; Yatsu, 2019). Environmental changes in these wintering and/or spawning grounds have great impacts on wintering mortality, early life-stage growth and survival of migratory species, and thus play a decisive role on their recruitment process. In addition, the SHI and MOI are negatively correlated with EOF1, but not correlated with PCs, indicating that climate variability impacts biological variability through the intermediary environment variability. It provides evidence that climate-induced biological variability in the northwestern North Pacific may follow the “atmosphere–ocean–ecosystem” process as well as the “double-integration” process (Di Lorenzo and Ohman, 2013; Ma et al., 2019). Furthermore, PC2 is negatively correlated with the PDO. PC2 represents mainly the cold-water species Japanese sardine and walleye pollock (high loadings on PC2) whose catches boomed during the 1970s to 1980s but decreased sharply in the late 1980s. Aside from the above climate variability patterns, it corresponded to PDO that had a shift from a cold regime to the warm regime in the mid-1970s followed by a sharp decline in the late 1980s (Yatsu, 2019).
Our research evaluates the ecological importance of climate variability patterns, and the results show that the SHI may have the highest ecological importance to ecosystems in the northwestern North Pacific. On the one hand, SHI combining with AOI and MOI have large impacts on EOF1 that could affect the PC1, while PDO is correlated with EOF2 and PC2 that account for relatively little variance in the ecosystem. On the other hand, gradient forest identifies that EOF1, SHI, and EOF3 are the top three contributors to variations in PCs, followed by PDO, which provides direct evidence for higher ecological importance of SHI than PDO. Nevertheless, this is not a denial of the importance of PDO in the northwestern North Pacific. The PDO has strong linkage with the Kuroshio Current transport (Andres et al., 2009). Besides, the PDO in tandem with ENSO could affect the east Asian winter monsoon (Wang et al., 2008). Therefore, the PDO could still exert on ecosystems by the above intermediaries, which is not investigated here. Based on our results, the SHI should be further considered in future researches on climate-induced biological variability in the northwestern North Pacific. Furthermore, global warming may also have effects on the ecosystem variability in the northwestern North Pacific as temperature increasing in the western boundary current area was observed (Wu et al., 2012). The long-term increasing pattern of EOF1 is likely related to global warming. Meanwhile, EOF1 also has good correspondence to the Siberian High, Arctic Oscillation, and East Asian Monsoon as we discussed earlier, which was consistent with other researches (e.g., Park et al., 2012). The coincidence of both climate variability and global warming makes it difficult, if not impossible, to separate their effects. Furthermore, other research found that global warming could impact the Siberian High and monsoon system (Hori and Ueda, 2006), which also increases the difficulty in the isolation. Although our research highlighted the ecological importance of the climate variability patterns, global warming could also impact ecosystem variations in the northwestern North Pacific.
Non-stationarity in Climate/Environment–Ecosystem Relationships
Non-stationarity in relationships between climate/environment drivers and ecosystem responses is verified by our research. Previous researches present clear evidences for the non-stationarity in climate–biology relationships in the northeastern North Pacific (Litzow et al., 2018, 2019b; Puerta et al., 2019). Our research points to the non-stationarity in the northwestern North Pacific and enriches proofs for the non-stationarity in the entire North Pacific.
Non-stationarity in relationships between PCs and drivers is characterized by varied fitness or opposite fitting trends in different eras. For example, although the fitted non-stationary relationships between PC1 and EOF2 are negative in both eras, higher dispersion is discovered in Era2 than in Era1 (root mean squared errors, RMSEs are 0.31 and 0.43 in Era1 and Era2, respectively), indicating the lower control of EOF2 on PC1 in Era1 than in Era2. In addition, the fitted non-stationary relationship between PC3 and EOF4 is positive in Era1 but negative in Era2, suggesting different driver–response relationships in the two eras. These two patterns have also been reported in other researches (Puerta et al., 2019). Furthermore, relationships between PCs and drivers have different threshold years, suggesting the asynchronous non-stationarity in the ecosystems, which could be caused by different sensitivities of fish populations in their responses to environmental drivers (Beaugrand, 2015).
The non-stationarity in the northeastern North Pacific has been attributed to the Aleutian Low-forced change in the relative importance of PDO and NPGO to the regional environment variability (Litzow et al., 2018). Such change in the relative importance of alternative climatic indices may also exist in the northwestern North Pacific (Supplementary Figure S6). For example, the MOI gradually lost its control on EOF1 since the 1980s, while NPGO showed increased correlations with EOF1. Similarly, correlations between PDO and EOF2 decreased from the 1980s to the early 1990s, and by contrast, correlations between NPGO and EOF2 increased consistently during this same period. While the decline in variance of the Aleutian Low was responsible for the change in the relative importance of PDO and NPGO (Litzow et al., 2018), the same reason may also apply to their correlations with EOF2. As for EOF1, the altered relative importance of MOI and NPGO may be attributed to the decline in variance of the Siberian High that decreased sharply since the late 1980s (Supplementary Figure S7). Strong variances in these pressure systems may drive coherent variability in regional ocean physical processes. Therefore, these climatic indices would have good representation of environmental conditions and, thus, relate well with biological variability. However, low variances in these pressure systems would reduce the strength of association among individual environmental variables, accompanied by weaker representation of environmental conditions and disappearing relationships with biological variability. It could explain the weaker driver–response relationships for the era after the threshold years.
While numerous studies address the role of climate forcing in the biological variability of the North Pacific, most of these tend to model relationships among climatic, environmental, and biological variables as stationary properties (Wolkovich et al., 2014). Our studies, demonstrate the existence of non-stationarity between physical drivers and biological responses, in line with a few others (e.g., Litzow et al., 2018, 2019a,b; Puerta et al., 2019). We also preliminarily explored the mechanism behind the relationships in the northwestern North Pacific. Based on our findings, we stress that recognizing climate states (or eras) is vital for the identification of non-stationarity in climate–biology relationships. In addition, analytical techniques considering the non-stationarity achieve better fitting than models with stationary relationships, thus, these techniques are suggested to be used in future researches. Relaxing assumptions of stationary relationships among environmental variables and ecosystem responses may be an important step in understanding climate-induced biological variability.
Comparisons of Climate-Induced Patterns in Ecosystems Between the Northwestern and Northeastern North Pacific
Long-term variabilities in ecosystems in the northwestern and northeastern North Pacific are both characterized by decadal variations largely affected by climate variability. It is widely known that climate-induced ecosystem regime shifts in the North Pacific occurred in the mid-1970s, late 1980s, and late 1990s, and they matched well with the synchronous climatic regime shifts (Overland et al., 2008). However, in the northeastern North Pacific, ecosystem responses to the climatic regime shifts were stronger in the mid-1970s and late 1990s, but weaker in the late 1980s (Supplementary Figure S8) (Litzow and Mueter, 2014). By contrast, we found that ecosystems in the northwestern North Pacific had the strongest regime shift in response to the climatic regime shift in the late 1980s (Supplementary Figure S8). Asynchronous ecosystem regime shifts were induced by the different climate variability patterns that have ecological importance. Climatic regime shifts dominated by the PDO and NPGO contributed to the ecosystem regime shifts in the mid-1970s and late 1990s, while climatic regime shifts dominated by the SHI, AOI, and MOI resulted in an ecosystem regime shift in the late 1980s. Therefore, identification of climate variability pattern with ecological importance is vital in understanding climate-induced biological variability.
Based on this study and those of others (e.g., Litzow et al., 2019a,b), non-stationarity in climate–biology relationships exists in both northwestern and northeastern North Pacific and is driven by the decline in variances of pressure systems. In addition, non-stationarity in both northwestern and northeastern North Pacific is shown as variations in driver–response relationships over threshold years. However, the decline in the variance of Siberian High was greater in magnitude and longer in duration compared to the Aleutian Low (Supplementary Figure S7), which may imply more profound non-stationary effects on ecosystems in the northwestern than in the northeastern North Pacific. Furthermore, accompanied with weakening activities of Siberian High and Aleutian Low, the NPGO seems to replace the MOI and PDO and exhibits control over thermal variability in both the northwestern and northeastern North Pacific, providing bases for unified climate-induced biological variability in the North Pacific.
Data Availability Statement
The raw data supporting the conclusions of this article will be made available by the authors, without undue reservation.
Author Contributions
SM, YT, and PS conceived the study. CF, YW, JC, and YL provided guidance in the methods. JL and HY conducted the data compilation and analysis. SM, YT, PS, and CF wrote and revised the manuscript. YT, JL, PS, and YL obtained funding for the study. All authors contributed to the article and approved the submitted version.
Funding
This work was supported by the National Natural Science Foundation of China (Grant Nos. 41861134037, 41930534, 41976210, and 41806190), the Shandong Key R&D Program (Grant No. 2019GHY112014), and the Fundamental Research Funds for the Central Universities to Ocean University of China (Grant No. 201713054).
Conflict of Interest
The authors declare that the research was conducted in the absence of any commercial or financial relationships that could be construed as a potential conflict of interest.
Acknowledgments
We want to thank the online open-access data and scripts providers, and the two reviewers for their invaluable comments on the manuscript.
Supplementary Material
The Supplementary Material for this article can be found online at: https://www.frontiersin.org/articles/10.3389/fmars.2020.546882/full#supplementary-material
References
Andres, M., Park, J. H., Wimbush, M., Zhu, X. H., Nakamura, H., Kim, K., et al. (2009). Manifestation of the Pacific decadal oscillation in the kuroshio. Geophys. Res. Lett. 36, 1–5.
Beaugrand, G. (2015). Theoretical basis for predicting climate-induced abrupt shifts in the oceans. Philos. Trans. R. Soc. B Biol. Sci. 370:20130264. doi: 10.1098/rstb.2013.0264
Benson, A. J., and Trites, A. W. (2002). Ecological effects of regime shifts in the Bering Sea and eastern North Pacific Ocean. Fish Fish. 3, 95–113. doi: 10.1046/j.1467-2979.2002.00078.x
Biondi, F., Gershunov, A., and Cayan, D. R. (2001). North Pacific decadal climate variability since 1661. J. Clim. 14, 5–10. doi: 10.1175/1520-0442(2001)014<0005:npdcvs>2.0.co;2
Carton, J. A., and Giese, B. S. (2008). A reanalysis of ocean climate using simple ocean data assimilation (SODA). Month. Weather Rev. 136, 2999–3017. doi: 10.1175/2007mwr1978.1
Casini, M., Hjelm, J., Molinero, J.-C., Lövgren, J., Cardinale, M., Bartolino, V., et al. (2009). Trophic cascades promote threshold-like shifts in pelagic marine ecosystems. Proc. Natl. Acad. Sci. U.S.A. 106, 197–202. doi: 10.1073/pnas.0806649105
Cheung, W. W. L., Watson, R., and Pauly, D. (2013). Signature of ocean warming in global fisheries catch. Nature 497, 365–368. doi: 10.1038/nature12156
Ciannelli, L., Chan, K.-S., Bailey, K. M., and Stenseth, N. C. (2004). Nonadditive effects of the environment on the survival of a large marine fish population. Ecology 85, 3418–3427. doi: 10.1890/03-0755
Di Lorenzo, E., and Ohman, M. D. (2013). A double-integration hypothesis to explain ocean ecosystem response to climate forcing. Proc. Natl. Acad. Sci. U.S.A. 110, 2496–2499. doi: 10.1073/pnas.1218022110
Di Lorenzo, E., Schneider, N., Cobb, K. M., Franks, P., Chhak, K., Miller, A. J., et al. (2008). North Pacific gyre oscillation links ocean climate and ecosystem change. Geophys. Res. Lett. 35:L08607.
Doney, S. C., Ruckelshaus, M., Emmett Duffy, J., Barry, J. P., Chan, F., English, C. A., et al. (2012). Climate change impacts on marine ecosystems. Annu. Rev. Mar. Sci. 4, 11–37.
Dormann, C. F., Elith, J., Bacher, S., Buchmann, C., Carl, G., Carré, G., et al. (2013). Collinearity: a review of methods to deal with it and a simulation study evaluating their performance. Ecography 36, 27–46. doi: 10.1111/j.1600-0587.2012.07348.x
Ellis, N., Smith, S. J., and Pitcher, C. R. (2012). Gradient forests: calculating importance gradients on physical predictors. Ecology 93, 156–168. doi: 10.1890/11-0252.1
Fu, C., Xu, Y., Bundy, A., Gruss, A., Coll, M., Heymans, J. J., et al. (2019). Making ecological indicators management ready: assessing the specificity, sensitivity, and threshold response of ecological indicators. Ecol. Indic. 105, 16–28. doi: 10.1016/j.ecolind.2019.05.055
Gong, D. Y., Wang, S. W., and Zhu, J. H. (2001). East Asian winter monsoon and Arctic oscillation. Geophys. Res. Lett. 28, 2073–2076. doi: 10.1029/2000gl012311
Hare, S. R., and Mantua, N. J. (2000). Empirical evidence for North Pacific regime shifts in 1977 and 1989. Prog. Oceanogr. 47, 103–145. doi: 10.1016/s0079-6611(00)00033-1
Hori, M. E., and Ueda, H. (2006). Impact of global warming on the East Asian winter monsoon as revealed by nine coupled atmosphere-ocean GCMs. Geophys. Res. Lett. 33:L03713.
Hsieh, C. H., Glaser, S. M., Lucas, A. J., and Sugihara, G. (2005). Distinguishing random environmental fluctuations from ecological catastrophes for the North Pacific Ocean. Nature 435, 336–340. doi: 10.1038/nature03553
Jung, H. K., Rahman, S. M., Kang, C.-K., Park, S.-Y., Lee, S. H., Park, H. J., et al. (2017). The influence of climate regime shifts on the marine environment and ecosystems in the East Asian Marginal Seas and their mechanisms. Deep Sea Res. Part II Top. Stud. Oceanogr. 143, 110–120. doi: 10.1016/j.dsr2.2017.06.010
Kasai, A., Komatsu, K., Sassa, C., and Konishi, Y. (2008). Transport and survival processes of eggs and larvae of jack mackerel Trachurus japonicus in the East China Sea. Fish. Sci. 74, 8–18. doi: 10.1111/j.1444-2906.2007.01491.x
Kitagawa, T., Nakata, H., Kimura, S., Itoh, T., Tsuji, S., and Nitta, A. (2000). Effect of ambient temperature on the vertical distribution and movement of Pacific bluefin tuna Thunnus thynnus orientalis. Mar. Ecol. Prog. Ser. 206, 251–260. doi: 10.3354/meps206251
Litzow, M. A., Ciannelli, L., Cunningham, C. J., Johnson, B., and Puerta, P. (2019a). Nonstationary effects of ocean temperature on Pacific salmon productivity. Can. J. Fish. Aquat. Sci. 76, 1923–1928. doi: 10.1139/cjfas-2019-0120
Litzow, M. A., Ciannelli, L., Puerta, P., Wettstein, J. J., Rykaczewski, R. R., and Opiekun, M. (2019b). Nonstationary environmental and community relationships in the North Pacific Ocean. Ecology 100:e02760.
Litzow, M. A., Ciannelli, L., Puerta, P., Wettstein, J. J., Rykaczewski, R. R., and Opiekun, M. (2018). Non-stationary climate-salmon relationships in the Gulf of Alaska. Proc. R. Soc. B 285:20181855. doi: 10.1098/rspb.2018.1855
Litzow, M. A., and Mueter, F. J. (2014). Assessing the ecological importance of climate regime shifts: an approach from the North Pacific Ocean. Prog. Oceanogr. 120, 110–119. doi: 10.1016/j.pocean.2013.08.003
Liu, S., Liu, Y., Fu, C., Yan, L., Xu, Y., Wan, R., et al. (2019). Using novel spawning ground indices to analyze the effects of climate change on Pacific saury abundance. J. Mar. Syst. 191, 13–23. doi: 10.1016/j.jmarsys.2018.12.007
Ma, S., Liu, Y., Li, J., Fu, C., Ye, Z., Sun, P., et al. (2019). Climate-induced long-term variations in ecosystem structure and atmosphere-ocean-ecosystem processes in the Yellow Sea and East China Sea. Prog. Oceanogr. 175, 183–197. doi: 10.1016/j.pocean.2019.04.008
Mantua, N. (2004). Methods for detecting regime shifts in large marine ecosystems: a review with approaches applied to North Pacific data. Prog. Oceanogr. 60, 165–182. doi: 10.1016/j.pocean.2004.02.016
Minobe, S. (1999). Resonance in bidecadal and pentadecadal climate oscillations over the North Pacific: role in climatic regime shifts. Geophys. Res. Lett. 26, 855–858. doi: 10.1029/1999gl900119
Overland, J., Rodionov, S., Minobe, S., and Bond, N. (2008). North Pacific regime shifts: definitions, issues and recent transitions. Prog. Oceanogr. 77, 92–102. doi: 10.1016/j.pocean.2008.03.016
Park, Y.-H., Yoon, J.-H., Youn, Y.-H., and Vivier, F. (2012). Recent warming in the western north pacific in relation to rapid changes in the atmospheric circulation of the siberian high and aleutian low systems. J. Clim. 25, 3476–3493. doi: 10.1175/2011jcli4142.1
Puerta, P., Ciannelli, L., Rykaczewski, R. R., Opiekun, M., and Litzow, M. A. (2019). Do Gulf of Alaska fish and crustacean populations show synchronous non-stationary responses to climate? Prog. Oceanogr. 175, 161–170. doi: 10.1016/j.pocean.2019.04.002
Pyper, B. J., and Peterman, R. M. (1998). Comparison of methods to account for autocorrelation in correlation analyses of fish data. Can. J. Fish. Aquat. Sci. 55, 2127–2140. doi: 10.1139/f98-104
Reid, P. C., Hari, R. E., Beaugrand, G., Livingstone, D. M., Marty, C., Straile, D., et al. (2016). Global impacts of the 1980s regime shift. Glob. Chang. Biol. 22, 682–703. doi: 10.1111/gcb.13106
Rodionov, S., and Overland, J. E. (2005). Application of a sequential regime shift detection method to the Bering Sea ecosystem. ICES J. Mar. Sci. 62, 328–332. doi: 10.1016/j.icesjms.2005.01.013
Rodionov, S. N. (2004). A sequential algorithm for testing climate regime shifts. Geophys. Res. Lett. 31:L09204.
Rodionov, S. N. (2006). Use of prewhitening in climate regime shift detection. Geophys. Res. Lett. 33:L12707.
Ropelewski, C. F., and Jones, P. D. (1987). An extension of the Tahiti-Darwin southern oscillation index. Month. Weather Rev. 115, 2161–2165. doi: 10.1175/1520-0493(1987)115<2161:aeotts>2.0.co;2
Sassa, C. (2019). reproduction and early life history of mesopelagic fishes in the kuroshio region: a review of recent advances. Kuroshio Curr. 2019, 273–294. doi: 10.1002/9781119428428.ch17
Thompson, D. W., and Wallace, J. M. (1998). The arctic oscillation signature in the wintertime geopotential height and temperature fields. Geophys. Res. Lett. 25, 1297–1300. doi: 10.1029/98gl00950
Tian, Y., Kidokoro, H., and Watanabe, T. (2006). Long-term changes in the fish community structure from the Tsushima warm current region of the Japan/East Sea with an emphasis on the impacts of fishing and climate regime shift over the last four decades. Prog. Oceanogr. 68, 217–237. doi: 10.1016/j.pocean.2006.02.009
Tian, Y., Kidokoro, H., Watanabe, T., Igeta, Y., Sakaji, H., and Ino, S. (2012). Response of yellowtail, Seriola quinqueradiata, a key large predatory fish in the Japan Sea, to sea water temperature over the last century and potential effects of global warming. J. Mar. Syst. 91, 1–10. doi: 10.1016/j.jmarsys.2011.09.002
Tian, Y., Kidokoro, H., Watanabe, T., and Iguchi, N. (2008). The late 1980s regime shift in the ecosystem of Tsushima warm current in the Japan/East Sea: evidence from historical data and possible mechanisms. Prog. Oceanogr. 77, 127–145. doi: 10.1016/j.pocean.2008.03.007
Tian, Y., Uchikawa, K., Ueda, Y., and Cheng, J. (2014). Comparison of fluctuations in fish communities and trophic structures of ecosystems from three currents around Japan: synchronies and differences. ICES J. Mar. Sci. 71, 19–34. doi: 10.1093/icesjms/fst169
Vasilakopoulos, P., and Marshall, C. T. (2015). Resilience and tipping points of an exploited fish population over six decades. Glob. Chang. Biol. 21, 1834–1847. doi: 10.1111/gcb.12845
Vasilakopoulos, P., Raitsos, D. E., Tzanatos, E., and Maravelias, C. D. (2017). Resilience and regime shifts in a marine biodiversity hotspot. Sci. Rep. 7, 1–11.
Venables, W. N., and Ripley, B. D. (2002). Modern Applied Statistics with S. Berlin: Springer Publishing Company.
Wang, L., Chen, W., and Huang, R. (2008). Interdecadal modulation of PDO on the impact of ENSO on the east Asian winter monsoon. Geophys. Res. Lett. 35:L20702.
Weare, B. C., and Nasstrom, J. S. (1982). Examples of extended empirical orthogonal function analyses. Month. Weather Rev. 110:481. doi: 10.1175/1520-0493(1982)110<0481:eoeeof>2.0.co;2
Williams, J. W., and Jackson, S. T. (2007). Novel climates, no-analog communities, and ecological surprises. Front. Ecol. Environ. 5, 475–482. doi: 10.1890/070037
Wolkovich, E., Cook, B., McLauchlan, K., and Davies, T. (2014). Temporal ecology in the anthropocene. Ecol. Lett. 17, 1365–1379. doi: 10.1111/ele.12353
Wu, B., and Wang, J. (2002). Winter arctic oscillation, siberian high and east asian winter monsoon. Geophys. Res. Lett. 29:3. doi: 10.1029/2002gl015373
Wu, L., Cai, W., Zhang, L., Nakamura, H., Timmermann, A., Joyce, T., et al. (2012). Enhanced warming over the global subtropical western boundary currents. Nat. Clim. Chang. 2:161. doi: 10.1038/nclimate1353
Yatsu, A. (2019). Review of population dynamics and management of small pelagic fishes around the Japanese archipelago. Fisher. Sci. 85, 611–639. doi: 10.1007/s12562-019-01305-3
Yatsu, A., Chiba, S., Yamanaka, Y., Ito, S., Shimizu, Y., Kaeriyama, M., et al. (2013). Climate forcing and the Kuroshio/Oyashio ecosystem. ICES J. Mar. Sci. 70, 922–933. doi: 10.1093/icesjms/fst084
Zhang, C. I., Lee, J. B., Kim, S., and Oh, J.-H. (2000). Climatic regime shifts and their impacts on marine ecosystem and fisheries resources in Korean waters. Prog. Oceanogr. 47, 171–190. doi: 10.1016/s0079-6611(00)00035-5
Zhang, C. I., Yoon, S. C., and Lee, J. B. (2007). Effects of the 1988/89 climatic regime shift on the structure and function of the southwestern Japan/East Sea ecosystem. J. Mar. Syst. 67, 225–235. doi: 10.1016/j.jmarsys.2006.05.015
Keywords: climate variability, ecosystem, ecological responses, non-stationarity, northwestern North Pacific
Citation: Ma S, Tian Y, Li J, Yu H, Cheng J, Sun P, Fu C, Liu Y and Watanabe Y (2020) Climate Variability Patterns and Their Ecological Effects on Ecosystems in the Northwestern North Pacific. Front. Mar. Sci. 7:546882. doi: 10.3389/fmars.2020.546882
Received: 30 March 2020; Accepted: 18 August 2020;
Published: 16 September 2020.
Edited by:
Shoshiro Minobe, Hokkaido University, JapanReviewed by:
Fabio Pranovi, Ca’ Foscari University of Venice, ItalyTakashi Kitagawa, The University of Tokyo, Japan
Copyright © 2020 Ma, Tian, Li, Yu, Cheng, Sun, Fu, Liu and Watanabe. This is an open-access article distributed under the terms of the Creative Commons Attribution License (CC BY). The use, distribution or reproduction in other forums is permitted, provided the original author(s) and the copyright owner(s) are credited and that the original publication in this journal is cited, in accordance with accepted academic practice. No use, distribution or reproduction is permitted which does not comply with these terms.
*Correspondence: Yongjun Tian, eWp0aWFuQG91Yy5lZHUuY24=; Peng Sun, c3VucGVuZ0BvdWMuZWR1LmNu
 Shuyang Ma
 Yongjun Tian
 Jianchao Li1
 Haiqing Yu
 Peng Sun
 Caihong Fu
 Yang Liu