 Yibang Wang
 Yuanchao Wang
 Cui Liang
 Hui Zhang
 Weiwei Xian
- 1CAS Key Laboratory of Marine Ecology and Environmental Sciences, Institute of Oceanology, Chinese Academy of Sciences, Qingdao, China
- 2Laboratory for Marine Ecology and Environmental Science, Qingdao National Laboratory for Marine Science and Technology, Qingdao, China
- 3Qingdao University of Science and Technology, Qingdao, China
- 4University of Chinese Academy of Sciences, Beijing, China
- 5Center for Ocean Mega-Science, Chinese Academy of Sciences, Qingdao, China
We assessed 12 marine fish species in the Northwestern Pacific exploited by Japanese fisheries, using published catch time series, CPUE data and the CMSY and BSM methods. The results showed that one stock was severely depleted, three stocks were outside of safe biological limits, three stocks were fully/overfished, three stocks were recovering, while the other two stocks were in good condition. These results match those of previous research on the status of fish species in the Northwestern Pacific, where overfishing is becoming increasingly apparent. We used the CMSY/BSM assessments as a basis for suggestions to assist in the management and rebuilding of fishery resources in this area.
Introduction
Concern about overfishing is a global issue, but the successful management of well-assessed fisheries has effectively reduced the impact of fishing in developed regions and countries such as Europe and the United States, respectively (Hilborn and Ovando, 2014; Froese et al., 2018). However, for other regions, e.g., in East Asia, not enough is known about the status of fisheries, which hinders predictions on the future sustainability of global fisheries (Ichinokawa et al., 2017).
Japan is one of the most important fishing countries in the world, with the fifth largest catch; according to the Food and Agriculture Organization (FAO), Japan accounts for 5% of the world marine catch (FAO, 2016). In 1997, the Japanese Fisheries Agency introduced fisheries management, combining total allowable catch (TAC) with traditional effort limitations (Makino, 2011). Every year since 1998, the Fisheries Research Agency of Japan (FRA) has been assessing 84 stocks of 52 important fish species, including the species studied here, i.e., Clidoderma asperrimum, Engraulis japonicus, Etrumeus teres, Theragra chalcogramma, Glossanodon semifasciatus, Laemonema longipes, Lophius litulon, Sardinops melanostictus, Scomber australasicus, Sebastolobus macrochir, Tanakius kitaharae, and Trachurus japonicus (Ichinokawa et al., 2017). Thus, the data used in our research are considered reliable and the evaluation results can be compared with their reports.
Catch-MSY was proposed as a new method to estimate the maximum sustainable yield (MSY) and related indicators (notably carrying capacity k, and intrinsic rate of population growth r, or ‘resilience’) using only catch data and a Monte-Carlo approach (Martell and Froese, 2013). Froese et al. (2017) improved on this method, now called CMSY, to address its shortcomings, including the selection of the optimal combination of r and k, and the provision of default priors for relative stock size at the first and end year of the catch data time series. It also addressed the issue of ‘depensation’ i.e., the reduction of r that often occurs at very low stock sizes, and added a routine for a Bayesian state-space implementation of the Schaefer model (BSM), which allowed incorporating time series of relative biomass (e.g., CPUE data) into the analyses to reduce the uncertainty of the estimates of MSY and related statistics.
In this study we applied the CMSY and BSM methods (Froese et al., 2017) to 12 species caught by Japanese fishing vessels in the northwestern Pacific, to assess the status of their fisheries.
Materials and Methods
Data Sources
The data source and main sources of available information on the 12 fish stocks investigated here are summarized in Table 1. The data were released by the Fisheries Agency of Japan in 20181.
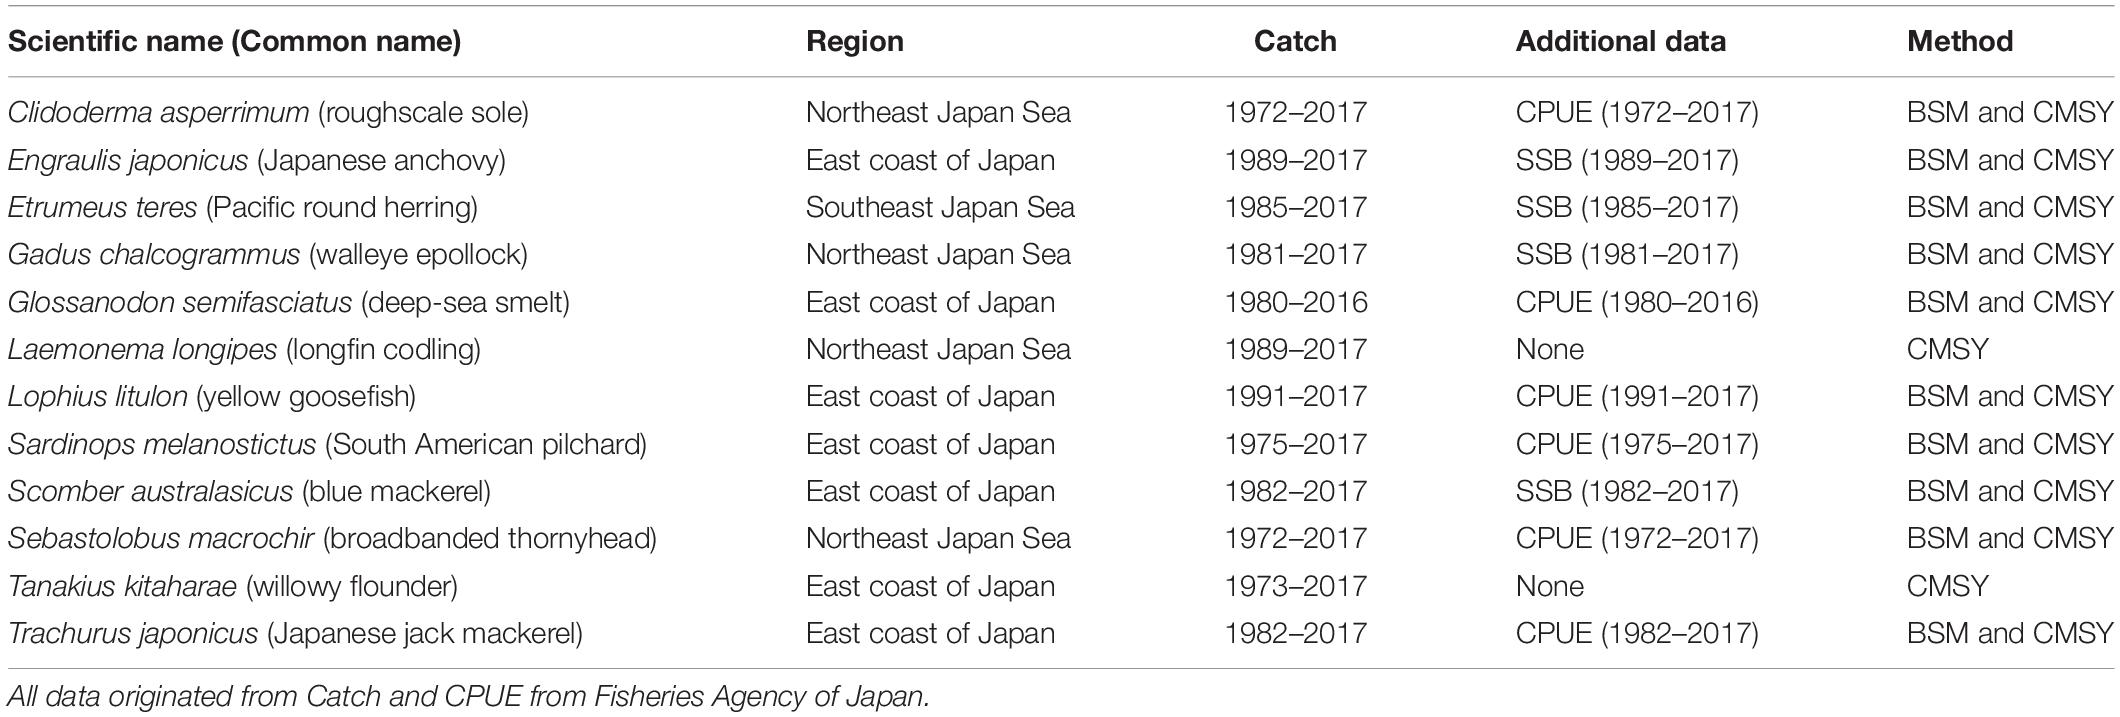
Table 1. Summary of data available for the stock assessments presented here.
Declaration Statement
Our manuscript was based on survey cruise data, and no live vertebrates or higher invertebrates were involved; thus we believe that an ethical review process was not required for our study.
General Description of the CMSY and BSM Methods
The CMSY catch-only approach, applying advanced Monte-Carlo filtering, can be used to produce proxies for MSY, biomass that can produce MSY (Bmsy), fishing pressure that can produce MSY (Fmsy). Also, CMSY estimates biomass and related fishery reference points such as relative stock size (B/Bmsy) and exploitation (F/Fmsy), based on a catch time series and a measure of the productivity or ‘resilience’ of the species. Furthermore, a Bayesian state-space Schaefer surplus production model (BSM) is included in the CMSY software and produces refined stock status estimates, which requires catch and effort or an index of biomass or relative abundance (e.g., catch per unit of effort) as input (Froese et al., 2017, 2018).
It is the goal for CMSY to combine information on the stock’s productivity and exploitation history with data from surveys and official catch reports. CMSY can also account for gaps (or absence) in abundance information, which is the main advantage compared to other models (Froese et al., 2018).
A time series of catch can be regarded as the product of the available biomass times its productivity; thus, if two of the three variables are known (that is, catch, biomass and productivity) the third variable can be estimated (Froese et al., 2017). Given a prior range of unexploited biomass (assumed to represent carrying capacity, or k) and a prior range of r, the CMSY method uses Monte-Carlo approach to detect viable or ‘feasible’ r–k pairs. A pair of r-k values is considered ‘feasible’ if the biomass trajectory that can be computed from it is compatible with the observed catch time series, if the predicted biomasses do not become negative and remain compatible with the prior estimates of the relative biomass range at the beginning and end of the respective time series. Under these conditions, a feasible set of r–k pairs would normally generate a relatively small triangular cloud in log space, from which a single r-k pair can be selected as optimal (Froese et al., 2017). For validation, the predictions of the CMSY method were compared with simulated data with known parameters and biomass data (Froese et al., 2017).
Here, we give the basic equations on the CMSY approach, while further details on the CMSY estimation framework and concepts are given in the detailed CMSY documentation by Froese et al. (2017).
The basic biomass dynamics are described by Equation (1):
where Bt+1 is the exploited biomass in the subsequent year t + 1, Bt is the current biomass, r is the intrinsic rate of population increase, k is the carrying capacity (assumed equivalent to the unexploited population size) and Ct is the catch in year t.
When the biomass of a stock is severely depleted, and falls below 0.25 k, Equation (1) is changed to Equation (2):
where the term 4Bt/k assumes a linear decline of recruitment at less than half of the biomass capable of producing MSY.
Determining the Boundaries of the r-k Space
To determine priors r for the 12 species being evaluated, the resilience levels provided by FishBase (Froese and Pauly, 2019) were converted to r-ranges (Table 2).
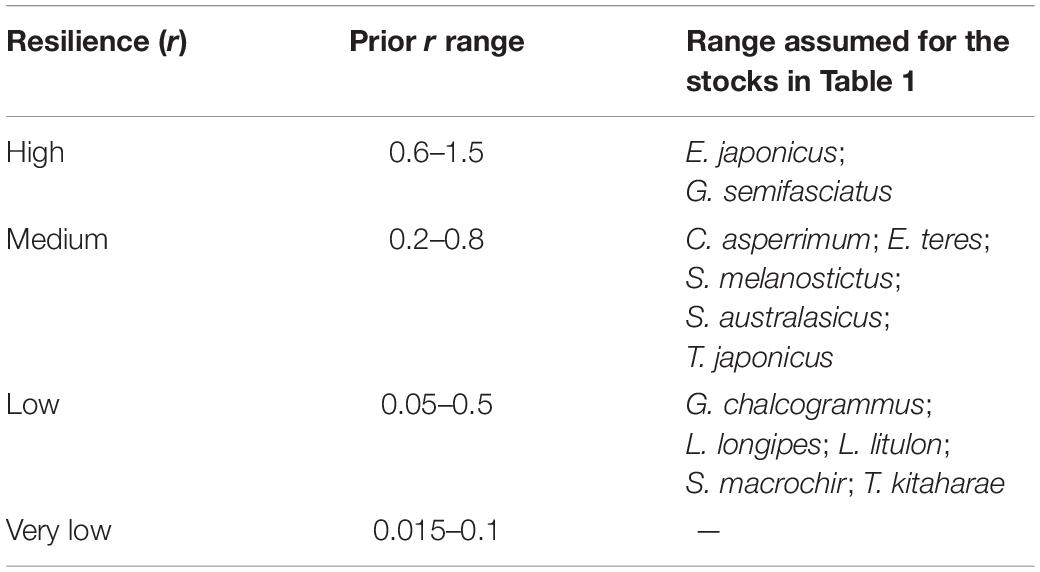
Table 2. Ranges suggested by FishBase (Froese and Pauly, 2019) for population growth rate (year–1).
The prior ranges of k were then estimated based on three hypotheses: (1) the size of the unexploited population k is greater than the maximum catch in the time series, thus the lower limit of k is determined by this maximum catch; (2) MSY is expressed as a fraction of the available biomass, and the size of this fraction depends on the productivity of the population. Thus, dividing the maximum catch by the upper and lower limits of r should provide reasonable limits for the upper and lower values of k; (3) the maximum catch will constitute a greater proportion of k in severely depleted stocks than in stocks that are lightly depleted.
These considerations are summarized in Equations (3) and (4). Given known values of k, the appropriate range of the catch/productivity ratio was empirically determined using simulation data (Froese et al., 2017).
where klow and khigh are the lower and upper bounds of the prior range of k, max(C) is the maximum catch in the time series, and rlow and rhigh are the lower and upper boundaries of the range of r values that the CMSY method will explore.
where the variables and parameters are defined as in Equation (3) (Froese et al., 2017).
Setting Prior Biomass Ranges
To provide a prior estimate of relative biomass at the beginning and end of the time series and for the (optional) intermediate years, several possible biomass ranges were selected, based on the assumed depletion level; see Tables 3, 4 and Froese et al. (2017).
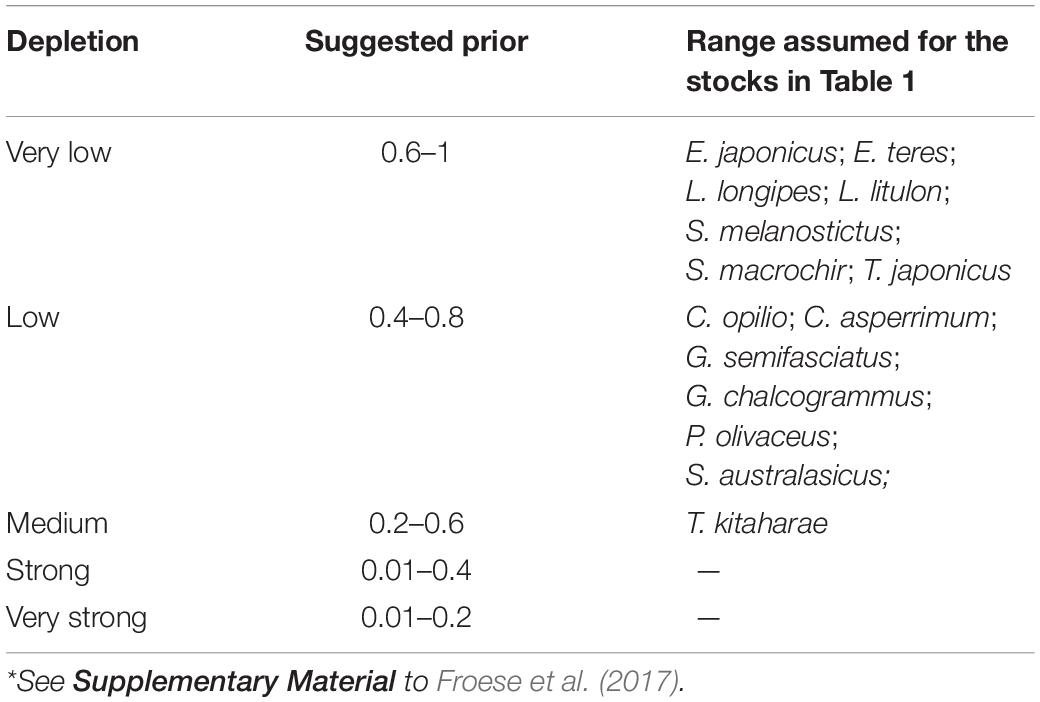
Table 3. Suggested fractions Bstart/k for the period before catch data became available*.
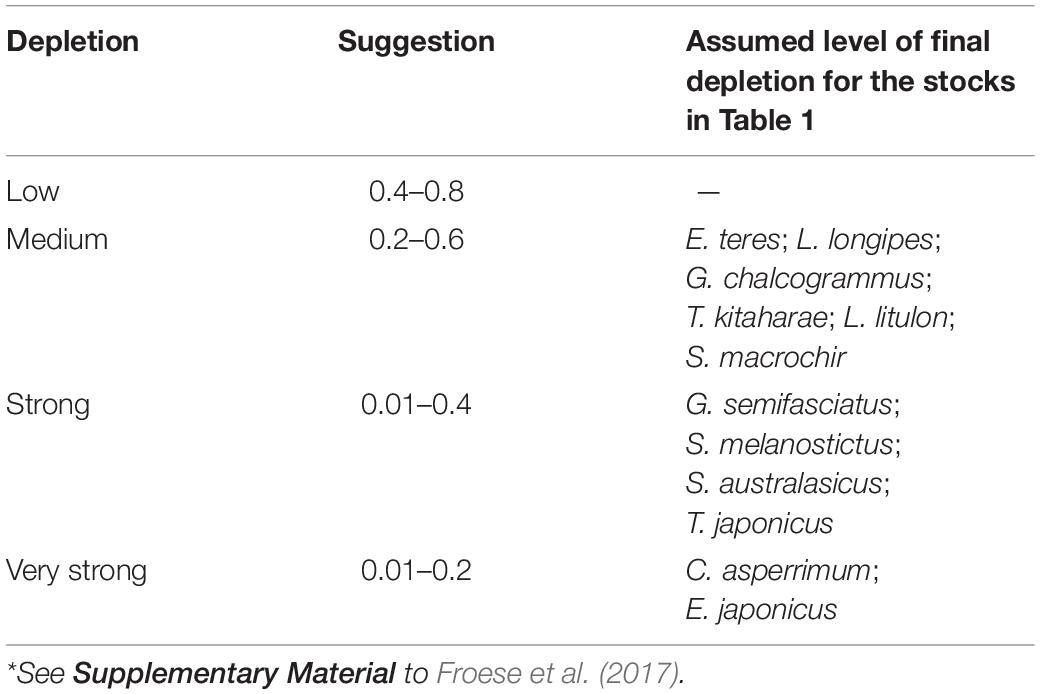
Table 4. Suggested ranges of the fraction Bend/k for the period prior to catches being available*.
Table 3 presents the recommended Bstart/k range for the 12 stocks evaluated. Studies have shown that global fishing efforts, expressed in terms of total engine power and the number of catch days (kilowatt days) in a year, remained roughly unchanged from 1950 to 1970 and then steadily increased to the present (Anticamara et al., 2011).
Thus, we set Bstart/k of C. asperrimum (Hattori et al., 2008), G. chalcogramma (Nishimura et al., 2002), G. semifasciatus (Nashida et al., 2007), and S. australasicus (Fisheries Agency of Japan, 2018) as low (Bstart/k = 0.4–0.8), and E. japonicus (Wada, 1997), E. teres (Nyuji and Takasuka, 2017), L. longipes (Fisheries Agency of Japan, 2018), L. litulon (Fisheries Agency of Japan, 2018), S. melanostictus (Watanabe et al., 1995), S. macrochir (Noranarttragoon et al., 2011), and T. japonicus (Fisheries Agency of Japan, 2018) as very low (Bstart/k = 0.6–1).
The Bstart/k for T. kitaharae was set at medium depletion (0.2–0.6; Table 3) to force its biomass at the start of the assessment period to be ‘medium’ (Fisheries Agency of Japan, 2018).
Table 4 presents the recommended Bend/k range for the 12 stocks evaluated. Considering the results in published research papers for each of the species, we chose a ‘very strong’ depletion at the end of the time series (i.e., Bend/k = 0.01–0.2), for C. asperrimum (Hattori et al., 2008) and E. japonicus (Fisheries Agency of Japan, 2018). For the other species, we found sources suggesting ‘strong’ depletions (Bend/k = 0.01–0.4): G. semifasciatus (Nashida et al., 2007), S. melanostictus (Fisheries Agency of Japan, 2018), S. australasicus (Fisheries Agency of Japan, 2018), and T. japonicus (Fisheries Agency of Japan, 2018) (Table 4).
Results
All 12 stocks were analyzed using the CMSY method. The BSM method was applied to 10 stocks with CPUE data (Table 1).
The blue mackerel (Scomber australasicus) is a widely distributed and commercially exploited species in Japanese coastal waters and we used it to illustrate the CMSY and BSM outputs (Figure 1). The results of the other species are presented in Supplementary Materials.
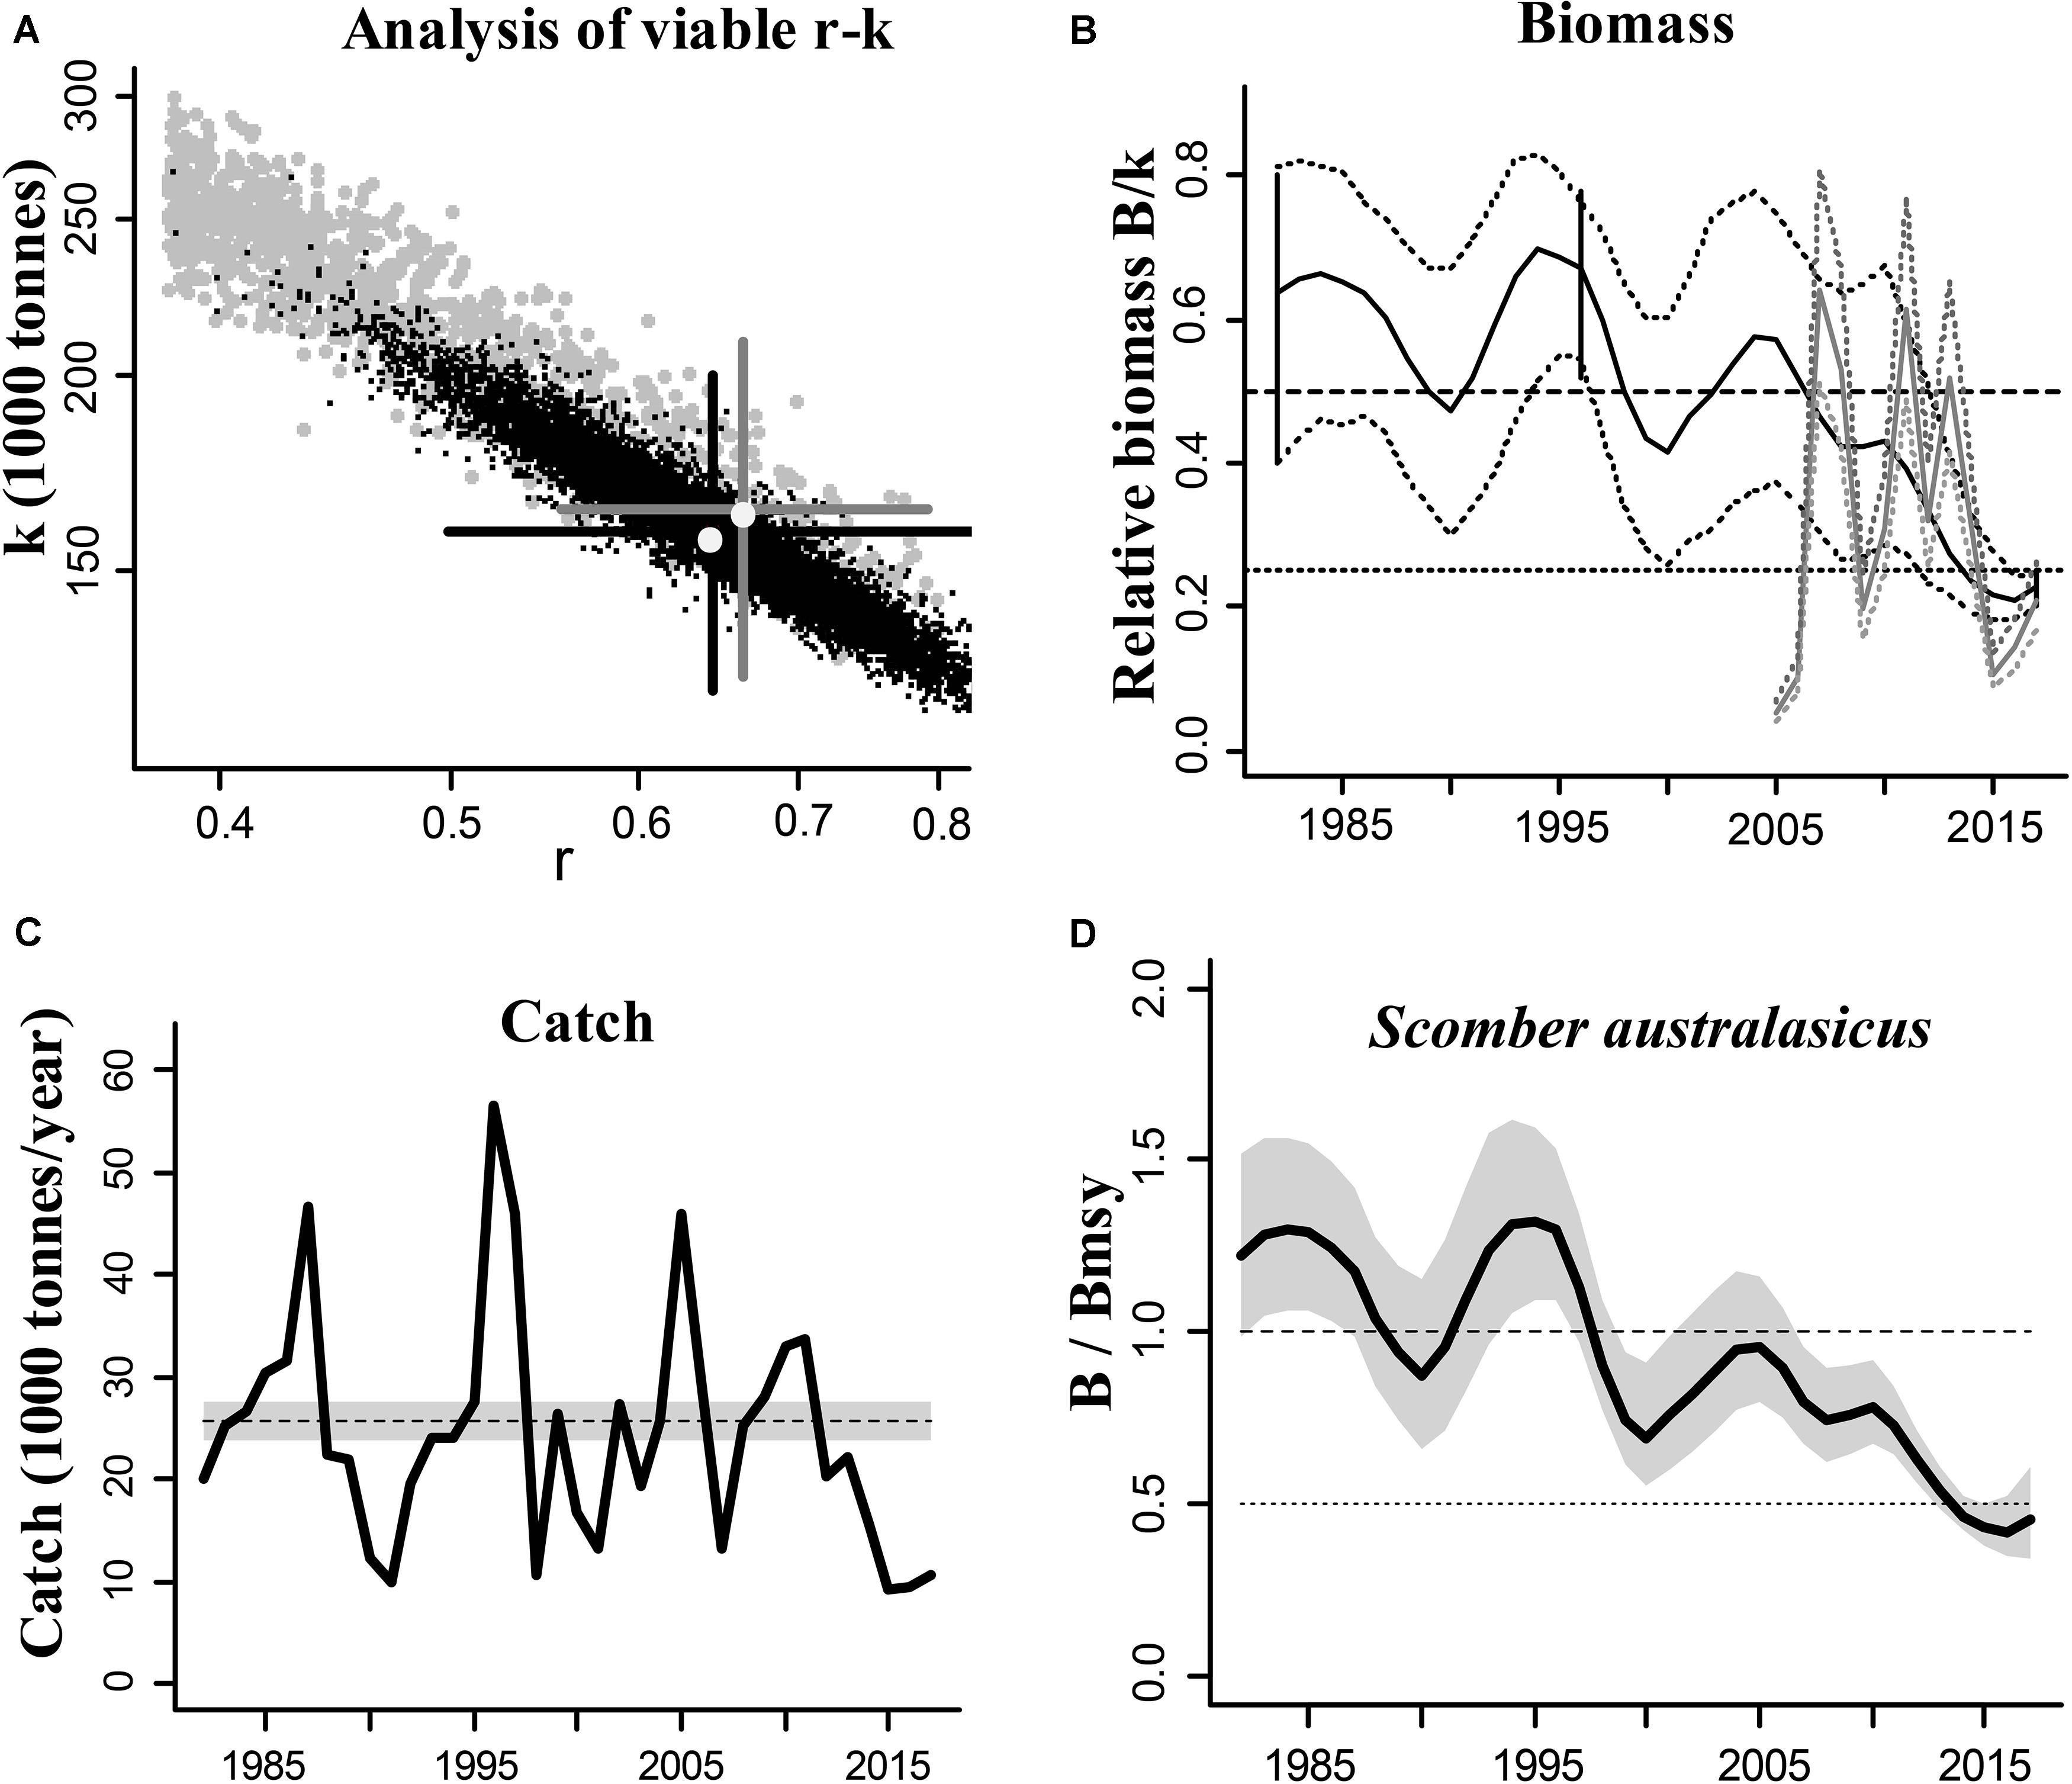
Figure 1. Results of the CMSY and BSM analyses for the blue mackerel (Scomber australasicus) in the Northwestern Pacific (east coastal of Japan). (A) feasible r–k pairs found by CMSY (gray points) and BSM methods (black points). The optimal r–k pair estimated by CMSY and its approximate 95% confidence interval (CI) are represented by a gray cross, and the optimal r–k pair estimated by BSM and its approximate CI are represented by a black cross. In this example the estimates of the two methods are similar, which suggests that the results are reliable; (B) biomass trajectory estimated by CMSY (black line) and available abundance data scaled to the BSM estimate of k (gray line), along with the 2.5th and 97.5th percentiles. The vertical lines show the prior ranges for relative biomass. The dashed horizontal line indicates Bmsy = 0.5 k, while the dotted horizontal line indicates half Bmsy as the limit below which recruitment may be impaired; (C) catches relative to the BSM estimate of MSY and its CI; (D) estimated relative biomass trajectory (B/Bmsy), with the gray area indicating uncertainty.
Figures 2, 3 visually summarize our results regarding the development of relative biomass, while Tables 5, 6 provide numerical information.
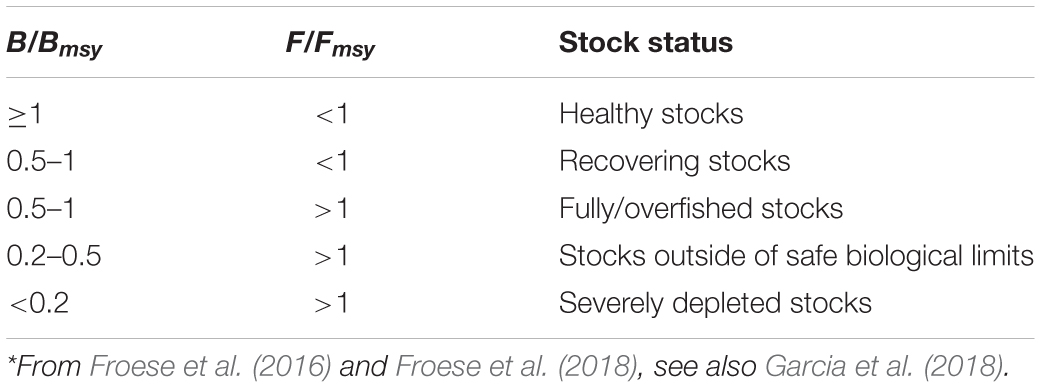
Table 5. Definition of fish stock status, based on B/Bmsy and F/Fmsy in the final year of a time series*.
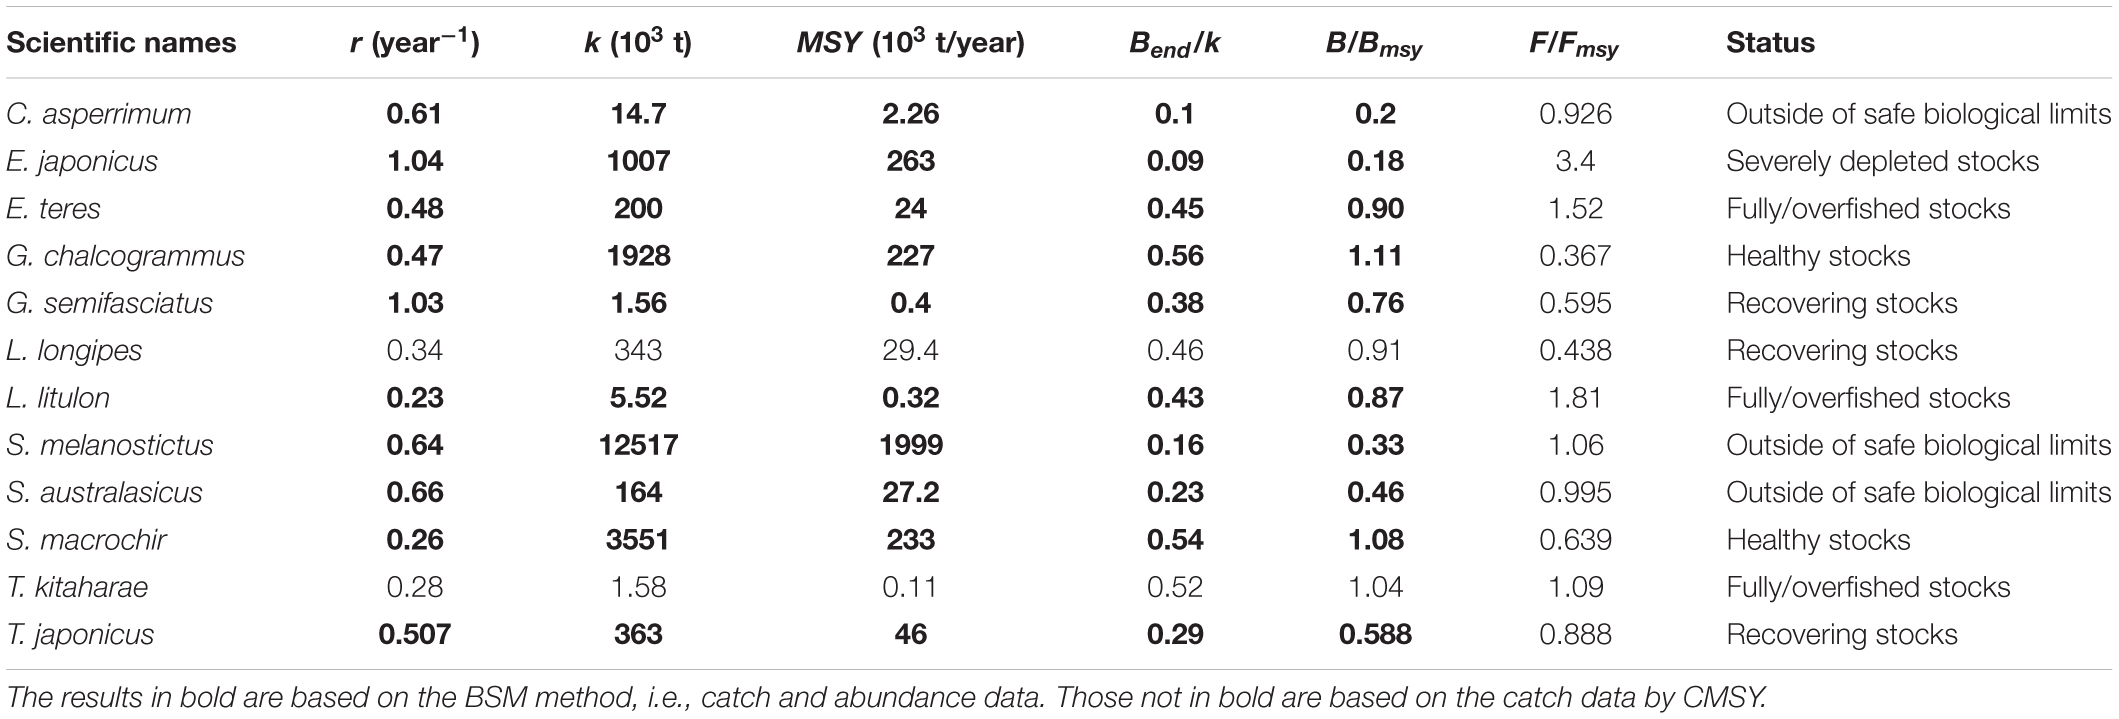
Table 6. Estimates of r, k, MSY, relative biomass and status as obtained by CMSY and/or BSM method for 12 stocks exploited by Japanese fleets.
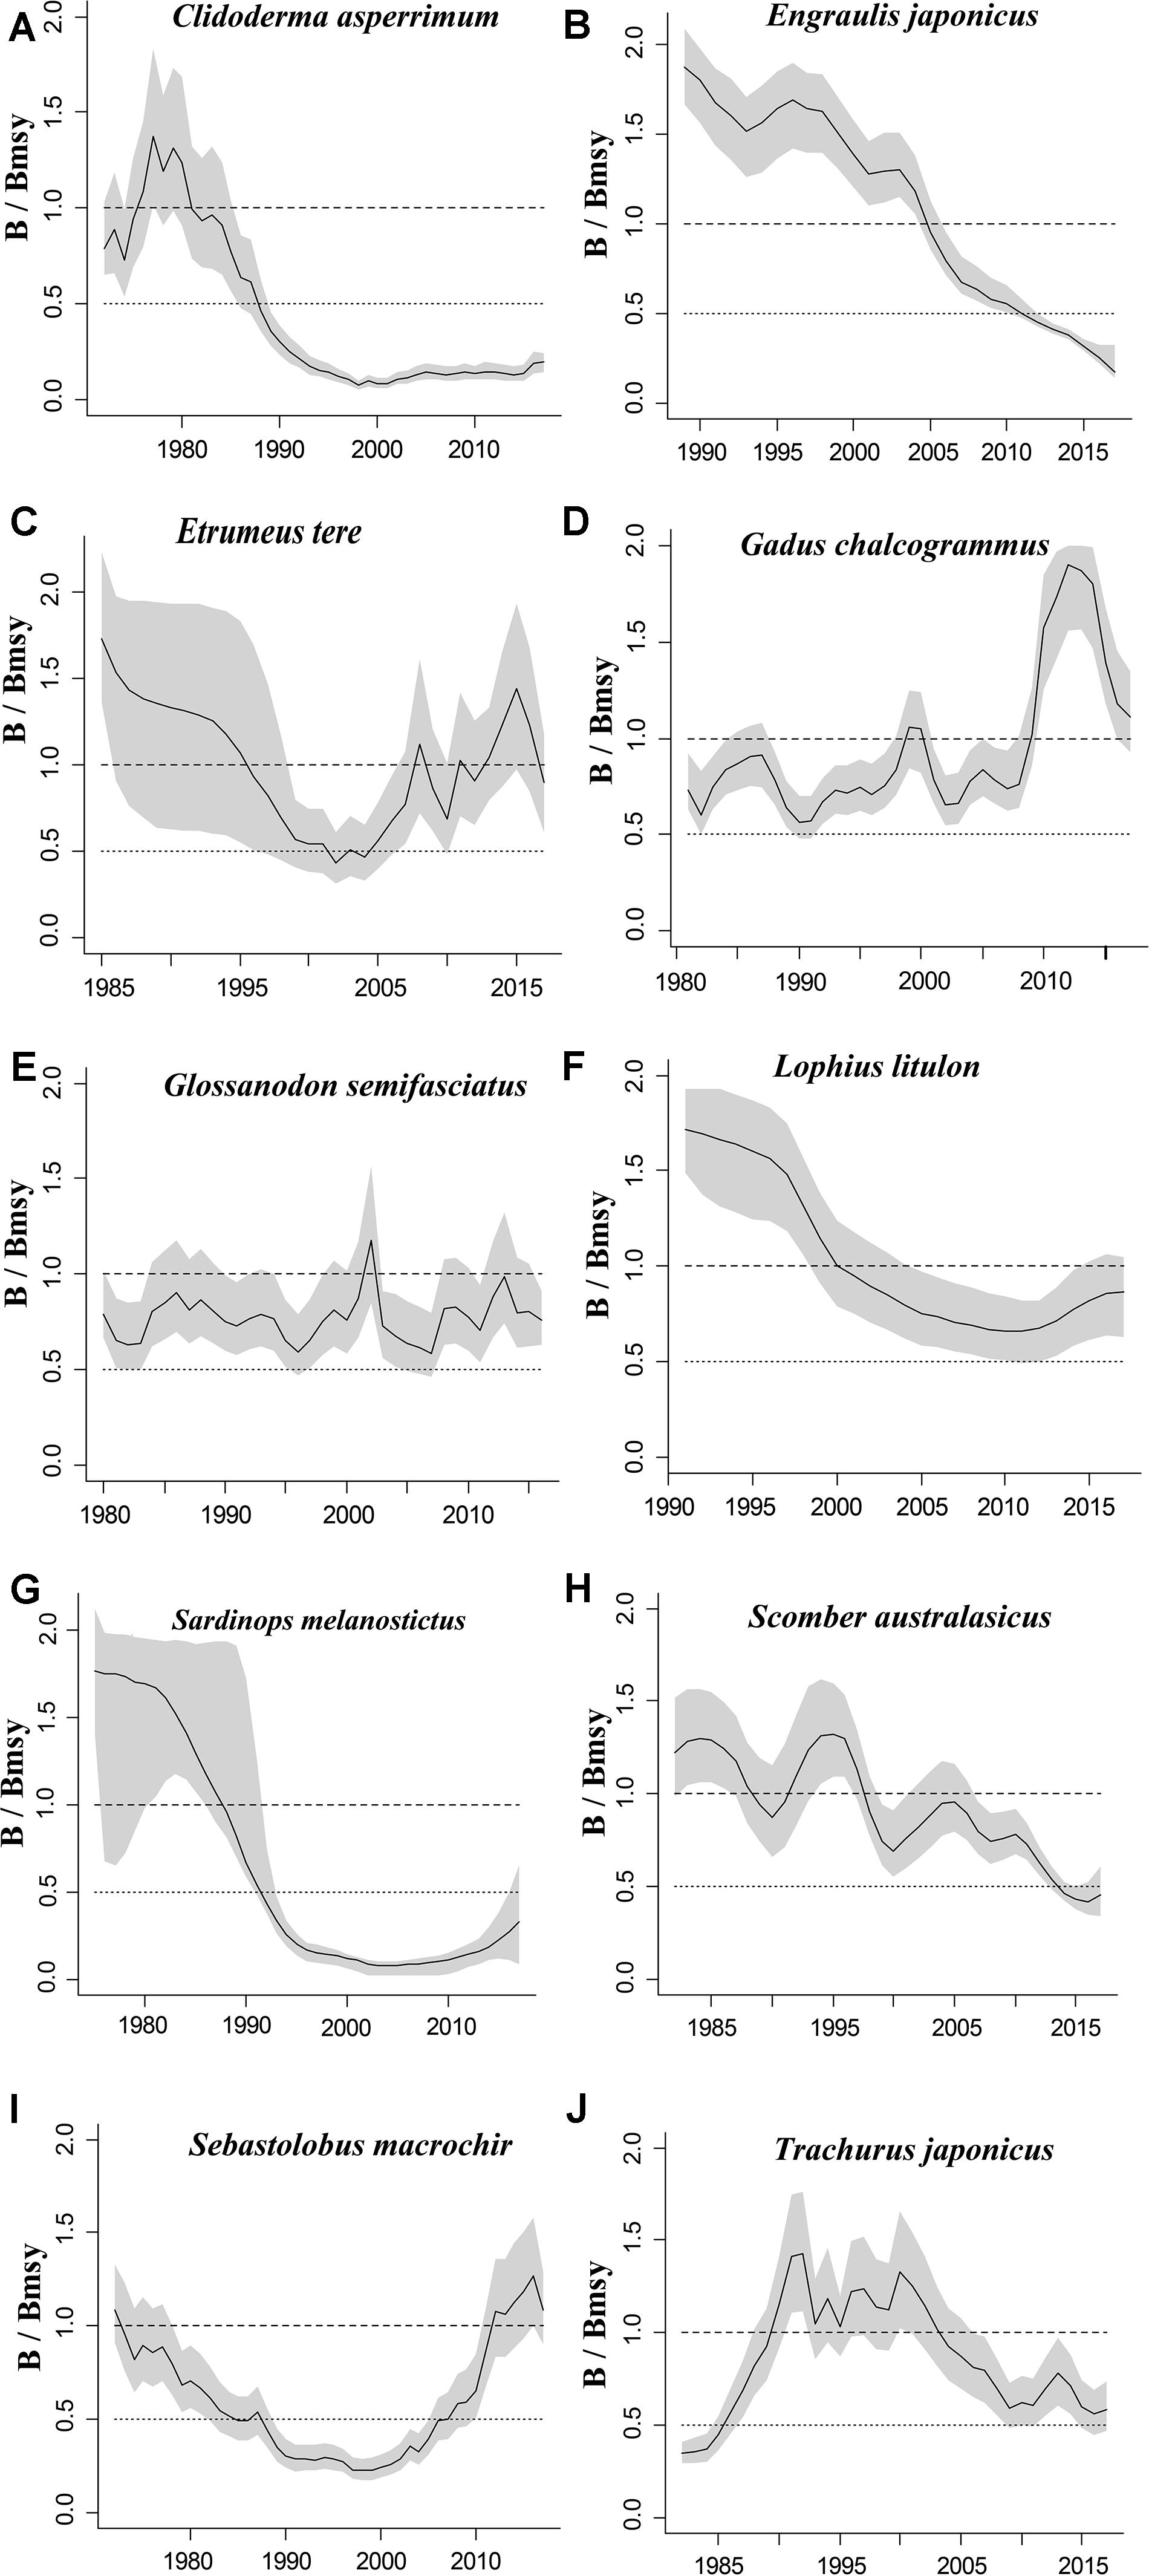
Figure 2. Relative biomass (B/Bmsy) trajectories generated by CMSY and BSM for 10 stocks with CPUE data.
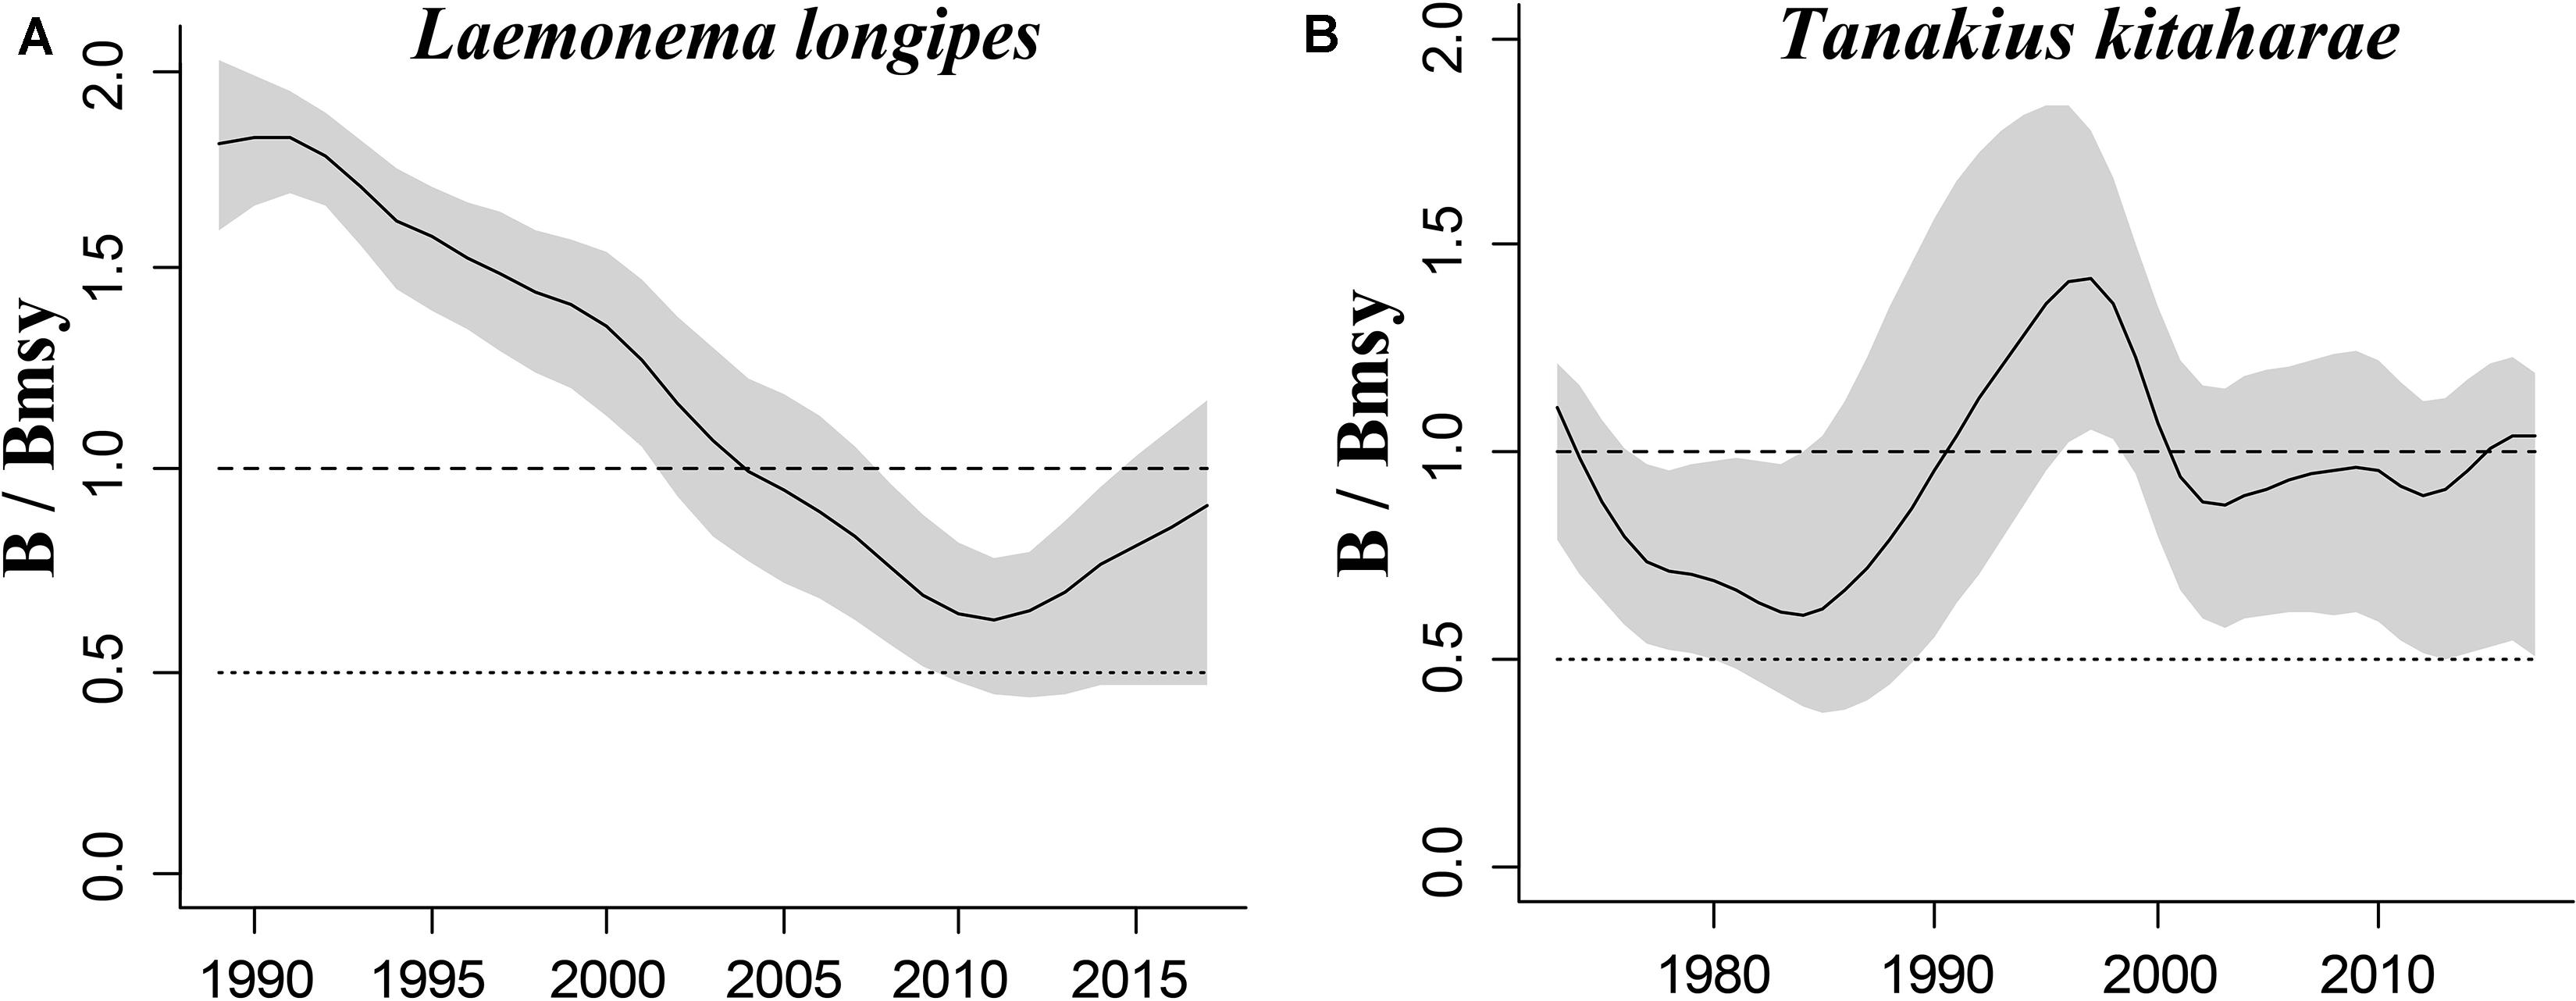
Figure 3. Relative biomass (B/Bmsy) trajectories generated by CMSY for 2 stocks without CPUE data.
The figures of relative biomass (B/Bmsy) clearly show that, in this area, 4 species were severely depleted and/or outside of safe biological limits in the last years with available data (2016–2017) (Figures 2, 3). The figures of fishing pressure (F/Fmsy) clearly present that 5 species were overexploited in the last years with available data (2016–2017) (Figures 4, 5).
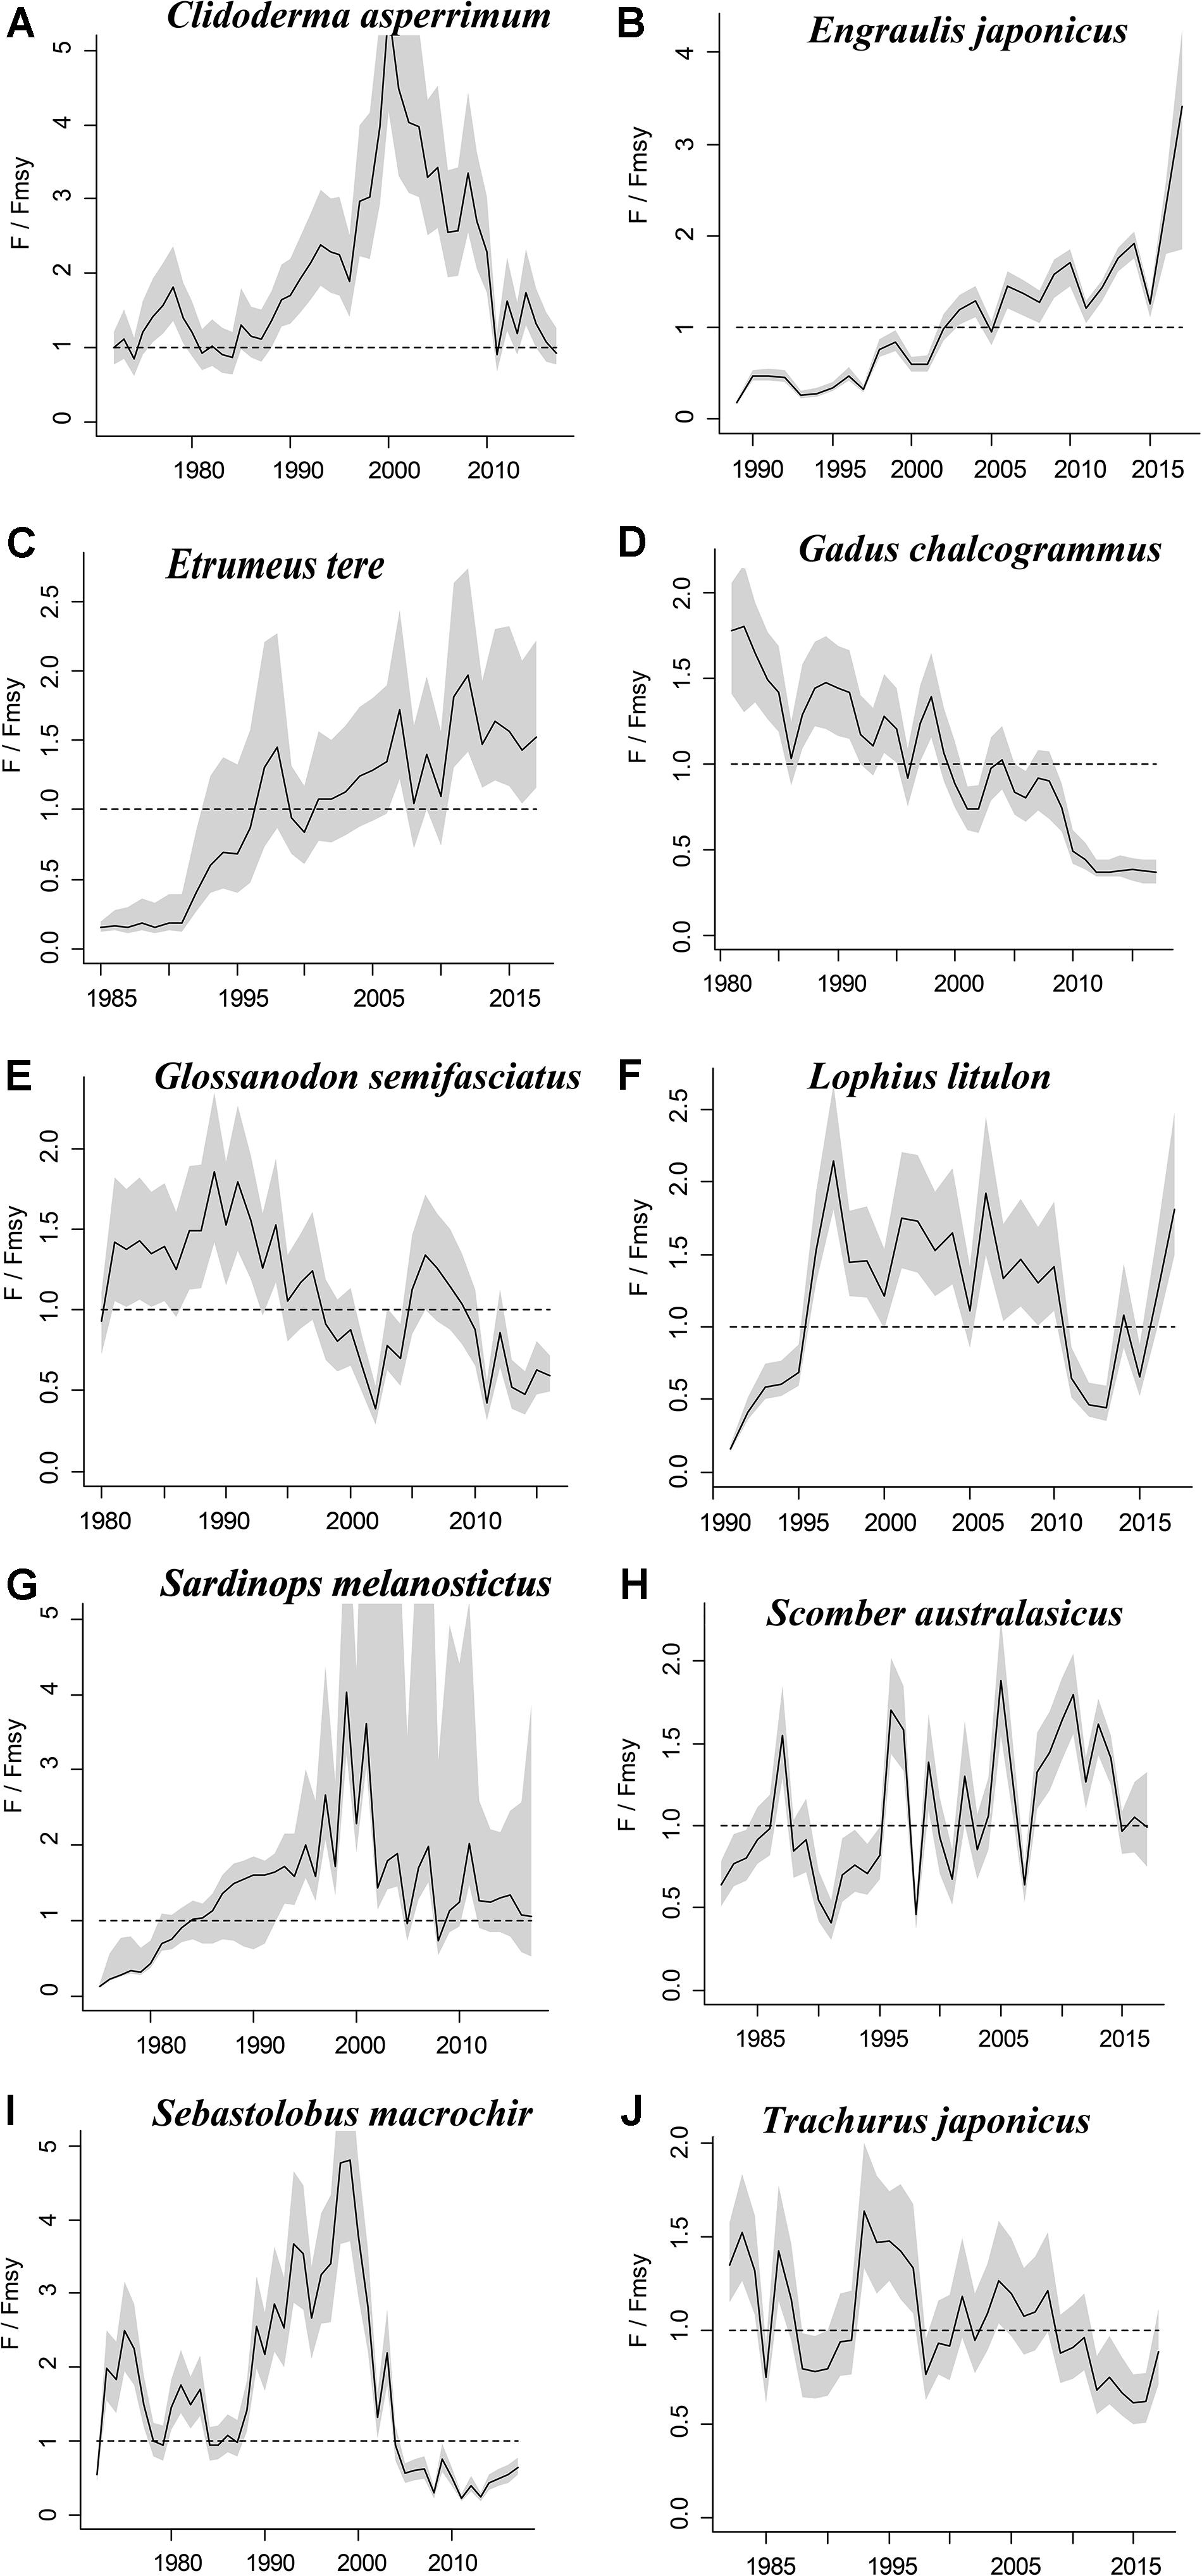
Figure 4. Exploitation level (F/Fmsy) trajectories generated by CMSY and BSM for 10 stocks with CPUE data.
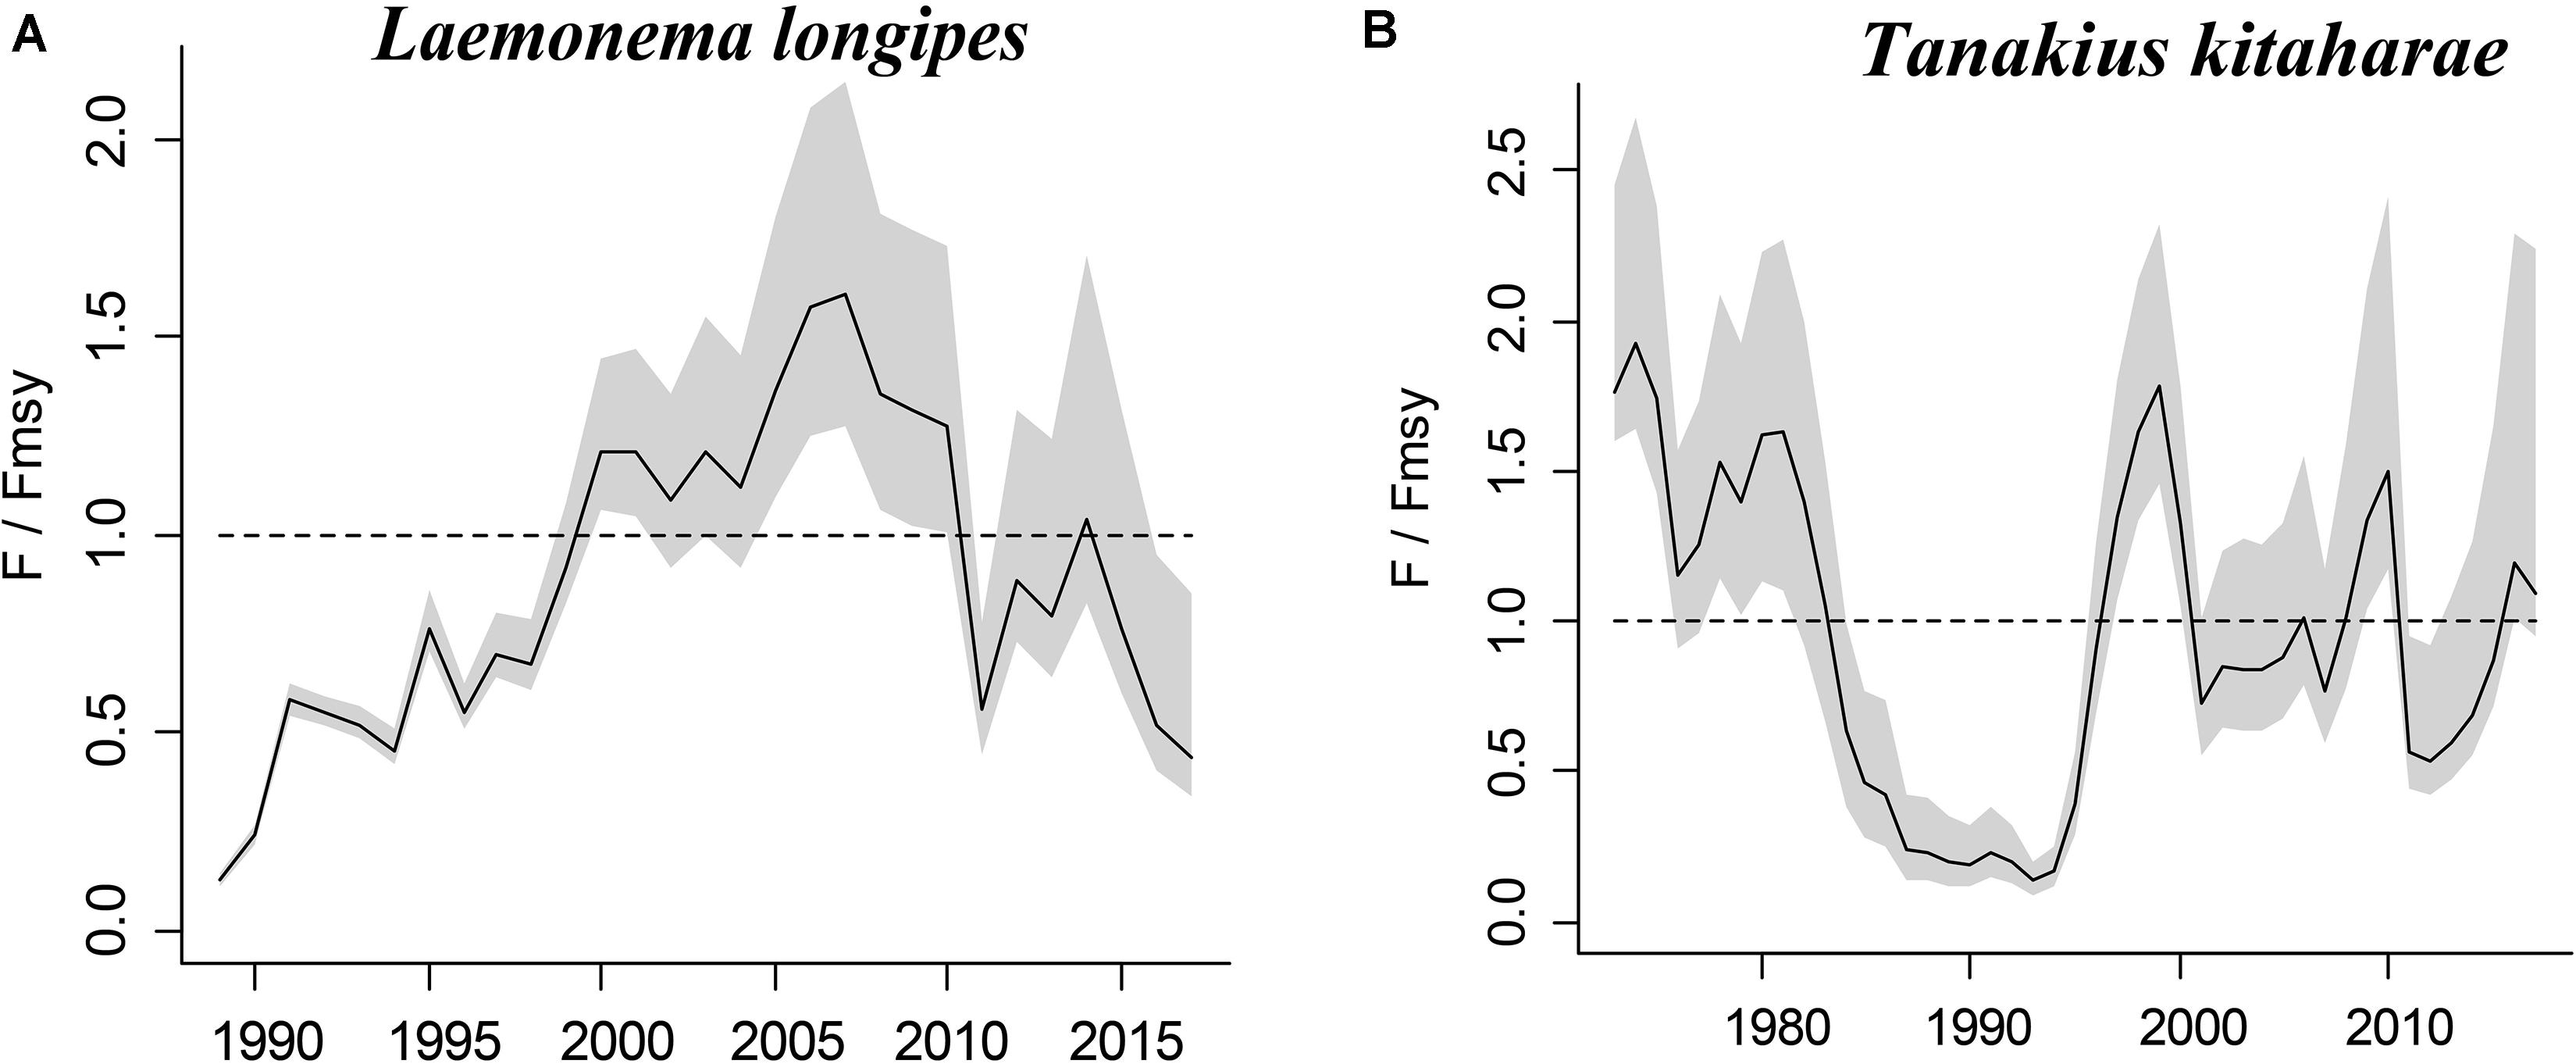
Figure 5. Exploitation level (F/Fmsy) trajectories generated by CMSY for 2 stocks without CPUE data.
The fishing pressure (F/Fmsy) – stock state (B/Bmsy) plot clearly shows that, in the northwest Pacific, more than half of the species assessed are overexploited and/or outside of safe biological limits in the last years with available data (2016–2017) (Figure 6).
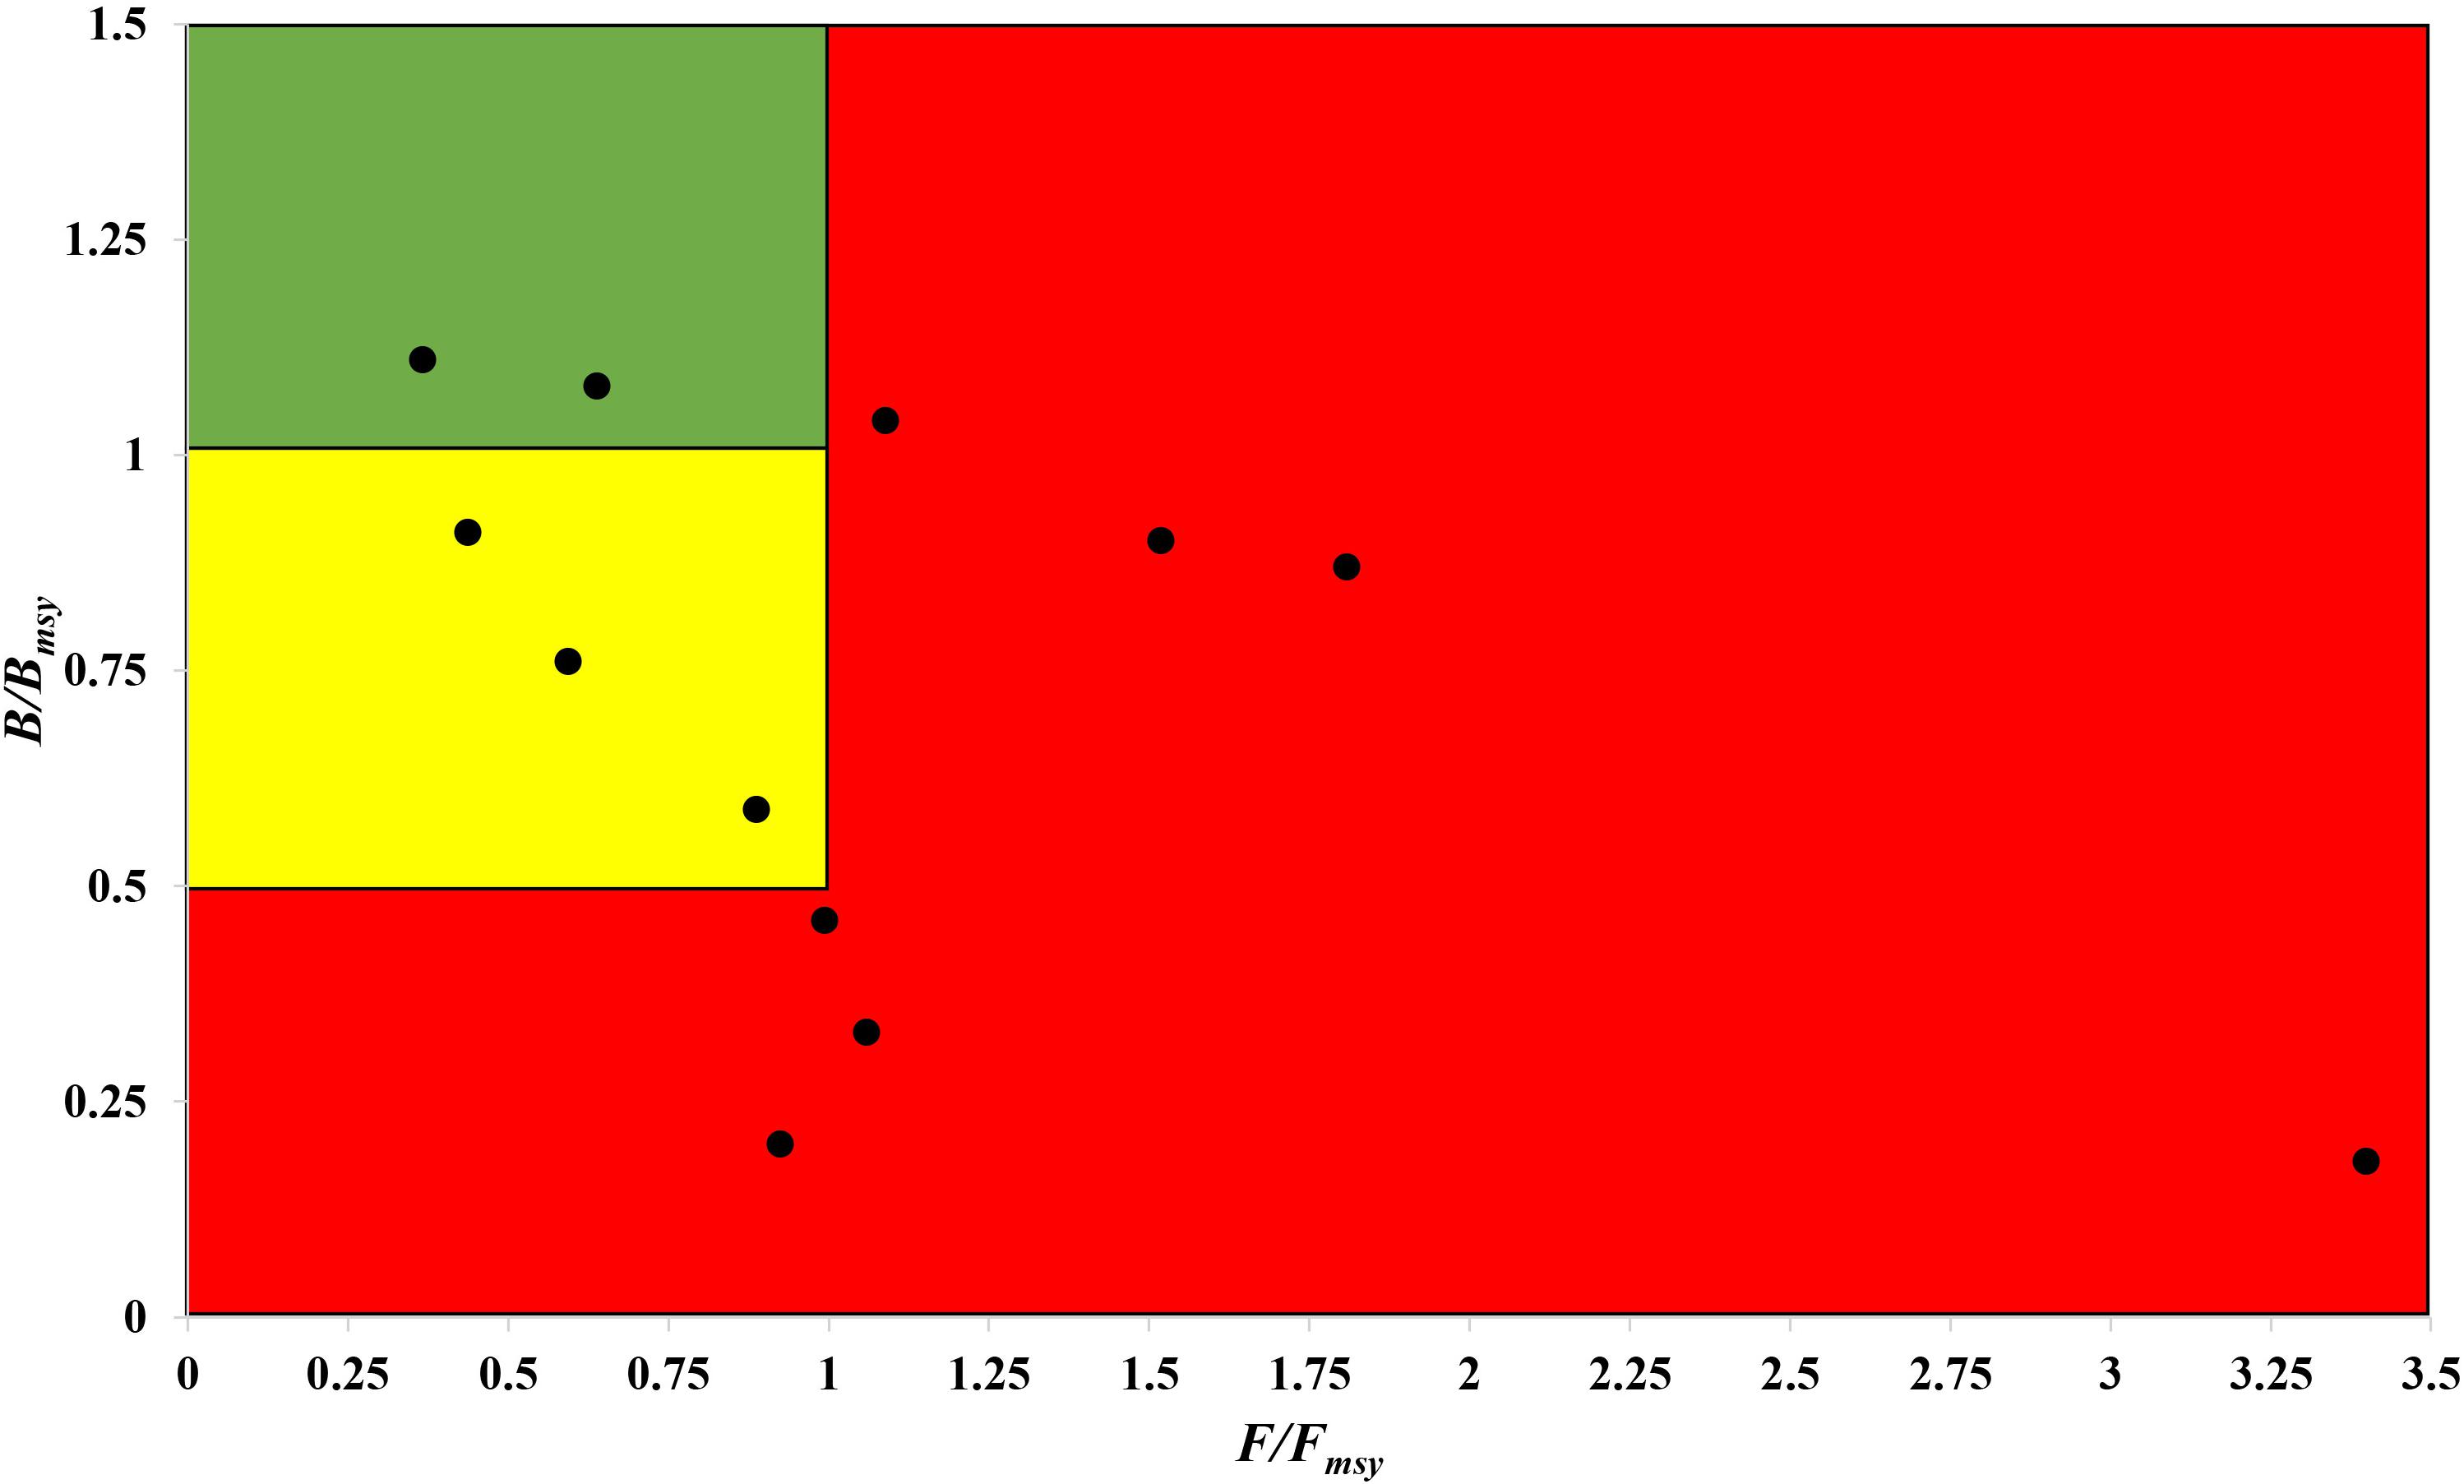
Figure 6. Presentation of 12 stocks in the northwest Pacific in a pressure (F/Fmsy) – status (B/Bmsy) plot, for the last years with available data (2016–2017). Red area: stocks that are being overfished or are outside of safe biological limits; yellow area: recovering stocks; green area: stocks subject to sustainable fishing pressure and of a healthy stock biomass that can produce high yields close to MSY.
Thus, stocks of the 12 species can be defined according to the B/Bmsy of the last year of a time series (Table 5). Table 6 summarizes r, k, MSY, F/Fmsy and relative biomass, and provides estimates for the 12 species, as obtained by the CMSY and/or the BSM methods. Among the 12 stocks, 5 (42%) were subject to ongoing overfishing (F/Fmsy > 1) and 4 stocks (33%) were outside of safe biological limits (B/Bmsy < 0.5) or severely depleted (B/Bmsy < 0.2) (Table 6). Three stocks (25%) were in critical condition, defined by being outside of safe biological limits. Altogether, 7 stocks (58%) were subject to unsustainable exploitation (F/Fmsy > 1 or B/Bmsy < 0.2). In contrast, only 4 stocks (33%) could be considered as being well managed and in good condition according to the analysis, i.e., recovering or being healthy and having a biomass above the one that can produce MSY (Table 6).
Discussion
The results of our application of the CMSY and BSM methods to 12 fish species caught by Japanese fishing vessels in the northwestern Pacific are discussed below.
Roughscale Sole (C. asperrimum)
Roughscale sole (C. asperrimum), of the family Pleuronectidae, has a wide range in the northern Pacific, from China, Japan and the Kuril Islands to Canada and California, where the seabed is muddy and sandy (Tokranov and Orlov, 2003; see also Froese and Pauly, 2019). This species is important commercially to the offshore trawl fishery off northeastern Japan. Although trawling catches off the northeastern coast peaked at 6,329 tonnes in 1978 (Hattori et al., 2008), they declined sharply in 1990–2000 and catches were below 300 tonnes in 2010. Since 2003, fisheries managers in northeastern Japan have implemented a large-scale restoration program for benthic fish stocks, mainly through the protection of spawning populations via the designation of fisheries restricted areas for a certain period of time (Abe et al., 2013). The estimate of Bend/k = 0.1 indicated that the resource status of this species was highly depleted in 2017, while B/Bmsy = 0.2 indicated that this species was severely depleted. The relative biomass reached its peak in 1978 and then declined sharply (Figure 2A), consistent with the results of Abe et al. (2013). There are only a few papers on the assessment of the roughscale sole at present (Abe et al., 2013), although they mainly focus on morphological and habitat characteristics. Thus, it is important to use CMSY and BSM, aiming to assess the current stock status and exploitation level and provide theoretical basis for fishery managers.
Japanese Anchovy (E. japonicus)
Japanese anchovy is mainly distributed in the western Pacific, including the south Sakhalin Islands, the Sea of Japan and the Pacific coast of Japan, and south to Guangdong and Taiwan (Froese and Pauly, 2019). Japanese anchovy is one of the most important fish species in Japan. It is thought to consist of three major stocks: (i) Pacific fish found mainly along the southern Pacific coast of Honshu and Shikoku; (ii) in the Tsushima Warm Current, mainly in the Sea of Japan and the East China Sea; and (iii) in the Seto Inland Sea (Zenitani and Kimura, 2007). Here, we considered Japanese anchovy is the first stock. Japanese anchovy began to be fished in the late 1980s. In 1989, the annual landings of the species amounted to 40,000 tonnes, and in 1995 they increased dramatically to 489,000 tonnes (Wada, 1997). In our research, the estimate Bend/k = 0.09 suggested that the resource status of this species was strongly depleted in 2017, while the B/Bmsy = 0.18 indicated that the stock is grossly overfished. The relative biomass of Japanese anchovy was on a declining trend from 1989 to 2017 (Figure 2B) and, even though the resilience of the species is relatively high, its biomass remained at an extremely low level owing to overfishing. Our results are in line with those of a report released by the fisheries agency in 2018 (Fisheries Agency of Japan, 2018). Yatsu (2019) reported the stock assessment of Japanese anchovy with data from 1905 to 2015 in the northwestern Pacific, suggesting that it is overfished, which is consistent with our result (Table 7).
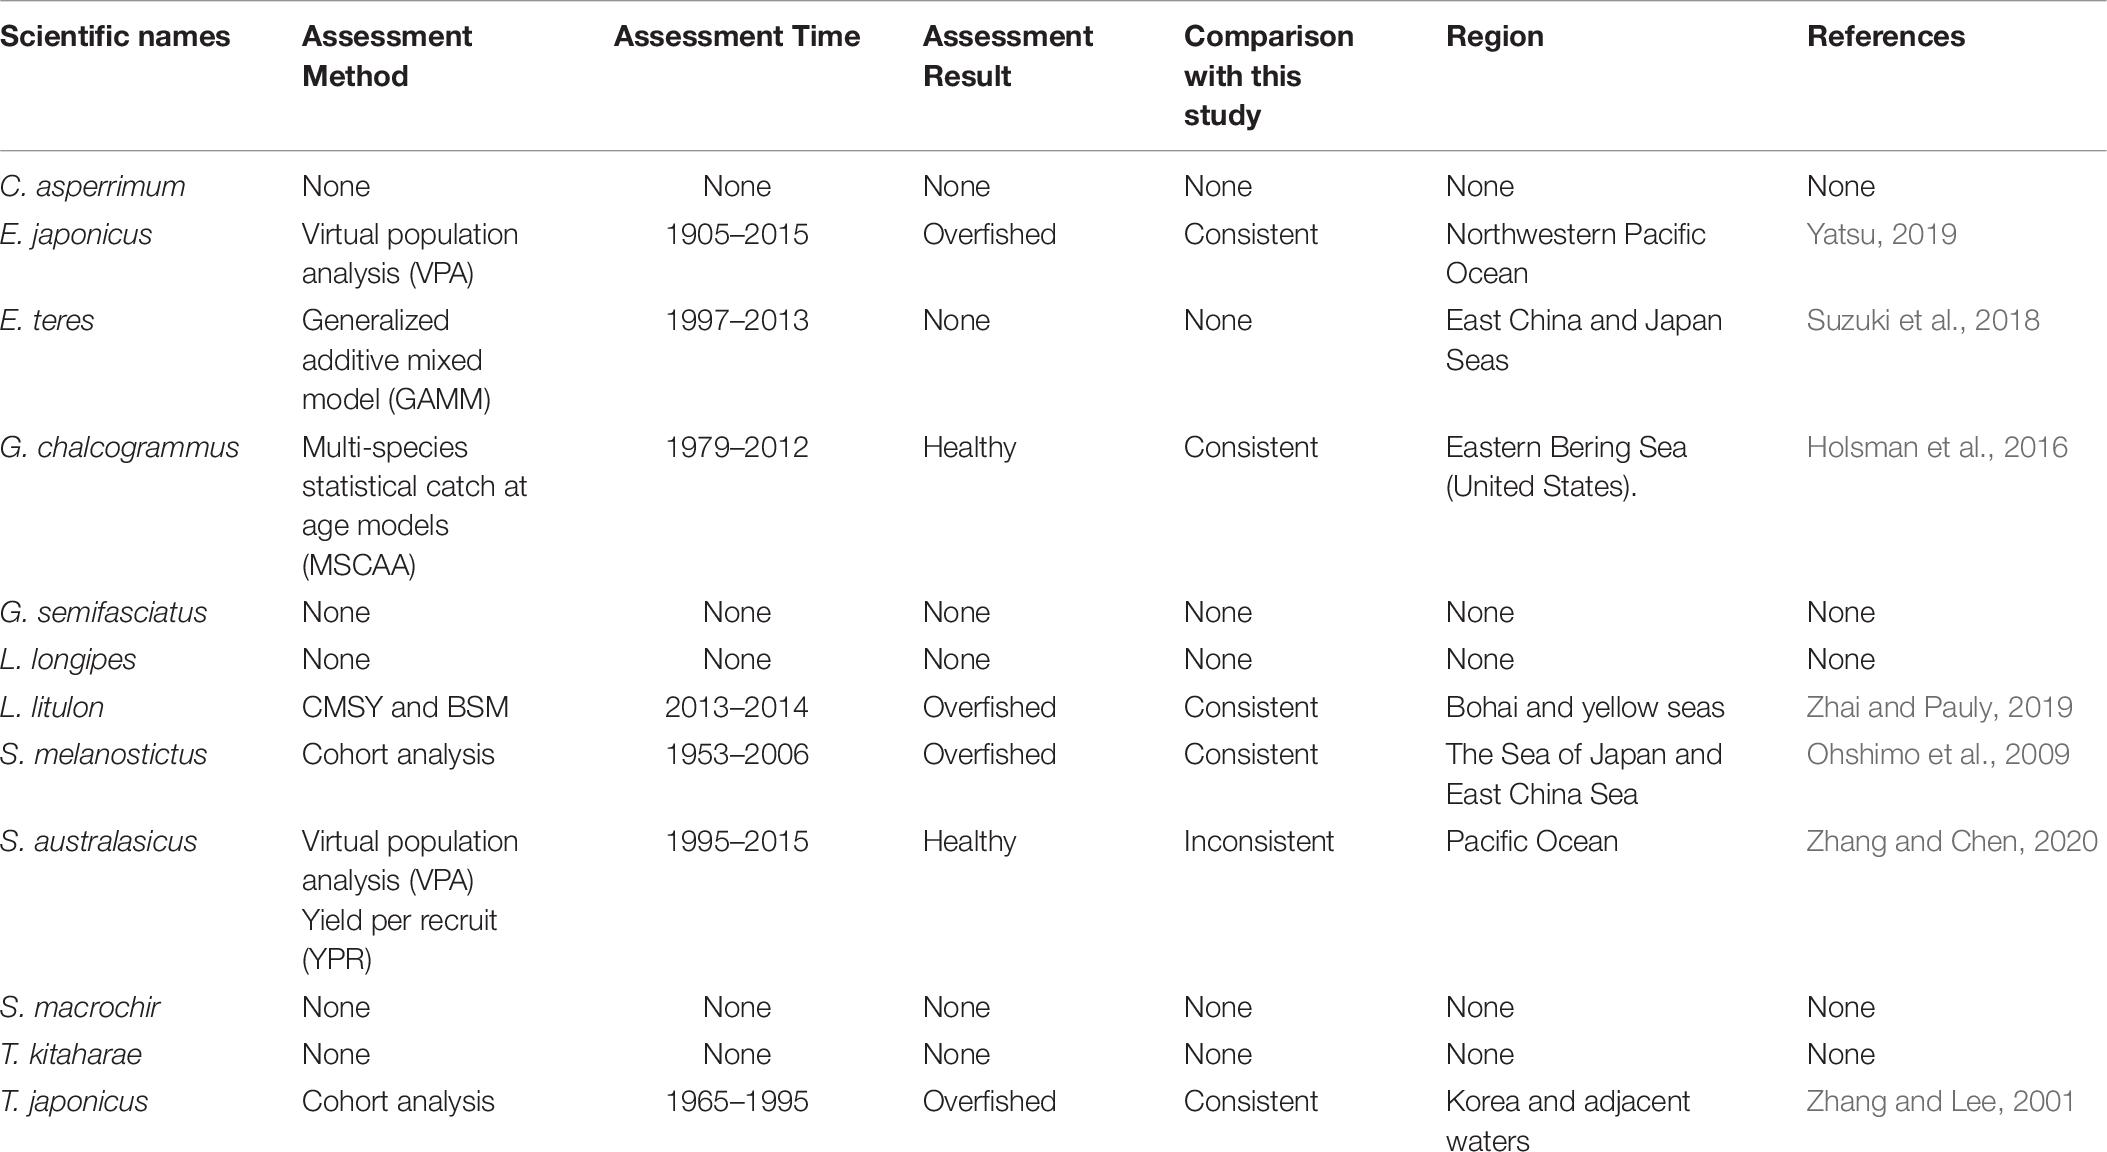
Table 7. Comparison of fishery resource assessment studies for twelve fish species.
Pacific Round Herring (E. teres)
The taxonomic status of Pacific round herring, here referred to as ‘Etrumeus teres’ is currently unsettled, as it appears that the previously wide-ranging species referred to as Etrumeus teres as has been split into an Atlantic species, E. sadina, and a Pacific species, E. micropus (see Froese and Pauly, 2019). Pending a taxonomic revision of the genus Etrumeus, we continue to use E. teres. Pacific round herring is a coastal fish that is important in the seine net and other fisheries along the coasts of Japan. The total catch of Pacific round herring, mainly along the southern coast of Japan, has trended to increase 5000–55,000 tonnes since 1985 and remained above 37,000 tonnes from 2012 to 2015 (Nyuji and Takasuka, 2017). Indeed, round herring exhibits a relatively stable population dynamics over a long period of time (Oozeki et al., 2007). In this study, the parameter Bend/k = 0.45 indicated that the depletion of this species was moderate level in 2017, while the parameter B/Bmsy = 0.90 indicated that the biomass of this species was at a nearly healthy level in 2017. The biomass of the species began to decline in 1985 and was at its lowest in 2002 before recovering gradually (Figure 2C). This result is consistent with a study by Oozeki et al. (2007). Suzuki et al. (2018) used a generalized additive mixed model (GAMM) to analyze the data of Pacific round herring from 1997 to 2013, however, they did not give the stock assessment clearly (Table 7).
Alaska Pollock (G. chalcogrammus)
Widely distributed in the northern Pacific (Froese and Pauly, 2019), Alaska pollock is an important commercial species in Japan (Nakatani, 1988). In Hokkaido and northern Honshu, catches of this species are obtained by trawling; from 1975 to the end of the 1980s, these catches remained at a high level, from 200,000 to 300,000 tonnes. However, after peaking at 290,000 tonnes in 1981, catches dropped below 200,000 tonnes. In the late 1990s, catches increased to 250,000 tonnes (Nishimura et al., 2002). The parameter B/Bmsy = 1.11 indicated that the biomass of this species was at a healthy level in 2017. There are few studies on the stock assessment of Alaska pollock in the northwestern Pacific Ocean. Holsman et al. (2016) used multi-species statistical catch at age models (MSCAA) to assess the stock in the eastern Bering Sea with data from 1979 to 2012. They reported a fishing mortality of less than 0.2, suggesting this stock was healthy (Holsman et al., 2016), which is consistent with our result in Figure 4D and Table 7.
Deep-sea Smelt (G. semifasciatus)
Deep-sea smelt is distributed in the northwestern Pacific, especially in southern Japan. It is found on the shelf edge and in the upper bathyal, where the seabed is sandy and muddy (Froese and Pauly, 2019). It is one of the most important benthic fish in the waters off the central and southern Pacific coasts of Japan. In 2004, Japanese boats caught just under 1,000 tonnes of this fish. Total catches in Pacific waters are at low levels (half of their 1996 peak) with a slight downward trend (Nashida et al., 2007). In this study, Bend/k = 0.38 indicated that the resource depletion of this species was strong in 2016; however, the B/Bmsy and F/Fmsy indicated that it was recovering in 2016. Moreover, its relative biomass (B/Bmsy) fluctuated between 0.5 and 1.0 (Figure 2E). Our assessment is consistent with the results published by the Fisheries Agency of Japan (2018). Beyond that, there is no report on the stock assessment of deep-sea smelt until now.
Longfin Codling (L. longipes)
Longfin codling is distributed in the northern Pacific, from central Japan to Okhotsk and to the Aleutian Islands and Bering Sea, and the species is found on the continental slope (Froese and Pauly, 2019). Catches were low in the 1980s and the species was used as an alternative to Alaska pollock in the 1990s, when it was caught as a primary target. The catch hovered between 22,000 and 38,000 tonnes from 1992 to 1999, reached a record high of 48,000 tonnes in 2000, dropped in 2011 owing to the earthquake and recovered in 2012. However, after 2016, it decreased again (Fisheries Agency of Japan, 2018). According to the CMSY analysis, the species was recovering in 2017 (Table 6). The relative biomass trends of longfin codling are similar to those of the Fisheries Agency of Japan (2018) (Figure 3A). Currently, the research on the stock assessment of longfin codling is still not well developed, so it is useful and informative to apply various assessment models to assess its current status.
Yellow Goosefish (L. litulon)
Yellow goosefish is mainly distributed in the northwestern Pacific, including Japan and Korea, and in the Yellow and East China Seas (Froese and Pauly, 2019). In Japan, its catch was small compared with that of other commercially exploited fish (Yoneda et al., 2001). After 1991, the catch started to increase, but it dropped in 2011 because of an earthquake (Fisheries Agency of Japan, 2018); relative biomass decreased in a similar manner (Figure 2F). According to the CMSY analysis, the species was overfished in the last year with available data (2017) (Table 6). There was no research to report the assessment of yellow goosefish in the same waters. But in China’s coastal seas, Zhai and Pauly (2019) reported low current biomass of the yellow goosefish in 2019 using the CMSY method, owing to the high fishing mortality exerted on the stock.
South American Pilchard (S. melanostictus)
South American pilchard, or ‘Pacific sardine,’ is widely distributed in the Indo-Pacific, from southern Africa to the eastern Pacific. Three lineages were confirmed through cluster and parsimony analyses of haplotypic divergences: southern Africa (S. ocellatus) and Australia (S. neopilchardus); Chile (S. sagax) and California (S. caeruleus); and Japan (S. melanostictus) (Froese and Pauly, 2019). The lineage relating to Japan (S. melanostictus) is discussed here. The catch of South American pilchard began to decline after 1989, peaking at 5.43 million tonnes in 1988; dropping from 1989 to 2.49 million tonnes in 1992 (Watanabe et al., 1995); and remaining low at around 100,000 tonnes from 2002 to 2009. Since then, with the decrease in fishing pressure from 2010 to 2014, caused by the 2011 earthquake, the stocks increased to more than 1 million tonnes in 2014 (Fisheries Agency of Japan, 2018). The parameter Bend/k = 0.16 indicated that the biomass of this species was depleted in 2017, and the estimate of B/Bmsy = 0.33 indicated that the species had been outside of safe biological limits. Our results for the relative biomass of the species (Figure 2G) are consistent with data released by the Fisheries Agency of Japan (2018). Moreover, the assessment of south American pilchard was reported in 2009. The authors used cohort analysis to assess the stock status with data from 1953 to 2006 and their results suggested that the collapse of the south American pilchard stock in the 1990s was caused by fishing mortality (Ohshimo et al., 2009). This is consistent with our results, which could be confirmed by Figures 2G, 4G.
Blue Mackerel (S. australasicus)
Blue mackerel lives in the coastal waters of the western Pacific, Australia and New Zealand, the northwestern and eastern Pacific, the northern and southern Indian Ocean to the Red Sea, and the northeastern Pacific near Hawaii and Mexico (Froese and Pauly, 2019). The catch of blue mackerel in Japan before 1981 was much lower than in recent years. The biomass of blue mackerel was over 100,000 tonnes in 1995. In 2006, it reached a record high, but, after 2011, it showed a decreasing trend (Fisheries Agency of Japan, 2018). Our result suggested that the biomass of this species was at an extremely low level (Bend/k = 0.23) and that it was being outside of safe biological limits in 2017 (B/Bmsy = 0.46). Fluctuations in the relative biomass of blue mackerel (Figure 2H) were consistent with those reported by the Fisheries Agency of Japan (2018). On the contrary, Zhang and Chen (2020) reported a healthy stock status for the blue mackerel in the Pacific Ocean by using virtual population analysis and yield per recruit with data from 1995 to 2015 (Table 7). One of the reasons is that the study area of the assessment is different, i.e., Zhang and Chen (2020) evaluate the whole Pacific Ocean, while this study evaluates Japan’s coastal area.
Broadbanded Thornyhead (S. macrochir)
Broadbanded thornyhead is widely distributed in the northern Pacific, from Sagami Bay, Japan, to the southern Kuril Islands and off Sakhalin, Russia (Froese and Pauly, 2019). It is a high-value fishery and a key target for small and medium trawl fisheries along Japan’s Pacific coast north of Honshu, whose catches began to decline in 1975 (Noranarttragoon et al., 2011). Catches of the species fell from 1,292 tonnes in 1983 to 274 tonnes in 1992, owing to a strong biomass decline (Koya et al., 1995); the catch in 2014 was about one-sixth of what it had been in the late 1970s (Sakaguchi et al., 2014). As the Japanese government began to implement a resource recovery plan in 2001, the biomass of broadbanded thornyhead began to increase (Fisheries Agency of Japan, 2018). Correspondingly, the changes in the relative biomass of this species in this study (Figure 2I) were related to the measures taken by the Japanese government. Thus, the resource status of this species could be considered healthy (Table 6). Currently, there is no report on the stock assessment of broadbanded thornyhead.
Willowy Flounder (T. kitaharae)
Willowy flounder is mainly distributed in the northwestern Pacific and inhabits muddy seabeds (Froese and Pauly, 2019). Its catch reached more than 210 tonnes in the early 1970s but declined to a low level from 1980 to 1990. Catch began to increase sharply in the mid-1990s, reaching more than 240 tonnes in 1998–1999, a record high. Since then, catches have declined, falling below 100 tonnes in 2001, then again increasing to 144 tonnes in 2009 and 160 tonnes in 2010. After 2011, the impact of earthquakes decreased, and catches of 139 tonnes were made in 2016 and of 127 tonnes in 2017 (Fisheries Agency of Japan, 2018), with a similar trend in the relative biomass of willowy flounder (Figure 3B). In 2017, the relative (B/Bmsy = 1.04) and end biomass (Bend/k) of willowy flounder was relatively high, suggesting that it was fully/overfished. There is no research that can be compared with our assessment at present.
Japanese Jack Mackerel (T. japonicus)
Japanese jack mackerel is widely distributed in the northern Pacific (Froese and Pauly, 2019). Its resources increased in the 1980s, rising from 140,000 to a high level of 160,000 tonnes in the mid-1990s, but declined from 1997 to below 100,000 tonnes after 2006. The biomass of the stocks in 2017 was 43,000 tonnes (Fisheries Agency of Japan, 2018). In this study, the parameters Bend/k = 0.29 and B/Bmsy = 0.588 suggested that the biomass was relatively low (Figure 2J), and that the species was recovering, which is consistent with the assessment given by the Fisheries Agency of Japan (2018), based on the Acceptable biological catch (ABC) estimation. In addition, Japanese jack mackerel was assessed in Korea and adjacent waters with data from 1965 to 1995, based on Schaefer (1954) and Fox (1970) production models and Biomass-based cohort analysis (Table 7). The main findings were that biomass (B) was 50% lower than B30% in 1995 and the fishing mortality (F) was high in 1993 (Zhang and Lee, 2001), which are similar with our results (see in Figures 2J, 4J).
Conclusion
CMSY is a Monte-Carlo method that estimates fisheries reference points (MSY, Fmsy, Bmsy) as well as relative stock size (B/Bmsy) and exploitation (F/Fmsy). The Bayesian state-space implementation of the Schaefer surplus production model (BSM) is the advanced part of the CMSY package. Compared to other implementations of surplus production models, the main advantage of BSM is that it focuses on informative priors and it accepts fragmented abundance data. However, the CMSY and BSM methods do not consider other factors, such as environmental shifts or the interaction among stocks. Thus, it would be advisable to use the CMSY and BSM methods along with other models or multispecies approaches to evaluate the stocks more accurately and in a more holistic way.
The Japanese fisheries have great potential for rapid recovery and biomasses can be rebuilt by adjusting the fishing intensity to appropriate levels. We expect that assessments using the CMSY and BSM methods will contribute to improvements in the management of Japan’s fisheries and management systems. Also, they should help us gain a more detailed understanding of the state of global fisheries stocks.
During the 1990s and early 2000s, overfishing prevented the recovery of the Japanese Pacific stocks of Clidoderma asperrimum, Engraulis japonicus, Etrumeus teres, Lophius litulon, Sardinops melanostictus, Scomber australasicus, and Tanakius kitaharae. However, these stocks have been recovering since 2010, owing to the reduction of fishing pressure and the subsequent biomass increase. In the face of global climate change and international fishing pressure, the following three recommendations for management in Japan are proposed: (1) fishery scientists need to collect more accurate biological and environmental data, so that managers could benefit from more informative assessments of the status of ocean species; (2) it is important to incorporate environmental factors in stock assessments, especially for ocean stocks, which are sensitive to changes in environmental conditions; (3) it is crucial to establish an international framework for stock assessment and management with China, Korea, and Russia. These policies are expected to contribute to the sustainable management of fisheries in the future.
Data Availability Statement
All datasets generated for this study are included in the article/Supplementary Material.
Author Contributions
YbW analyzed the data and completed the first draft. YcW and CL provided the guidance on data analysis and structure of our contribution, which was revised by HZ and WX. All authors contributed to the article and approved the submitted version.
Funding
The present work was supported by Creative Team Project of the Laboratory for Marine Ecology and Environmental Science, Qingdao National Laboratory for Marine Science and Technology (LMEES-CTSP-2018-1), the National Key Research and Development Project of China (2019YFD0902101), the National Natural Science Foundation of China (Nos. 41976094 and 31872568), the Natural Science Foundation of China–Shandong Joint Fund for Marine Ecology and Environmental Sciences (U1606404), the Key Deployment Project of Center for Ocean Mega-Science, Chinese Academy of Sciences (COMS2019Q14), and the Youth Innovation Promotion Association CAS.
Conflict of Interest
The authors declare that the research was conducted in the absence of any commercial or financial relationships that could be construed as a potential conflict of interest.
Acknowledgments
We are grateful for advice from Rainer Froese on the use of the CMSY method, and to Daniel Pauly for his editing the final draft of this contribution. Also, we appreciate the financial support of National Natural Science Foundation of China and Chinese Academy of Sciences. We thank Liwen Bianji, of Edanz Editing China (www.liwenbianji.cn/ac), for editing the first English-language draft of our manuscript.
Supplementary Material
The Supplementary Material for this article can be found online at: https://www.frontiersin.org/articles/10.3389/fmars.2020.00616/full#supplementary-material
Footnotes
References
Abe, T., Wada, T., Aritaki, M., Sato, N., and Minami, T. (2013). Morphological and habitat characteristics of settling and newly settled roughscale Sole Clidoderma asperrimum collected in the coastal waters of northeastern Japan. Fish. Sci. 79, 767–777. doi: 10.1007/s12562-013-0649-y
Anticamara, J. A., Watson, R., Gelchu, A., and Pauly, D. (2011). Global fishing effort (1950–2010): trends, gaps, and implications. Fish. Res. 107, 131–136. doi: 10.1016/j.fishres.2010.10.016
Fisheries Agency of Japan (2018). Resource Assessment for the Pacific Anchovy in the Year 2018. Tokyo: FAJ.
Fox, W. W. Jr. (1970). An exponential surplus yield model for optimizing exploited fish populations. Trans. Am. Fish. Soc. 99, 80–88. doi: 10.1577/1548-8659(1970)99<80:AESMFO>2.0.CO;2
Froese, R., Demirel, N., Coro, G., Kleisner, K. M., and Winker, H. (2017). Estimating fisheries reference points from catch and resilience. Fish Fish. 18, 506–526. doi: 10.1111/faf.12190
Froese, R., Garilao, C., Winker, H., Coro, G., Demirel, N., Tsikliras, A., et al. (2016). Exploitation and Status of European Stocks. Available online at: http://oceanrep.geomar.de/34476/ (accessed February, 2020).
Froese, R., and Pauly, D. (eds) (2019). FishBase. World Wide Web Electronic Publication. Available online at: https://www.fishbase.de/ (accessed February, 2020).
Froese, R., Winker, H., Coro, G., Demirel, N., Tsikliras, A. C., Dimarchopoulou, D., et al. (2018). Status and rebuilding of European fisheries. Mar. Policy 93, 159–170. doi: 10.1016/j.marpol.2018.04.018
Garcia, S. M., Ye, Y., Rice, J., and Charles, A. (eds) (2018). Rebuilding of Marine Fisheries. Part 1: Global Review. FAO Fisheries and Aquaculture Technical Paper No. 630/1. Rome: FAO, 294.
Hattori, T., Ueda, Y., Narimatsu, Y., and Ito, M. (2008). Distributional changes of roughscale sole (Clidoderma asperrimum) off the Pacific coast of northern Honshu, Japan. Bull. Jpn. Soc. Fish. Oceanogr. 72, 14–21.
Hilborn, R., and Ovando, D. (2014). Reflections on the success of traditional fisheries management. ICES J. Mar. Sci. 71, 1040–1046. doi: 10.1093/icesjms/fsu034
Holsman, K. K., Ianelli, J., Aydin, K., Punt, A. E., and Moffitt, E. A. (2016). A comparison of fisheries biological reference points estimated from temperature-specific multi-species and single-species climate-enhanced stock assessment models. Deep Sea Res. II Top. Stud. Oceanogr. 134, 360–378. doi: 10.1016/j.dsr2.2015.08.001
Ichinokawa, M., Okamura, H., and Kurota, H. (2017). The status of Japanese fisheries relative to fisheries around the world. ICES J. Mar. Sci. 74, 1277–1287. doi: 10.1093/icesjms/fsx002
Koya, Y., Hamatsu, T., and Matsubara, T. (1995). Annual reproductive cycle and spawning charateristics of the female kichiji rockfish Sebastolobus macrochir. Fish. Sci. 61, 203–208. doi: 10.2331/fishsci.61.203
Makino, M. (2011). Fisheries Management in Japan: Its Institutional Features and Case Studies. Dordrecht: Springer.
Martell, S., and Froese, R. (2013). A simple method for estimating MSY from catch and resilience. Fish Fish. 14, 504–514. doi: 10.1111/j.1467-2979.2012.00485.x
Nakatani, T. (1988). Studies on the early life history of walleye pollock Theragra chalcogramma in Funka Bay and vicinity, Hokkaido. Mem. Fac. Fish. Hokkaido Univ. 35, 1–46.
Nashida, K., Sakaji, H., and Honda, H. (2007). Spawning seasons of adult and growth of 0-year-old deepsea smelt Glossanodon semifasciatus in Tosa Bay, Pacific coast of Shikoku. Bull. Jpn. Soc. Fish. Oceanogr. 71, 270–278.
Nishimura, A., Hamatsu, T., Yabuki, K., and Shida, O. (2002). Recruitment fluctuation and biological responses of walleye pollock in the Pacific coast of Hokkaido. Fish. Sci. 68, 206–209. doi: 10.2331/fishsci.68.sup1_206
Noranarttragoon, P., Ueda, Y., Hattori, T., and Matsuishi, T. (2011). Value-per-recruit analysis of bighand thornyhead Sebastolobus macrochir caught off the Pacific coast of northern Honshu, Japan. Fish. Sci. 77, 497–502. doi: 10.1007/s12562-011-0368-1
Nyuji, M., and Takasuka, A. (2017). Spawning cycle and fecundity of a multiple spawner round herring Etrumeus teres off southern Japan: oocyte growth and maturation analysis. J. Sea Res. 122, 11–18. doi: 10.1016/j.seares.2017.02.009
Ohshimo, S., Tanaka, H., and Hiyama, Y. (2009). Long-term stock assessment and growth changes of the Japanese sardine (Sardinops melanostictus) in the Sea of Japan and East China Sea from 1953 to 2006. Fish. Oceanogr. 18, 346–358. doi: 10.1111/j.1365-2419.2009.00516.x
Oozeki, Y., Takasuka, A., Kubota, H., and Barange, M. (2007). Characterizing spawning habitats of Japanese sardine, Sardinops melanostictus, Japanese anchovy, Engraulis japonicus, and Pacific round herring, Etrumeus teres, in the Northwestern Pacific. Calif. Coop Ocean. Fish. Invest. 48:191.
Sakaguchi, S. O., Takishita, K., Goto, T., Shibata, H., Kojima, S., Fujikura, K., et al. (2014). Analyses of age and population genetic structure of the broadbanded thornyhead Sebastolobus macrochir in North Japan suggest its broad dispersion and migration before settlement. J. Oceanogr. 70, 457–462. doi: 10.1007/s10872-014-0240-x
Schaefer, M. B. (1954). Some aspects of the dynamics of populations important to the management of commercial marine fisheries. Bull. Math. Biol. 53, 253–279. doi: 10.1016/S0092-8240(05)80049-7
Suzuki, K. K., Yasuda, T., Kurota, H., Yoda, M., Hayashi, A., Muko, S., et al. (2018). Spatiotemporal variations in the distribution of round herring eggs in the East China and Japan Seas during 1997–2013. J. Sea Res. 142, 1–10. doi: 10.1016/j.seares.2018.09.003
Tokranov, A. M., and Orlov, A. M. (2003). On the distribution and biology of roughscale sole Clidoderma asperrimum (Temminck et Schlegel, 1846) in the Pacific waters off the northern Kuril Islands and southeastern Kamchatka. Bull. Sea Fish. Inst. 159, 67–80.
Wada, T. (1997). “Review of the small pelagic resources and their fisheries in Japan,” in Proceedings of the First Session APFIC Working Party on Marine Fisheries, Small Pelagic Resources and Their Fisheries in the Asia–Pacific Region, (Bangkok: FAO Regional Office for Asia and Pacific), 227–243.
Watanabe, Y., Zenitani, H., and Kimura, R. (1995). Population decline off the Japanese sardine Sardinops melanosticus owing to recruitment failures. Can. J. Fish. Aquat. Sci. 52, 1609–1616. doi: 10.1139/f95-154
Yatsu, A. (2019). Review of population dynamics and management of small pelagic fishes around the Japanese Archipelago. Fish. Sci. 85, 611–639. doi: 10.1007/s12562-019-01305-3
Yoneda, M., Tokimura, M., Fujita, H., Takeshita, N., Takeshita, K., Matsuura, S., et al. (2001). Reproductive cycle, fecundity, and seasonal distribution of the anglerfish Lophius litulon in the East China and Yellow seas. Fish. Bull. 99, 356–356.
Zenitani, H., and Kimura, R. (2007). Elemental analysis of otoliths of Japanese anchovy: trial to discriminate between Seto Inland Sea and Pacific stock. Fish. Sci. 73, 1–8. doi: 10.1111/j.1444-2906.2007.01295.x
Zhai, L., and Pauly, D. (2019). Yield-per-recruit, utility-per-recruit, and relative biomass of 21 exploited fish species in China’s Coastal Seas. Front. Mar. Sci. 6:724. doi: 10.3389/fmars.2019.00724
Zhang, C., and Chen, X. (2020). Management and assessment of spotted mackerel (Scomber australasicus) biomass in the Pacific Ocean. J. Fish. China 44, 206–212. doi: 10.11964/jfc.20171211117
Keywords: east coast of Japan, overfishing, stock assessment, CMSY/BSM methods, data-sparse stock
Citation: Wang Y, Wang Y, Liang C, Zhang H and Xian W (2020) Assessment of 12 Fish Species in the Northwest Pacific Using the CMSY and BSM Methods. Front. Mar. Sci. 7:616. doi: 10.3389/fmars.2020.00616
Received: 04 February 2020; Accepted: 06 July 2020;
Published: 31 July 2020.
Edited by:
Athanassios C. Tsikliras, Aristotle University of Thessaloniki, GreeceReviewed by:
Gianpaolo Coro, Istituto di Scienza e Tecnologie dell’Informazione “Alessandro Faedo” (ISTI), ItalyDonna Dimarchopoulou, Aristotle University of Thessaloniki, Greece
Copyright © 2020 Wang, Wang, Liang, Zhang and Xian. This is an open-access article distributed under the terms of the Creative Commons Attribution License (CC BY). The use, distribution or reproduction in other forums is permitted, provided the original author(s) and the copyright owner(s) are credited and that the original publication in this journal is cited, in accordance with accepted academic practice. No use, distribution or reproduction is permitted which does not comply with these terms.
*Correspondence: Hui Zhang, zhanghui@qdio.ac.cn; Weiwei Xian, wwxian@qdio.ac.cn