 Mateja Grego
 Alenka Malej
 Marleen De Troch
94% of researchers rate our articles as excellent or good
Learn more about the work of our research integrity team to safeguard the quality of each article we publish.
Find out more
ORIGINAL RESEARCH article
Front. Mar. Sci. , 28 July 2020
Sec. Marine Fisheries, Aquaculture and Living Resources
Volume 7 - 2020 | https://doi.org/10.3389/fmars.2020.00572
This article is part of the Research Topic Marine Aquaculture Impacts on Marine Biota View all 10 articles
Fish farm-originating organic matter can modify the ecological processes in a benthic ecosystem. This was investigated in the sediments of the northern Adriatic Sea by measuring δ13C signature of nematodes, harpacticoids, and sedimentary organic matter, and by assessing pore water nutrients and bacterial composition. In a mesocosm experiment, 13C-labeled diatoms were added on top of sediment cores and 13C enrichment was measured as a proxy of diatom uptake by meiofauna. The δ13C signatures were depleted under fish farming cages compared to the reference site, as observed for sedimentary organic matter (−24.4‰ vs. −21.8‰), for nematodes (−22.5‰ vs. −17.7‰), and for harpacticoids (−25.3‰ vs. −20.8‰). The direct consumption of fish feed (−22.2‰) was not traced in meiofauna taxa. Nematodes from the farm site likely reflect a diet comprising sedimentary organic matter, as they were enriched by 2‰ relative to the sedimentary organic matter. The nematodes from the reference site were enriched by 4.2‰ relative to the sedimentary organic matter, which implies that they rely on more enriched food sources, like diatoms, which was confirmed by their uptake of 13C-labeled diatoms. The nematode assemblage incorporated more diatom 13C than harpacticoids, making them more important players in the carbon flux from diatoms to higher trophic levels at the reference site. Harpacticoids from the reference site were enriched by 1.1‰ compared to sedimentary organic matter, implying that this was their primary food source. Harpacticoids from the farm site were depleted by 0.9‰ relative to the sedimentary organic matter, indicating they were influenced by a very depleted food source like bacteria. Harpacticoids from both the cage and reference sites consumed 13C-labeled diatoms, which implies their diet might span a broad δ13C range, from bacteria to diatoms. Pore water nutrients with high dissolved inorganic carbon, phosphate, and ammonium concentration indicated an elevated microbial degradation of organic compounds under the fish farm. The denaturing gradient gel electrophoresis analysis showed a 70% similarity between sediment bacteria communities from the fish farm and reference site. The study demonstrated that fish farm-originating organic matter enters the meiofauna food chain, and that nematodes and harpacticoids use different food sources under the fish farm and at the reference site.
Aquaculture is a fast-growing industry worldwide, with top production in China, India, and Indonesia, and is in a production parallel with capture fisheries FAO (2019b). In 2017, 80.1 million tons of aquatic animals were produced, of which 45.6 million tons were finfish in freshwaters and 7.8 million tons were finfish produced in marine environment (FAO, 2019a). In the Mediterranean Sea, the seabass Dicentrarchus labrax and the seabream Sparus aurata are the most important commercial coastal fish species cultured (FAO, 2005–2019). In some coastal areas, fish farming contributes markedly to the total nutrient discharges in line with the municipal, industrial, and agricultural wastes (Porrello et al., 2005; Pitta et al., 2006; Kutti et al., 2007). The fish production typically increases the carbon, nitrogen, and phosphorus budget in the environment (Sarà, 2007; Holmer et al., 2008) and cause local eutrophication (Mirto et al., 2010). Although the operations spatially take place in the water column in and around employed hanging cages, its impact is not restricted to the pelagic realm (Gao et al., 2005). It was revealed that the finfish culture affects the sediment biogeochemistry and dynamic of benthic organisms, including microbial communities via sedimentation of uneaten feed and fish feces (La Rosa et al., 2004; Bongiorni et al., 2005; Holmer et al., 2007; Hornick and Buschmann, 2018). Bacterial abundance, biomass carbon production, and enzymatic activities all increase beneath fish cages (La Rosa et al., 2001; Caruso, 2014 and references therein). Those changes in benthic ecosystem are especially pronounced in shallow waters and sheltered areas where most fish farms are located (Borja et al., 2009). Biogeochemical changes of the sediment under fish cages have a negative impact on macrofauna composition, as shown by a lower abundance and a decrease in biomass (Hargrave et al., 1997; Gao et al., 2005), but also by the community shifts toward deposit–feeders (Dempster et al., 2002).
The close association of meiofauna with the sediment matrix (Kennedy and Jacoby, 1999) results in their lower density under cages (Mazzola et al., 1999; Mazzola et al., 2000; La Rosa et al., 2001). The same was confirmed for our study site, where harpacticoids and kinorhynchs abundance was lower under fish farms compared to the reference, while the nematode abundance was not altered (Grego et al., 2009). The impact of fish farming activities on the energy transfer toward the receiving meiofauna community, however, is far from well known. To define carbon fluxes in marine ecosystems ecologists use natural isotopic signatures (Fry, 2006; Callier et al., 2013; Leduc et al., 2020) which can be combined with the uptake of pre-labeled food in incubation experiments (Middelburg et al., 2000; Carman and Fry, 2002; De Troch et al., 2007). About 1–2‰ of 13C enrichment is mostly observed per trophic level through the marine food web (DeNiro and Epstein, 1981; Ostrom and Fry, 1993; Soreide et al., 2006). The food-labeled experiments, in contrast, focus on an exact food source, e.g., diatoms, excessively enriched in 13C, which can be traced in the grazers, e.g., meiofauna, resulting as higher values of δ13C (Wyckmans et al., 2007; Franco et al., 2008; Maria et al., 2011; Lammers et al., 2016). The natural abundance of isotopes reflect the accumulation of it over a longer period of time and allows trophic level estimates. However, the difference among sources or organisms might be too small to make conclusions, while added tracers provide conclusive results from large differences among isotope ratios, but only in a short time span (Middelburg, 2014). As cited from Glibert et al. (2019) “the power of isotopes is that small differences allow great insights” (sources of nutrients, food web structure, and rate process), but the technique is also very sensitive to errors.
The stable isotopes were used to reveal the impact of fish rearing on the environment in several studies (Ye et al., 1991; Sarà et al., 2004; Sara et al., 2006; Holmer et al., 2007; Landrum and Montoya, 2009). According to Mayor et al. (2017) the analysis of the carbon stable isotopes of bulk sediment represents an alternative and fast approach to quantify the fate of fish farm-derived organic matter. Moreover, the isotopic signature of the fish feed pellets can be distinct from the local sources, as they are composed of terrestrial material and fishmeal originating from other seas (Moreno-Rojas et al., 2008). Using stable isotopes the incorporation of fish feed and their fecal waste into bivalves (Bergvik et al., 2019) and some other macrozoobenthic organisms (Kusche et al., 2017), including larger nematodes (>500 μm) (Callier et al., 2013), have been published, while to our knowledge no similar study exists for meiofaunal organisms.
The aims of the present study were: (i) to examine whether the fish farm-originating organic matter enters the meiofauna food chain, and (ii) to assess differences in food sources of two meiofauna taxa (nematodes and harpacticoids) under the fish farm and at the reference site. We investigated the natural δ13C signatures in the sedimentary organic matter (OM) and in meiofauna, at the reference and farm sites, together with the δ13C of fish feed used. An experiment with the addition of 13C-labeled diatoms to meiofauna cores was conducted, to trace the grazing by nematodes and harpacticoids under changed conditions (fish farm vs. reference), to reveal the potential changes in one resource utilization. The natural signatures, together with the experiment, allowed us to study the carbon flux and, thus, overall ecosystem functioning due to fish farming. Additionally, we tested for differences in pore water nutrients and sediment-associated bacterial communities, to describe changes in the environment of meiofauna, as a result of organic material deposition from the farming activities on the seabed.
The experimental units, namely standard meiofauna cores with an inner diameter of 3.6 cm, were collected by means of scuba diving in April 2007 from the inner part of the Bay of Piran, northern Adriatic Sea (45° 29′ 11.96′′N, 13° 34′ 51.05′′E), where a fish farm, rearing D. labrax is located [for details consult Grego et al. (2009)] (Figure 1a). The study area is shallow (average water depth: 13 m) and the background granulometric composition of the muddy sediment is clayey silt (Ogorelec et al., 1991; Kovač et al., 2003) with high carbonate content of approx. 30% (Ranke, 1976). The sedimentation rates in the northern Adriatic bays range from 3 to 5 mm yr –1 (Ogorelec et al., 1991), but sedimentation rates around the fish farm were eight times higher compared to the reference site (Kovač et al., 2004).
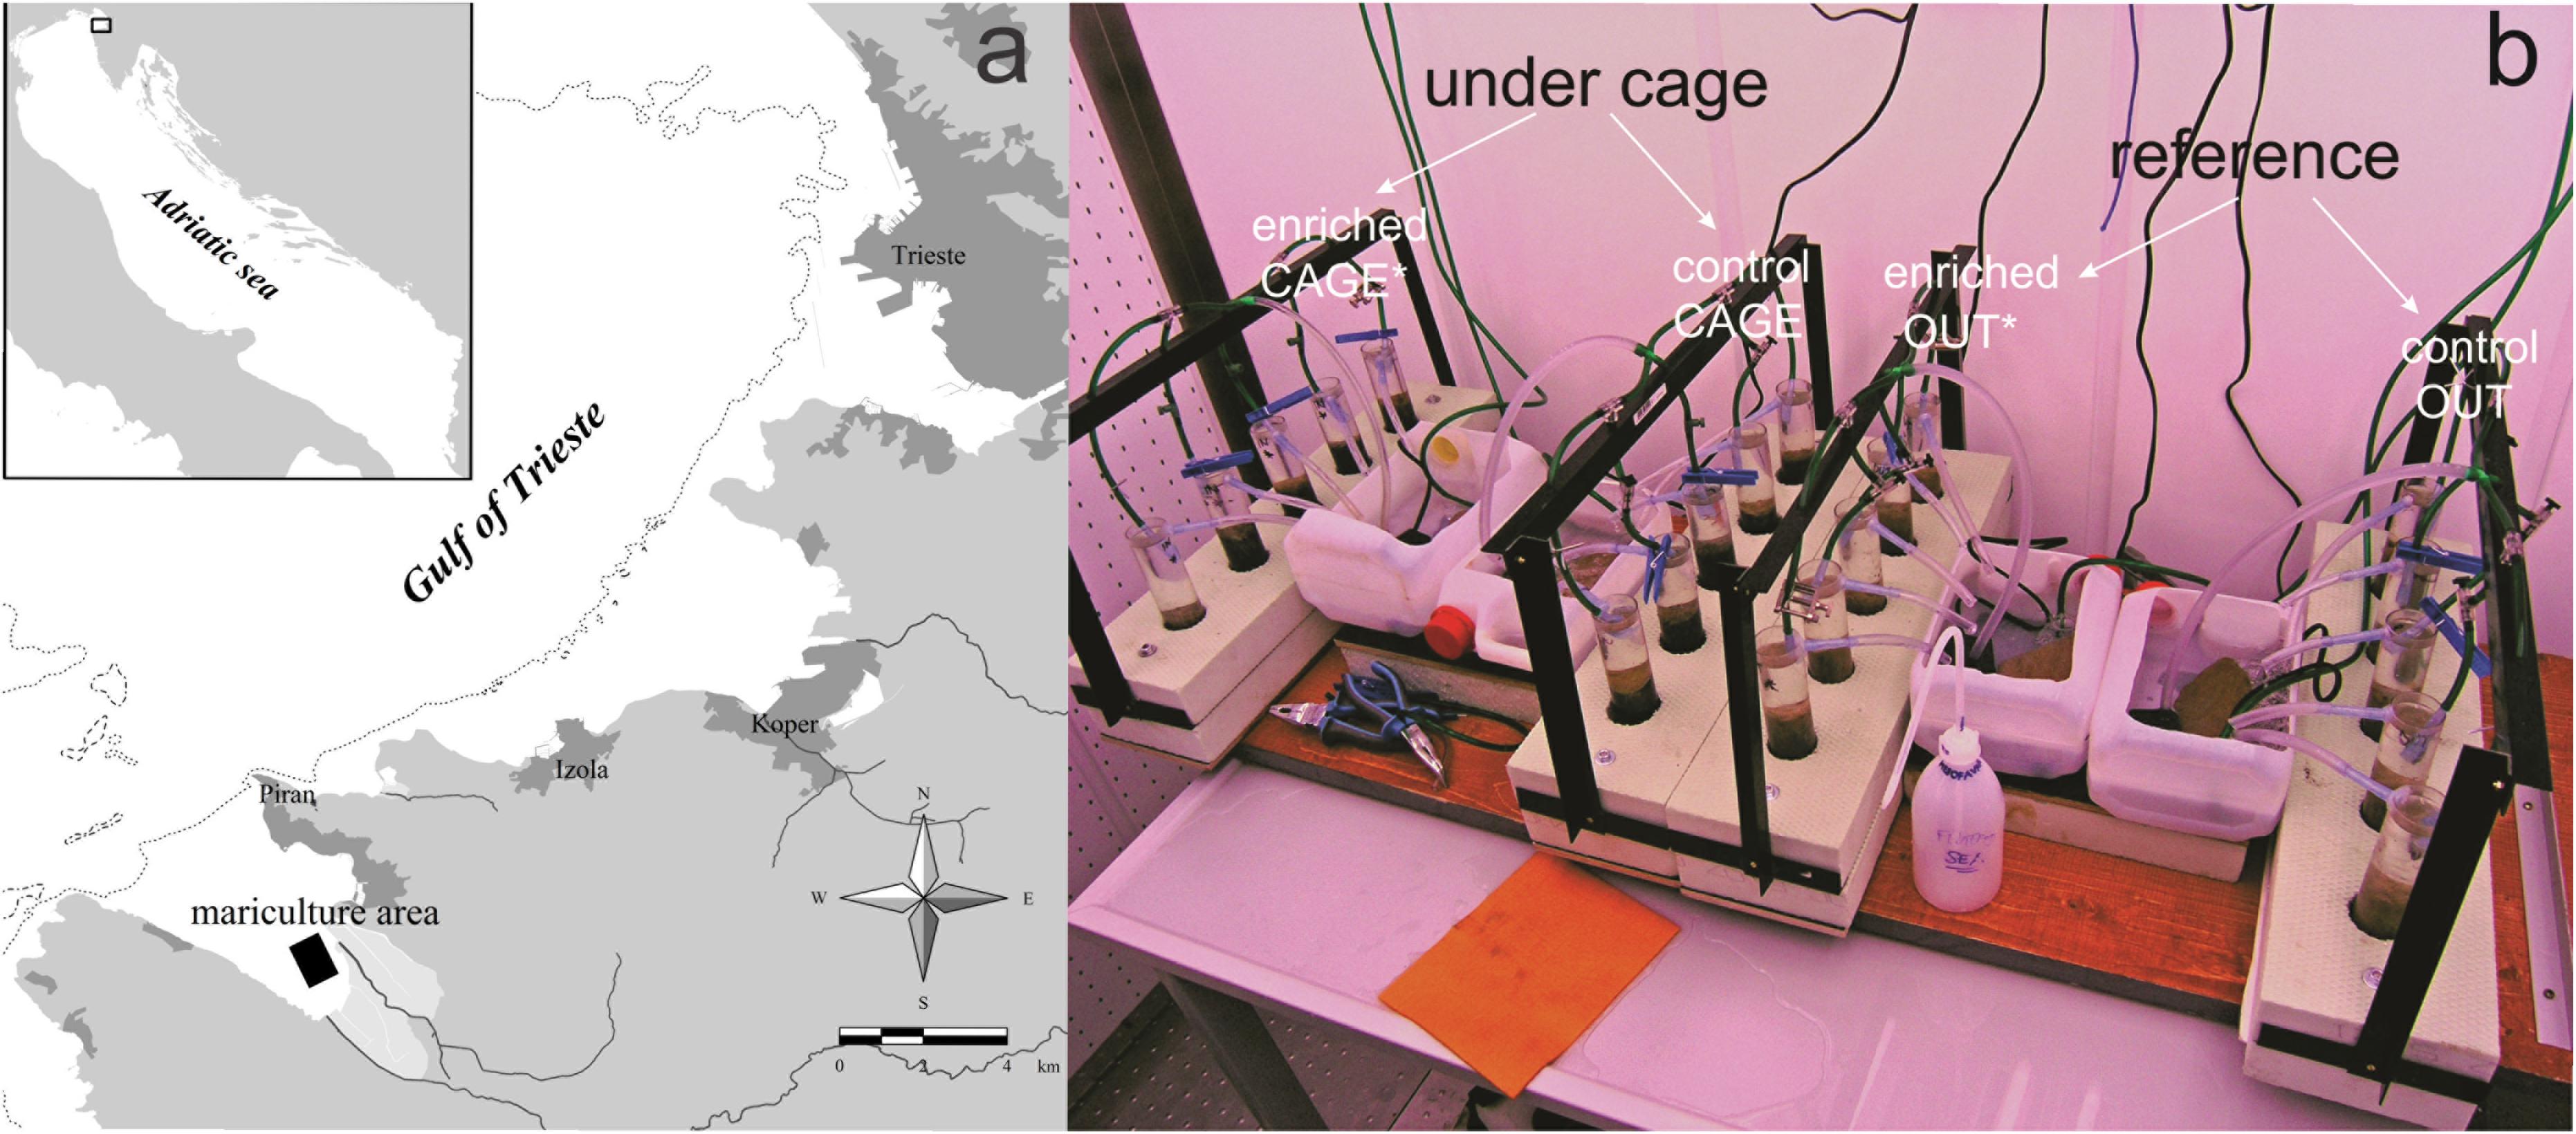
Figure 1. (a) Study area and the location of the fish farm in the Bay of Piran, Adriatic Sea. (b) Experimental setup. CAGE indicates the cores retrieved just under the fish farm and OUT indicate cores retrieved 100 m away from the farm. On top of the sediment of 10 cores 13C labeled diatoms were added prior to 5-day incubation, and are indicated with an asterisk.
In total, 10 meiofauna cores were retrieved under fish cages, further referred to as ‘CAGE’ cores and 10 meiofauna cores were collected at about 100 m away from the cages, further referred to as ‘OUT’ cores (Figure 1b). The latter served as a reference cores, since it was proven that 100 m away from fish farm meiofauna main taxa density and diversity were not impacted (Grego et al., 2009). The cores were immediately transported to a thermostatic chamber and incubated at 14°C under a 12:12 h light-dark cycle and 150 μE/m2/s PAR (similar to the in situ conditions). The cores were provided with oxygen through an aeration system and fresh GF/F filtered sea water was added in drops during the experiment duration. The excess water in cores was removed through a hole in the core (at which a pipette tip was sealed).
Freeze-dried 13C labeled diatoms (5.2 mg per core) were dissolved in filtered seawater and were gently applied with a syringe and plastic tube onto the top of the sediment in each of five replicates of the ‘CAGE’ cores and five replicates of ‘OUT’ cores. These 13C enriched cores are referred to as ‘CAGE∗’ and ‘OUT∗’ (∗is for enriched samples). Besides, five replicates of ‘CAGE’ and five replicates of ‘OUT’ cores were not inoculated with enriched diatoms and served as controls (Figure 1b). All 20 cores were incubated for 5 days in the thermostatic chamber under controlled conditions (as described above). The diatoms used in the experiment were freeze-dried Seminavis robusta (strain 84A, culture collection of the Laboratory of Protistology & Aquatic Ecology, Ghent University, Belgium) grown in f/2 medium (Guillard, 1975) with additional 13C (see Supplementary Material for detailed labeling procedure). The labeling technique enriched the δ13C of diatoms from −13.07 ± 0.31 to 7191.38 ± 70.92‰ (freeze-dried diatoms). The cells measured 55.89 ± 0.94 μm in length. The diatoms were composed on average of 30% of carbon, corresponding to approximately 1.56 mg of carbon added into each core. At the end of the experiment, the cores were sliced into the top (0–1 cm) layer and lower (1–5 cm) layer and stored at −20°C.
To extract the meiofauna, the sediment slices were thawed, washed with distilled water on 38 μm sieve, mixed with Levasil® (-distilled water) solution (specific density = 1.17 g/cm3), and centrifugated three times for 10 min at 3,000 rpm (de Jonge and Bouwman, 1977; Mc Intyre and Warwick, 1984). Levasil is an aqueous colloidal dispersion of amorphous silica (SiO2) with 0.1% of Na2O (percentage by weight) and does not contain carbon. Meiofauna was sorted within a few hours after thawing to minimize the leakage of 13C label (Moens et al., 1999). The natural isotope values of meiofauna were analyzed only from the top sediment layer, as no copepods were present in the deeper layer of the CAGE samples. In some samples we only had few harpactocoid specimens, and we expect that some were lost during experiment due to escapes. Harpacticoids from those samples were pooled to reach enough biomass for a reliable isotope analysis, yielding four (instead of five) CAGE samples, and three (instead of five) CAGE∗ samples. The first 150 nematodes of OUT and OUT∗ samples (Figure 2a) and 100 nematodes from CAGE and CAGE∗ samples (Figure 2b; larger nematodes) were picked out for isotope analysis. All copepods from the sample were picked out into an embryo dish containing milli-Q water (Figure 2c; OUT assemblage and Figure 2d; CAGE assemblage). The animals were then washed several times in milli-Q water in order to remove food or detritus from their bodies and then placed in tin capsules (8 mm∗5 mm). The material was then desiccated overnight at 60°C. From each of the 20 cores, an aliquot of sediment was taken to determine the isotope signal of sedimentary OM. The sediment was first dried to constant weight at 60°C and 15 mg was placed in silver capsules (8 mm∗5 mm). The carbonate was removed by the subsequent addition of HCl in increasing concentrations and subsequent drying of the samples at 60°C.
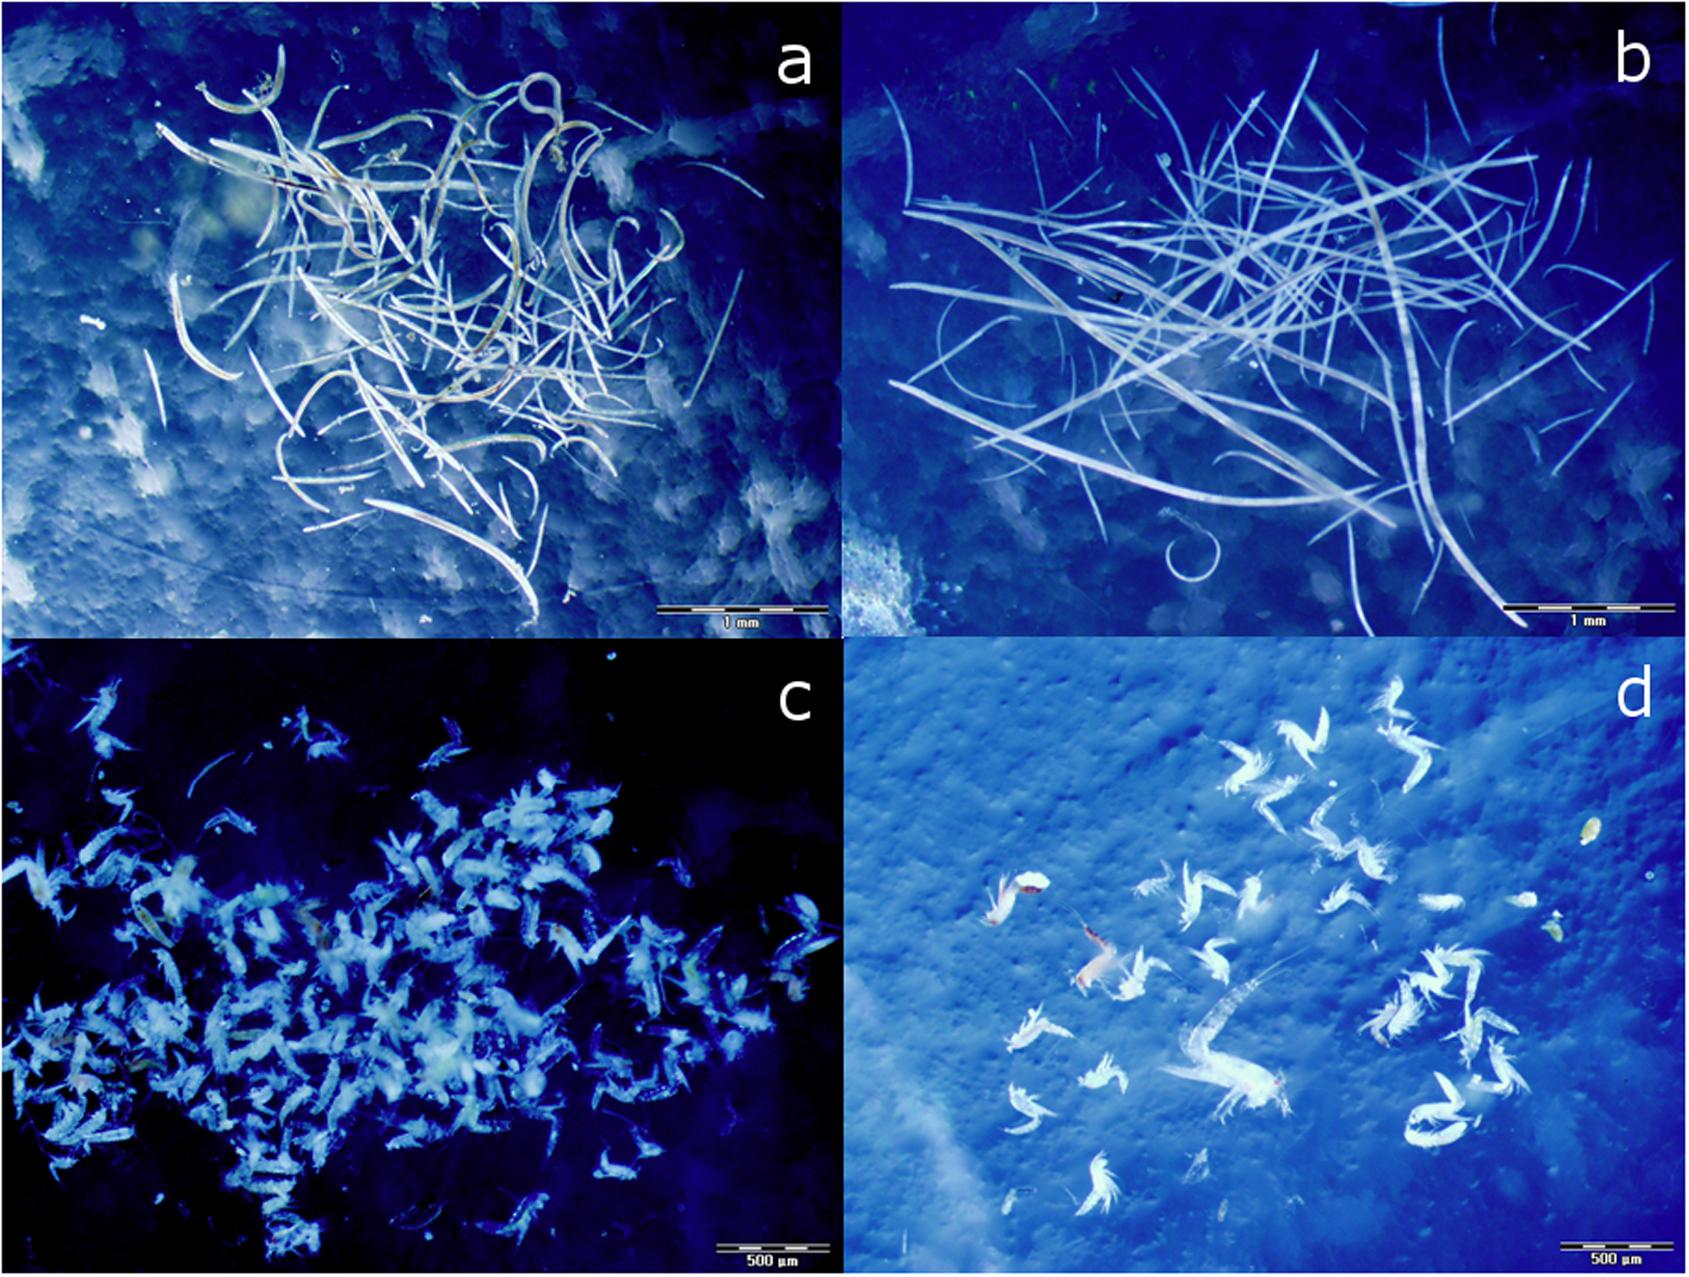
Figure 2. Sorted nematodes from experimental cores; reference assemblage-OUT (a) characterized by smaller specimens, and fish farm assemblage-CAGE (b) characterized by larger specimens, and sorted harpacticoids from experimental cores; reference assemblage-OUT (c), and fish farm assemblage-CAGE (d). The scale bar is 1 mm (a,b) and 0.5 mm (c,d).
The pellets (ECOLIFE 68 N°3, BioMar) used to feed the fish were also analyzed for δ13C. Five replicates of 25 g of fish pellets were homogenized with agate mortar and pestle, from each 2 g was put into a tin cupsule. The samples were desiccated overnight at 60°C, capsules were pinch closed and sent for carbon isotope analysis. These pellets were used to feed the fish since 2004 (Fisfarmers personal comm.).
The carbon content and δ13C composition were measured using an isotope ratio mass spectrometer (type Europa Integra) at the UC Davis Stable Isotope Facility (University of California, United States). The carbon isotope ratio was calculated from the measured δ13C values as
where RVPDB = 0.0112372 as δ13C is expressed relative to Vienna Pee Dee Belemnite standard (VPDB).
Incorporation of 13C is reflected as the specific uptake, i.e., Δδ13C (Middelburg et al., 2000).
Since we had five independent replicates of the control, and five independent replicates of the treatment, we calculated the specific uptake using the average of control to pair with each of the five enriched samples. Next, the fractional abundance of heavy isotope (F) was calculated:
Total uptake (I) of the nematode or harpacticoid community was calculated by subtracting the fraction 13C of the Fsample and the Fcontrol, multiplied by the organic carbon of nematodes or copepods of the enriched samples (Middelburg et al., 2000):
The data were statistically analyzed in R software (R Development Core Team, 2014). Prior to the analysis, all data were checked for normality using the Anderson-Darling test (Sokal and Rohlf, 1995; Dytham, 2003; Zuur et al., 2010). The differences among natural 13C signals were tested with a Student t-test. The differences in uptake (Δδ13C and I) by nematodes and harpacticoids in CAGE and OUT samples were tested with 2-way ANOVA and Tukey HSD on non-transformed (Δδ13C) and on square root transformed (I) data. The sample marked with ∗ on Figure 4 was omitted from statistical testing, because it shows much higher values than the rest of samples. This sample is a composite of three replicates (see section “Natural 13C Values of the Sediment, Meiofauna and Fish Feed”).
The carbon content of analyzed nematode samples was 15.1 ± 5.3 μgC/10 cm2 in OUT∗, and 45.8 ± 15.9 μgC/10 cm2 in CAGE∗. The carbon content of analyzed harpacticoid samples varied from 26.4 ± 16.3 μgC/10 cm2 to 9.9 ± 9.0 μgC/10 cm2 at OUT∗ and CAGE∗, respectively. The number of nematodes in tin cupsules was 100 at CAGE∗ and 150 at OUT∗. The number of copepods in a sample varied from 144 ± 47/10 cm2 at OUT∗ to 22 ± 12/10 cm2 at CAGE∗. As the whole community from experimental cores was not counted, Corganic was estimated from the number of animals analyzed for isotopes (and their biomass) and the factor to reach the average abundance of nematodes and harpacticoids sampled at same locations in the previous year (see Grego et al., 2009, CAGE = 0 m, OUT = 100 m NE, two seasons).
In addition to cores used for the experiment, six cores (3.6 cm inner diameter) were retrieved, three at CAGE and three at the OUT site (referred to as ‘field’). From the sediment surface and aliquote was scratched for denaturating gradient gel electrophoresis (DGGE). At the end of the experiment, the aliquots of sediment were taken on top of three CAGE∗ and three OUT∗ cores (referred as ‘experiment’). After the sediment was sliced, one sample was taken on top of 1–5 cm layer of CAGE∗ sediment. Prior to the DGGE analysis, bacterial DNA was prepared using the FastDNA® SPIN Kit for Soil (MP Biomedicals). From each DNA extract an internal 194 bp fragment of the V3 region of the 16S rRNA gene (Yu and Morrison, 2004) was amplified using the primer set 357f and 518r (Van Hoorde et al., 2008) with a GC-clamp (5′-GCCCGCCGCGCGCGGCGGGCGGGGCGGGGGCACGGGGG-3′) (Temmerman et al., 2003) coupled to the forward primer. On the PCR mixtures (Temmerman et al., 2003), a touchdown PCR (Van Hoorde et al., 2008) with 10 cycles of decreasing annealing temperature (0.5°C cycle–1 decrement, from 61 to 56°C), followed by 25 cycles of regular PCR was performed with a Bio-Rad DNA thermal cycler. DGGE analysis using a 35–70% gradient and staining of the gel was performed as described by Van Hoorde et al. (2008). Digitized DGGE gels were normalized and analyzed in BioNumerics software (version 4.61, Applied Maths, Sint-Martens-Latem, Belgium). Calculation of the Dice correlation coefficient and application of UPGMA clustering method (Unweighted Pair Group Method with Arithmetic) resulted in a dendrogram visualizing the similarity between the banding patterns of the sediment samples.
In addition to meiofauna cores, the plexiglass cores with an inner diameter 6 cm were collected for pore waters by means of scuba diving, three at the CAGE and three at the OUT site. The overlying water was also analyzed for nutrients. The sediment cores were sliced according to a standard routine at 0.5 cm interval in the top layer, where most changes are expected, and 1–5 cm layer. Sediment slices from three replicates were pooled to achieve 10–15 ml of pore water. Sediment samples were packed into 50 ml polyethylene centrifuge tubes and centrifuged at 11,500 rpm for 20 min. After centrifugation, Ptot and Ntot were analyzed in unfiltered samples by wet oxidation described in Grasshoff et al. (1999). Under N2 atmosphere, the interstitial waters were filtered through 0.45 μm pore size (Millipore HA) membrane filters and analyzed for solutes. The pH measurements were carried out and corrected for in situ temperature (13.4°C) and salinity (37.7) (Millero, 1995). Interstitial water alkalinity was measured by Gran titration (Edmond, 1970). Dissolved inorganic carbon (DIC) was calculated from alkalinity and pH. Nitrite (NO2–), nitrate (NO3–), ammonium (NH4+), phosphate (PO43–), and silicate (SiO44–) were measured photometrically (Grasshoff et al., 1983), and sulfate was measured turbidimetrically (Tabatabai, 1974) with UV/VIS spectrometer PerkinElmer, Lambda 14.
The sedimentary OM from the top sediment layer (0–1 cm) was significantly more depleted in δ13Corg under the fish farm compared to reference site (CAGE samples −24.42 ± 1.17‰ vs. OUT samples −21.82 ± 1.21‰) (Figure 3 and Table 1). The OM in the deeper sediment layer (1–5 cm) was less depleted in δ 13C than the top sediment layer (0–1 cm), with values of −21.78 ± 0.67‰ and −20.59 ± 0.38‰ in the CAGE and OUT samples, respectively. A significant difference in sedimentary OM δ13C values was found between the top and the underlying sediment layers in the CAGE samples (Table 1), but not in the OUT samples.
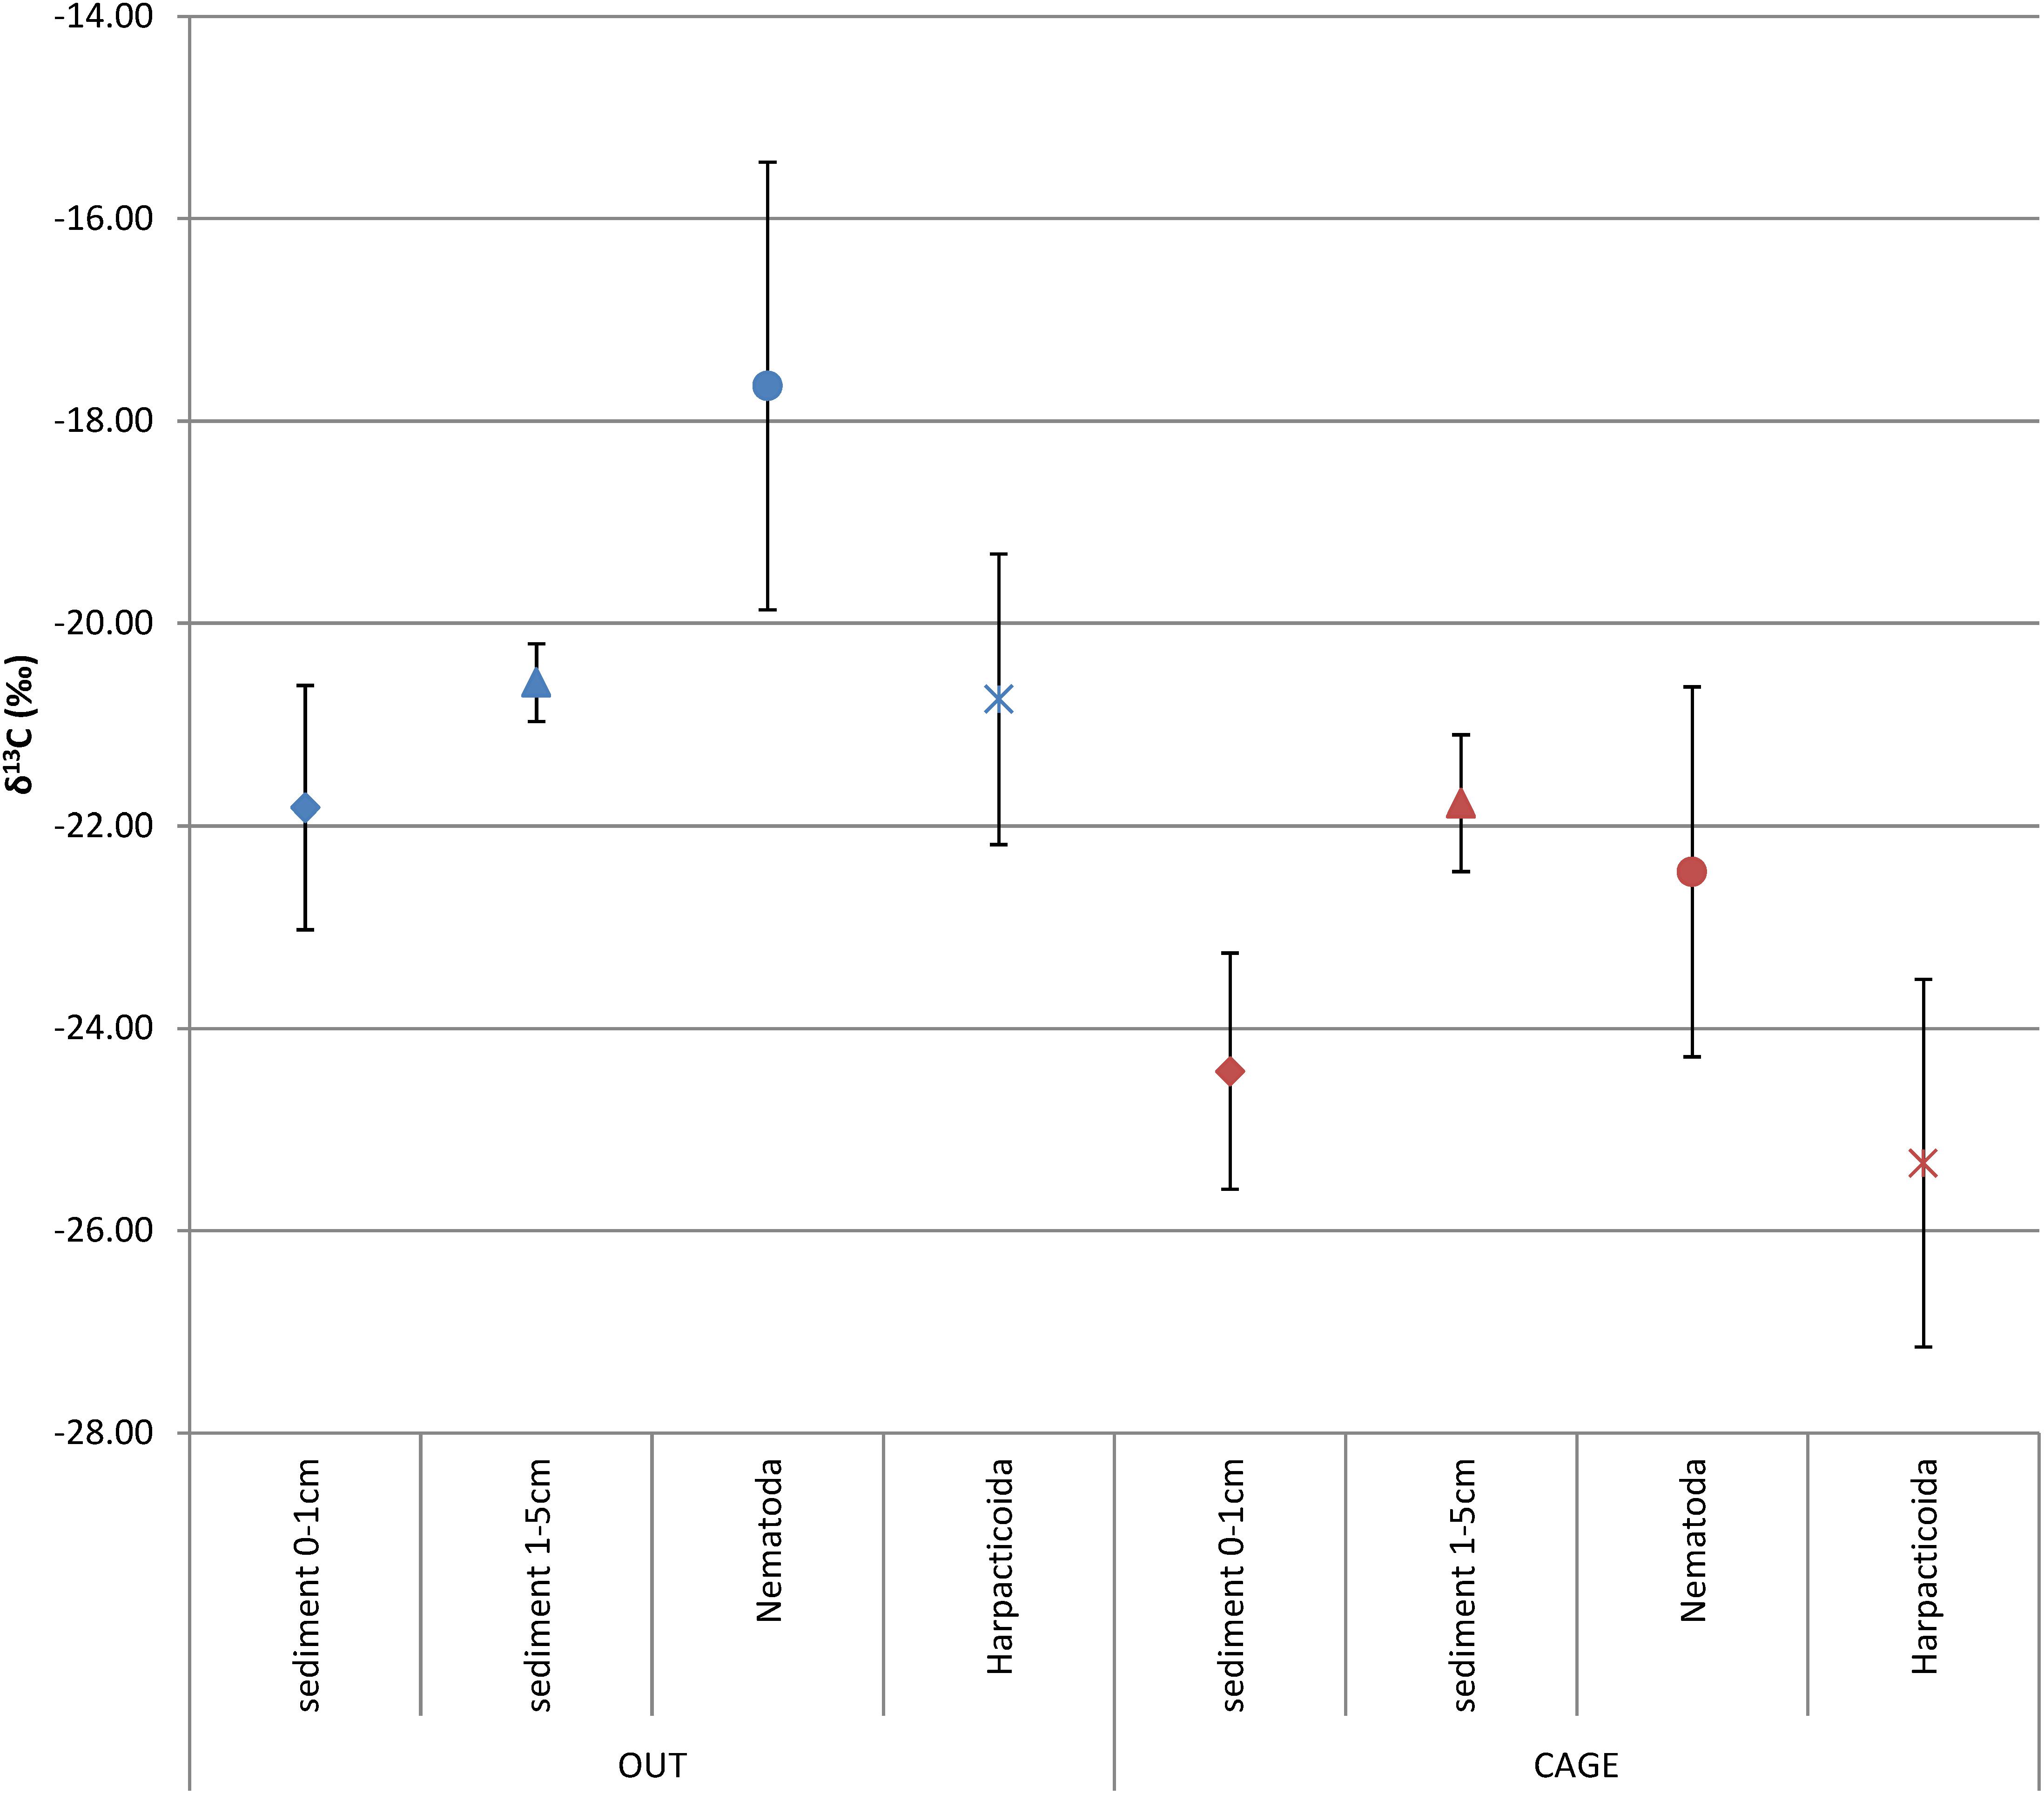
Figure 3. Average δ13C (‰) ± SD of the sedimentary organic matter, sliced into top (0–1 cm) and deeper layer (1–5 cm), nematodes, and harpacticoids under the fish farm (CAGE) and at the reference site (OUT).
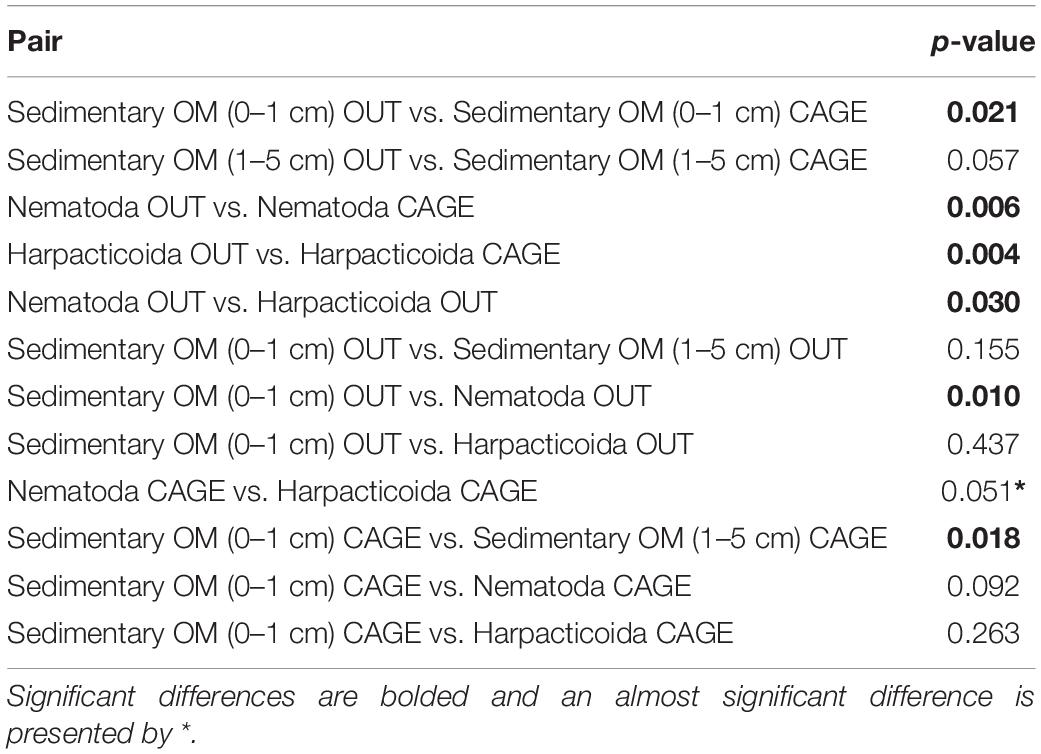
Table 1. Student t-test (2 tailed) comparing δ13C differences between pairs from Figure 3.
The meiofauna assemblage was represented by Nematoda, Harpacticoida, Polychaeta, Kinorhyncha, Turbellaria, Bivalvia, Gastropoda, Ostracoda, Amphipoda, Acarina, Isopoda, Cumacea, Mysidacea, Decapoda, and Ophiuroidea, listed in order of decreasing abundance (Grego et al., 2009). For this study we focused on the two most abundant meiofauna taxa Nematoda and Harpacticoida.
The natural isotope values of nematodes were significantly depleted in CAGE samples (−22.46 ± 1.83‰) compared to OUT samples (−17.65 ± 2.21‰) (Figure 3 and Table 1). Likewise, the harpacticoids δ13C were significantly depleted in CAGE (−25.33 ± 1.82‰) compared to the OUT samples (−20.75 ± 1.43‰) (Figure 3 and Table 1). The comparison between nematodes and harpacticoids showed that harpacticoids were always more depleted in δ13C, independent of the site (Table 2). This difference between nematodes and harpacticoids was significant at the OUT site and marginally not significant (p = 0.051) at the CAGE site (Figure 3 and Table 1).
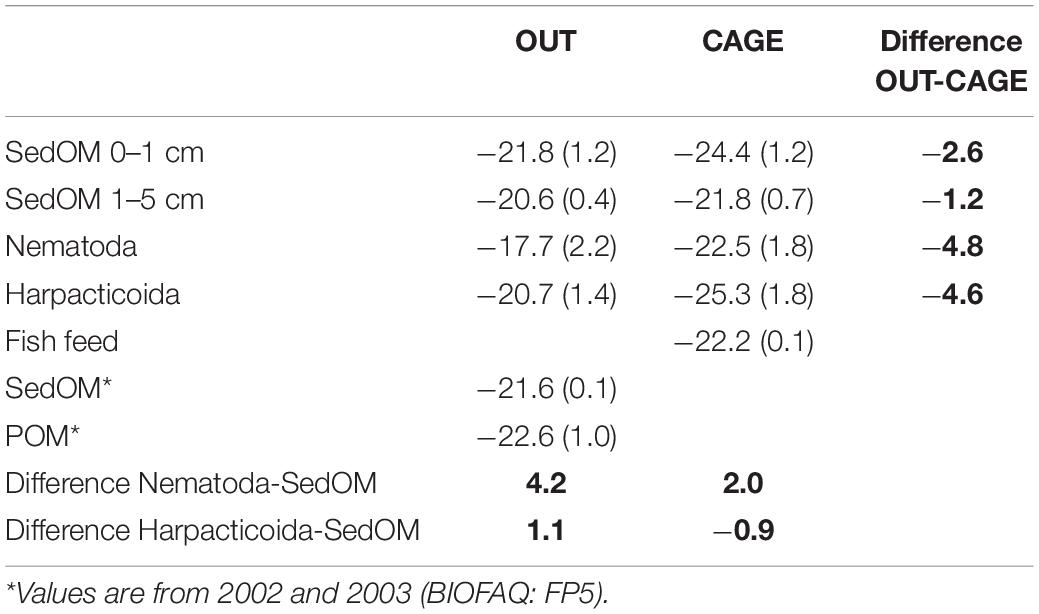
Table 2. δ13C (±SD) of sedimentary organic matter (SedOM) from different layers, of water column particulate organic matter (POM), of Nematoda and Harpacticoida, and the difference (bold) between OUT vs. CAGE and SedOM vs. fauna.
The sedimentary OM was depleted by 2.6‰ at CAGE samples compared to the OUT samples, while the fauna showed more intense depletion in CAGE samples, i.e., by 4.8‰ nematodes and by 4.6‰ harpacticoids, compared to OUT samples (Table 2).
Fish pellets that were used to feed the fish had δ13C value of −22.2 ± 0.1‰.
After the incubation with 13C labeled diatoms, specific uptake (Δδ13C) was measured in all nematode and harpacticoid samples (Figure 4A) in the range from 2.6 to 161.8‰. The two-way ANOVA resulted in significant (p = 0.001) influence of location (CAGE∗ and OUT∗) but not taxa (nematodes, harpacticoids) on the specific uptake. The nematode specific uptake was significantly higher in OUT∗ samples comparing to CAGE∗ samples (Tukey HSD, p = 0.006). The harpacticoid specific uptake was not different between OUT∗ and CAGE∗ samples. In OUT∗ samples the specific uptake among harpacticoids and nematodes was also very similar, and also in CAGE∗ samples the specific uptake between taxa was not different. The nematodes from CAGE∗ samples and the harpacticoids from OUT∗ samples showed significant difference in specific uptake (Tukey HSD, p = 0.005).
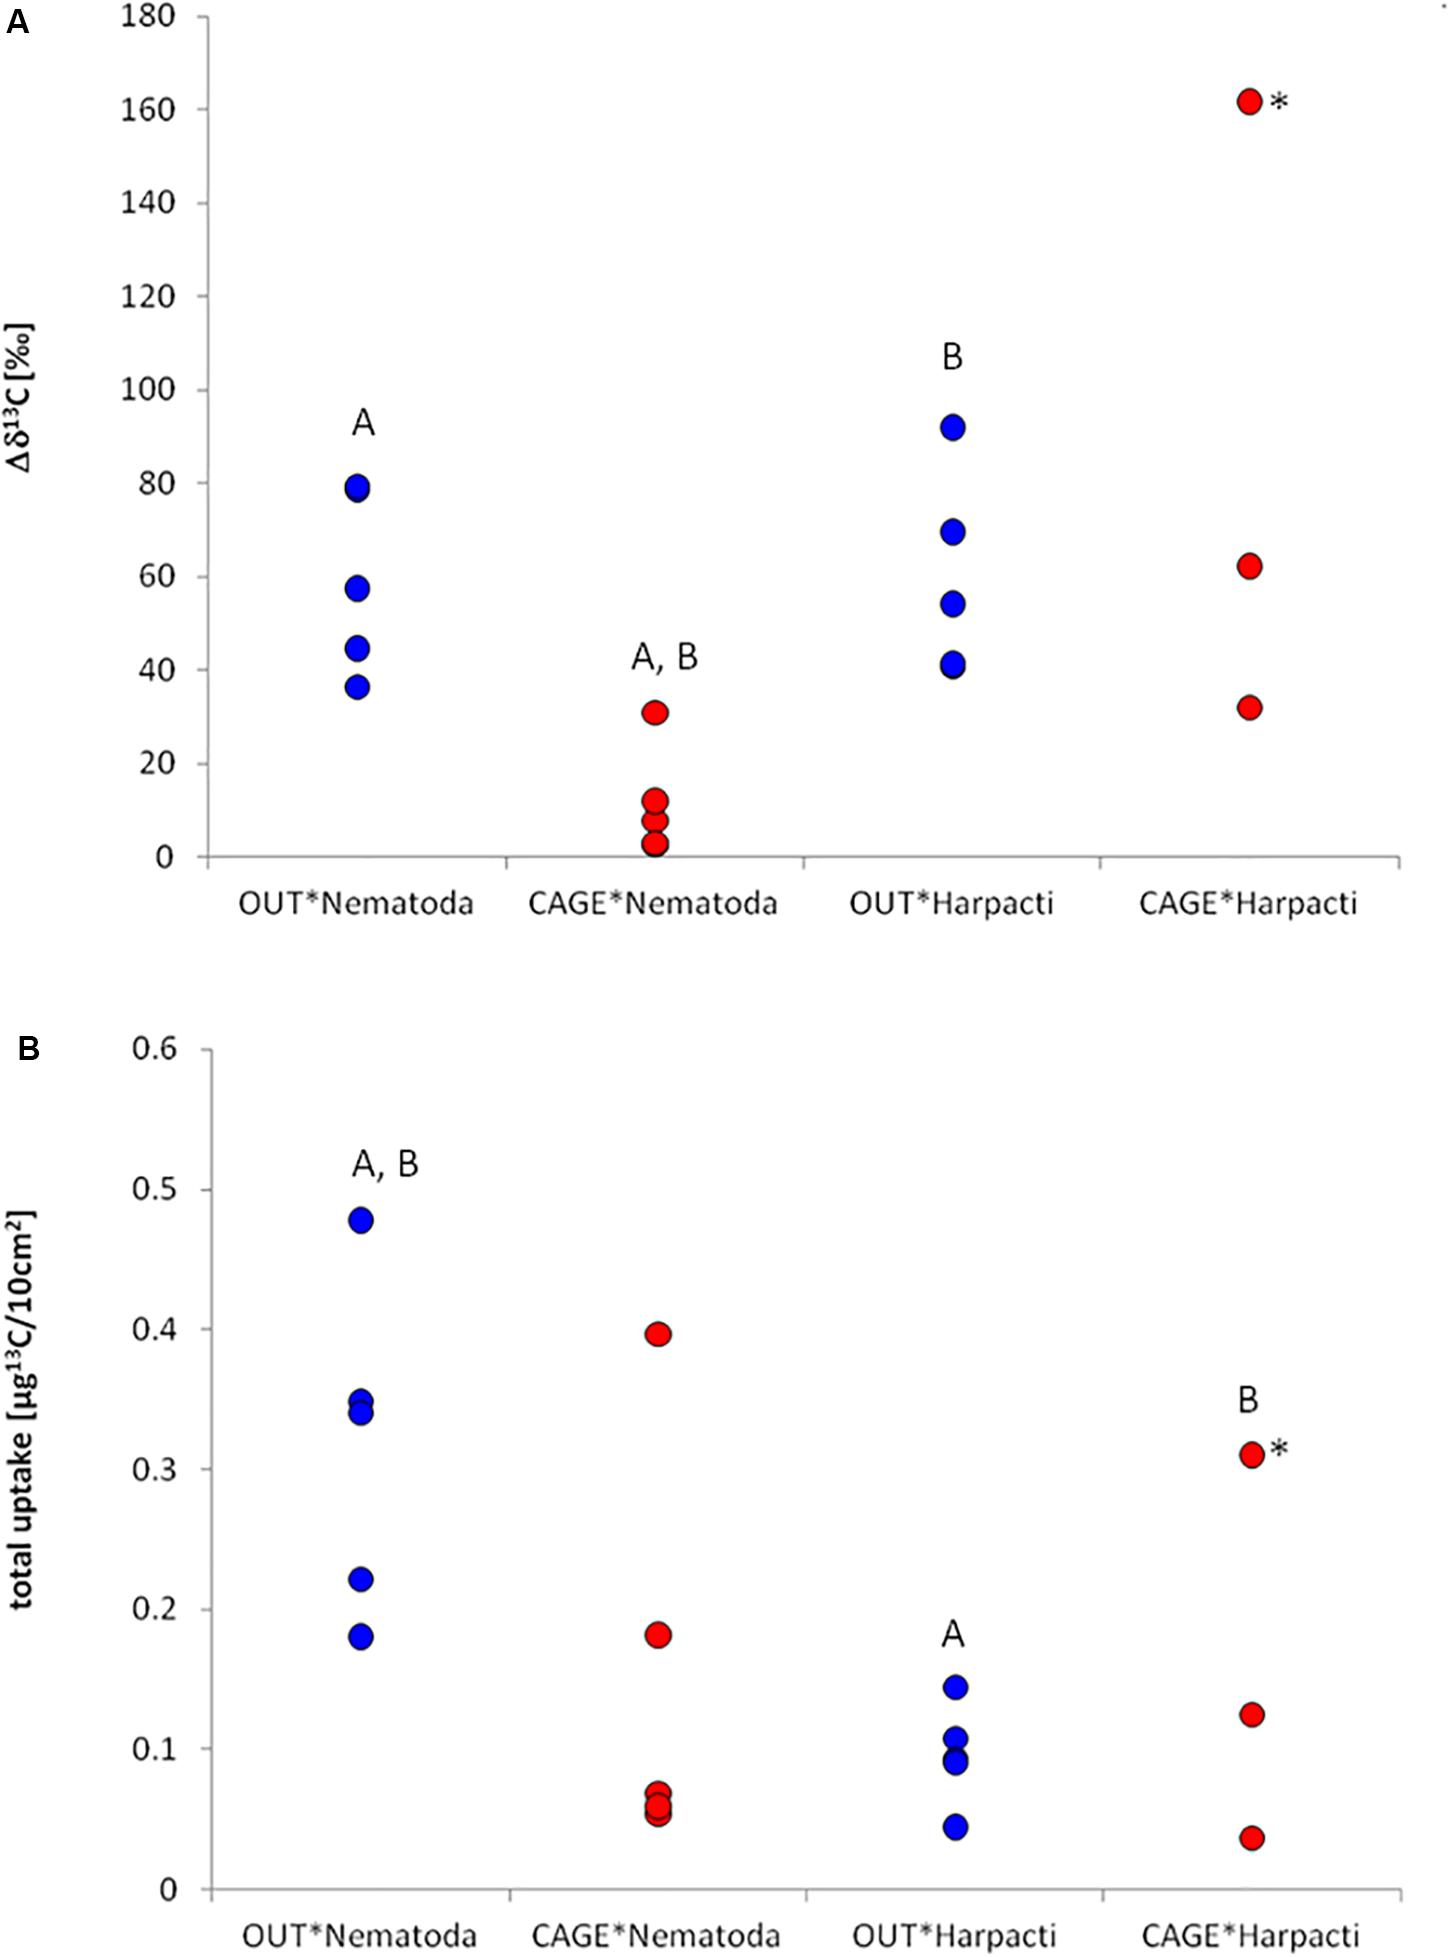
Figure 4. Specific uptake (A) and incorporation of 13C (B) in different meiofauna taxa under the fish farm (CAGE*) and at the reference site (OUT*). Actual values are given for (A) and an estimation of biomass has been made for (B) (see section “Materials and Methods”). Significant differences among pairs are marked with the same letter. For the analysis of significance the sample marked with * was omitted as an outlier (see section “Materials and Methods”).
The estimated (see section “Materials and Methods”) nematode abundance was 2859 ± 836/10 cm2 at OUT∗ and 2809 ± 649/10 cm2 at CAGE∗. The estimated harpacticoid abundance was 665 ± 119/10 cm2 at OUT∗ and 208 ± 175/10 cm2 at CAGE∗. The nematode biomass was 504 ± 209 μgCorg/10 cm2 at OUT∗ and 1,399 ± 433 μgCorg/10 cm2 at CAGE∗ site. The harpacticoid biomass was 149 ± 41 μgCorg/10 cm2 at OUT and 114 ± 57 μgCorg/10 cm2 at CAGE∗. The consumption of nematodes and harpacticoids was in the range from 0.04 to 0.49 μg13C/10 cm2. The two-way ANOVA revealed a significant (p = 0.009) influence of taxa (nematodes and harpacticoids), but not location (CAGE∗ and OUT∗) on the incorporation of 13C. The 13C isotope incorporation (I) into nematode biomass from sampling unit OUT∗ and CAGE∗ samples did not result in significant differences (Figure 4B). Similarly, the 13C isotope incorporation in harpacticoid biomass was not different at the OUT∗ and CAGE∗ sites. The incorporation of 13C was larger for nematodes than for harpacticoids at the OUT∗ site (Tukey HSD, p = 0.029). There was also a significant difference in incorporation between nematodes from OUT∗ and harpacticoids from CAGE∗ (p = 0.038). From the carbon biomass of labeled diatoms added (1.14 g) and enrichment of labeled diatoms (resulting in 8.4% 13C), we added approximately 131 μg 13C into each experimental core. From the average incorporation in nematodes and harpacticoids from the OUT∗ cores we estimated they incorporated about 0.2% of added 13C, while the nematodes and harpacticoids from CAGE∗ incorporated 0.1% of added 13C to the experimental unit.
Adding δ13C enriched diatoms to the sediment resulted into a significant increase of the isotope values of the sedimentary OM in the top sediment layer from −21.82 ± 1.21‰ to 43.34 ± 22.79‰ for OUT∗ (p = 0.001) and from −24.42 ± 1.17‰ to 18.10 ± 24.05‰ for CAGE∗ samples (p = 0.023), as measured at the end of the experiment (when some diatoms were already eaten by meiofauna). However, the labeled diatoms did not reach the deeper sediment layers (1–5 cm), as documented by similar values of the sedimentary OM (−19.77 ± 0.73‰ for OUT∗ and −21.90 ± 0.71‰ for CAGE∗) to non-enriched samples.
The DGGE gel showed a large number of bands in the sediments of the CAGE and OUT samples (Figure 5a). The bacterial community in experimental cores is very similar to the ones in field cores. The dark bands on the DGGE gel, especially in experimental units of CAGE samples, may indicate enhanced bacterial growth during the experiment. The dendrograms revealed at least 80% similarity between the triplicate subsamples of each site. The CAGE and OUT samples were different from each other before and after the experiment, and clustered at 70% (field, Figure 5b) and 74% (experiment, Figure 5c) similarity levels. There is a difference between the top layers and the single lower layer (one replicate of 1–5 cm) of the CAGE samples. The lower layer of the CAGE sample groups together with the upper layers of OUT samples (Figure 5b), indicating the fish farm impact is more pronounced in the top sediment layer.
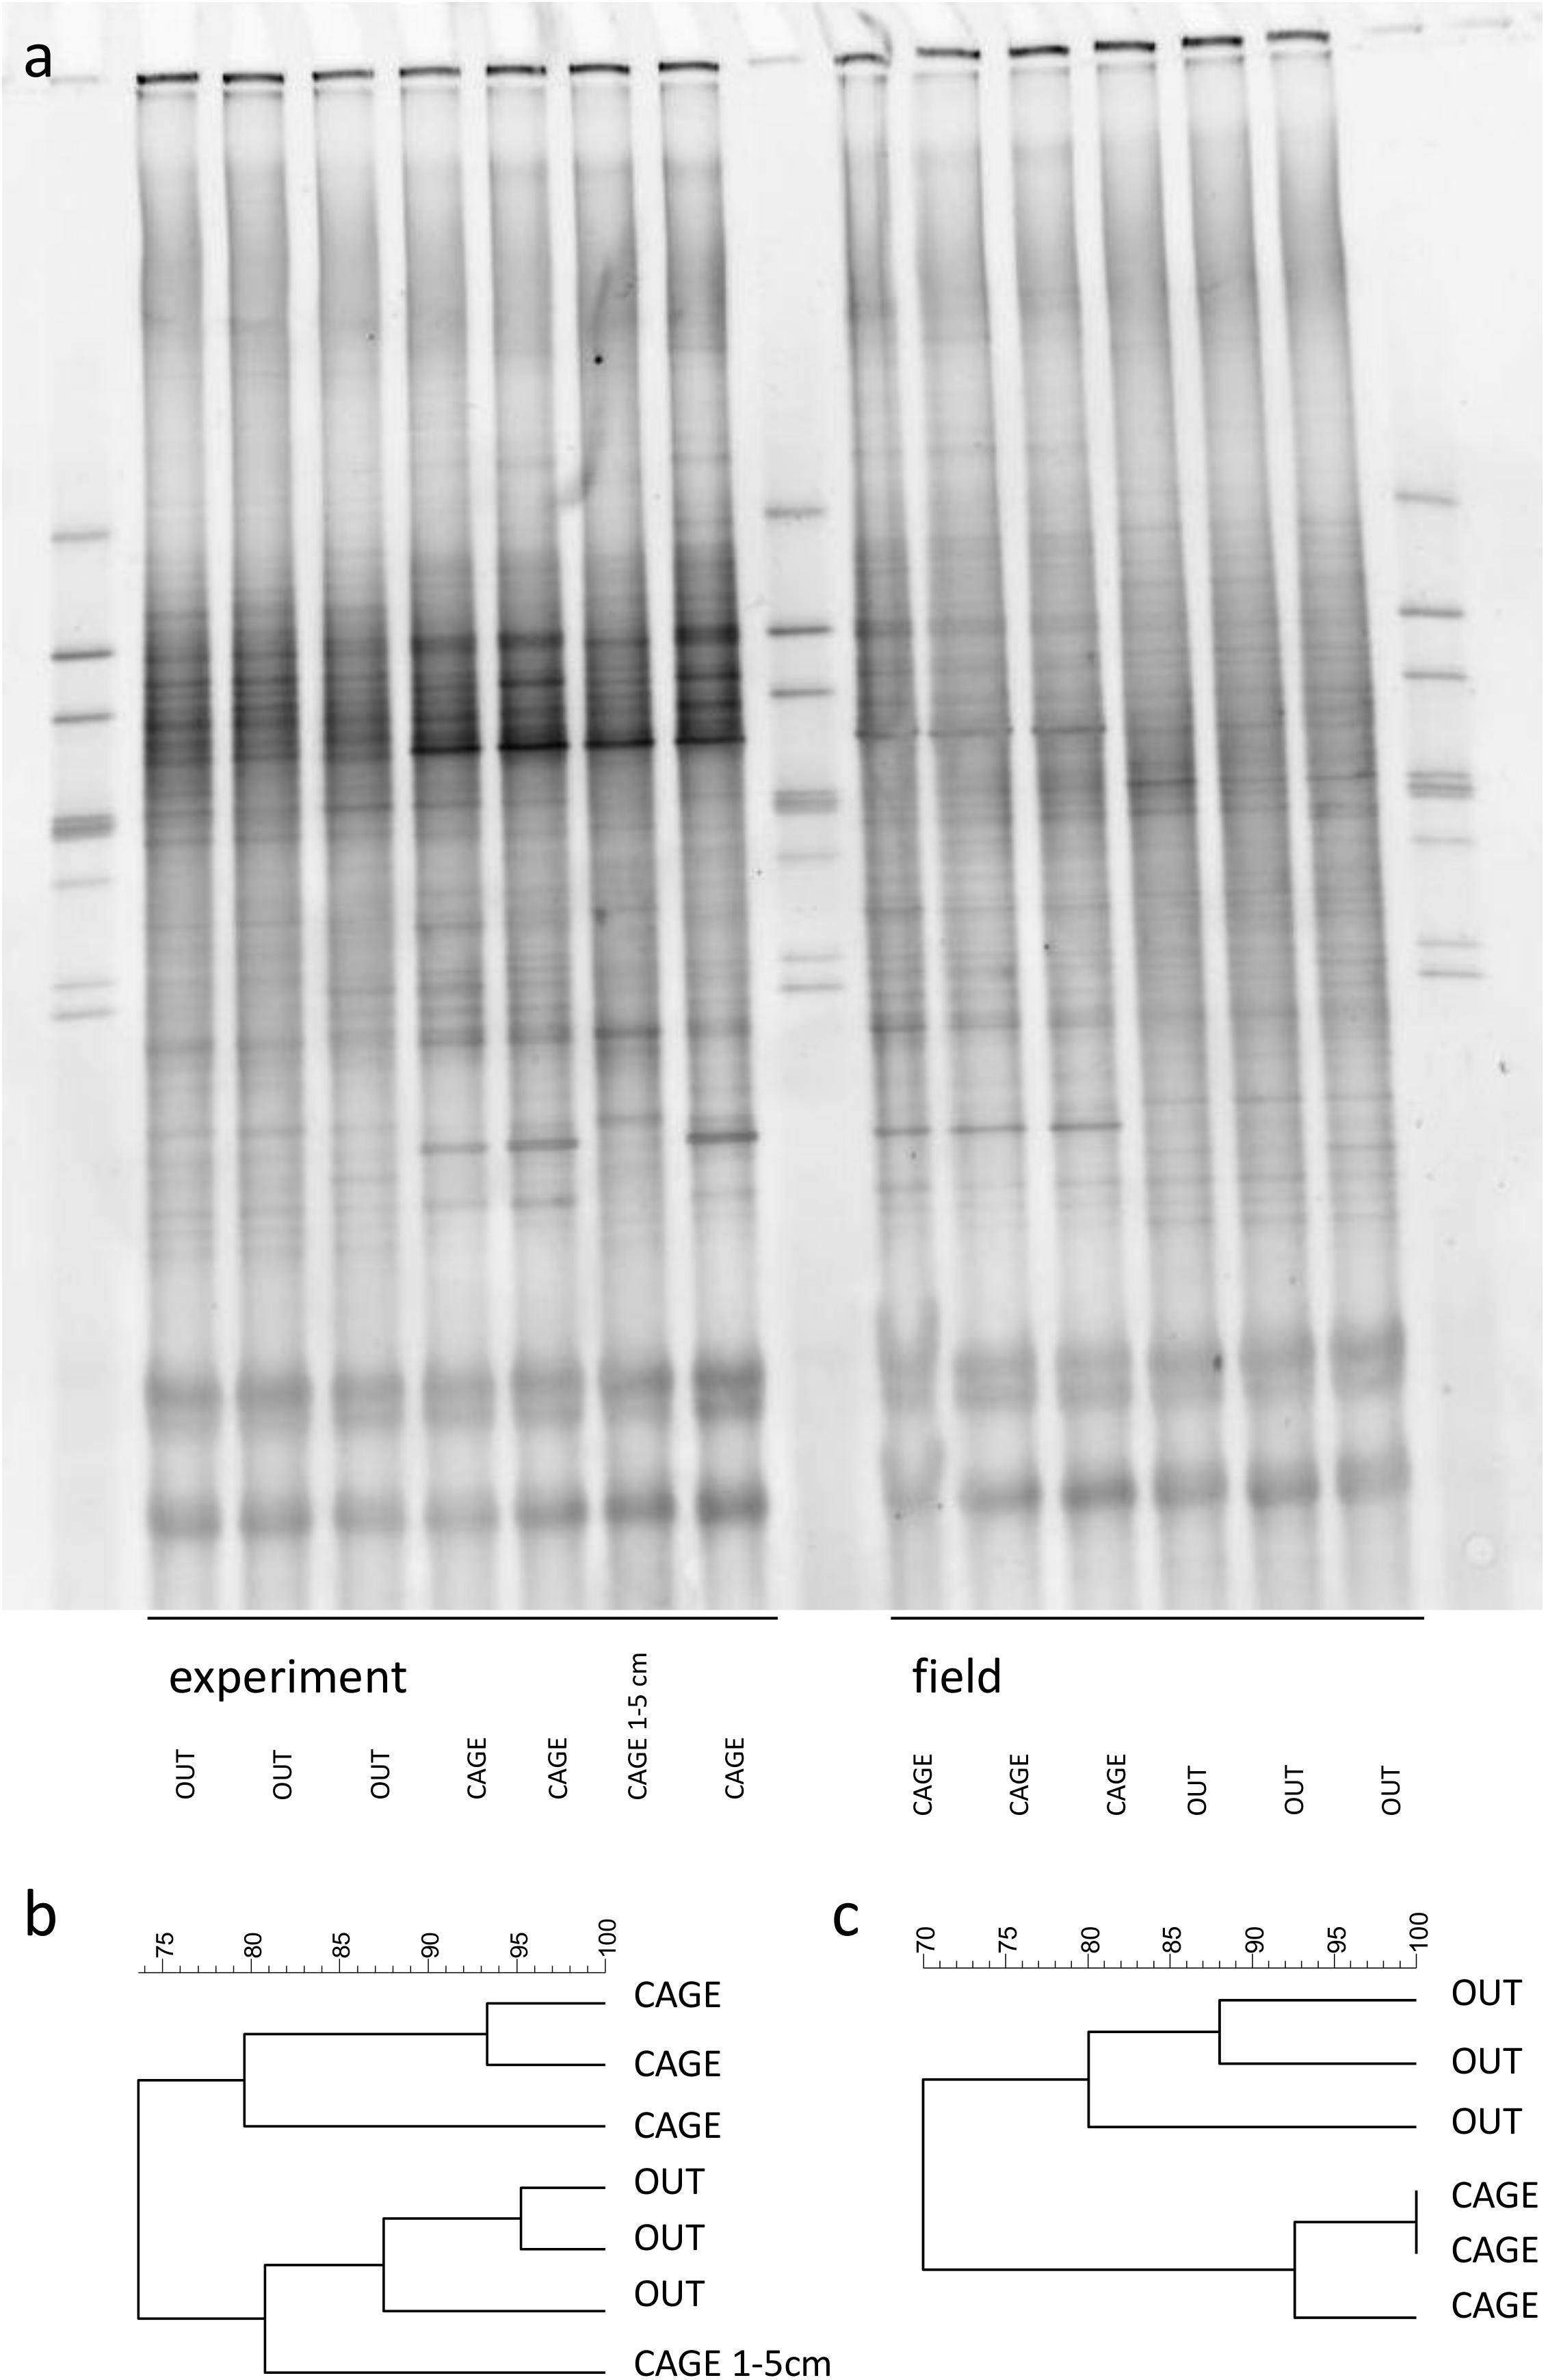
Figure 5. The DGGE gel of the sediment bacterial community (a). Samples were collected on top of the sediment prior to (field) and after 5 days incubation in the thermostatic chamber (experiment). An additional sample of lower sediment layer (1–5 cm) was collected at the end of the experiment. The dendrograms represent the similarity of experimental (b) and field (c) bacterial community (Dice (Tol 1.0%–1.0%)(H > 0.0% S > 0.0%)[0.0%–100.0%]).
The pore water analysis showed highly elevated Atot, DIC, NH4+, and PO43– values (Table 3) under the fish cages (CAGE) compared to the control (OUT). The top sediment layer (0–1 cm) of CAGE samples showed the highest values of NH4+, PO43–, and SiO44– (Figure 6). Furthermore, in CAGE samples almost 100% of the total P is represented by PO43–. Among the three dissolved N forms, the NH4+ was by far the dominant at both sites, but especially at the CAGE site. The NO32– concentration was higher in the OUT samples. The silicon values in pore waters are elevated in the CAGE samples, compared to the control. The pH values, are uniform in the CAGE and OUT samples.
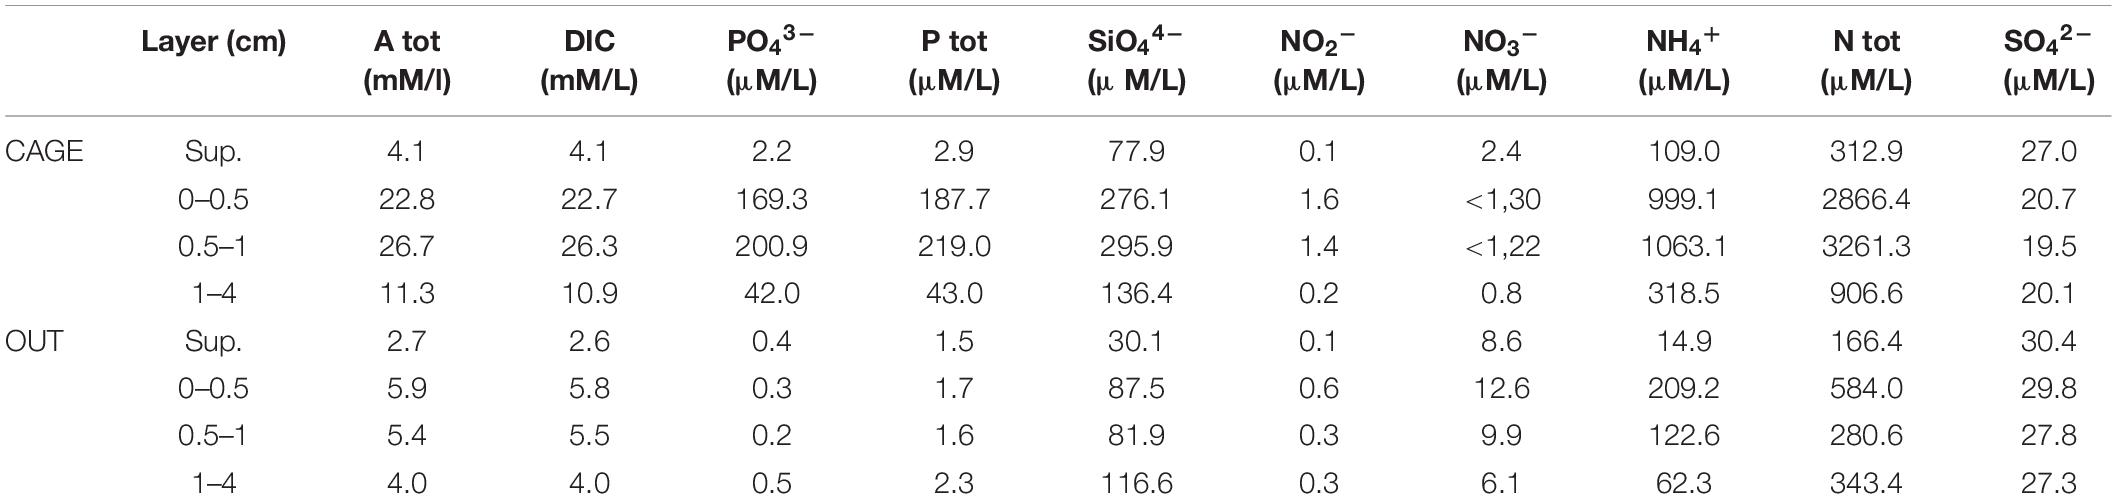
Table 3. Supernatant and pore water analysis of CAGE and OUT samples.
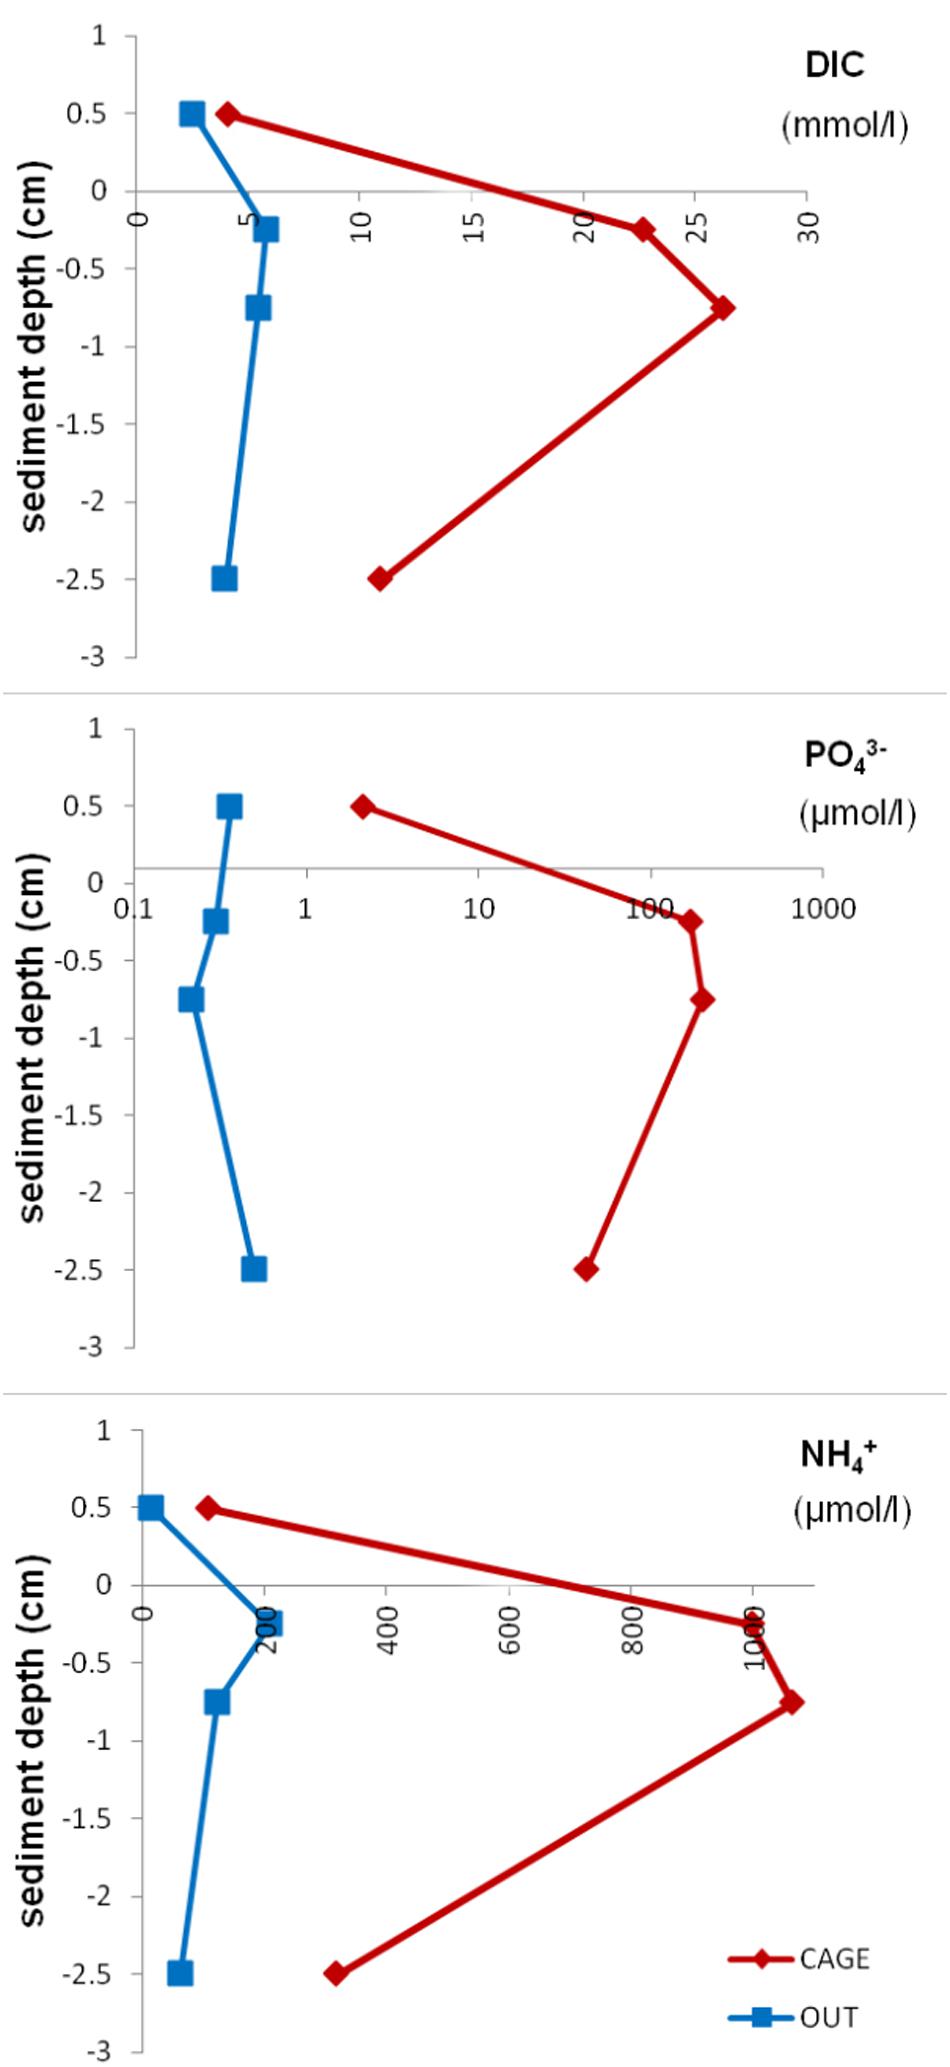
Figure 6. Dissolved inorganic carbon, phosphate, and ammonium concentration in pore water in different layers of CAGE and OUT samples. Note that the x-axis for phosphate is in the logarithmic scale.
The fish farm originating organic matter enters the meiofauna food web, as reflected in depleted δ13C of nematodes and harpacticoids at the farm site compared to the reference site (by 4.8 and 4.6‰, respectively). Similar shifts to more depleted δ13C values (for 2‰) were also observed for nematodes and several other invertebrates (polychaetes and anemones) under salmon farming cages in fjordic inlets in Ireland (Callier et al., 2013). Izquierdo-Gomez et al. (2015) also reported on more depleted δ13C values of wild penaeid prawns under fish farms compared to the reference site.
The organic load caused changes in the pathways of material flow in the food web. The nematodes and harpacticoids consume different food sources under the fish farm compared to reference site. Under the fish farm, an important food source for the nematode assemblage was the sedimentary OM, as reflected from δ13Cnematoda that was 2‰ heavier with respect to δ13CsedimentaryOM. As indicated by δ13C of the fish feed (−22.1‰), it was not directly used by nematodes (δ13C; −22.5‰) as their carbon isotope signatures were similar. The nematodes from the reference site, on the other hand, displayed 4.2‰ heavier δ13C relative to sedimentary OM. As reported by Nadon and Himmelman (2006), there is a general trend in several taxa of benthic consumers to become enriched by 4.1‰ relative to δ13C particulate OM. Since in the Bay of Piran, two thirds of the sedimentary OM originates from the water column OM and only one third originates from benthic producers (Faganeli et al., 1988), the nematodes from the reference site (−17.7‰) likely reflect a diet comprising a mixture of particulate organic matter (POM) and benthic producers. The δ13C of microphytobenthos was reported to be −15.4‰ (Oakes et al., 2012), −16.3‰ (Christianen et al., 2017), and −19.3‰ (Herman et al., 2000).
Harpacticoids, on the other hand, consume predominantly the sedimentary OM at the reference site, as shown from their 1.1‰ higher δ13C relative to sedimentary OM, a typical enrichment for a consecutive trophic level (Fry, 2006; Glibert et al., 2019). The harpacticoids from the cage site are influenced by a different and 13C-depleted carbon source, as shown in their δ13C signal (−25.3‰), which was for 0.9‰ depleted relative to sedimentary OM under cages. The fish feed used (δ13C; −22.1‰) could also not be linked directly to harpacticoid diet as it was distinctly heavy-isotope enriched compared to harpacticoids. The potential food sources for harpacticoids could be non-diatom microphytobentic groups, (range for combined cyanobacteria and green algae −24.8‰ to −23.8‰) on which they could be selectively feeding, thus resulting in their depleted δ13C (Evrard et al., 2012). Furthermore, a lower concentration of sulfate in cage sediment compared to the control sediment (Table 3) may indicate a greater abundance or activity of sulfate-reducing bacteria (SRB) under cage (Leloup et al., 2009). The SRB exhibit very low δ13C signals (−55‰) (Londry and Des Marais, 2003) and their densities were found to be positively correlated to organic enrichment associated to fish farming (Kondo et al., 2012). Moreover, the interface between sulfate-reducing sediments and the oxygenated water column may host filamentous bacteria Beggiatoa mats, whose biomass is also light in 13C (−27.9‰) (Sassen et al., 1993). In fact, Gee (2005) reported on the association of filamentous bacteria with specimens of harpacticoid Bulbamphiascus incus under a Scottish salmon farm. This genus dominated the harpacticoid community from the studied fish farm sediments (Grego, unpublished).
The harpacticoids under fish cages had the most depleted signal from all analyzed items. For that reason even simple, two end-member isotope mixing models did not work for harpacticoids (Stable Isotope Mixing Models for Estimating Source Proportions by the United States Environmental Protection Agency-IsoError was used). Additionally, the mixing models were not reliable due to low number of replicates given the (high) variability of δ13Cnematoda and δ13Charpacticoida. But most of all, it would be hard to achieve correct information on the contribution of different sources associated to fish farming on harpacticoid or nematode diet without the addition of fish feces δ13C in the equation, as for example in Ye et al. (1991) and Yokoyama et al. (2010).
The nematode assemblage in reference sediments of northern Adriatic Sea contributes more to carbon flux from benthic primary producers to higher trophic levels compared to harpacticoid assemblage. This can be stated by the fact that the nematode δ13C signal reflects their reliance on diatoms as food source and it was further confirmed by the outcome of 13C-labeled diatom addition experiment where nematode assemblage exhibited a greater grazing pressure on diatoms compared to harpacticoid assemblage. The nematode specific uptake was similar to harpacticoid specific uptake, but because of higher biomass of nematode assemblage they incorporated more diatom 13C than harpacticoid assemblage (Figure 4B). The high specific uptake of harpacticoid assemblage (Figure 4A) does not explain their δ13C, that clearly indicates sedimentary OM as their main food source. Similarly, the harpacticoid assemblage from cage sediments at the reference site was feeding on 13C labeled diatoms, whereas according to δ13C signal they rely on a much depleted food source, potentially bacteria. That could suggest that the harpacticoid food sources (in reference and farm site) range in large δ13C interval, from bacteria to diatoms. It is possible that under fish cages they consume the available food sources, which can also explain their high variation in δ13C (Figure 3). A minor specific uptake of 13C-labeled diatoms was shown for nematodes at the farm site (Figure 4A), indicating that the diatoms are not their food source under cages, which is in accordance with their δ13C signal, and reflects consumption of sedimentary OM and less enriched food sources. However, given the biomass of nematodes is approximately three times higher under cages, the incorporation of diatom 13C at cage site was still similar as at the compared to reference site. Due to higher relative biomass of nematodes in meiofauna community, they generally consume more diatom 13C than harpacticoid copepods (two-way ANOVA). Overall, the meiofauna organisms incorporated approximately 0.2% of the total label added at reference experimental units and 0.1% at cage experimental units. This is in the same order of magnitude (or an order more) as the relative consumption of macroalgae by meiofauna of shallow Antarctic sediments (Braeckman et al., 2019), and about an order of magnitude less than the relative consumption of microphytobenthos by intertidal macrofauna (Herman et al., 2000) in similar time frames (few days). A generally higher specific uptake of diatoms was observed in reference samples (2-way ANOVA) possibly because they are not oversaturated with organic load, as was the case in the farm samples.
A significant amount of organic carbon from the fish farm is reaching the bottom as illustrated by the δ13C of sedimentary OM (Figure 3), which was 2.6‰ more depleted under the fish farm compared to the reference site (−24.4‰ vs. −21.8‰). Sedimentary OM δ13C of −21.8‰ is a well established value for surface sediments in the Bay of Piran (Faganeli et al., 1991; Ogrinc et al., 2005; Covelli et al., 2006). Using isotope signatures, it was shown that two thirds of sedimentary OM originate from the water column POM and one third originates from benthic producers (Faganeli et al., 1988). Under fish cages, the sedimentary OM δ13C is also determined by fish feed and fish feces. The fish pellets used at our study site had the carbon isotope value of −22.2‰, similar to the natural POM of the area (−22.6‰, as measured 3 years prior to this study; Table 2), while sedimentary OM under cages was more depleted (−24.4‰). The sedimentary OM appears to be influenced by fish feces rather than fish feed, as it was reported that red sea bream excrete feces that is depleted in δ13C (by 3.5 to 4.4‰) relative to fish feed (Yokoyama et al., 2006). Likewise, Ye et al. (1991) measured δ13C of aquaculture-derived organic carbon that was depleted (−24.1‰) compared to fish feed (−21.5‰). The direct loss of feed is generally considered to be low because large assemblages of wild fish are attracted to farm installations (Dempster et al., 2002, 2010; Fernandez-Jover et al., 2007), and the fouling communities of benthic invertebrates consume the feed leftovers, as was proven before for this study area (Lojen et al., 2003, 2005; Dolenec et al., 2007). Likewise in our study, the sedimentary OM was depleted under fish cages compared to the reference, in Tasmania (Ye et al., 1991). Mayor et al. (2017) reported that phospholipid fatty acid (PLFA) extracted from surficial sediments in five Scottish fish farms also showed a trend to more depleted δ13C values with increasing farm size and production. Contrary, Yokoyama et al. (2006), Holmer et al. (2007), and Callier et al. (2013) did not find a clear trend in δ13C of sedimentary OM in relation to fish farming in Japan, Spain, Greece, Italy, and Ireland. The impact of the cage deposits on the δ13C of sedimentary OM also depends on the δ13C of feed relative to natural POM.
The sedimentary OM under the fish cages is more driven by bacterial activity in contrast to the reference site. Higher DIC, PO43–, and NH4+ concentrations in pore waters in cage sediments (Table 3 and Figure 6) point to elevated microbial degradation of organic matter compounds. Asami et al. (2005), who studied coastal marine sediments, found a significantly lower sulfate concentration beneath aquacultures. They hypothesized that sulfate-reducing and sulfur-oxidizing bacteria thrived in such an environment, which they confirmed by quantitative competitive PCR. Likewise, a sulfate reduction is observed in our cage sediments by lower SO42– values compared to reference site (Table 3) which may indicate the presence of sulfate-reducing bacteria (SRB). The SRB are δ13C depleted, and in marine sediments are expected to have values as low as −55‰ (Londry and Des Marais, 2003), and may have contributed to lower values of sediment and meiofauna at the farm site. In fact, a different bacterial community was present in the cage sediment compared to the reference sediment (Figure 5). Hollander and Smith (2001) found that lower δ13C values generally point to microbial mediated carbon cycling and processes associated with the intensification of seasonal and long-term eutrophication.
The changes in the sediment under fish cages are reflected mostly in the upper sediment layers of muddy sediments. The top centimeter of sediment of the fish farm sediment had altered δ13C of sedimentary OM compared to the reference site, while the deeper layer (1–5 cm) δ13C was not distinguishable between the cage and reference sites (Figure 3). Also, the bacterial community from deeper sediment layers of fish farm sediment was more similar to the community of the reference sediments (Figure 5).
Fish farm-originating organic carbon reaches the bottom, as illustrated by the depleted δ13C of sedimentary OM in farm compared to the reference site. The sedimentary OM appears to be influenced by fish feces rather than fish feed, and seems to be more affected by bacterial activity in contrast to the reference site. Depleted δ13C of nematodes and harpacticoids under fish cages indicate that fish farm-derived organic matter enters the meiofauna food web. However, the fish feed originated organic matter could not be directly traced in δ13C of nematodes and harpacticoids. The nematodes and harpacticoids consume different food sources under the fish farm compared to the reference site. The nematode assemblage relies on a more 13C enriched food source at the reference site, while under cages their δ13C seem to be mostly influenced by sedimentary OM. The harpacticoid assemblage, on the other hand, depends predominantly on sedimentary OM as the main source of food at the reference site, while under cages a 13C depleted food source influenced their δ13C. The combination of background δ13C with the 13C-labeled diatom addition experiment confirmed the importance of diatoms as a food source for the nematode assemblage at the reference site, making them more important in carbon processing from the benthic primary producers to higher trophic levels in the sediments of northern Adriatic Sea compared to harpacticoids. At the cage site, the nematodes contribute to direct carbon recycling of farm-impacted sedimentary OM. Overall, the carbon stable isotope signatures were shown to be a useful tool to determine the impact of fish farming activities on the bottom sedimentary OM and meiofauna.
The datasets for this article are not publicly available. Requests to access the datasets should be directed to MG, bWF0ZWphLmdyZWdvQG5pYi5zaQ==.
AM provided funding from the FP6 ECASA (Ecosystem approach for sustainable aquaculture) project. MD conceived the idea of the feeding experiments. MG and MD performed the experiments. MG analyzed the samples and the data. MG wrote the manuscript with input from all authors.
This research was funded by the European 6th Framework Programme (ECASA; Ecosystem Approach for Sustainable Aquaculture, Project No. 006540) and by the Slovenian Research Agency (Research Core Founding No. P1-0237).
The authors declare that the research was conducted in the absence of any commercial or financial relationships that could be construed as a potential conflict of interest.
We thank Irena Fonda and the fish farmers Fonda (www.fonda.si) for their assistance in the sampling campaign and information about the fish farm, Clio Cnudde for the analysis of bacterial community, Milijan Šiško for help with statistical analysis, Jadran Faganeli, Branko Čermelj, and Katja Klun for comments on pore waters, Janez Forte for his ideas during the study, and Vlado Bernetič for the experiment setup photo. We are grateful to Sonja Lojen and Elena Gorokhova for their help with stable isotope mixing models, to Sonja Lojen for data from BIOFAQ (FP5) reports, and most of all we thank Tjaša Kogovšek for her valuable comments and support during the manuscript writing. We also appreciate the reviewers for their constructive comments which helped to improve the manuscript.
The Supplementary Material for this article can be found online at: https://www.frontiersin.org/articles/10.3389/fmars.2020.00572/full#supplementary-material
Asami, H., Aida, M., and Watanabe, K. (2005). Accelerated sulfur cycle in coastal marine sediment beneath areas of intensive shellfish aquaculture. Appl. Environ. Microbiol. 71, 2925–2933. doi: 10.1128/aem.71.6.2925-2933.2005
Bergvik, M., Stensås, L., Handå, A., Reitan, K. I., Strand, Ø, and Olsen, Y. (2019). Incorporation of feed and fecal waste from salmon aquaculture in great scallops (Pecten maximus) co-fed by different algal concentrations. Front. Mar. Sci. 5:524. doi: 10.3389/fmars.2018.00524
Bongiorni, L., Mirto, S., Pusceddu, A., and Danovaro, R. (2005). Response of benthic protozoa and thraustochytrid protists to fish farm impact in seagrass (Posidonia oceanica) and soft-bottom sediments. Microb. Ecol. 50, 268–276. doi: 10.1007/s00248-004-0117-4
Borja, Á, Rodríguez, J. G., Black, K., Bodoy, A., Emblow, C., Fernandes, T. F., et al. (2009). Assessing the suitability of a range of benthic indices in the evaluation of environmental impact of fin and shellfish aquaculture located in sites across Europe. Aquaculture 293, 231–240. doi: 10.1016/j.aquaculture.2009.04.037
Braeckman, U., Pasotti, F., Vázquez, S., Zacher, K., Hoffmann, R., Elvert, M., et al. (2019). Degradation of macroalgal detritus in shallow coastal Antarctic sediments. Limnol. Oceanogr. 64, 1423–1441. doi: 10.1002/lno.11125
Callier, M. D., Lefebvre, S., Dunagan, M. K., Bataille, M. P., Coughlan, J., and Crowe, T. P. (2013). Shift in benthic assemblages and organisms’ diet at salmon farms: community structure and stable isotope analyses. Mar. Ecol. Prog. Ser. 483, 153–167. doi: 10.3354/meps10251
Carman, K. R., and Fry, B. (2002). Small-sample methods for delta C-13 and delta N-15 analysis of the diets of marsh meiofaunal species using natural-abundance and tracer-addition isotope techniques. Mar. Ecol. Prog. Ser. 240, 85–92. doi: 10.3354/meps240085
Caruso, G. (2014). Effects of aquaculture activities on microbial assemblages. Oceanography 2:e107. doi: 10.4172/2332-2632.1000e107
Christianen, M. J. A., Middelburg, J. J., Holthuijsen, S. J., Jouta, J., Compton, T. J., van der Heide, T., et al. (2017). Benthic primary producers are key to sustain the Wadden Sea food web: stable carbon isotope analysis at landscape scale. Ecology 98, 1498–1512. doi: 10.1002/ecy.1837
Covelli, S., Fontolan, G., Faganeli, J., and Ogrinc, N. (2006). Anthropogenic markers in the Holocene stratigraphic sequence of the Gulf of Trieste (northern Adriatic Sea). Mar. Geol. 230, 29–51. doi: 10.1016/j.margeo.2006.03.013
de Jonge, V. N., and Bouwman, L. A. (1977). A simple density separation technique for quantitative isolation of meiobenthos using the colloidal silica Ludox-TM. Mar. Biol. 42, 143–148. doi: 10.1007/BF00391564
De Troch, M., Grego, M., Chepurnov, V. A., and Vincx, M. (2007). Food patch size, food concentration and grazing efficiency of the harpacticoid Paramphiascella fulvofasciata (Crustacea. Copepoda). J. Exp. Mar. Biol. Ecol. 343, 210–216. doi: 10.1016/j.jembe.2006.12.022
Dempster, T., Sanchez-Jerez, P., Bayle-Sempere, J. T., Gimenez-Casalduero, F., and Valle, C. (2002). Attraction of wild fish to sea-cage fish farms in the south-western Mediterranean Sea: spatial and short-term temporal variability. Mar. Ecol. Prog. Ser. 242, 237–252. doi: 10.3354/meps242237
Dempster, T., Sanchez-Jerez, P., Uglem, I., and Bjørn, P.-A. (2010). Species-specific patterns of aggregation of wild fish around fish farms. Estuar. Coast. Shelf Sci. 86, 271–275. doi: 10.1016/j.ecss.2009.11.007
DeNiro, M. J., and Epstein, S. (1981). Isotopic composition of cellulose from aquatic organisms. Geochim. Cosmochim. 45, 1885–1894. doi: 10.1016/0016-7037(81)90018-1
Dolenec, T., Lojen, S., Kniewald, G., Dolenec, M., and Rogan, N. (2007). Nitrogen stable isotope composition as a tracer of fish farming in invertebrates Aplysina aerophoba, Balanus perforatus and Anemonia sulcata in central Adriatic. Aquaculture 262, 237–249. doi: 10.1016/j.aquaculture.2006.11.029
Edmond, J. M. (1970). High precision determination of titration alkalinity and total carbon dioxide content of sea water by potentiometric titration. Deep Sea Res. 17, 737–750. doi: 10.1016/0011-7471(70)90038-0
Evrard, V., Huettel, M., Cook, P. L. M., Soetaert, K., Heip, C. H. R., and Middelburg, J. J. (2012). Importance of phytodetritus and microphytobenthos for heterotrophs in a shallow subtidal sandy sediment. Mar. Ecol. Prog. Ser. 455, 13–31. doi: 10.3354/meps09676
Faganeli, J., Malej, A., Pezdic, J., and Malacic, V. (1988). C-N-P ratios and stable C-isotopic ratios as indicators of sources of organic-matter in the gulf of trieste (Northern Adriatic). Oceanol. Acta 11, 377–382.
Faganeli, J., Planinc, R., Pezdič, Smodiš, B., Stegnar, P., and Ogorelec, B. (1991). Marine geology of the Gulf of Trieste (northern Adriatic): geochemical aspects. Mar. Geol. 99, 93–108. doi: 10.1016/0025-3227(91)90085-i
FAO (2005–2019). Cultured Aquatic Species Information Programme. Dicentrarchus Labrax. Cultured Aquatic Species Information Programme, ed. M. Bagni (Rome: FAO Fisheries and Aquaculture Department).
Fernandez-Jover, D., Sanchez-Jerez, P., Bayle-Sempere, J., Carratala, A., and Leon, V. M. (2007). Addition of dissolved nitrogen and dissolved organic carbon from wild fish faeces and food around Mediterranean fish farms: implications for waste-dispersal models. J. Exp. Mar. Biol. Ecol. 340, 160–168. doi: 10.1016/j.jembe.2006.09.001
Franco, M. A., Soetaert, K., Costa, M. J., Vincx, M., and Vanaverbeke, J. (2008). Uptake of phytodetritus by meiobenthos using 13C labelled diatoms and Phaeocystis in two contrasting sediments from the North Sea. J. Exp. Mar. Biol. Ecol. 362, 1–8. doi: 10.1016/j.jembe.2008.04.010
Gao, Q.-F., Cheung, K.-L., Cheung, S.-G., and Shin, P. K. S. (2005). Effects of nutrient enrichment derived from fish farming activities on macroinvertebrate assemblages in a subtropical region of Hong Kong. Mar. Pollut. Bull. 51, 994–1002. doi: 10.1016/j.marpolbul.2005.01.009
Gee, J. M. (2005). Two new species of Bulbamphiascus Lang (Copepoda : Harpacticoida : Diosaccidae) from Scotland and the Isles of Scilly, with additional observations on B. denticulatus (Thompson). J. Nat. History 39, 1961–1979.
Glibert, P. M., Middelburg, J. J., McClelland, J. W., and Jake Vander Zanden, M. (2019). Stable isotope tracers: enriching our perspectives and questions on sources, fates, rates, and pathways of major elements in aquatic systems. Limnol. Oceanogr. 64, 950–981. doi: 10.1002/lno.11087
Grasshoff, K., Ehrhardt, M., and Kremling, K. (1983). “Determination of phosphorus,” in Methods of Seawater Analysis, eds K. Grasshoff, M. Ehrhardt, and K. Kremling (Deerfield Beach, FL: Verlag Chemie).
Grasshoff, K., Kremling, K., and Ehrhardt, M. (1999). Methods of Seawater Analysis, 3rd Edn. Hoboken, NJ: Wiley ch Verlag GmbH.
Grego, M., De Troch, M., Forte, J., and Malej, A. (2009). Main meiofauna taxa as an indicator for assessing the spatial and seasonal impact of fish farming. Mar. Pollut. Bull. 58, 1178–1186. doi: 10.1016/j.marpolbul.2009.03.020
Guillard, R. R. L. (1975). “Culture of phytoplankton for feeding marine invertebrates,” in Culture of Marine Invertebrate Animals, eds M. H. Chanley, and W. L. Smith (New York, NY: Plenum Press), 26–60.
Hargrave, B. T., Phillips, G. A., Doucette, L. I., White, M. J., Milligan, T. G., Wildish, D. J., et al. (1997). Assessing benthic impacts of organic enrichment from marine aquaculture. Water Air Soil Pollut. 99, 641–650. doi: 10.1007/978-94-011-5552-6_65
Herman, P. M. J., Middelburg, J. J., Widdows, J., Lucas, C. H., and Heip, C. H. R. (2000). Stable isotopes as trophic tracers: combining field sampling and manipulative labelling of food resources for macrobenthos. Mar. Ecol. Prog. Ser. 204, 79–92. doi: 10.3354/meps204079
Hollander, D. J., and Smith, M. A. (2001). Microbially mediated carbon cycling as a control on the [delta]13C of sedimentary carbon in eutrophic Lake Mendota (USA): new models for interpreting isotopic excursions in the sedimentary record. Geochim. Cosmochim. Acta 65, 4321–4337. doi: 10.1016/s0016-7037(00)00506-8
Holmer, M., Argyrou, M., Dalsgaard, T., Danovaro, R., Diaz-Almela, E., Duarte, C. M., et al. (2008). Effects of fish farm waste on Posidonia oceanica meadows: synthesis and provision of monitoring and management tools. Mar. Pollut. Bull. 56, 1618–1629. doi: 10.1016/j.marpolbul.2008.05.020
Holmer, M., Marba, N., Diaz-Almela, E., Duarte, C. M., Tsapakis, M., and Danovaro, R. (2007). Sedimentation of organic matter from fish farms in oligotrophic Mediterranean assessed through bulk and stable isotope ([delta]13C and [delta]15N) analyses. Aquaculture 262, 268–280. doi: 10.1016/j.aquaculture.2006.09.033
Hornick, K. M., and Buschmann, A. H. (2018). Insights into the diversity and metabolic function of bacterial communities in sediments from Chilean salmon aquaculture sites. Ann. Microbiol. 68, 63–77. doi: 10.1007/s13213-017-1317-8
Izquierdo-Gomez, D., Sanchez-Jerez, P., Bayle-Sempere, J. T., Loader, N. J., and Garcia de Leaniz, C. (2015). Effects of coastal fish farms on body size and isotope composition of wild penaeid prawn. Fish. Res. 172, 50–56. doi: 10.1016/j.fishres.2015.06.017
Kennedy, A. D., and Jacoby, C. A. (1999). Biological indicators of marine environmental health: meiofauna - A neglected benthic component? Environ. Monit. Assess. 54, 47–68.
Kondo, R., Shigematsu, K., Kawahara, N., Okamura, T., Yoon, Y. H., Sakami, T., et al. (2012). Abundance of sulphate-reducing bacteria in fish farm sediments along the coast of Japan and South Korea. Fish. Sci. 78, 123–131. doi: 10.1007/s12562-011-0439-3
Kovač, N., Čermelj, B., Vrišer, B., and Lojen, S. (2003). Influence of fish farming on Coastal Marine Sediment in Slovenia (Piran Bay, northern Adriatic):Final Report. Piran: National Institute of Biology.
Kovač, N., Čermelj, B., Vrišer, B., and Lojen, S. (2004). “The influence of fish farming on coastal marine sediment in Slovenia (Piran Bay, northern Adriatic),” in MAP Technical Reports Series 140(Anex II) (Nairobi: United Nations Environment Programme), 1–6.
Kusche, H., Hillgruber, N., Rößner, Y., and Focken, U. (2017). Plant protein-based feeds and commercial feed enable isotopic tracking of aquaculture emissions into marine macrozoobenthic bioindicator species. Isotopes Environ. Health Stud. 53, 261–273. doi: 10.1080/10256016.2016.1267166
Kutti, T., Ervik, A., and Hansen, P. K. (2007). Effects of organic effluents from a salmon farm on a fjord system. I. Vertical export and dispersal processes. Aquaculture 262, 367–381. doi: 10.1016/j.aquaculture.2006.10.010
La Rosa, T., Mirto, S., Mazzola, A., and Danovaro, R. (2001). Differential responses of benthic microbes and meiofauna to fish-farm disturbance in coastal sediments. Environ. Pollut. 112, 427–434. doi: 10.1016/s0269-7491(00)00141-x
La Rosa, T., Mirto, S., Mazzola, A., and Maugeri, T. L. (2004). Benthic microbial indicators of fish farm impact in a coastal area of the Tyrrhenian Sea. Aquaculture 230, 153–167. doi: 10.1016/s0044-8486(03)00433-2
Lammers, J. M., Schubert, C. J., Middelburg, J. J., and Reichart, G. J. (2016). Carbon flows in eutrophic Lake Rotsee: a 13C-labelling experiment. Biogeochemistry 131, 147–162. doi: 10.1007/s10533-016-0272-y
Landrum, J. P., and Montoya, J. P. (2009). Organic matter processing by the shrimp Palaemonetes sp.: isotopic and elemental effects. J. Exp. Mar. Biol. Ecol. 380, 20–24. doi: 10.1016/j.jembe.2009.08.020
Leduc, D., Nodder, S. D., Rowden, A. A., Gibbs, M., Berkenbusch, K., Wood, A., et al. (2020). Structure of infaunal communities in New Zealand submarine canyons is linked to origins of sediment organic matter. Limnol. Oceanogr. doi: 10.1002/lno.11454 [Epub ahead of print].
Leloup, J., Fossing, H., Kohls, K., Holmkvist, L., Borowski, C., and Jørgensen, B. B. (2009). Sulfate-reducing bacteria in marine sediment (Aarhus Bay, Denmark): abundance and diversity related to geochemical zonation. Environ. Microbiol. 11, 1278–1291. doi: 10.1111/j.1462-2920.2008.01855.x
Lojen, S., Dror, A., Katz, T., Tsapakis, M., Kovac, N., and Malej, A. (2003). 15N enrichment in fouling communities influenced by organic waste deriving from fish farms. Ann. Ser. Hist. Nat. 13, 9–11.
Lojen, S., Spanier, E., Tsemel, A., Katz, T., Eden, N., and Angel, D. L. (2005). delta N-15 as a natural tracer of particulate nitrogen effluents released from marine aquaculture. Mar. Biol. 148, 87–96. doi: 10.1007/s00227-005-0063-9
Londry, K. L., and Des Marais, D. J. (2003). Stable carbon isotope fractionation by sulfate-reducing bacteria. Appl. Environ. Microbiol. 69, 2942–2949. doi: 10.1128/aem.69.5.2942-2949.2003
Maria, T. F., De Troch, M., Vanaverbeke, J., Esteves, A. M., and Vanreusel, A. (2011). Use of benthic vs planktonic organic matter by sandy-beach organisms: a food tracing experiment with 13C labelled diatoms. J. Exp. Mar. Biol. Ecol. 407, 309–314. doi: 10.1016/j.jembe.2011.06.028
Mayor, D. J., Gray, N. B., Hattich, G. S. I., and Thornton, B. (2017). Detecting the presence of fish farm-derived organic matter at the seafloor using stable isotope analysis of phospholipid fatty acids. Sci. Rep. 7:5146. doi: 10.1038/s41598-017-05252-w
Mazzola, A., Mirto, S., and Danovaro, R. (1999). Initial fish-farm impact on meiofaunal assemblages in coastal sediments of the western mediterranean. Mar. Pollut. Bull. 38, 1126–1133. doi: 10.1016/s0025-326x(99)00142-3
Mazzola, A., Mirto, S., La Rosa, T., Fabiano, M., and Danovaro, R. (2000). Fish-farming effects on benthic community structure in coastal sediments: analysis of meiofaunal recovery. ICES J. Mar. Sci. 57, 1454–1461. doi: 10.1006/jmsc.2000.0904
Mc Intyre, A. D., and Warwick, R. M. (1984). Methods for the Study of Marine Benthos (IBP Handbook). Oxford: Blackwell Science Ltd.
Middelburg, J. J. (2014). Stable isotopes dissect aquatic food webs from the top to the bottom. Biogeosciences 11, 2357–2371. doi: 10.5194/bg-11-2357-2014
Middelburg, J. J., Barranguet, C., Boschker, H. T. S., Herman, P. M. J., Moens, T., and Heip, C. H. R. (2000). The fate of intertidal microphytobenthos carbon: an in situ C-13-labeling study. Limnol. Oceanogr. 45, 1224–1234. doi: 10.4319/lo.2000.45.6.1224
Millero, F. J. (1995). Thermodynamics of the carbon dioxide system in the oceans. Geochim. Cosmochim. Acta 59, 661–677. doi: 10.1016/0016-7037(94)00354-o
Mirto, S., Bianchelli, S., Gambi, C., Krzelj, M., Pusceddu, A., Scopa, M., et al. (2010). Fish-farm impact on metazoan meiofauna in the Mediterranean Sea: analysis of regional vs. habitat effects. Mar. Environ. Res. 69, 38–47. doi: 10.1016/j.marenvres.2009.07.005
Moens, T., Verbeeck, L., and Vincx, M. (1999). Preservation and incubation time-induced bias in tracer-aided grazing studies on meiofauna. Mar. Biol. 133, 69–77. doi: 10.1007/s002270050444
Moreno-Rojas, J. M., Tulli, F., Messina, M., Tibaldi, E., and Guillou, C. (2008). Stable isotope ratio analysis as a tool to discriminate between rainbow trout (O. mykiss) fed diets based on plant or fish-meal proteins. Rapid Commun. Mass. Spectrom. 22, 3706–3710. doi: 10.1002/rcm.3775
Nadon, M.-O., and Himmelman, J. H. (2006). Stable isotopes in subtidal food webs: have enriched carbon ratios in benthic consumers been misinterpreted? Limnol. Oceanogr. 51, 2828–2836. doi: 10.4319/lo.2006.51.6.2828
Oakes, J. M., Eyre, B. D., and Middelburg, J. J. (2012). Transformation and fate of microphytobenthos carbon in subtropical shallow subtidal sands: a 13C-labeling study. Limnol. Oceanogr. 57, 1846–1856. doi: 10.4319/lo.2012.57.6.1846
Ogorelec, B., Mišič, M., and Faganeli, J. (1991). Marine geology of the Gulf of Trieste (northern Adriatic): sedimentological aspects. Mar. Geol. 99, 79–92. doi: 10.1016/0025-3227(91)90084-h
Ogrinc, N., Fontolan, G., Faganeli, J., and Covelli, S. (2005). Carbon and nitrogen isotope compositions of organic matter in coastal marine sediments (the Gulf of Trieste. N Adriatic Sea): indicators of sources and preservation. Mar. Chem. 95, 163–181. doi: 10.1016/j.marchem.2004.09.003
Ostrom, P. H., and Fry, B. (1993). “Sources and cycling of organic matter within modern and prehistoric food webs,” in Organic Geochemistry. Topics in Geobiology, eds M. H. Engel, and S. A. Macko (Boston, MA: Springer).
Pitta, P., Apostolaki, E. T., Tsagaraki, T., Tsapakis, M., and Karakassis, I. (2006). Fish farming effects on chemical and microbial variables of the water column: a spatio-temporal study along the Mediterranean Sea. Hydrobiologia 563, 99–108. doi: 10.1007/s10750-005-1593-3
Porrello, S., Lenzi, M., Ferrari, G., Persia, E., Savelli, F., and Tomassetti, P. (2005). Loading of nutrient from a land-based fish farm (Orbetello, Italy) at different times. Aquac. Int. 13, 97–108. doi: 10.1007/s10499-004-9027-1
R Development Core Team (2014). R: A Language and Environment for Statistical Computing. Vienna: R Foundation for Statistical Computing.
Ranke, U. (1976). The Sediments of the Gulf of Piran (Northern Adriatic Sea). Senckenbergiana Maritima 8, 23–60.
Sarà, G. (2007). A meta-analysis on the ecological effects of aquaculture on the water column: dissolved nutrients. Mar. Environ. Res. 63, 390–408. doi: 10.1016/j.marenvres.2006.10.008
Sarà, G., Scilipoti, D., Mazzola, A., and Modica, A. (2004). Effects of fish farming waste to sedimentary and particulate organic matter in a southern Mediterranean area (Gulf of Castellammare, Sicily): a multiple stable isotope study (δ13C and δ15N). Aquaculture 234, 199–213. doi: 10.1016/j.aquaculture.2003.11.020
Sara, G., Scilipoti, D., Milazzo, M., and Modica, A. (2006). Use of stable isotopes to investigate dispersal of waste from fish farms as a function of hydrodynamics. Mar. Ecol. Prog. Ser. 313, 261–270.
Sassen, R., Roberts, H. H., Aharon, P., Larkin, J., Chinn, E. W., and Carney, R. (1993). Chemosynthetic bacterial mats at cold hydrocarbon seeps. Gulf of Mexico continental slope. Org. Geochem. 20, 77–89. doi: 10.1016/0146-6380(93)90083-N
Sokal, R. R., and Rohlf, F. J. (1995). Biometry, the Principles and Practice of Statistics in Biological Research. New York: W. H. Freeman and company.
Soreide, J. E., Hop, H., Carroll, M. L., Falk-Petersen, S., and Hegseth, E. N. (2006). Seasonal food web structures and sympagic-pelagic coupling in the European Arctic revealed by stable isotopes and a two-source food web model. Prog. Oceanogr. 71, 59–87. doi: 10.1016/j.pocean.2006.06.001
Tabatabai, M. A. (1974). A rapid method for determination of sulfate in water samples. Environ. Lett. 7, 237–243. doi: 10.1080/00139307409437403
Temmerman, R., Scheirlinck, I., Huys, G., and Swings, J. (2003). Culture-independent analysis of probiotic products by denaturing gradient gel electrophoresis. Appl. Environ. Microbiol. 691, 220–226. doi: 10.1128/aem.69.1.220-226.2003
Van Hoorde, K., Verstraete, T., Vandamme, P., and Huys, G. (2008). Diversity of lactic acid bacteria in two Flemish artisan raw milk Gouda-type cheeses. Food Microbiol. 25, 929–935. doi: 10.1016/j.fm.2008.06.006
Wyckmans, M., Chepurnov, V. A., Vanreusel, A., and De Troch, M. (2007). Effects of food diversity on diatom selection by harpacticoid copepods. J. Exp. Mar. Biol. Ecol. 345, 119–128. doi: 10.1016/j.jembe.2007.02.002
Ye, L.-X., Ritz, D. A., Fenton, G. E., and Lewis, M. E. (1991). Tracing the influence on sediments of organic waste from a salmonid farm using stable isotope analysis. J. Exp. Mar. Biol. Ecol. 145, 161–174. doi: 10.1016/0022-0981(91)90173-t
Yokoyama, H., Abo, K., and Ishihi, Y. (2006). Quantifying aquaculture-derived organic matter in the sediment in and around a coastal fish farm using stable carbon and nitrogen isotope ratios. Aquaculture 254, 411–425. doi: 10.1016/j.aquaculture.2005.10.024
Yokoyama, H., Ishihi, Y., Abo, K., and Takashi, T. (2010). Quantification of waste feed and fish feces using stable carbon and nitrogen isotopes. Bull. Fish. Res. Agency 31, 71–76.
Yu, Z., and Morrison, M. (2004). Comparisons of different hypervariable regions of rrs genes for use in fingerprinting of microbial communities by PCR-denaturing gradient gel electrophoresis. Appl. Environ. Microbiol. 708, 4800–4806. doi: 10.1128/aem.70.8.4800-4806.2004
Keywords: δ13C, sedimentary organic matter, nematodes, harpacticoid copepods, 13C-labeled diatoms, sediment bacteria, fish farming, northern Adriatic Sea
Citation: Grego M, Malej A and De Troch M (2020) The Depleted Carbon Isotopic Signature of Nematodes and Harpacticoids and Their Place in Carbon Processing in Fish Farm Sediments. Front. Mar. Sci. 7:572. doi: 10.3389/fmars.2020.00572
Received: 29 November 2019; Accepted: 22 June 2020;
Published: 28 July 2020.
Edited by:
Jonathan Richir, Fonds National de la Recherche Scientifique (FNRS), BelgiumReviewed by:
Nabil Majdi, Bielefeld University, GermanyCopyright © 2020 Grego, Malej and De Troch. This is an open-access article distributed under the terms of the Creative Commons Attribution License (CC BY). The use, distribution or reproduction in other forums is permitted, provided the original author(s) and the copyright owner(s) are credited and that the original publication in this journal is cited, in accordance with accepted academic practice. No use, distribution or reproduction is permitted which does not comply with these terms.
*Correspondence: Mateja Grego, bWF0ZWphLmdyZWdvQG5pYi5zaQ==
Disclaimer: All claims expressed in this article are solely those of the authors and do not necessarily represent those of their affiliated organizations, or those of the publisher, the editors and the reviewers. Any product that may be evaluated in this article or claim that may be made by its manufacturer is not guaranteed or endorsed by the publisher.
Research integrity at Frontiers
Learn more about the work of our research integrity team to safeguard the quality of each article we publish.