 Simona Saviano
 Francesco De Leo
 Giovanni Besio
 Enrico Zambianchi
 Marco Uttieri
94% of researchers rate our articles as excellent or good
Learn more about the work of our research integrity team to safeguard the quality of each article we publish.
Find out more
ORIGINAL RESEARCH article
Front. Mar. Sci. , 10 July 2020
Sec. Ocean Observation
Volume 7 - 2020 | https://doi.org/10.3389/fmars.2020.00492
HF radar systems wave measurements are evaluated against numerical simulations in the Gulf of Naples (Southeastern Tyrrhenian Sea). Wave measurements are obtained from three CODAR SeaSonde HF radars installed along the coast of the Gulf of Naples. The numerical models employed are WavewatchIII, implemented on a regional scale with a resolution of about 10 km in longitude and latitude in the whole Mediterranean Sea, and SWAN, implemented with a 200 m resolution in the area of interest. Numerical simulations are also validated against experimental data acquired by a buoy installed offshore the Gulf of Naples. The agreement between HF radar measurements and model hindcasts is evaluated through the estimate of statistical error indices for the main wave characteristics (significant wave height, mean period, and mean direction). The consistency between wave parameters retrieved by HF radars and hindcasted by the models opens the way to future integration of the two systems as well as to the utilization of HF radar wave parameters that could be envisaged for data assimilation in wave models.
Monitoring the physical processes taking place in the nearshore region is a fundamental pre-requisite for a proper integrated management of the coastal zones. In this framework, land-based remote sensing by HF radars presently provides a challenging opportunity for simultaneously measuring surface currents and wave parameters (Paduan and Rosenfeld, 1996; Rubio et al., 2017; Capodici et al., 2019). Crombie (1955) described the physics underlying the acquisition by HF radars of the backscatter echo coming from the rough surface of the sea produced by the resonant first-order Bragg waves. First-order echoes provide measurements of surface currents (Paduan and Graber, 1997; Gelpi and Norris, 2003). Second-order echoes are weaker and noisier than the first-order ones (Gurgel et al., 2006) but information on wave parameters can be derived from this part of the spectrum using methods of integral inversion (Barrick, 1977, 1979; Lipa and Nyden, 2005). An advantage of such instruments is that they can collect continuous real-time wave measurements over wide areas, while traditional wave buoys can record parameters only relative to a fixed position (Lorente et al., 2019). Only over the last years the accuracy of HF radar wave measurements has started to be tested (Lopez et al., 2016), thus the analysis of the spectrum for wave applications is still a developing topic (Gurgel and Schlick, 2005).
In addition to instrumental measurements, several wave models used for both hindcasting and forecasting wave parameters are currently available. Among the most commonly adopted in the scientific literature are: WavewatchIII (WWIII), used as operational wave forecasting system by National Oceanic and Atmospheric Administration (NOAA) (Tolman and Chalikov, 1996); WAM (WAve Model), included in the Integrated Forecast System of European Center for Medium-Range Weather Forecasts (ECMWF) (Komen et al., 1994); and SWAN (Simulating WAves Nearshore), developed by Delft University of Technology (Booij et al., 1999) and aimed at downscaling the wave field up to the shallow waters. Previous investigations revealed how the parametrization of coastal effects such as (but not limited to) wave refraction, damping, shoaling and breaking is not trivial, leading to locally varying wave field and making an absolute comparison between wave models and HF radars difficult (Wyatt et al., 2003).
In a recent work (Saviano et al., 2019), the performance of a HF radar system operating in the Gulf of Naples (Southeastern Tyrrhenian Sea, Western Mediterranean Sea; hereinafter referred to as GoN, see Figure 1) was evaluated in comparison to wave measurements recorded by a fixed buoy. As the buoy was not positioned in the area directly covered by the HF radars, it was possible to evaluate the consistency of the patterns of measurements rather than the specific values. Notwithstanding this limitation, the comparison indicated a general good agreement between the two platforms, in particular with the HF radar installed in proximity of lower edge of the domain (therefore closer to the buoy, Figure 1), scoring a yearly averaged r = 0.73. By contrast, the comparison between the buoy and the two HF antennas located in the innermost sectors of the GoN returned lower numerical consistency, although similar patterns were pointed out (with yearly r values of 0.61 and 0.58). This result was expected, not only owing to the non-negligible physical distance between the buoy and the two innermost sites, but also due to the wider fetch possibly leading to more intense sea states and to bathymetric issues (Figure 1A). On the basis of this significant variation, additional investigation was needed; as such, the present study provides further investigations by comparing HF radar wave measurements in the GoN with the outputs of two wave models, WWIII and SWAN. WWIII provides information at a regional scale (Mentaschi et al., 2013a, 2015) while SWAN allows to downscale the wave features over finer resolutions, accounting for the complex morphology of the coastline (Booij et al., 1999). A first validation of the wave models was obtained through the comparison with wave measurements collected by a wave buoy installed at the outer edge of the GoN, which allows a direct comparison between the modeled and the sampled data. HF radar measurements were subsequently compared with the numerical model outcomes over three years, from January 2010 to December 2012. Such a long-term approach is, to the best of the present knowledge, unique, as previous studies covered shorter periods (usually from days to months) (see e.g., Wyatt et al., 2003; Siddons et al., 2009; Waters et al., 2013; Orasi et al., 2018; Lorente et al., 2018; Lopez and Conley, 2019). The paper is structured as follows. Section 2 presents the data used for the study and describes the locations of the wave measurement devices, while the indices employed for validating the models outcomes and evaluating the reliability of HF radars measures are presented in section 3. Sections 4 and 5 show and discuss the results of the aforementioned comparisons. Finally, in section 6 conclusions are summarized and possible future developments are introduced.
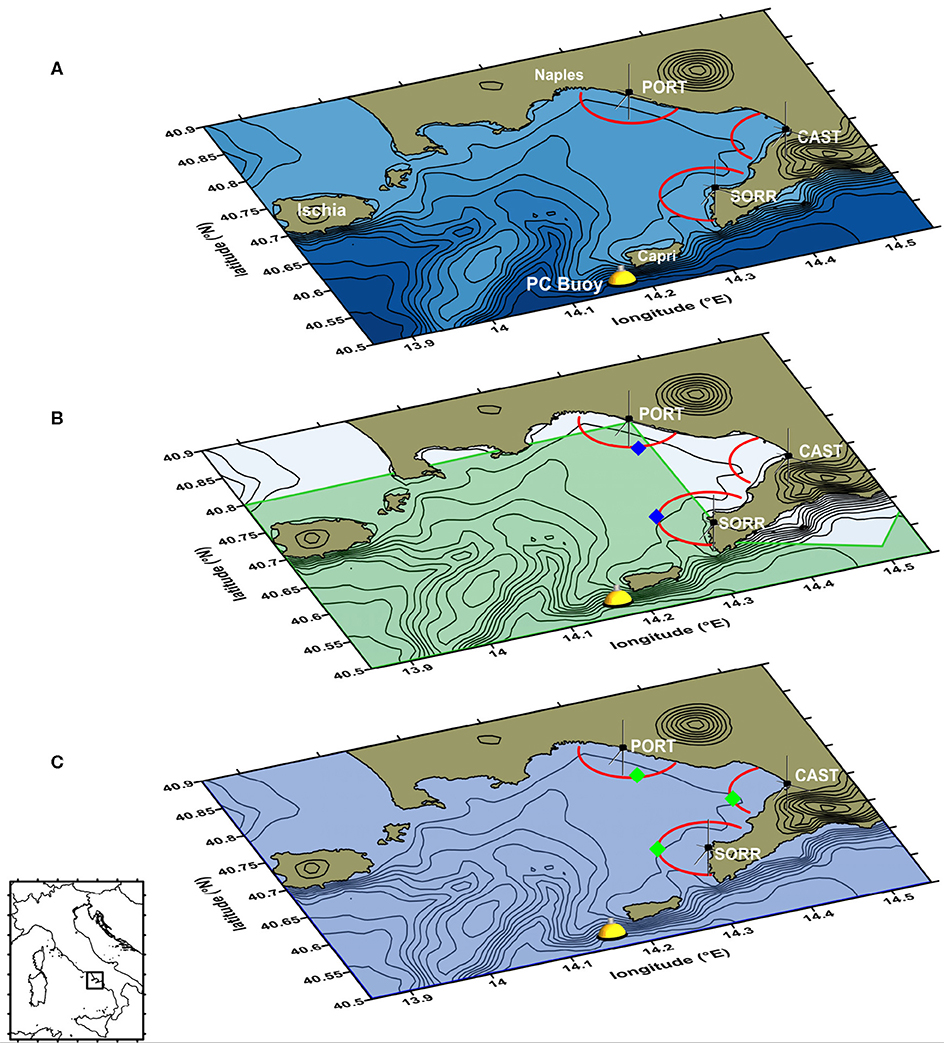
Figure 1. (A) Map of the Gulf of Naples (Southeastern Tyrrhenian Sea, Western Mediterranean Sea) with the locations of the three HF radar sites and the PC wave buoy. The red semi-circles represent the Range Cell (RC5) of acquisitions (see text). (B) Regional model: WWIII computational domain (green); blue diamonds indicate the grid points used for comparison. (C) Local model: SWAN computational domain (blue), green diamonds indicate the grid points used for comparison. The bathymetric contrours are spaced every 100 m, the orographic ones every 300 m. Coastline data: NOAA National Geophysical Data Center, Coastline extracted: WLC (World Coast Line), Date Retrieved: 01 April, 2015, http://www.ngdc.noaa.gov/mgg/shorelines/shorelines.html; bathymetric and orographic data from Amante and Eakins (2009) (accessed September 8, 2011).
Waves were both measured indirectly and directly. In the former case, a SeaSonde HF radar network covering the internal part of the GoN has provided spatial information on the main wave characteristics, integrated along range bins at roughly 1 km resolution (Figure 1). In addition, direct measurements from a directional buoy moored off Capri island (southwestern edge of GoN; Figure 1A) have been used as a benchmark in order to validate both the regional wave hindcast (developed with WWIII) and the downscaled local waves propagation inside the GoN (developed with SWAN).
The GoN is a coastal embayment along the Southeastern Tyrrhenian Sea, featuring key natural ecosystems and archeological sites, together with anthropized areas and brownfileds (e.g., Ferrigno et al., 2018; Armiento et al., 2020; Aucelli et al., 2020; Margiotta et al., 2020). Wave measurements inside the GoN were collected by a 25 MHz SeaSonde HF radar system (manufactured by CODAR Ocean Sensors Ltd), operated by the Department of Science and Technology at the “Parthenope” University of Naples. The network, used for the simultaneous measurement of the surface current (Menna et al., 2007; Uttieri et al., 2011; Cianelli et al., 2012, 2015; Kalampokis et al., 2016; Ranalli et al., 2018; Bagaglini et al., 2020) and wave fields (Falco et al., 2016; Saviano et al., 2019, 2020) was set up in 2004 with two monostatic antennas, in Portici (PORT) and Massa Lubrense (SORR), and in 2008 it was integrated with a third site in Castellammare di Stabia (CAST, see Figure 1). Such data have also been used in operational contexts and for physical-biological applications (Iermano et al., 2016; Cianelli et al., 2017). The GoN network is the first and longest-running installation in Europe (Rubio et al., 2017), and is presently operational, although since 2013 the SORR site has been discontinued. The SeaSonde system recorded and averaged single spectrum characteristics every 10 min along 1 km equally spaced circular annuli (range cells, RCs) centered on the antenna using a CODAR proprietary software (Seasonde Radial Suite R7u2) (for specific cylindrical handling of HF radar data see Sciascia et al., 2018). For each RC, information on spatially averaged wave parameters (significant wave height, centroid period, and direction, referred to as , , and θHF, respectively) were then extracted from the second-order spectrum by applying a Pierson-Moskowitz model (Lipa and Nyden, 2005). To estimate the directional ocean wave spectrum, SeaSonde assumes that the ocean wave spectrum is homogeneous over the radar RC (Lipa et al., 2018). For the analysis we used the results of the range cell located between 5 and 6 km from the coast (RC5), considered as the best operational selection, and we filtered the data to remove spikes and spurious data (details can be found in Saviano et al., 2019). In particular, only data relative to waves higher than half a meter were considered. Owing to intrinsic limitations in the physics behind the functioning of HF radars, when sea waves score Hs < 0.50 m the second-order echo is too small compared to spectral noise, and cannot reflect the radar transmitted electromagnetic signal efficiently (Wyatt and Green, 2009; Wyatt, 2011; Atan et al., 2016; Lopez et al., 2016). Such condition leads to erroneous readings or data gaps (Basañez et al., 2020). As such, measurements below this lower threshold were discarded from the analysis. In the GoN, sea states with significant wave heights lower than 0.5 m typically occur during the spring-summer periods (Pugliese Carratelli and Sansone, 1987; Benassai et al., 1994a,b; Buonocore et al., 2003).
A SEAWATCH Wavescan Buoy manufactured by Fugro OCEANOR (Trondheim, Norway) operated from August 2009 to mid-December 2010, and from mid-March to November 2012. The buoy (PC buoy, Figure 1) was installed at the southwestern limit of the basin of interest. It was equipped with a directional wave sensor and collected information about significant wave height (), mean period (), peak period (), and directions (θBUOY), providing data every 30 min; more details can be found in Saviano et al. (2019). Data on , , and θBUOY were used for the calibration of the regional and local models. The integration time of buoy measurements was 30 min.
Information from the large scale hindcast (WWIII) were downscaled inside the GoN (SWAN) in order to obtain a reliable description of wave characteristics influenced by the bathymetry and orography of the GoN.
The regional hindcast was developed by the Department of Civil, Chemical and Environmental Engineering of the University of Genoa (DICCA,www.dicca.unige.it/meteocean/hindcast), with the WWIII numerical model (Tolman, 1989, 2009). The hindcast was done in the Mediterranean Sea from 01/Jan/1979 to 31/Dec/2018, with an approximate 0.1° resolution both in longitude and latitude. The wave model was forced by 10 m wind fields obtained from the non-hydrostatic mesoscale model Weather Research and Forecast (WRF-ARW) version 3.3.1 (Skamarock et al., 2008), based on NCEP Climate Forecast System Reanalysis (CFSR), for the period from January 1979 to December 2010 and CFSv2 (Climate Forecast System version 2) for the period from January 2011 to December 2018. The output was hourly recorded at the nodes of the computational grid, providing the spectrum integrated quantities (, , ), the peak wave features (, ), along with the and wind velocity components (Mentaschi et al., 2013a, 2015; Cassola et al., 2016). Though the information provided by the hindcast is discretized (i.e., one dataset for every node of the computational grid), wave features can be continuously defined within the boundaries of the model through a time-spatial interpolation of the grid nodes outcomes. Nevertheless, the spatial resolution of the model may not allow to get the waves data at fine scales in the near-shore areas, as it actually happened for the GoN (see Figure 1B).
In order to evaluate the wave features at the HF radar RCs, the SWAN model (Booij et al., 1999) was nested within the frame of WWIII. A finer regular grid was developed, with a 0.0025° lon/lat resolution (almost 200 m at these latitudes), using a bathymetry of the area provided by the Hydrographic Institute of the Italian Navy (see Figure 1C). Then, hindcast data were used to set the wave conditions at the grid boundaries and to define the wind forcing over the whole domain. At this stage, it is worth mentioning that in SWAN sea states are modeled through a JONSWAP spectrum (Hasselmann et al., 1973), whose shape particularly depends on two parameters: the peak enhancement factor and the directional spreading (referred to as γ and θs, respectively). The former parameter affects the sharpness in frequency of the spectrum, i.e. high values of γ imply that the majority of sea states energy relies in proximity of the peak period; the latter parameter has a similar meaning, but with respect to the waves incoming direction: low (high) values of θs refer to sea states characterized by incoming directions weakly (highly) spread around the peak one. Therefore, in order to select the most performing SWAN setting, we tested four different sets: the values of γ taken into account are those characteristic of wind-waves dominated and swell dominated sea states (2.2 and 3.3, respectively), while θs was varied between 10° and 20°. The values of the two parameters were varied at a time, resulting in four possible model settings. The modeled wave features due to each of the tested sets were than evaluated against the buoy measurements, in order to retain the most efficient γ/θs combination (i.e., the one leading to the modeled wave features closer to the buoy data). A summary of the simulations is reported in Table 1.
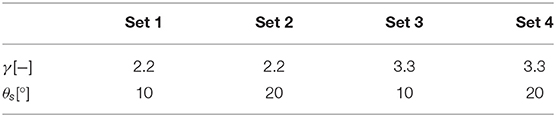
Table 1. SWAN settings tested for the local model validation.
As a first step, before comparing HF radar measurements with numerical model reanalysis, a validation of WWIII and SWAN performances was carried out against buoy data. Hence, we first evaluated the hourly hindcast outcomes at the buoy location within the period 25/Aug/2009–23/Dec/2010; at a second time, we compared the observations and the numerical simulations. The statistical parameters used for computing the correlation between the data are:
•
•
• slope = S/O
•
•
•
where Si and Oi are simulated and observed data, respectively; σ stands for the data standard deviation, whereas the overstanding bar indicates the average. ρ represents the correlation index, spanning in the ±1 range, where +1 (−1) indicates perfect correlation (anti-correlation) for two investigated series, while 0 indicates no-correlation. The statistical significance of the correlation is based on the criteria discussed in Rumsey (2016). NRMSE (Normalized Root Mean Square Error) is a measure of the distances between two datasets, and is one of the most employed indexes for evaluating the goodness of fit between the observed values of a variable and the correspondent values predicted by a model; then, substracting the average component of the error from the NRMSE, the scatter index (SI) is obtained. NRMSE and SI combine information on both the average and the scatter errors between two series, and should provide values as small as possible (ideally, if a perfect match exists, both the indexes should attain values equal to zero). NBIAS is a measure of the average component of the error, which should result in close-to-0 values for series in good agreement. slope measures the best linear interpolate for the resulting scatter of two series; under the hypothesis that two datasets are correlated, it attains positive values that may be lower or higher than 1, depending if the data to be validated are generally smaller or higher than the benchmark, respectively. Then, the index proposed by Hanna and Heinold (1985), referred to as HH, was employed. HH allows to overcome drawbacks that may arise for the simulations negatively biased, i.e. that underestimate the quantities measured (see Mentaschi et al., 2013b, who illustrate that in this case NRMSE and SI cannot be reliably used). Finally, when dealing with circular quantities such as the wave directions, the aforementioned indexes cannot be directly computed. In this case, an analysis should be performed on the differences between the simulated and the observed data, previously normalized in the [−π; π] space (i.e., in the worst case two waves may happen to be antiparallel). The directional indices have been therefore adjusted as follows:
•
•
where the modulus operator mod−π, π implies to subtract a 2π angle if Δθi > π, on the other hand, if Δθi < π a 2π angle is added to the difference.
The same test was performed for the hindcast data with respect to the HF radar data at PORT and SORR for the period 01/Jan/2010–30/Dec/2012. No analysis was available for CAST, as here the radar measurements fall outside the hindcast domain (see Figure 1B). Subsequently we analyzed the results linked to the SWAN model through the same procedure. In this case, the comparison between the HF radar and the model data was also carried out for CAST that is located within the SWAN domain. For the comparison, the HF data were averaged on 1 h. A Taylor diagram (Taylor, 2001) was also employed in order to select the best setting among the tested ones (see section 2.2.2).
Comparisons between WWIII and buoy data are shown in Figure 2. Correlation indexes (ρ) show values close to one, whereas the error indexes are characterized by close-to-zero values, indicating coherence among measurements, especially with respect to the significant wave heights (Hs) and the mean periods (Tm). The scatter plots show that only in few cases the parameters related to the different sources are significantly diverging from the 45° line (which indicates perfect correlation). Indeed, the color in the scatter plots is scaled according to the frequency of occurrence, i.e. the darker colors refer to conditions that seldom take place either in the buoy and WWIII outcomes, while the brighter colors are related to sea states more frequently encountered in both the numerical model and the buoy measurements. A higher uncertainty characterizes the mean directions, which can be anyway considered consistent as most of the computed Δθ (about the 70% of data) lie in the [−45°; 45°] range. As for the local scale analysis (i.e., the wave downscaling in the GoN with the high resolution model SWAN), Table 2 shows the correlations for each trial set of the model, evaluated versus the wave heights of the PC buoy, Hs being taken as the leading parameter (data not shown). Results over the whole series are sensibly improved with respect to the regional scale ones. However, the values of the error indices suggest that the resulting wave features are weakly sensitive to the selection of the peakedness factor γ and the directional spreading θs. This is further confirmed by inspection of the Taylor diagram: as Figure 3 shows, distributions relative to the different simulations almost overlap each other. If an overview of the total statistics does not reveal a significant dependence on the peak enhancement parameter and the spectrum directional spreading, zooming to a particular wave height series shows how different choices for these parameters may actually affect the model outcomes. Generally, θs equal to 20° results in wave heights slightly higher than the 10° ones: the modeled wave heights can be therefore either closer or farther with respect to the buoy ones, depending on the sea state under investigation (i.e., if the sea states are overestimated or underestimated with respect to the sampled ones, see Figure 4). However, these differences are damped in the overall simulations, which embed almost 2 years of hourly sampled sea states.
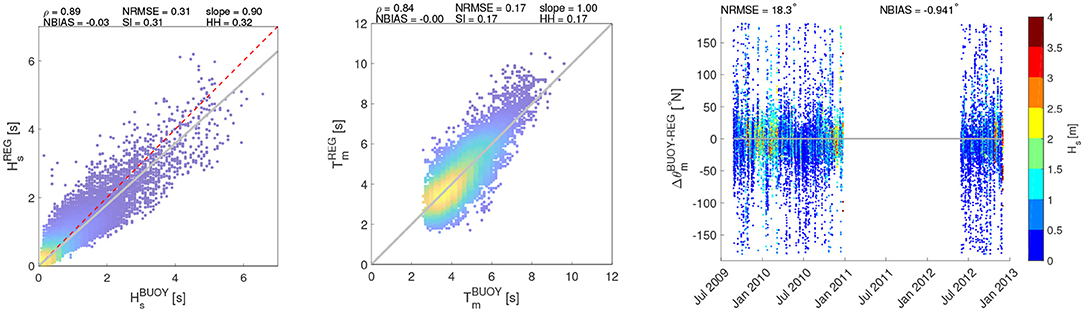
Figure 2. Validation of WWIII model results vs PC buoy recording. (Left) Hs; (Center) Tm; (Right) θ. The colors of the scatters (Hs, Tm) are scaled according to their frequency of occurrence. The θ colorbar is referred to the value of Hs.
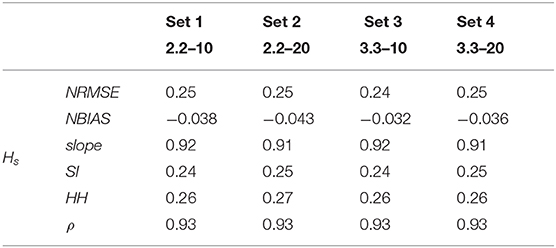
Table 2. Comparison of the statistical indexes employed to validate SWAN.
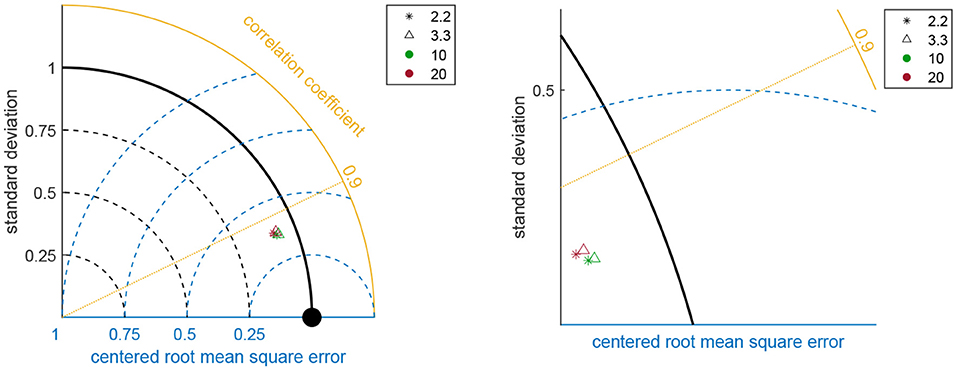
Figure 3. Taylor diagram of Hs between PC buoy and SWAN for different γ and θs tested in the model implementation (see Table 1). The panel on the right hand side zooms into the Taylor diagram to better show the overlap of the points.
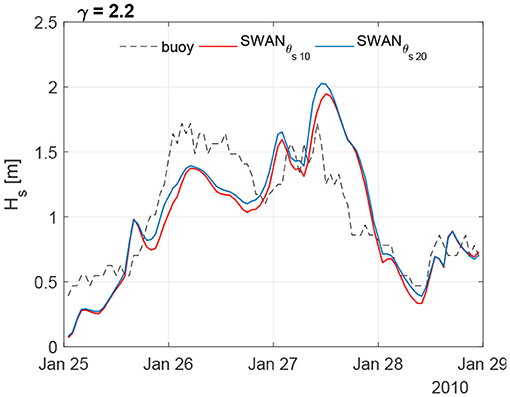
Figure 4. Comparison of Hs between PC buoy and SWAN simulations during a sea storm. The plot reports model performance using set1 and set2 cases (see Table 1).
For this study the following SWAN simulations were performed setting γ and θs equal to 2.2 and 20, respectively, according to values typically suggested for the Mediterranean Sea (Terrile et al., 2012; Perez et al., 2017). Finally, it is worth mentioning that the ranges of the two parameters span all the possible combinations of γ and θs that may reasonably characterize the JONSWAP spectrum in the area of interest, so that a sensitivity analysis over intermediate values would happen to be redundant.
HF radar data have been compared with the simulations from WWIII for the two locations where the numerical simulations were available (i.e., PORT and SORR) (Figures 5, 6). Both locations show wave features consistent with each other. As to PORT, Hs and T are characterized by high correlations values (0.73–0.64 for ρ and 0.87–1.22 for slope, respectively), while the error indices are not relevant, as can be noticed from the values of NBIAS, reaching values of −0.05 and 0.24. Actually, the comparisons are less satisfactory for SORR, especially for the significant wave height, though still showing reasonable correlations (ρ = 0.65). The more dispersed values in SORR seemingly depend on outliers recorded by the HF radar, departing from the cloud embedding the majority of the data (Figure 6). Finally, it can be noticed how the scatters of the distribution of Hs and T is low-bound by the thresholds set to filter the radar data, as explained in section 2. In terms of θm, the agreement between HF radar and model data is remarkable in PORT, while in SORR the results are more scattered, but mostly within [−50°,50°]. As for the mean wave directions, it should be mentioned though how it is not trivial to accurately model them, especially for moderate sea states (as shown by the color bar of Figure 2). As such, this could add further uncertainty in the comparison between the modeled and the HF radar sampled θ.
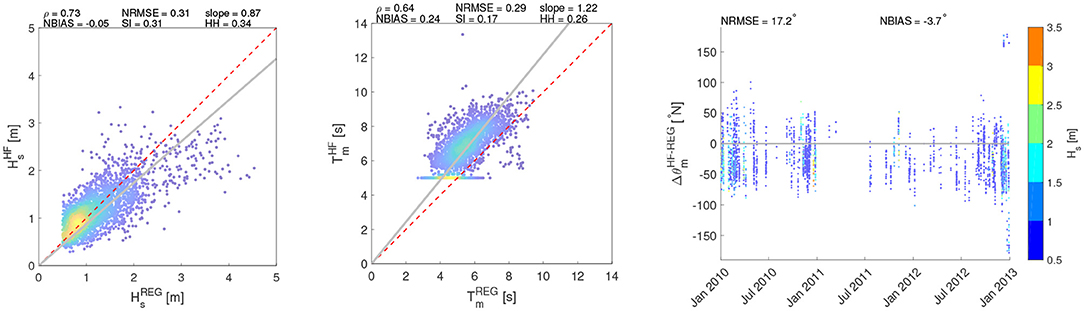
Figure 5. Comparison of wave parameters (Hs, T, θ) between HF radar and WWIII at PORT. The colors of the scatters (Hs, Tm) are scaled according to their frequency of occurrence. The θ colorbar is referred to the value of Hs.
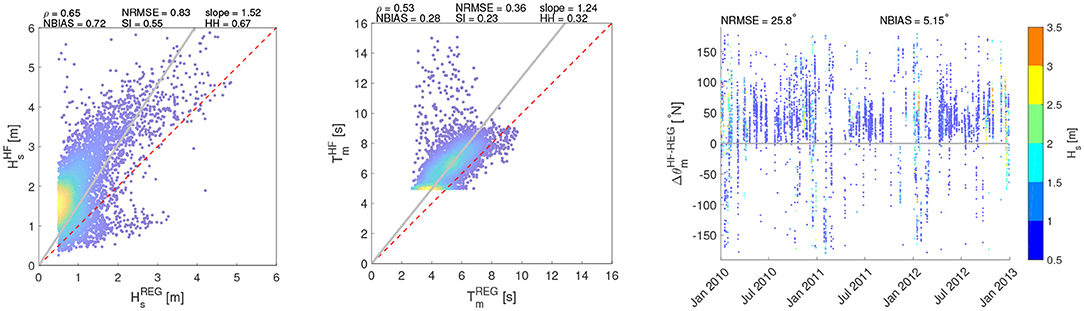
Figure 6. Comparison of wave parameters (Hs, T, θ) between HF radar and WWIII at SORR. The colors of the scatters (Hs, Tm) are scaled according to their frequency of occurrence. The θ colorbar is referred to the value of Hs.
Figures 7–9 show the comparison of the Hs time series of the HF stations with the simulations. At PORT location, downscaling the wave field over a high resolution grid leads to Hs values generally higher than those computed with the regional model, resulting in a general overestimation of the SWAN performance at this location. Furthermore, at CAST and SORR locations in some sea storm events an overestimation of HF acquisitions is recorded. Figures 10–12 show the scatter plots of wave parameters (Hs, T, θ) between the radar network acquisition and the simulations performed with SWAN. In PORT (Figure 10), the correlation ρ remains substantially unchanged, reaching values close to 0.70 for both comparisons. This implies that sea states characterized by similar relative intensities among the respective series occur at the same time. Nevertheless, results are more scattered with respect to the main bisector, in particular for the most intense sea states whose Hs are generally higher in the local model. This can be seen in the decreasing/increasing values of slope/NBIAS (from 0.87 to 0.70 and from −0.05 to −0.22 for the regional and local models, respectively). The overall increment of the sea state magnitudes leads to better comparisons for the local model mean periods, with lower values NBIAS (which changes from 0.24 to 0.17) and slope (from 1.22 to 1.13). The wave incoming directions also show a slightly increasing deviation with respect to those of the regional analysis, with the NBIAS index decreasing from −3.70 to −5.26. As for SORR (Figure 11), a direct comparison with the regional counterparts underlines how the local numerical model leads to a higher consistency with the HF radar wave measurements for all the parameters under investigation, with the error indices (NRMSE, NBIAS, SI, and HH) switching to lower values, while ρ increases from 0.65 to 0.71 and slope reaches a value closer to 1 (1.41 vs. 1.52 of the regional analysis). These considerations equally apply to T and θ. Finally, in CAST (Figure 12), results present a reasonable consistency for all the investigated parameters. As for SORR, the modeled Hs are slightly underestimated with respect to those sampled by the HF radars, though in this case the scatters are even closer (see, e.g., the positive NBIAS and slope, characterized by values close to 0.40 and 1.20). The period T is consistently caught by both platforms, with error (correlations) indexes almost equal to 0 (1). To better evaluate the Hs radar-model comparisons, the Hs scatter plots have additionally been calculated splitting the Hs range in three subranges: 0.5−2.0 m; 2.0−4.0 m; > 4.0 m (see Supplementary Material). The first subrange corresponds to the Hs values most frequently scored in the GoN, the second one to rough sea and storms, while the latter one to extreme, particularly severe cases. This was verified at yearly scale in Saviano et al. (2019) but also at pluriannual scale in a more recent work (Saviano et al., 2020). As a general outcome, the statistical descriptors are more robust in the range 0.5−2.0 m. PORT and SORR scored the lowest confidence with the model at Hs > 4.0 m, a result that could mirror the lower performance of HF radars at values beyond this critical value. For CAST the lowest confidence was found in the 2.0−4.0 m interval; this result is inconsistent with the other sites, and may be biased by a limited sensitivity of the radar due to infrastructural issues (see Supplementary Material).
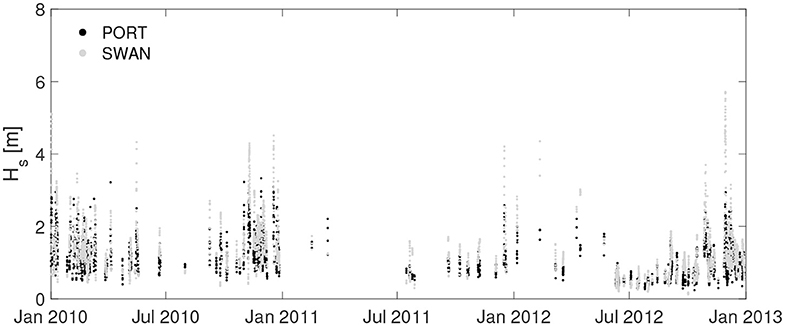
Figure 7. Time series comparison of wave height (Hs) between PORT and SWAN.
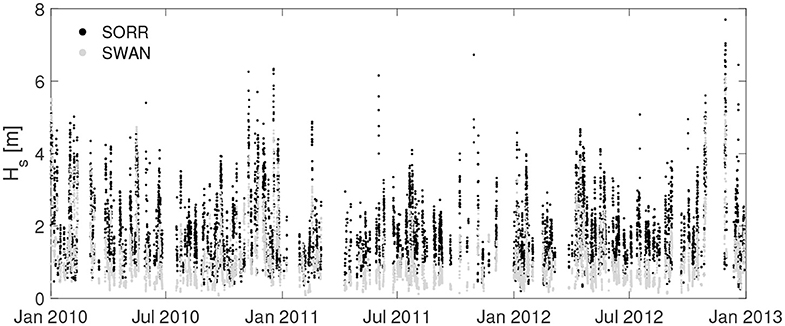
Figure 8. Time series comparison of wave height (Hs) between SORR and SWAN.
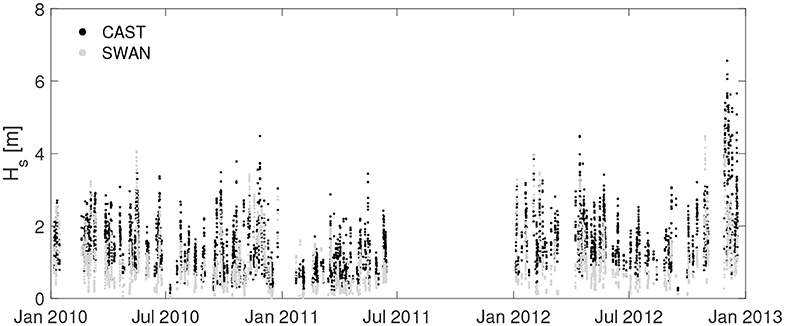
Figure 9. Time series comparison of wave height (Hs) between CAST and SWAN.
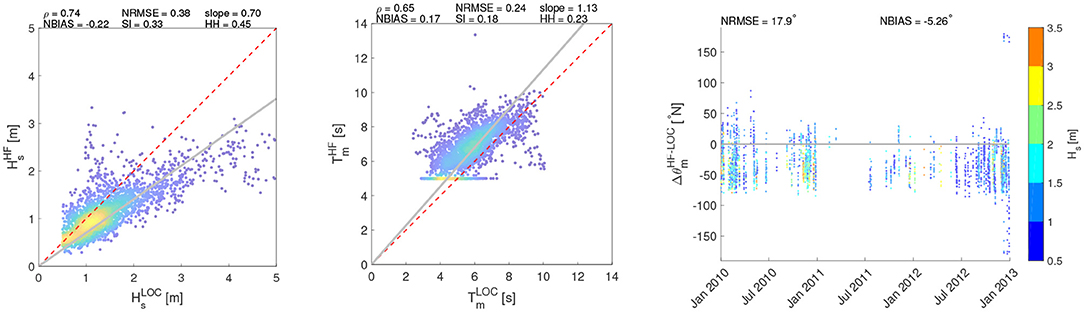
Figure 10. Comparison of wave parameters (Hs, T, θ) between HF radar and SWAN at PORT. The colors of the scatters (Hs, Tm) are scaled according to their frequency of occurrence. The θ colorbar is referred to the value of Hs.
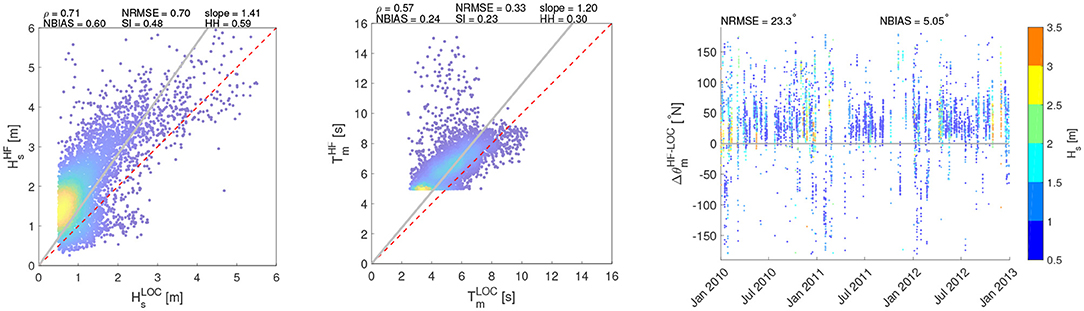
Figure 11. Comparison of wave parameters (Hs, T, θ) between HF radar and SWAN at SORR. The colors of the scatters (Hs, Tm) are scaled according to their frequency of occurrence. The θ colorbar is referred to the value of Hs.
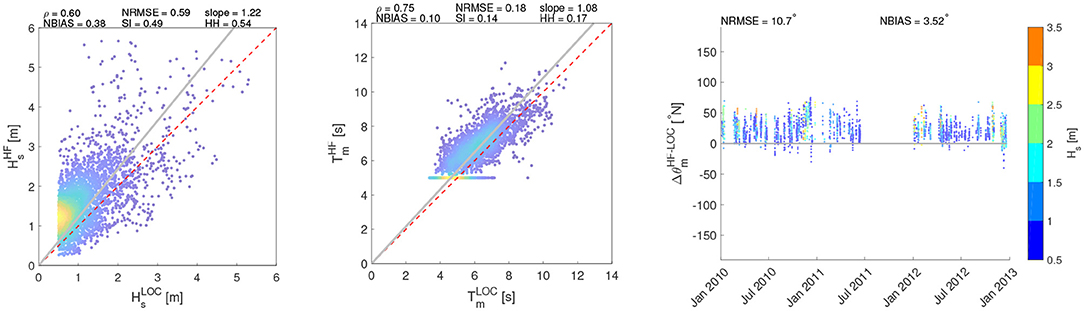
Figure 12. Comparison of wave parameters (Hs, T, θ) between HF radar and SWAN at CAST. The colors of the scatters (Hs, Tm) are scaled according to their frequency of occurrence. The θ colorbar is referred to the value of Hs.
A performance assessment of wave measurements was carried out for the GoN by comparing HF radar measurements and model data over a three-year period. A network of three HF radars was operational in the area of interest, providing hourly data of the main characteristics of the wave field. In a previous work (Saviano et al., 2019), a year-long assessment of HF radar derived wave measurements was qualitatively carried out by comparison with simultaneous recording of a not co-located buoy with low correlation mainly at PORT and CAST locations (0.61 and 0.58, respectively).
In the present work, the performance of the HF radars was further investigated by comparing wave measurements with model outputs over a 3-year period. The comparison between data at same location of HF radar and models improve the results obtained in the previous study. The numerical simulations were developed through two different models: (i) WWIII, used with a coarse resolution over the investigated area; and (ii) SWAN, used to downscale the information of WWIII over a finer resolution. Both models were validated through a direct comparison between their outcomes and data sampled by a wave buoy, moored at the edge of the GoN.
Results shown in Figure 2 proved how the regional model WWIII is able to provide reliable outcomes for Hs and Tm, while θm require further deepening. The same consideration can be reported for the SWAN simulations, developed by employing the regional wave information off Capri island and propagating them to the buoy site. In this case, different settings have been tested, varying the parameters most likely affecting the local analysis: the peakedness γ and the directional spreading θs, which rule the shape of the modeled wave spectra along the frequency and the wave directions, respectively.
The simulations linked to the trial sets showed that the results are not significantly affected by the selection of parameters (see Table 1 and Figure 3), resulting in sound comparisons in all cases. The reason is related with the features investigated: the mean parameters are in fact computed by integrating the 2D-spectrum in frequency and direction. The shape of the spectrum is not affecting its underlying area as much as it may actually do for single points referred to specific characteristics (i.e., the peak parameters), especially if the outcomes are not computed in very shallow waters.
The comparison between WWIII and HF radar measurements yields a statistical agreement at PORT (Figure 5), while at SORR the wave features of the two platforms show more significant deviations (Figure 6), although still being consistent. Previous studies on the comparison of mean wave direction and peak period show that the detected discrepancies are linked to lower sea states, where directional spectra can be contaminated by noise due to spurious features such as those associated with antenna side lobes, or to the sensitivity of these parameters to non-sea signals (i.e., interference or ships) in the radar backscatter (Wyatt et al., 2003; Lorente et al., 2018).
Looking at wave direction in SORR (Figure 6, right panel), the majority of θHF values is higher than , i.e. waves sampled by the HF radar are rotated to the East with respect to the model ones. This could be due to the coarse resolution of the WWIII grid, not allowing to efficiently resolve the refraction induced by the southern cape of the GoN for the waves coming from S-SW (see Figure 1B).
When zooming into the local model (SWAN), the comparisons between the measured and the modeled waves lead to an improvement in SORR (Figure 11). In WWIII, the wind growth effect modeled over the wide GoN may have led to over-estimated intensities in the wave magnitude, resulting in more scattered comparisons especially for the Hs parameter (see Figure 10, right panel). On the contrary, in SWAN the higher resolution of the computational grid allows to better resolve the refraction of SW/NE waves around the cape of the basin.
The results from CAST are consistent with those recorded for the other two sites. In this case, however, no comparison is possible with hindcast data, as this sub-basin is not covered by WWIII.
The additional comparisons of the Hs retrieved by the radars and by SWAN over three Hs ranges (0.5–2.0, 2.0–4.0, and > 4.0 m, in Supplementary Material) sheds additional light on “windows of confidence” in the evaluation of the agreement between the two platforms. Generally speaking, the correlation between the radars and SWAN is higher at lower Hs, but drops as Hs increases. This indicates that, on a general basis, the comparison between the two platforms is robust over the ranges of Hs most frequently encountered in the GoN, while some flaws emerge in the case of extreme waves. The analysis of this outcome points to different plausible mechanisms leading to such discrepancies. From the radar point of view, a crucial issue is represented by the discontinuity in functioning (Wyatt et al., 1999), requiring advances in background theory (Wyatt, 2011) and in software implementation for wave retrieval (Lopez et al., 2016). The lower bound set by waves with Hs = 0.5 m does not seem to impair HF radar efficiency in comparison to wave models. More critical seems to be the detectability of waves above 4.0 m. Although previous studies from the GoN show a consistent pattern between the radars and the buoy in harsh conditions (Saviano et al., 2019), further investigations will be needed to assess if the Hs overestimation is explained by the inversion method used, currently based on an ideal Pierson-Moskovitz spectrum. This is sufficiently sound to describe unimodal energy spectra from fully developed seas, though future implementations of the proprietary software will be capable of handling bimodal distributions as well (Lipa et al., 2018). Promising improvements along this line are also provided by the development of modified inversion methods (Lopez and Conley, 2019) and by the use of neural networks (Hardman and Wyatt, 2019). In addition, a re-processing of the HF radar data with new releases of the proprietary software may return more consistent results, as discussed in Basañez et al. (2020).
From the model perspective, it should be considered that both WWIII and SWAN have been validated using the PC buoy, located outside the coverage area of the radars and working at a lower frequency compared to the HF radars. It might be possible that the models performance could be affected by spatial variability, reducing the validity of models in the coastal area. Further validations will be performed when in situ data from coastal buoy will be available for the GoN. The wave field in the shadow zone behind the island of Capri may be more difficult to resolve, because of the complex morphology of the coastline. Some of the deviations for modeled low sea states associated with high sea states sampled by the radars could therefore be explained by looking at their positions along the coastline, with respect to S-SW incoming waves. The problems related to complex morphological features of the GoN were underlined also by Inghilesi et al. (2016), using both WAM and SWAN models. The results also indirectly show coherent values for the wave features modeled by WWIII and SWAN, even if the simulations were produced with different approaches (i.e., time-spatial regression for the regional analysis, physical wave propagation for the local analysis). Similarities in the modeled fields are expected, because the bottom depths corresponding to these RCs are deep enough for the large waves not to be dramatically affected by the bathymetry of the area, i.e. the sea is almost 100-m deep at both PORT and SORR.
In the present work the comparison between HF radars and wave models was carried out exclusively on RC5. This procedure was justified considering previous results carried out in the GoN (Falco et al., 2016; Saviano et al., 2019, 2020; De Leo et al., 2020) showing that RC5 guaranteed the optimal balance between data retrieval (minimum data gaps) and distance from the coast (sufficient echo intensity, deep water conditions). Moreover, this RC can be used as a robust estimator of the wave filed dynamics developing in the farthest RCs (Saviano et al., 2019). Future implementations will include the analysis of any potential variability in the wave field by performing radar-model comparisons on a larger number of RCs. Further investigations are in progress using satellite altimetry data and buoys recently deployed inside the zone covered by the radars to be able to understand and solve the shortcomings in the comparison. The datasets of the different platforms employed in this study (PC buoy, HF radars and model simulations) are coherent with the wave climate of the Tyrrhenian Sea and with the different dynamics taking place in both the internal and external parts of the GoN (Benassai et al., 1994a,b; Buonocore et al., 2003; Falco et al., 2016; Morucci et al., 2016; Saviano et al., 2019).
It is worth mentioning that the performance of HF radars is limited by numerous sources of error (e.g., environmental noise, interpretation methods, basin structure; Laws et al., 2010). Nevertheless, the results presented here suggest that the HF radar wave measurements are reasonable and reliable at least as a first approximation of the sea state. However, it is necessary to implement new algorithms to broaden the range of wave parameters observed by HF radars. Moreover, the possibility of integrating HF radar data into wave models (Caires and Wyatt, 2003; Siddons et al., 2009; Waters et al., 2013) can be a useful tool for optimizing the initial conditions of a model and therefore improving the accuracy of its estimates. Some assimilation schemes with WWIII, SWAN and WAM are proposed in literature (Caires and Wyatt, 2003; Siddons et al., 2009; Waters et al., 2013), and currently represent a promising scientific perspective for the near future.
A 3-year (2010–2012) characterization of the wave height, period and direction in the GoN was carried out by comparing HF radar derived wave parameters with WWIII and SWAN model predictions. The comparison allowed a characterization of the range of wave variations in the region, adding value to the HF radar wave estimates. Results demonstrate that HF radars might be employed as remote sensing tools to retrieve wave parameters in coastal areas, even though the signal should be further analyzed and possibly validated against wave measures provided by other devices; equally, skill metrics indicate that WWIII and SWAN performances were consistent with a wide range of sea states. These results show that in coastal areas a synergistic observational and modeling approach can provide a complete characterization of the wave conditions suggesting possibilities to expand the wave monitoring networks.
The datasets generated for this study are available on request to the corresponding author.
SS, FD, MU, and GB: methodology and writing review and editing. FD and SS: software, validation, and data curation. GB, MU, and EZ: project administration. All authors contributed to the article and approved the submitted version.
This work was funded by the Flagship Project RITMARE (The Italian Research for the Sea) coordinated by the Italian National Research Council and funded by the Italian Ministry of Education, University and Research within the National Research Program 2011–2013 and the AQUILA project (Parthenope University internal grant) (CUP:I63C17000060005). EZ was partly supported by the Parthenope University internal individual research grant. MU was supported by an internal SZN grant. This work was partly supported by DORA—Deployable Optics for Remote sensing Applications DORA (ARS01-00653), a project funded by MIUR—PON Research and Innovation/PNR 2015–2020.
The authors declare that the research was conducted in the absence of any commercial or financial relationships that could be construed as a potential conflict of interest.
The Department of Science and Technology (formerly the Department of Environmental Sciences) of the Parthenope University of Naples operates the HF radar system on behalf of the AMRA consortium (formerly CRdC AMRA), a regional competence center for the analysis and monitoring of environmental risks. Our radar remote sites are hosted by the ENEA Centre of Portici, the Villa Angelina Village of High Education and Professional Training and La Villanella resort in Massa Lubrense, and the Fincantieri shipyard in Castellammare di Stabia, whose hospitality is gratefully acknowledged. The authors gratefully acknowledge the Civil Protection Department of the Campania Region for providing buoy data, the Port Authority of Capri Island for general information on the installation of the PC wave buoy, and the CAE company for providing technical information on sensors installed on the PC wave buoy. The authors would also like to thank the Reparto Geofisica Marina e Oceanografia of the Istituto Idrografico della Marina (IIM) for providing us with high resolution bathymetry employed for the numerical simulations in the GoN. Mention of trade names or commercial products does not constitute endorsement or recommandation. The authors thank the editor and the Reviewers for constructive feedback.
The Supplementary Material for this article can be found online at: https://www.frontiersin.org/articles/10.3389/fmars.2020.00492/full#supplementary-material
Armiento, G., Caprioli, R., Cerbone, A., Chiavarini, S., Crovato, C., Cassan, M. D., et al. (2020). Current status of coastal sediments contamination in the former industrial area of Bagnoli-Coroglio (Naples, Italy). Chem. Ecol. 36, 579–597. doi: 10.1080/02757540.2020.1747448
Atan, R., Goggins, J., Harnett, M., Agostinho, P., and Nash, S. (2016). Assessment of wave characteristics and resource variability at a 1/4-scale wave energy test site in Galway Bay using waverider and high frequency radar (CODAR) data. Ocean Eng. 117, 272–291. doi: 10.1016/j.oceaneng.2016.03.051
Aucelli, P. P. C., Mattei, G., Caporizzo, C., Cinque, A., Troisi, S., Peluso, F., et al. (2020). Ancient coastal changes due to ground movements and human interventions in the roman Portus Julius (Pozzuoli Gulf, Italy): results from photogrammetric and direct surveys. Water 12:658. doi: 10.3390/w12030658
Bagaglini, L., Falco, P., and Zambianchi, E. (2020). Eddy detection in HF radar-derived surface currents in the Gulf of Naples. Remote Sens. 12:97. doi: 10.3390/rs12010097
Barrick, D. E. (1977). The ocean waveheight nondirectional spectrum from inversion of the HF sea-echo Doppler spectrum. Remote Sens. Environ. 6, 201–227. doi: 10.1016/0034-4257(77)90004-9
Barrick, D. E. (1979). A coastal radar system for tsunami warning. Remote Sens. Environ. 8, 353–358. doi: 10.1016/0034-4257(79)90034-8
Basañez, A., Lorente, P., Montero, P., Alvarez Fanjul, E., and Pérez-Muñuzuri, V. (2020). Quality assessment and practical interpretation of the wave parameters estimated by HF radars in NW Spain. Detection in radar-derived surface currents in the gulf of Naples. Remote Sens. 12:598. doi: 10.3390/rs12040598
Benassai, G., de Maio, A., Mainolfi, R., and Sansone, E. (1994a). Previsione Delle Onde Estreme e Persistenza Delle Mareggiate nel Golfo di Napoli. Annali Istituto Universitario Navale, 47–60.
Benassai, G., de Maio, A., and Sansone, E. (1994b). Altezze e Periodi Delle Onde Significative nel Golfo di Napoli da Aprile 1986 al Giugno 1987. Annali Istituto Universitario Navale, 3–9.
Booij, N., Ris, R. C., and Holthuijsen, L. H. (1999). A third-generation wave model for coastal regions: 1. model description and validation. J. Geophys. Res. 104, 7649–7666. doi: 10.1029/98JC02622
Buonocore, B., Sansone, E., and Zambardino, G. (2003). Rilievi Ondametrici nel Golfo di Napoli. Annali Istituto Universitario Navale, 203–211.
Caires, S., and Wyatt, L. R. (2003). A linear functional relationship model for circular data with an application to the assessment of ocean wave measurements. J. Agric. Biol. Environ. Stat. 8:153. doi: 10.1198/1085711031571
Capodici, F., Cosoli, S., Ciraolo, G., Nasello, C., Maltese, A., Poulain, P.-M., et al. (2019). Validation of HF radar sea surface currents in the Malta-Sicily Channel. Remote Sens. Environ. 225, 65–76. doi: 10.1016/j.rse.2019.02.026
Cassola, F., Ferrari, F., Mazzino, A., and Miglietta, M. (2016). The role of the sea on the flash floods events over Liguria (northwestern Italy). Geophys. Res. Lett. 43, 3534–3542. doi: 10.1002/2016GL068265
Cianelli, D., D'Alelio, D., Uttieri, M., Sarno, D., Zingone, A., Zambianchi, E., et al. (2017). Disentangling physical and biological drivers of phytoplankton dynamics in a coastal system. Sci. Rep. 7:15868. doi: 10.1038/s41598-017-15880-x
Cianelli, D., Falco, P., Iermano, I., Mozzillo, P., Uttieri, M., Buonocore, B., et al. (2015). Inshore/offshore water exchange in the Gulf of Naples. J. Mar. Syst. 145, 37–52. doi: 10.1016/j.jmarsys.2015.01.002
Cianelli, D., Uttieri, M., Buonocore, B., Falco, P., Zambardino, G., and Zambianchi, E. (2012). “Dynamics of a very special Mediterranean coastal area: the Gulf of Naples,” in Mediterranean Ecosystems: Dynamics, Management and Conservation, ed G. Williams (New York, NY: Nova Science Publishers), 129–150.
Crombie, D. (1955). Doppler spectrum of sea echo at 13.56 mc/s. Nature 175, 681–682. doi: 10.1038/175681a0
De Leo, F., Besio, G., Saviano, S., Zambianchi, E., and Uttieri, M. (2020). “Evaluation of HF-radar wave measures in the Gulf of Naples,” in IMEKO TC19 International Workshop on Metrology for the Sea: Learning to Measure Sea Health Parameters, MetroSea 2019 (Genova).
Falco, P., Buonocore, B., Cianelli, D., Luca, L. D., Giordano, A., Iermano, I., et al. (2016). Dynamics and sea state in the Gulf of Naples: potential use of high-frequency radar data in an operational oceanographic context. J. Oper. Oceanogr. 9(Suppl. 1), S33–S45. doi: 10.1080/1755876X.2015.1115633
Ferrigno, F., Appolloni, L., Russo, G. F., and Sandulli, R. (2018). Impact of fishing activities on different coralligenous assemblages of gulf of Naples (Italy). J. Mar. Biol. Assoc. U.K. 98, 41–50. doi: 10.1017/S0025315417001096
Gelpi, C., and Norris, K. (2003). Estimated surface-wave contributions to radar Doppler velocity measurements of the ocean surface. Remote Sens. Environ. 87, 99–110. doi: 10.1016/S0034-4257(03)00177-9
Gurgel, K., Essen, H., and Schlick, T. (2006). An empirical method to derive ocean waves from second-order Bragg scattering: prospects and limitations. IEEE J. Oceananogr. Eng. 31, 804–811. doi: 10.1109/JOE.2006.886225
Gurgel, K.-W., and Schlick, T. (2005). HF radar wave measurements in the presence of ship echoes - problems and solutions. Eur. Oceans. 2, 937–941. doi: 10.1109/OCEANSE.2005.1513182
Hanna, S., and Heinold, D. (1985). Development and Application of a Simple Method for Evaluating Air Quality. Technical report, American Petroleum Institute, Health and Environmental Affairs Department.
Hardman, R. L., and Wyatt, L. R. (2019). Inversion of HF radar Doppler spectra using a neural network. J. Mar. Sci. Eng. 8:255. doi: 10.3390/jmse7080255
Hasselmann, K., Barnett, T. P., Bouws, E., Carlson, H., Cartwright, D. E., Eake, K., et al. (1973). Measurements of wind-wave growth and swell decay during the Joint North Sea Wave Project (JONSWAP). Ergnzungsheft zur Deutschen Hydrographischen Zeitschrift Reihe 8:95.
Iermano, I., Moore, A., and Zambianchi, E. (2016). Impacts of a 4-dimensional variational data assimilation in a coastal ocean model of southern Tyrrhenian Sea. J. Mar. Syst. 154, 157–171. doi: 10.1016/j.jmarsys.2015.09.006
Inghilesi, R., Orasi, A., and Catini, F. (2016). The ISPRA Mediterranean coastal wave forecasting system: evaluation and perspectives. J. Oper. Oceanogr. 9(Suppl. 1), S89–S98. doi: 10.1080/1755876X.2015.1115635
Kalampokis, A., Uttieri, M., Poulain, P., and Zambianchi, E. (2016). Validation of HF radar-derived currents in the Gulf of Naples with lagrangian data. IEEE Geosci. Remote Sens. Lett. 13, 1452–1456. doi: 10.1109/LGRS.2016.2591258
Komen, G., Cavaleri, L., Donelan, M., Hasselmann, K., Hasselmann, S., and Janssen, L. (1994). Dynamics and Modelling of Ocean Waves. Cambridge: Cambridge University Press. doi: 10.1017/CBO9780511628955
Laws, K., Paduan, J. D., and Vesecky, J. (2010). Estimation and assessment of errors related to antenna pattern distortion in CODAR SeaSonde high-frequency radar ocean current measurements. J. Atmos. Ocean. Technol. 27, 1029–1043. doi: 10.1175/2009JTECHO658.1
Lipa, B., Daugharty, M., Fernandes, M., Barrick, D., Alonso-Martinera, A., Roarty, H., et al. (2018). “Developments in compact HF-radar ocean wave measurement,” in Advances in sensors: Reviews, Vol. 5, ed S. Y. Yurish (Barcelona: IFSA Publishing), 469–495.
Lipa, B., and Nyden, B. (2005). Directional wave information from SeaSonde. IEEE J. Ocean. Eng. 30, 221–231. doi: 10.1109/JOE.2004.839929
Lopez, G., and Conley, D. C. (2019). Comparison of HF radar fields of directional wave spectra against in situ measurements at multiple locations. J. Mar. Sci. Eng. 8:271. doi: 10.3390/jmse7080271
Lopez, G., Conley, D. C., and Greaves, D. (2016). Calibration, validation, and analysis of an empirical algorithm for the retrieval of wave spectra from HF Radar Sea echo. J. Atmos. Ocean. Technol. 33, 245–261. doi: 10.1175/JTECH-D-15-0159.1
Lorente, P., Mercader, A. B., Piedracoba, S., Pérez-Muñuzuri, V., Montero, P., Sotillo, M., et al. (2019). Long-term skill assessment of SeaSonde radar-derived wave parameters in the Galician coast (NW Spain). Int. J. Remote Sens. 40, 1–29. doi: 10.1080/01431161.2019.1629714
Lorente, P., Sotillo, M. G., Aouf, L., Amo-Baladrón, A., Barrera, E., Dalphinet, A., et al. (2018). Extreme wave height events in NW Spain: a combined multi-sensor and model approach. Remote Sens. 10:1. doi: 10.3390/rs10010001
Margiotta, F., Balestra, C., Buondonno, A., Casotti, R., D'Ambra, I., Capua], I. D., et al. (2020). Do plankton reflect the environmental quality status? The case of a post-industrial Mediterranean bay. Mar. Environ. Res. 160:104980. doi: 10.1016/j.marenvres.2020.104980
Menna, M., Mercatini, A., Uttieri, M., Buonocore, B., and Zambianchi, E. (2007). Wintertime transport processes in the Gulf of Naples investigated by HF radar measurements of surface currents. Nuovo Cimento C 30, 605–622. doi: 10.1393/ncc/i2008-10270-0
Mentaschi, L., Besio, G., Cassola, F., and Mazzino, A. (2013a). Developing and validating a forecast/hindcast system for the Mediterranean Sea. J. Coast. Res. 65, 1551–1556. doi: 10.2112/SI65-262.1
Mentaschi, L., Besio, G., Cassola, F., and Mazzino, A. (2013b). Problems in RMSE-based wave model validations. Ocean Modell. 72, 53–58. doi: 10.1016/j.ocemod.2013.08.003
Mentaschi, L., Besio, G., Cassola, F., and Mazzino, A. (2015). Performance evaluation of WavewatchIII in the Mediterranean Sea. Ocean Modell. 90, 82–94. doi: 10.1016/j.ocemod.2015.04.003
Morucci, S., Picone, M., Nardone, G., and Arena, G. (2016). Tides and waves in the Central Mediterranean Sea. J. Oper. Oceanogr. 9(Suppl. 1), S10–S17. doi: 10.1080/1755876X.2015.1120960
Orasi, A., Picone, M., Drago, A., Capodici, F., Gauci, A., Nardone, G., et al. (2018). HF radar for wind waves measurements in the Malta-Sicily Channel. Measurement 128, 446–454. doi: 10.1016/j.measurement.2018.06.060
Paduan, J., and Rosenfeld, L. (1996). Remotely sensed surface currents in Monterey Bay from shore-based HF radar (Ocean Dynamics Application Radar). J. Geophys. Res. 20669–20686. doi: 10.1029/96JC01663
Paduan, J. D., and Graber, H. C. (1997). Introduction to high-frequency radar: reality and myth. Oceanography 10, 36–39. doi: 10.5670/oceanog.1997.18
Perez, J., Menendez, M., and Losada, I. J. (2017). GOW2: A global wave hindcast for coastal applications. Coast. Eng. 124, 1–11. doi: 10.1016/j.coastaleng.2017.03.005
Pugliese Carratelli, E., and Sansone, E. (1987). Rilievi Ondametrici nel Golfo di Napoli. Annali Istituto Universitario Navale, 87–97.
Ranalli, M., Lagona, F., Picone, M., and Zambianchi, E. (2018). Segmentation of sea current fields by cylindrical hidden Markov models: a composite likelihood approach. J. R. Stat. Soc. 67, 575–598. doi: 10.1111/rssc.12240
Rubio, A., Mader, J., Corgnati, L., Mantovani, C., Griffa, A., Novellino, A., et al. (2017). HF radar activity in European Coastal Seas: next steps toward a Pan-European HF radar network. Front. Mar. Sci. 4:8. doi: 10.3389/fmars.2017.00008
Saviano, S., Cianelli, D., Zambianchi, E., Conversano, F., and Uttieri, M. (2020). An integrated reconstruction of the multiannual wave pattern in the Gulf of Naples (South-Eastern Tyrrhenian Sea, Western Mediterranean Sea). J. Mar. Sci. Eng. 8, 372.
Saviano, S., Kalampokis, A., Zambianchi, E., and Uttieri, M. (2019). A year-long assessment of wave measurements retrieved from an HF radar network in the Gulf of Naples (Tyrrhenian Sea, Western Mediterranean Sea). J. Oper. Oceanogr. 12, 1–15. doi: 10.1080/1755876X.2019.1565853
Sciascia, R., Berta, M., Carlson, D. F., Griffa, A., Panfili, M., La Mesa, M., et al. (2018). Linking sardine recruitment in coastal areas to ocean currents using surface drifters and HF radar: a case study in the Gulf of Manfredonia, Adriatic Sea. Ocean Sci. 14, 1461–1482. doi: 10.5194/os-14-1461-2018
Siddons, L., Wyatt, L., and Wolf, J. (2009). Assimilation of HF radar data into the SWAN wave model. J. Mar. Syst. 77, 312–324. doi: 10.1016/j.jmarsys.2007.12.017
Skamarock, W., Klemp, J., Dudhia, J., Gill, D., Barker, D., Wang, W., et al. (2008). A Description of the Advanced Research WRF Version 3. Technical report, NCAR.
Taylor, K. E. (2001). Summarizing multiple aspects of model performance in a single diagram. J. Geophys. Res. 106, 7183–7192. doi: 10.1029/2000JD900719
Terrile, E., De Filippi, G., and Spadaccini, O. (2012). Wave statistics and spectral monitoring in the Mediterranean Sea (i.e. Sicily Channel): 9 years of wave data monitoring. Coast. Eng. Proc. 1:3. doi: 10.9753/icce.v33.posters.3
Tolman, H. (1989). The Numerical Model WAVEWATCH: A Third Generation Model for the Hindcasting of Wind Waves on Tides in Shelf Seas. Technical Report Rep. no. 89-2, Delft Univ. of Techn. 72. doi: 10.1061/9780872626874.037
Tolman, H., and Chalikov, D. (1996). Source terms in a third-generation wind wave model. J. Phys. Oceanogr. 26, 2497–2518. doi: 10.1175/1520-0485(1996)026<2497:STIATG>2.0.CO;2
Tolman, H. L. (2009). User manual and system documentation of WAVEWATCH III, version 3.14. Technical note, MMAB Contribution, 276:220.
Uttieri, M., Cianelli, D., Nardelli, B. B., Buonocore, B., Falco, P., Colella, S., et al. (2011). Multiplatform observation of the surface circulation in the Gulf of Naples (Southern Tyrrhenian Sea). Ocean Dyn. 61, 779–796. doi: 10.1007/s10236-011-0401-z
Waters, J., Wyatt, L. R., Wolf, J., and Hines, A. (2013). Data assimilation of partitioned HF radar wave data into Wavewatch III. Ocean Modell. 72, 17–31. doi: 10.1016/j.ocemod.2013.07.003
Wyatt, L. (2011). Wave Mapping With HF Radar. IEEE/OES - Current, Waves and Turbulence Measurements (CWTM), 25-30. doi: 10.1109/CWTM.2011.5759519
Wyatt, L., Green, J., Gurgel, K.-W., Borge, J. N., Reichert, K., Hessner, K., et al. (2003). Validation and intercomparisons of wave measurements and models during the EuroROSE experiments. Coast. Eng. 48, 1–28. doi: 10.1016/S0378-3839(02)00157-6
Wyatt, L., Thompson, S., and Burton, R. (1999). Evaluation of high frequency radar wave measurement. Coastal Eng. 37, 259–282. doi: 10.1016/S0378-3839(99)00029-0
Keywords: HF coastal radar, wave downscaling, wave hindcast, Gulf of Naples, CODAR SeaSonde
Citation: Saviano S, De Leo F, Besio G, Zambianchi E and Uttieri M (2020) HF Radar Measurements of Surface Waves in the Gulf of Naples (Southeastern Tyrrhenian Sea): Comparison With Hindcast Results at Different Scales. Front. Mar. Sci. 7:492. doi: 10.3389/fmars.2020.00492
Received: 31 July 2019; Accepted: 02 June 2020;
Published: 10 July 2020.
Edited by:
Gilles Reverdin, Centre National de la Recherche Scientifique (CNRS), FranceReviewed by:
Charles-Antoine Guerin, Université de Toulon, FranceCopyright © 2020 Saviano, De Leo, Besio, Zambianchi and Uttieri. This is an open-access article distributed under the terms of the Creative Commons Attribution License (CC BY). The use, distribution or reproduction in other forums is permitted, provided the original author(s) and the copyright owner(s) are credited and that the original publication in this journal is cited, in accordance with accepted academic practice. No use, distribution or reproduction is permitted which does not comply with these terms.
*Correspondence: Simona Saviano, c2ltb25hLnNhdmlhbm9AdW5pcGFydGhlbm9wZS5pdA==
†These authors have contributed equally to this work
Disclaimer: All claims expressed in this article are solely those of the authors and do not necessarily represent those of their affiliated organizations, or those of the publisher, the editors and the reviewers. Any product that may be evaluated in this article or claim that may be made by its manufacturer is not guaranteed or endorsed by the publisher.
Research integrity at Frontiers
Learn more about the work of our research integrity team to safeguard the quality of each article we publish.